Abstract
In this study, we investigated the physical factors required to accurately reproduce the Milky Way in star fields in a planetarium using three evaluation indices: faithfulness, preference, and depth feeling. Psychometric experiments were conducted by manipulating three different physical factors (transmittance, representation size and star density) of the stars projected on a dome screen as experimental stimuli. The three evaluation indices were rated by observers for 12 different reproductions of the Milky Way. By analyzing the experimental results, we developed a common model to estimate the scores for each evaluation index by changing the coefficients of the three physical factors. Our proposed model has good accuracy, and each evaluation index can be represented by transmittance, representation size and star density. The weighting values indicate that density reproduction was the pivotal factor for the majority of observers. In contrast, the observers were not affected by the size of the stars in the projected Milky Way.
1. Introduction
Ever since the development of lighting technology, aimed at achieving a comfortable living environment at night, a sky full of stars has become a precious and rare sigh. Bright nights cause light pollution [1,2], limiting the visible stars in the night sky to bright stars such as stars with small apparent magnitude. In this study, we focus on the Milky Way. The Milky Way is a mass of innumerable stars. The light we receive from most stars is weaker than that of the bright stars. However, this light can still be seen as a thin cloud in the night sky because the light of all the stars is combined. In particular, the stars in the area around the Scorpius and Sagittarius constellations are more evident than those in other areas. Therefore, under suitable conditions (a very dark night without light pollution and moonlight, no clouds, etc.), it is easy to see the Milky Way in the summer season. However, in urban areas, the opportunity to observe the Milky Way is rare because of the bright night sky. To address this issue, planetariums worldwide have been working to artificially reproduce a starry sky using image reproduction systems [3]. In fields such as astronomy education and entertainment, planetariums have played a crucial role in communicating the majesty of the universe to the general public.
Some studies have reported methods for observing and acquiring starlit sky images [4]. There have also been reports on the use of computer-graphics (CG) reproduction methods to generate displays [5,6]. However, there has been insufficient discussion of the appropriate methods for reproducing astral images and the use of such methods in a planetarium that seeks to reproduce the starry sky. Among those that do address this subject, previous studies have investigated the relationship between the physical representation factors in a planetarium as well as the perceptual assessment of faithfulness and preference for the represented stars by conducting psychometric experiments in a real planetarium dome [7,8]. However, the target stars in previous studies were restricted to bright stars of small magnitude (from zero to seven), without considering fainter stars and objects (such as the Milky Way and nebulas), to investigate the effects of color, brightness, and size reproduction.
In psychometric experiments [7,8], bright target stars were projected in a completely planar dark sky, which is an unlikely condition in the actual star field. The star field we observe in reality has nonuniform luminance owing to the presence of fainter stars, clouds, zodiacal light, and light pollution. In the planetarium industry, it is well known that adding natural light is essential for faithfully reproducing a star field that conveys a sense of the depth of the universe; however, the best reproduction methods have yet to be determined.
Accurate reproduction of the Milky Way is particularly important because it has a fixed position in the sky and attracts attention as a beautiful element of the starry sky. From a scientific perspective, even though the individual stars of the Milky Way are dim, they can be perceived as a “visible mass”, forming a “dense cluster”. Although several studies have reported contrast perception [9] and density perception in relation to texture [10], we found no relevant studies regarding the perception of a group of illuminated point lights in scotopic vision. In a planetarium, people observe projected point light sources on a dome screen that mimics a star in scotopic vision. Because the physically same reproduction of stars is impossible, it is important to perceptually reproduce a starfield properly and not physically. In addition, there is no research on the best method to faithfully reproduce the Milky Way. Therefore, how to mimic the star field and represent a starry sky more faithfully, including fainter stars in the Milky Way, is a prevailing problem in planetarium research. Moreover, techniques for rendering the Milky Way that consider the characteristics of human perception have not been reported in the field of imaging science and technology.
In this study, we investigate the relationship between the reproduction method and assessments of the faithfulness, preference, and depth of the reproduced Milky Way by conducting a psychometric experiment in a planetarium with human observers.
2. Experiment
In this experiment, we considered the factors influencing the successful reproduction of a starry sky with the Milky Way and nebulas, by evaluating three indices (faithfulness, preference, and depth feeling) relating to the images reproduced in planetarium projections by individually altering three parameters (transmittance, representation size and star density) of individual stars.
2.1. Reproduction Apparatus
There are two types of projection systems that produce images in a planetarium: optical and digital. Owing to the resolution and color tone limitations of digital projectors, it is difficult to reproduce a detailed Milky Way with sufficient resolution to evaluate image faithfulness. Therefore, in our experiment, a planetarium with an optical system using star plates was used to reproduce fixed stars, nebulas, and the Milky Way, as shown in Figure 1. Stars were projected on the dome screen by passing light through the star plates installed in the projector. The direct luminance of the stars was adjusted by inserting transmission filters in front of the light sources. The representation size and star density were controlled by the diameter of the hole and the number of stars in the star plates, respectively. Therefore, we defined the three parameters (transmittance, representation size and star density) of individual stars.
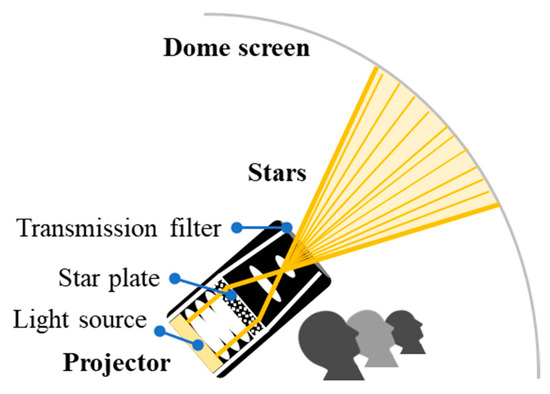
Figure 1.
Mechanism of optical projection.
2.2. Experimental Stimulus
We selected stars around Scorpius (constituting 1/32 of the night sky) as experimental stimuli because the area around Scorpius has more stars and thus, presents a brighter segment of the Milky Way than other areas. Therefore, the area around Scorpius is a suitable star field to assess the reproduction of the Milky Way, as it ensures that observers can detect a difference when the reproduction pattern changes. For the faithful reproduction of a starry sky, including the Milky Way, we considered the astrophysical factors in the real environment, such as the brightness of the surrounding environment, effect of light pollution, and gradation by zenith angle. The twinkling of stars is caused by atmospheric extinction [11]. However, we excluded external factors such as atmospheric extinction in this experiment after determining that it was better to display a temporally stable star image. Therefore, the twinkling of stars was not included to prevent observers from paying attention to the twinkling star, instead of the Milky Way. In addition, it was necessary to eliminate the influence of sunlight reflected within the solar system (zodiacal light) on the perception of stars and that of air and air lights from the Earth’s atmosphere (light pollution), to avoid distracting the observers. The experiments were conducted in complete darkness to reproduce an environment of scotopic vision, which is typical of a general planetarium environment.
We prepared 12 types of experimental patterns by changing the transmittance, representation size and star density of the star image. Table 1 lists the projection patterns used as experimental stimuli. As explained previously, we assumed that the transmittance, representation size and star density in the Milky Way influenced the evaluation of the star image reproduced in the planetarium. Therefore, we first determined a standard pattern (Std), following the procedure described in Section 2.2.1. This pattern ensures perceptual faithfulness to the real starry sky. Second, we prepared additional patterns in which an individual parameter or a combination of parameters had been changed. We provide a detailed explanation of each pattern in the following subsections.

Table 1.
List of experimental projection patterns.
2.2.1. Standard Pattern
For a reproduction faithful to astronomical observations in real life, it is ideal to reproduce actual physical factors such as star color, tone, size, and depth. For example, it might be possible to make star fields physically identical to the appearance of the night sky if we can prepare light sources of infinitesimal size with several color temperatures and high dynamic range (HDR) light-emitting performances and project them onto an infinitely large dome. However, such a reproduction of star images is impossible. This is because the planetarium has limited resources to manipulate the light source, construction design, dome size, and optical performance of the projector. Therefore, we first determined which projection conditions could reproduce star images that were perceptually the same as the real starry sky in a planetarium. The color and luminance of individual stars in the reproduced standard pattern were designed to provide a perception of major stars equivalent to that obtained from the actual starry sky, as determined by five experienced observers. All observers were male, with an average age of 50 years and abundant experience in astronomical observation. The observers memorized the transmittance, representation size and star density of actual stars through real astronomical observations from a Japanese mountain under the conditions of a non-light-polluted, clear sky. The standard experimental pattern was then determined by memory matching with various star images whose transmittance, representation size and star density had been changed. Memory matching was selected because of the difficulty of a side-by-side comparison of the reproduced images with the actual starry sky. The luminance of the projections of the stars onto the dome screen was measured using a spectroradiometer (CS-2000, Konica Minolta). Since the size of one star in the Milky Way was too small to measure, we set up a larger star of 4′ viewing angle with the same luminance. The size of the star was still smaller than the measurement angle of the spectroradiometer, we set it closer to the reflected light (star) on the dome screen, and the luminance of the size of one star was properly measured. At this time, the projector was set off the center of the dome, so we could measure perpendicular to the surface without shading of the screen by the instrument itself.
Figure 2 presents the projected experimental stimulus prepared as the standard pattern. The projection size of stars in the stable stimulus was determined by the magnitude class, and the stars were projected in a viewing angle range of 0.2′ to 4′ from the viewing position of the observers, as shown in Figure 2b. The hole diameter sizes of the star plates were designed considering all projection conditions, including the intensity of the light source, design filter, and optical conditions. The size of each star in the variable stimulus was the same (an approximately 2-μm hole) because of the processing limit for metal plates. Furthermore, the size of projected stars in the variable stimulus was less than 0.2′ of the viewing angle. The standard parameters of physical factors such as luminance, representation size and star density were set as approximately 1.91 cd/m2 at the dome screen surface (luminance) with a viewing angle of 0.2′ in diameter (size) of each individual star which was projected from a projector with a star plate.
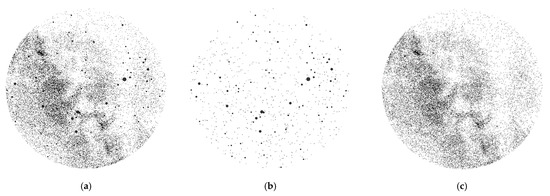
Figure 2.
Examples of projected experimental stimuli. (a) Entire stimulus; (b) Stable stimulus (bright stars); (c) Variable stimulus (the Milky Way, faint stars).
The field of the Milky Way used as the experimental stimulus included 60,000 stars (density), as shown in Figure 2c. The colors of the stars in the Milky Way were set to be the same in all projection patterns; white. People can recognize stars of magnitude 6.0 with the naked eye [12]. However, people can perceive the brightness of fainter stars with a magnitude greater than 6.0, although their eyes cannot resolve the dim star as a point. Based on this knowledge, we set bright stars that had a magnitude less than 6.0 as a stable stimulus in our experiment. The fainter stars with a magnitude higher than 6.0 were set as variable stimuli to change the physical factors in the reproduction of the Milky Way. The color and size of stars in the stable stimulus were reproduced by treating each star’s magnitude information following Pogson’s rule [13] and the color temperature of individual stars [14], and by controlling the hole sizes and filters of the star plate in the projector.
2.2.2. Additional Pattern
● Transmittance-based Pattern
The brightness of the night sky has a significant influence on the perception of stars during actual observation. When the darkness of the night sky is altered by light pollution and zodiacal light, the visible area of the Milky Way is limited. Changes in contrast between the brightness of the surrounding night sky and the faint stars in the Milky Way may increase or decrease visibility and the perception of the brilliance of the star. Therefore, we changed the contrast with the background of the night sky and visibility by preparing the L1 and L2 patterns. For these, the projected luminance of the variable stimulus was relatively increased or decreased using neutral density (ND) filters on the lens barrel of the projector. The transmittance in patterns L1 and L2 was approximately half and twice the transmittance of the standard pattern, respectively. Furthermore, these ND filters (L1 for half transmittance, L2 for double transmittance) were set on other patterns (S1, D1, and D2) to prepare combination patterns with different sizes, densities, and transmittances.
● Size-based Pattern
For the variable stimulus, we controlled the size of the stars projected on the dome screen by expanding or contracting the hole diameter of the star plate in the standard pattern. This allowed us to investigate the projection size of faint stars that are too small to observe as individual stars, but are appropriate for observing the Milky Way. Compared to the standard pattern, pattern S1 had a half diameter.
● Density-based Pattern
A star is reproduced by processing a hole in a star plate. The number of processed faint stars in the Milky Way depends on the brightness, which affects visibility, because of the masking area removed in the star plate. In contrast, an increase in the number of processed faint stars also creates a lack of tint in the Milky Way. Therefore, the size of the star field was stable for all projected patterns. To investigate the appropriate number of processed faint stars in the Milky Way, we changed the density to make the star holes relatively dense (pattern D1, 2/3 density) or sparse (pattern D2, 3/2 density) in the star plate of the standard pattern for the variable stimulus.
2.3. Experimental Index
We conducted a psychometric experiment to assess the perception of three indices: the faithfulness, preference, and depth feeling of star image reproduction, in a planetarium for 12 types of projection patterns, as summarized in Table 1. These three indices were selected to assess the appearance of the Milky Way by considering two image reproduction methods, faithful reproduction and preferred reproduction, and a design concept for a dome screen that includes the greatest features of the sky. The definitions of these indices in this experiment are as follows:
- Faithfulness: whether the observation target is faithful to one’s impression of the actual Milky Way.
- Preference: whether the observation target can meet one’s impression of an expected Milky Way in a planetarium.
- Depth feeling: whether the observation target conveys the depth of the universe.
In our previous study [8] investigating faithfulness and preferred star reproduction without the Milky Way, we found that the independence between these two indices depended on the observers; male observers evaluated the faithfulness as a preference, but female observers did not. We hypothesize that depth feeling might be related to the other indices of faithfulness and preference. To clarify star reproduction with the Milky Way, we used these three indices in this study.
2.4. Experimental Procedure
The observers evaluated the results compared with those of the recalled actual Milky Way using opposite word pairs (“faithful”/“non-faithful”) and five integer levels from −2 to +2, and wrote their evaluation values down on answer cards based on a 5-point Likert scale. The meanings of each evaluation level were −2 (not faithful), −1 (slightly not faithful), 0 (neither), +1 (slightly faithful), and +2 (faithful). In the preference and depth feeling evaluations, the observers performed evaluations using another opposite word pair (“preference”/“non-preference,” “deep”/“shallow”) with the same five integer levels from −2 to +2 without a comparison target. The answer task was conducted in darkness with only the projected star images in order to maintain dark adaptation. However, there was no other bias to discriminate against particular answers. In the evaluation, there was no designated fixation point, and the observers were able to observe the star image freely. Therefore, they could judge the total appearance of all projection stimuli based on foveal vision with the cones and peripheral vision with the rods [15]. Snapshot images of the experimental environment are shown in Figure 3. Each star pattern was projected onto the position of the oval mark in the figure. The diameter of the dome screen was 23 m, and the zenith of the dome screen was slanted 15° frontward. There was no other illumination in the space where the experiment was conducted than the projected starry sky image. The room appeared completely dark. It was not possible to verify the low light level using the spectroradiometer, as it was too dark to measure (<0.003 cd/m2). The viewing angle of the projected star image was 37.3°. The projectors were surrounded with partitions to prevent leakage from the light source from reaching the observers. From the experimental stimuli (star field image), it was realized that the observers could see from both the right and left sides. All observers had a cushion-reclining seat and observed the projected star image in a relaxed posture. The dome was maintained at a suitable temperature, and the conditions remained comfortable and uniform throughout the experiment.
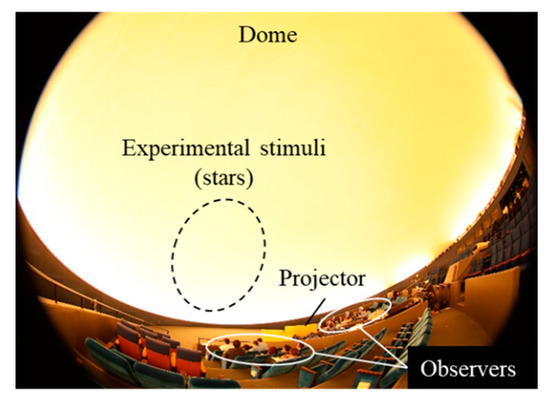
Figure 3.
Snapshot of experimental environment.
A total of 37 observers (22 males and 15 females aged 20–50 and older) participated in this experiment, as shown in Table 2. All experiments were conducted according to the principles outlined in the Helsinki Declaration. Written informed consent was obtained from all participants. As a result of previous experiments [8], evaluation bias was independent of astronomical observation experience. To confirm this tendency for star fields with the Milky Way, we collected experienced/inexperienced observers, each group half the total observers; 19 were experienced and 18 were inexperienced. Furthermore, in this study, the condition for selecting the observers considered general customers who visited a planetarium. Therefore, the observers were randomly gathered without bias to their characteristics such as age, gender, or experience of astronomical observation. This means that if observers do not have enough experience observing the Milky Way in the actual starry sky, they answered the faithfulness evaluation compared to the imagination of actual Milky Way. This psychometric experiment was conducted using the dome of the planetarium. After the observers had taken their seats in the dome, the illumination in the dome was turned off.
Table 2.
Number of observers for each age.
At the beginning of this psychometric experiment, the observers received instructions for the evaluation experiment and performed exercises using all 12 patterns. In the experimental instructions, the observers heard the entire process of the experiment, rating methods including definitions of the three indices and time management for each evaluation, and a questionnaire for their personal information such as age, gender, and experience of astronomical observation in a planetarium and an actual sky. Both steps of exercise and experiment included evaluations for all 12 patterns using three indices. After hearing the instructions, the exercise step was performed before the experiment. Therefore, the observer understood the range of fluctuations in the star images to be evaluated in the experiment. It was assumed that the observers had completed dark adaptation by this time so that they were able to observe the detailed differences among patterns.
The experimental step started after the dome shifted to dark for 35 min for the dark adaptation of rods. There was no illumination except from the projected star-field image, and the experiment was preceded by oral instructions using a microphone in the dark dome. In both the exercise and experiment steps, the observers did not know which star pattern was projected. In this experiment, the 12 patterns were randomly projected, and the observers sequentially evaluated one evaluation index (faithfulness, preference, or depth feeling) of each pattern within 15 s after observing the star image for 30 s. Between pattern projections, observers had a short break of several minutes while the projection pattern was reset. The illumination of the dome was turned on after all evaluation tasks related to this experiment were completed. Thereafter, the observers answered a questionnaire in a lit place and left the room. The duration for evaluating one pattern by the three evaluation indices was 75 s. The total time needed from the first introduction to the last evaluation of the overall psychometric experiment, including exercises, was approximately 1 h.
2.5. Experimental Results
The significance of the evaluations given for each pattern was verified using a t-test after excluding outlier data using the Smirnoff–Grubbs test and verifying the distribution equality of evaluations using an F-test. Here, we assumed the normality of the evaluated data. These tests were conducted separately for all 66 pattern combinations (12 × 11/2) for each evaluation index (faithfulness, preference, and depth feeling). Using parametric statistical techniques on data generated from the Likert scale is still controversial [16,17]. However, we used the rating score directly obtained from the Likert scale for naïve observers who did not have experience of psychophysical experiments. Furthermore, in addition to the above-mentioned analysis, we carried out an analysis of variance (ANOVA) to confirm the influence of the interaction by the combination of physical factors.
First, we checked whether there was a tendency for rating faithfulness based on astronomical observations. However, we could not find any relationship between rating scores and observers’ characteristics. Therefore, we treated all answers of 37 observers as experimental results without categorizing the observer’s prior information such as age, gender, and experience of astronomical observation. The average rating value for each pattern is shown in Figure 4. The projection pattern with the highest rating was Std-L1 for faithfulness and Std for preference and depth feeling, respectively (p < 0.01). In addition, D2-L2 for all indices was rated as the lowest score (p < 0.01). For all three indices, we found a tendency of ratings for each pattern. We focused on the luminance represented by the projected patterns and calculated the total luminance.
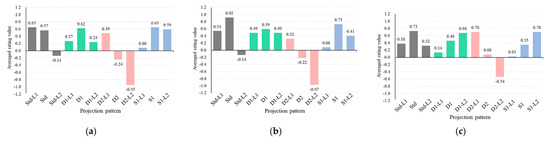
Figure 4.
Evaluation results for all observers for each projection pattern. (a) Faithfulness; (b) Preference; (c) Depth feeling.
Figure 5 shows the average rating value with the standard error among all 37 observers for each pattern in luminance, ordered from low (left) to high (right). We confirmed the tendency from the peak (high rating) to the valley (low rating) along the luminance order for each evaluation index. In the faithfulness evaluation, there was a broad peak from Std-L1 to S1-L2 and a valley for the brighter pattern D2. This valley result was almost identical for the other two indices of preference and depth feeling. However, the tendency of the peak range differed, as shown in Figure 5b,c. There were two peaks for preference evaluation, and the peak range for the evaluation of depth feeling was rather narrow (from D2-L1 to D1-L2). This result indicates that both luminance and other factors affect the judgment of preference and depth feeling evaluations.
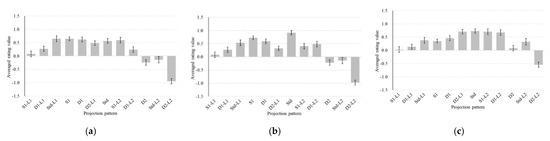
Figure 5.
Evaluation results for all observers for each projection pattern in luminance order. (a) Faithfulness; (b) Preference; (c) Depth feeling.
3. Modeling
We constructed a common model for evaluation indices such as faithfulness, preference, and depth feeling by using physical factors (transmittance, representation size and star density) in a planetarium system in order to describe the evaluation for the Milky Way. To derive the model presented in this work, we considered which factor was more important for representation of a starry sky: faithfulness, preference or depth feeling.
3.1. Estimation Model for Physical Factors
The physical factors of transmittance, representation size and star density of the standard pattern were normalized as ( to integrate the changes for each factor. According to their ratios to another pattern, the transmittance component was calculated by using the total area of holes on the star plate because one of the standard patterns had a value of 1.0. The representation size and star density components were derived from the changes in the physical values. Figure 6 shows a summary of each component for each projection pattern. For example, in the case of pattern S1-L1, we obtained three components = (0.5, 0.25, 1) because the pattern S1-L1 had half transmittance, a 1/4 area ratio, and the same density as the standard pattern. By using these physical components to represent the characteristics of each projection pattern, we constructed a common model to estimate the psychometric evaluation values for faithfulness, preference, and depth feeling.
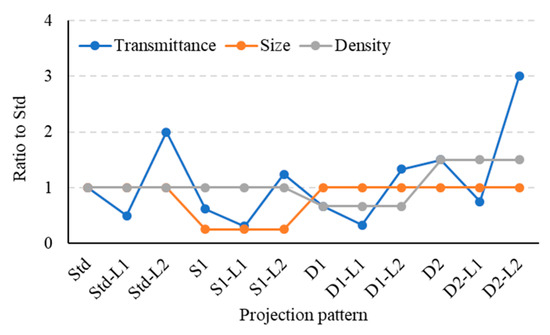
Figure 6.
Component of each projection pattern.
In our modeling process, we had three hypotheses regarding the evaluation results as follows:
- Psychometric evaluations can be described using a logarithmic scale that conforms to the Weber–Fechner law.
- Each psychometric evaluation follows a normal distribution in the logarithmic domain because the average rating value for each evaluation is unimodal, as depicted in Figure 5.
- Humans evaluate faithfulness, preference, and depth feeling using all physical factors comprehensively, and this process can be described as addition in a numerical formula.
Most psychophysical experiments using direct scaling followed a lognormal distribution [18], and a multi-layered perceptual model is often expressed by a linear model [19]. Considering these hypotheses, we proposed a common estimation model to represent the evaluation for the evaluation index Φ by a log-normal distribution for the Milky Way as follows:
where and represent the mean and standard deviation of the natural logarithm of the variable, respectively. represents the weights of (, where w represents the scaling factor. By least mean-square fitting, as shown in Figure 7, they were calculated as and , where the fittest weights (, , ) and w were (0.25, 0.25, 0.50) and 134.15, respectively. Comparison of the differences in weights across the evaluation indices indicates that the change in density was the strongest factor in evaluating the Milky Way. The correlation coefficient for all evaluation indices was 0.92, and the correlation coefficients for each evaluation index were as high as 0.97, 0.97, and 0.86. This result indicates that our hypotheses are appropriate for estimating the evaluation of the Milky Way using the common estimation model in Equations (1) and (2). This model indicates that we can reproduce the Milky Way with an appearance well-balanced in faithfulness, preference, and depth feeling if a planetarium can be made with the estimated appropriate parameters.
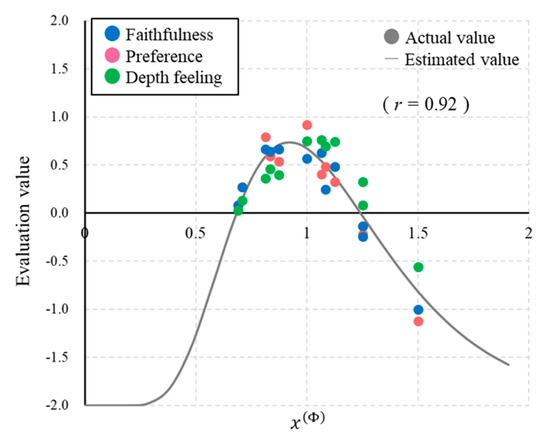
Figure 7.
Fitting result by proposed common estimation model.
When estimating a specific evaluation index, it is possible to enhance the estimation accuracy of the model by setting the parametric mean and standard deviation in Equation (1) as follows:
where and represent the mean and standard deviation of the natural logarithm of the variable for evaluation index . represents the scaling factor for the evaluation index . By least-mean-square fitting, as shown in Figure 8, they were calculated as shown in Table 3. Here, the fittest weights (, , ) and w were (0.26, 0.27, 0.47) and 129.93 for faithfulness, (0.26, 0.23, 0.52) and 129.31 for preference, and (0.23, 0.25, 0.52) and 130.08 for depth feeling, respectively. The correlation coefficients for each evaluation index improved to 0.98, 0.97, and 0.94. This fitting model for each evaluation index fulfills a condition for reproducing an outstanding appearance with faithfulness, preference, or depth feeling as desired by observers in a planetarium.
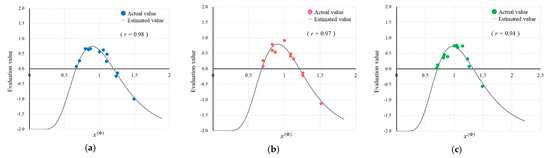
Figure 8.
Fitting results for each evaluation index by proposed estimation model. (a) Faithfulness; (b) Preference; (c) Depth feeling.
Table 3.
Mean and standard deviation values of estimation model.
3.2. Evaluation Trends of Observers
In the analysis of the rating scores provided by observers, a specific tendency was found for each evaluation index. We classified the observers based on the rating scores of all non-outlier observers for each pattern using hierarchical clustering by Ward’s method [20]. Observers were sorted into two clusters (Cluster 1 and Cluster 2). The numbers of observers in Cluster 1 and Cluster 2 were 28 and 4 for faithfulness (5 outliers), 29 and 3 for preference (5 outliers), and 19 and 8 for depth feeling (10 outliers), respectively. Figure 9 shows the normalized weights obtained from the application of our proposed equations for each cluster in the evaluation indices. For all evaluation indices, Cluster 1 focused on density. The weight results for Cluster 1 were stable across all evaluations; however, those for Cluster 2 changed depending on the evaluation indices, as shown in Figure 9d. These findings indicate that the most important physical factor in the reproduction of the Milky Way for the majority of observers is density control (Cluster 1). In Cluster 2, luminance reproduction by controlling the transmission filter of the preferred Milky Way is a more important factor than density reproduction. Size control is not very important for either cluster.
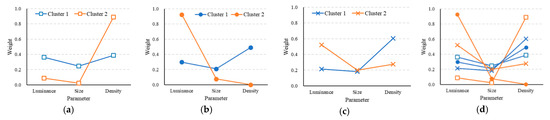
Figure 9.
Weights in two clusters for each evaluation. (a) Faithfulness; (b) Preference; (c) Depth feeling; (d) Total comparison.
We tried to find common characteristics within clusters using the answers to the questionnaires. However, we found no relationships between the rating score and personal data such as age, gender, or experience of astronomical observation. It is interesting that the faithfulness evaluation did not depend on the experiences of actual astronomical observations or planetarium observations. In other words, there is no difference in the evaluation of faithfulness between amateur and experienced observers. This result suggests that people can perceptually evaluate the Milky Way accurately, even if they have never seen the actual starry sky.
4. Conclusions
A natural starry sky with the Milky Way is created by a set of point light sources, and its reproduction has not been sufficiently investigated. In this study, to investigate the important physical factors that reproduce the star field with the Milky Way in a planetarium, we analyzed three evaluation indices—faithfulness, preference, and depth feeling—with psychometric experiments, using the projected stars as experimental stimuli and changing three physical factors (transmittance, representation size and star density). A standard projection pattern was designed by a group of experienced observers with abundant astronomical observation experience. The standard was faithful to the actual starry sky, perceptually but not physically. In evaluation experiments, 37 observers were engaged to evaluate 12 types of star patterns projected on a dome screen. Based on the evaluation results, we proposed a common estimation model for describing the faithfulness, preference, and depth feeling with a log-normal distribution. The resultant model exhibited good accuracy with high correlation coefficients.
Many studies about human perception of the real sky at night have been discussed since Galileo Galilei’s works. As future work, extensive and insightful discussions are further required based on such studies. In a further analysis involving clustering observers, we identified two clusters defined by evaluation tendencies. The major cluster focused on density reproduction for the appearance of the Milky Way in a planetarium.
Author Contributions
Conceptualization, K.O.; methodology, M.T.; validation, K.O. and S.S.; formal analysis, M.T.; investigation, M.T. and Horiuchi; resources, K.O. and S.S.; writing—original draft preparation, M.T.; writing—review and editing, M.T. and T.H.; supervision, T.H. All authors have read and agreed to the published version of the manuscript.
Funding
This research received no external funding.
Institutional Review Board Statement
The study was conducted according to the guidelines of the Declaration of Helsinki, and approved by the Institutional Review Board of Konica Minolta Planetarium Co., Ltd.
Informed Consent Statement
Informed consent was obtained from all subjects involved in the study.
Data Availability Statement
Data not available due to commercial restrictions.
Conflicts of Interest
The authors declare no conflict of interest.
References
- International Astronomical Union. Available online: http://www.iau.org (accessed on 4 February 2021).
- International Dark-Sky Association. Available online: http://www.darksky.org/light-pollution/ (accessed on 4 February 2021).
- International Planetarium Society. Available online: http://www.ips-planetarium.org (accessed on 4 February 2021).
- Good, G.A. Observing Variable Stars; Springer Science and Business Media: Berlin/Heidelberg, Germany, 2012. [Google Scholar]
- Jensen, H.W.; Durand, F.; Dorsey, J.; Stark, M.M.; Shirley, P.; Premože, S. A physically-based night sky model. In Proceedings of the 28th Annual Conference ACM, Los Angeles, CA, USA, 12–17 August 2001; pp. 399–408. [Google Scholar]
- Jensen, H.W.; Premože, S.; Shirley, P.; Thompson, W.B.; Ferwerda, J.A.; Stark, M.M. Night Rendering; Technical Report UUCS-00-016; Department of Computer Science, University of Utah: Salt Lake City, UT, USA, 2000. [Google Scholar]
- Tanaka, M.; Horiuchi, T.; Otani, K.; Hung, P.-C. Evaluation for Faithful Reproduction of Star Fields in a Planetarium. Electron. Imaging 2018, 2018, 060401-1. [Google Scholar] [CrossRef]
- Tanaka, M.; Horiuchi, T.; Otani, K. Relationship between Faithfulness and Preference of Stars in a Planetarium. J. Percept. Imaging 2019, 2, 10402-1–10402-11. [Google Scholar] [CrossRef]
- Peli, E.; Arend, L.; Labianca, A.T. Contrast perception across changes in luminance and spatial frequency. J. Opt. Soc. Am. A 1996, 13, 1953–1959. [Google Scholar] [CrossRef] [PubMed]
- Durgin, F.H.; Hammer, J.T. Visual aftereffects of sequential perception: Dynamic adaptation to changes in texture density and contrast. Vis. Res. 2001, 41, 2607–2617. [Google Scholar] [CrossRef][Green Version]
- Leinert, C.; Bowyer, S.; Haikala, L.K.; Hanner, M.S.; Hauser, M.G.; Levasseur-Regourd, A.-C.; Mann, I.; Mattila, K.; Reach, W.T.; Schlosser, W.; et al. The 1997 reference of diffuse night sky brightness. Astron. Astrophys. Suppl. Ser. 1998, 127, 1–99. [Google Scholar] [CrossRef]
- Schaefer, B.E. Telescopic limiting magnitudes. Publ. Astron. Soc. Pac. 1990, 102, 212. [Google Scholar] [CrossRef]
- Jones, D. Norman Pogson and the Definition of Stellar Magnitude; Astronomical Society of the Pacific Leaflets: San Francisco, CA, USA, 1967; Volume 10, pp. 145–152. [Google Scholar]
- Perryman, M.A.C.; Lindergren, L.; Kovalevsky, L.; Hoeg, E.; Bastian, U.; Bernacca, P.L.; Crézé, M.; Donati, F.; Grenon, M.; Grewing, M.; et al. The Hipparcos Catalogue. Astron. Astrophys. 1997, 323, 49–52. [Google Scholar]
- Williamson, S.J.; Cummins, H.Z. Light and Color in Nature and Art; John Wiley and Sons: Hoboken, NJ, USA, 1983. [Google Scholar]
- Carifio, J.; Perla, R. Resolving the 50-year debate around using and misusing Likert scales. Med. Educ. 2008, 42, 1150–1152. [Google Scholar] [CrossRef] [PubMed]
- Norman, G. Likert scales, levels of measurement and the “laws” of statistics. Adv. Health Sci. Educ. 2010, 15, 625–632. [Google Scholar] [CrossRef] [PubMed]
- Mansfield, R.J.W. Measurement, Invariance, and Psychophysics; Springer: Dordrecht, The Netherlands, 1974; pp. 113–128. [Google Scholar]
- Shao, Z.; Wu, J.; Ouyang, Q.; He, C.; Cao, Z. Multi-Layered Perceptual Model for Haptic Perception of Compliance. Electronics 2019, 8, 1497. [Google Scholar] [CrossRef]
- Hennig, C. Clustering Strategy and Method Selection. arXiv 2015, arXiv:1503.02059. [Google Scholar]


Publisher’s Note: MDPI stays neutral with regard to jurisdictional claims in published maps and institutional affiliations. |
© 2021 by the authors. Licensee MDPI, Basel, Switzerland. This article is an open access article distributed under the terms and conditions of the Creative Commons Attribution (CC BY) license (http://creativecommons.org/licenses/by/4.0/).