Article

3D Numerical Modeling of Rigid Inclusion-Improved Soft Soils Under Monotonic and Cyclic Loading—Case of a Small-Scale Laboratory Experiment

1
Faculty of Civil Engineering, Hanoi University of Mining and Geology (HUMG), Hanoi 100000, Vietnam
2
3SR Laboratory, Grenoble Alpes University, UMR 5564 BP 53, CEDEX 9, 38041 Grenoble, France
3
School of Automotive and Transportation Engineering, Hefei University of Technology, Hefei 230000, China
*
Author to whom correspondence should be addressed.
Appl. Sci. 2021, 11(4), 1426; https://doi.org/10.3390/app11041426
Submission received: 30 December 2020 / Revised: 22 January 2021 / Accepted: 28 January 2021 / Published: 4 February 2021
(This article belongs to the Section Civil Engineering)

Abstract

:
This paper is based on small-scale laboratory tests (1:10) of a rigid inclusion-improved soil under normal gravity. A low area improvement ratio (2.4%) under monotonic and cyclic loading was used. 3D numerical calculations are performed to model these tests. The proposed numerical modeling is performed by the finite element method (FEM) using the ABAQUS software. A representative elementary volume model is suggested for reducing the calculation time. A hypoplastic constitutive model (HYP model) is applied for the load transfer platform (LTP). A total of three geometrical configuration cases of the experimental tests are numerically considered including a rigid slab over a mattress of 100 mm on the reinforced soil, a mattress of 100 mm on the reinforced soil, and a rigid slab over a mattress of 50 mm on the reinforced soil. The proposed numerical results are compared to the experimental data and the previous numerical results of Houda. The cyclic response of the systems is shown in terms of soil arching and settlements. The decrease in pile efficacy and the cumulative settlements are exhibited. The HYP model allows to better simulate the soil arching mechanisms inside the LTP than the CYsoil model used in the Houda’s research work. A good concordance between the proposed numerical results and the experimental data was obtained.

1. Introduction

The rigid inclusions-reinforced soft soil, known as a piled embankment, were applied for infrastructural and industrial projects such as highway and railway embankments, bridges, retaining walls, wind turbines, oil tanks, and industrial houses. Indeed, traffic vehicles, wave and wind on structures, water levels’ fluctuation inside the ground, earthquake events, storage facilities, and vibrations induce monotonous and cyclic impacts on both the structures and soils. Therefore, the analysis of rigid inclusions-reinforced soils under monotonic and cyclic loading in an important issue in practice.
Several authors experimentally and numerically studied the behavior of rigid inclusions-reinforced soils under load transfer platforms (LTP) subjected to cyclic loadings [1]. Similarly to the static loading case, the arching effect within the load transfer platform and settlements are interesting to evaluate the cyclic loading response of the rigid inclusions-reinforced soils behavior. The arching effect is a phenomenon that occurs when stresses are transferred from the soil to the adjacent rigid piles. This effect is usually expressed by the pile efficacy and the stress concentration ratio. The pile efficacy (E) is measured as the ratio of the load transmitted to the pile cap by the total load. The stress concentration ratio (SCR) is equal to the stress transferred to the pile divided by the stress applied to the soft soil. The higher the pile efficacy (or SCR) is, the more the arching effect is. The cumulative settlements of the embankment and soft soil can also be considered for its evaluation.
In the literature, a few experimental works were performed to investigate the cyclic behavior of rigid inclusions-reinforced soft soils [1]. Some conclusions were figured out. A decrease in the soil arching and cumulative settlements was presented with respect to the load cycles number [2,3,4,5,6,7,8,9]. The authors also indicated no existence of the soil arches under a limited number of loading cycles. The higher the frequency, the greater the soil arching reduction. The use of geogrid layers allows us to stabilize the soil arches and reduce the cumulated ground settlements. An increase in the loading amplitude also results in a soil arching decrease. Yu et al. [5] found an increase in the vertical soft soil stresses with respect to an increase in the load cycles number, and there was nonexistence of the soil arching when the cycles number was superior to 300. Moreover, the soil arches collapsed when the ratio of the embankment height and diameter of the trap door was lower than 3, and vice versa [4,10]. Studying the LTP on the rigid inclusion-reinforced compressible soils under 50 load cycles, Houda et al. [7] found that 50% of the total cumulated settlements took place after the first ten cycles and the pile efficacy increases slightly.
The numerical modeling is an efficient method to simulate rigid inclusion-reinforced soft soils under loading cycles. It also allows extending the parametric studies. Han and Bhandari [11] figured out the plastic strain cumulation in the embankment. Han et al. [3] investigated the influence of the dynamic loading amplitude effect and embankment height on the soil arching. Zhuang and Li [12] showed that the traffic loading type is significantly influent on the soil arching, especially for the embankment settlements. The presence of a geogrid increased the stability of soil arches under dynamic loading [4]. However, simple constitutive models were often applied for soils, which led to under- or overestimations of the results. The embankments and soft soils were often modelled using linear elasticity or linear elastic with perfectly plastic models combined with damping characteristics [4,12,13,14,15]. As a result, the cumulated settlements and stress degradation on piles were not clearly illustrated. When using the CYsoil constitutive model for LTP, Houda et al. [9] found that the soft soil settlements cumulation and the soil arching slightly decrease under very low frequency cyclic loadings. Nevertheless, underestimations in terms of settlements and pile efficacies were shown.
The Hypoplastic model is an advanced constitutive model. It is normally used for granular soils. Thanks to its intergranular strain concept, the model can address the microstructure mechanism (rearrangement of particles and deformation of the intergranular interface layers) and the stiffness variation with the strain history [16]. When considering soils under cyclic loads, the constitutive model can describe the cumulative strain/settlement and stiffness degradation without considering damping parameters. This constitutive model was already used to consider different geotechnical problems subjected to monotonic, cyclic as well as dynamic loads: a building [17,18]; shallow foundations [19,20]; single vertical piles [21]; saving-water basins [22]; unreinforced and reinforced piled embankments [23].
It can be concluded that most of the numerical studies by the fact that they have used a simplified constitutive model are not able to simulate accurately rigid inclusion-reinforced soils. Using these kind of constitutive models does not allow to accurately give an accurate evolution of the arching effect and the cumulation of settlements under cyclic loading.
The hypoplastic model with the intergranular strain concept can express with more accuracy the cyclic loading of a soil. The proposed numerical modeling is carried out to investigate the behavior of rigid inclusion-improved soft soils under monotonic and cyclic loads in which the HYP model is used for the LTP. The development of soil arching and cumulative settlements are presented. In addition, the proposed numerical results are validated against experimental data and previous numerical results. Parametric studies related to the cyclic loading type, the boundary conditions and the LTP thickness allowed us then to provide more insights into the cyclic behavior of rigid inclusion-reinforced soft soil systems.

2. Experimental Test Description

The French national project (ASIRI, 2012 [
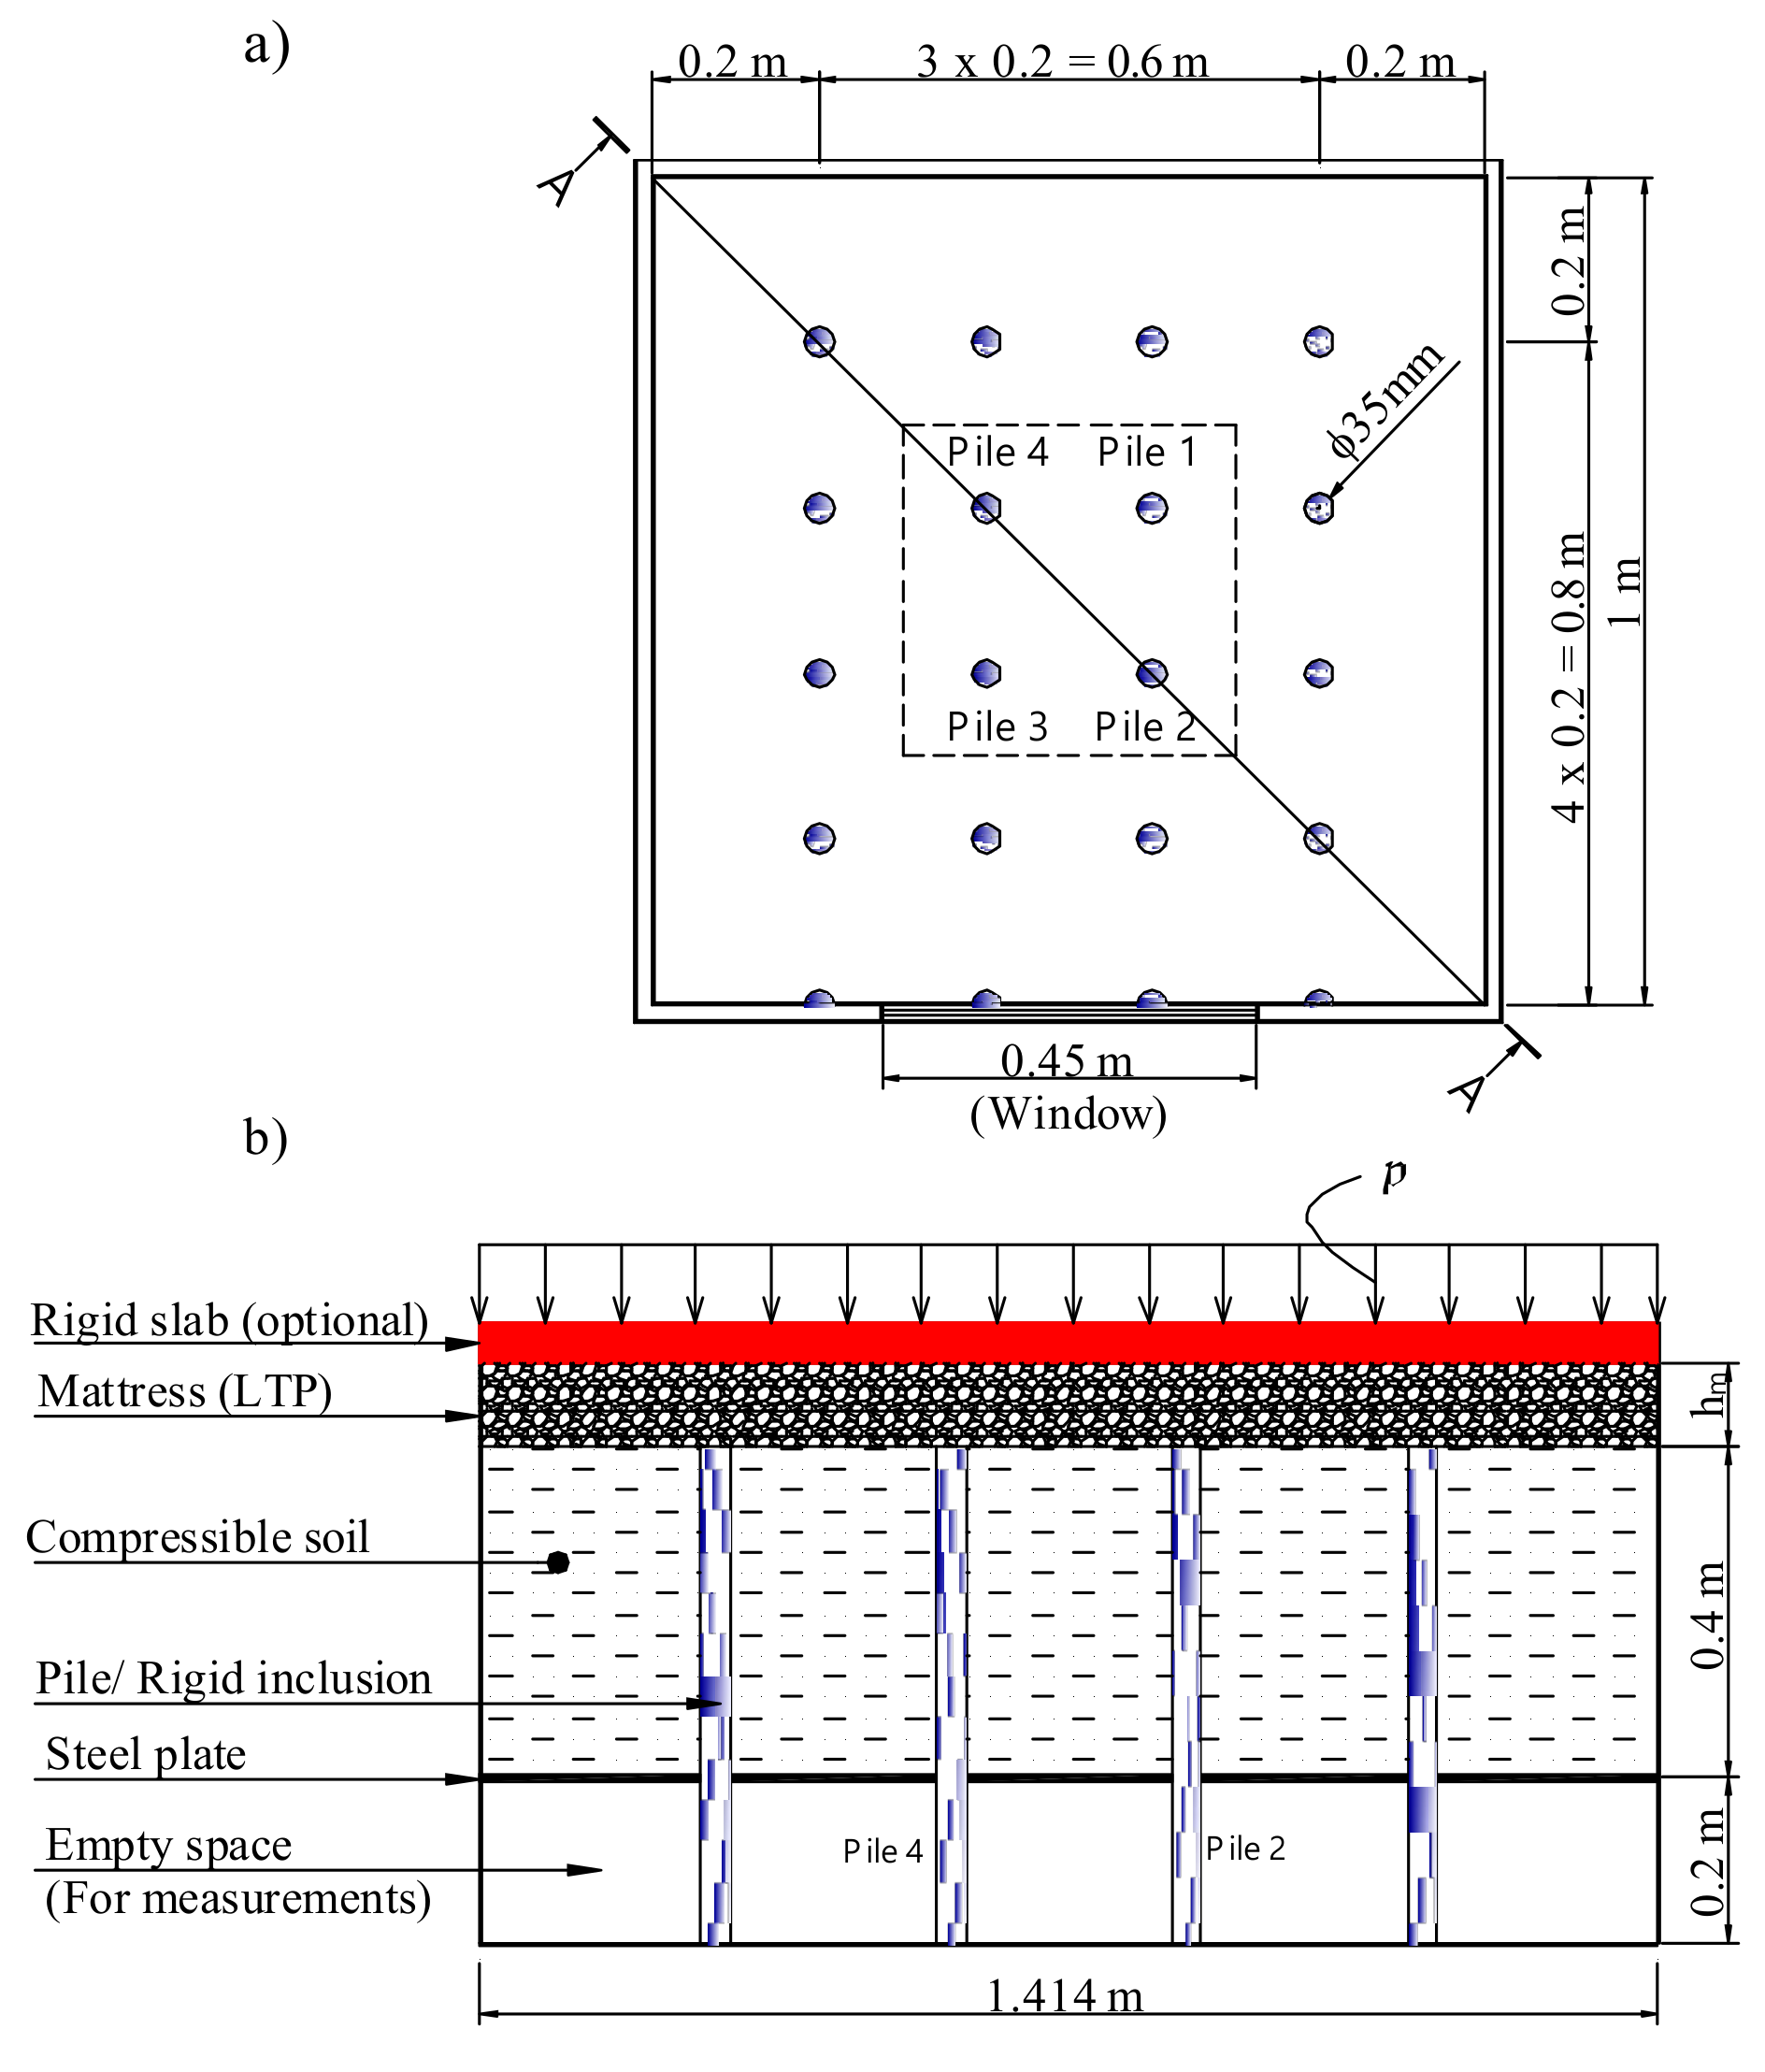
24]) studied the soft soil improvement by rigid inclusions technique. However, this research project was mainly concentrated on the system behavior subjected to static loadings. Structures under cyclic loading are commonly encountered in practice. Experiments were done to better understand the soft soil improved by rigid inclusions under monotonic and cyclic loading. A 1:10 scale physical model under normal gravity was set up, in which all the dimensions were reduced 10 times. The detail of the model was presented in Houda (2016) [6]. A total of 16 aluminum cylinder piles were installed in a square box of 1 × 1 m. The piles had a diameter of 35 mm and were arranged in a square grid of 0.2 × 0.2 m, with an improvement area ratio a = 2.4%. A 0.4-m-thick layer of soft material was setup, followed by a LTP layer by gravel, as shown in Figure 1. The different testing cases were created by changing the thickness of LTP and with and without a rigid slab: including a mattress of 100 mm with a rigid slab at the surface (test D100); a mattress of 100 mm without rigid slab at the surface (test R100), and a mattress of 50 mm with a rigid slab at the surface (test D50).
The LTP was made from crushed gravel material, in which the content of the particle diameters ranging from 2 to 5 mm accounted for more than 90% of the total material. Corresponding to respectively void ratios in the range from emin = 0.52 to emax = 0.78. The measured unit weights were 16.5 and 14 kN/m3. Monotonic and cyclic triaxial tests on gravel samples allowed determining the geotechnical properties, listed in Table 1. The compressible soil was a mixture of fine-grained Fontainebleau sand and expanded polystyrene balls with a water content of w = 10%. Its geotechnical properties were defined by using oedometer tests. The geotechnical parameters of LTP and compressible soil are shown in Table 1.
Uniform distributed loads were applied onto the surface of the LTP or slab by a pressured control system via a membrane. Both monotonic and cyclic loading was considered in the tests. Two types of cyclic loading were C1 and C2 as shown in Figure 2. The detail of the applied cyclic loadings is shown in Figure 3. The examined testing cases are summarized in Table 2. During the tests, the force applied onto four inclusion heads were measured by 1-kN force censors. Displacement sensors at three different positions recorded the settlements at the LTP base (Figure 1).
Houda et al. [9] also carried out numerical simulations to validate the above experimental tests, in which, the LTP and compressible soil were respectively modeled by the CYsoil and MCC models. The finite difference method using the code FLAC3D software was used. Their numerical results were compared with the experimental data. However, as the work considered a simple constitutive model for the LTP, it was not able to rigorously consider the soil behavior under cyclic loading. In this study, a 3D numerical modeling of the rigid inclusion-reinforced compressible soil tests under monotonic and cyclic loading is presented, in which the HYP model is considered to model the effect of cyclic loading.

D Numerical Modeling

In previous researches, a representative elementary volume model, called a quarter of a pile model, was used for investigating the behavior of the piled embankments under cyclic loading since it allowed reducing the calculation time as well as obtaining reliable results [1,6,12,25,26,27,28,29,30]. With respect to the laboratory tests, three geometrical configurations were numerically studied including a mattress of 100 mm over a reinforced soil with/without a slab, and a mattress of 50 mm over a reinforced soil with a rigid slab. The rigid inclusion-reinforced soil is placed on a non-deformable steel plate, the boundary at bottom z = −0.4 m is therefore restrained in the z-direction. Due to the symmetry, the vertical boundaries are fixed in their perpendicular directions (Figure 4). The numerical simulations are performed using the finite element method (FEM) with ABAQUS V6.14 [31]. The discretized elements size is selected to be lower than one-tenth of the wavelength λ to minimize the distortion effect of the wave [14]. The quarter pile, soils, and slab were represented by 5742 volumetric 3C8D elements (8-node linear brick) in 3D mesh, as shown in Figure 5. Concerning the constitutive models, the pile and the slab are represented by the linear elastic model. The compressible soil is modeled by the MCC model. The LTP is characterized by the HYP model. Due to the non-integration of HYP model inside ABAQUS software, the UMAT subroutine of the HYP model developed by Gudehus et al. (2008) was integrated [17]. The moisture of the compressible soil was kept at 10%, and the loading rate was slowly applied (1 kPa/min). The excess pore water was neglected. The numerical calculations were conducted in drained conditions.
The LTP is made of granular soil, so the HYP model is suggested to use due to its cyclic modeling abilities. The HYP model requires thirteen parameters, as presented in Table 3. The eight parameters from 1 to 8 are representative of the nonlinear elasto-plastic response. They are determined based on a fitting with experimental triaxial test curves (Figure 6). The five remaining parameters from 9 to 13 are representative of the intergranular strain concept which enable modelling the soil cyclic behavior. A set of parameters proposed by Niemunis and Herle [16] was successfully applied to study the cyclic response of sands [18,19,20,21,22]. Due to the insufficient data to calibrate the parameters of the intergranular strain state, the set of parameters given in [16] was used in the numerical analyses. The initial void ratio of the granular layer is set equal to 0.7. All the HYP model parameters for the LTP are listed in Table 3. In addition, the MCC model is chosen for the compressible soil. The fitting between experimental and numerical results of the e-log(p’) curve of the oedometer test allows determining the model’s parameters (Figure 7). The parameters of the MCC model are illustrated in Table 4. The vertical pile’s behavior is assumed to be linearly elastic with the Young’s modulus of E = 72.5 GPa, the Poisson’s ratio of ν = 0.20 and the unit weight of γ = 27 kN/m3.
Interfaces between the inclusions and the compressible soil, and between the slab and the LTP were considered in the numerical analyses. Interface elements are characterized by the Coulomb friction model. The coefficient of friction is assumed to be equal to 0.67.
The cases of slab-mattress-reinforced soil (D100 and D50) and mattress-reinforced soil (R100) are analyzed. In each simulation, the loading procedure is conducted by the following steps. Firstly, the initial analysis step is performed, in which the geometry, the material properties, the interfaces, and the boundary conditions are assigned. Then, the geostatic phase is established in which the initial stresses, the initial void ratio, and the self-weight of materials are input. The monotonic loading is subsequently applied to the top of the model. After that, the number of cyclic loading is subjected in two stages: six cycles (50 min/cycle) and then 44 cycles (20 min/cycle). Finally, the process is closed by unloading progress (Figure 2).

3. Numerical Results

The cases of slab-mattress-reinforced soil (D) and mattress-reinforced soil (R) are analyzed. The systems are subjected to monotonic loading (M) and cyclic loadings (C1 and C2). Similarly to the previous experiments, the numerical results allow to present the soil arching in terms of pile efficacy and cumulative settlements at the LTP base. They are compared to the experimental data and the numerical results of Houda (named “CYsoil model for the LTP”).

3.1. Case of a Rigid Slab Over a Mattress of 100 mm on Reinforced Soil (D100)

3.1.1. Soil Arching

Figure 8 compares the numerical results and the experimental data of pile efficacy as a function of the pressure on the slab top (p) under the monotonic test M_D100. In overall, the efficacy increases as the vertical surcharge increases. The numerical curve of HYP model shows that the pile efficacy dramatically increases from 30% to about 90% as the vertical pressure rises from 0 to 10 kPa. Meanwhile numerical curve of CYsoil model experiences a lower pile efficacy of 20% at the pressure of 10 kPa. Both numerical results then show a slight increase in pile efficacy in following loading process. Regarding the experimental curve, after activating the weight of the LTP, the efficacy value is about 30%. It then increases significantly of 60% to reach a peak at a pressure of 8 kPa followed by a plateau till the pressure of 18 kPa. After that, it gradually reduces from 90 to 70% as the loading increases from 18 to 30 kPa.
Figure 9 depicts the variation of the soil arching, in terms of pile efficacy, with respect to the load cycles number (C1_D100 test). In general, the pile efficacy decreases as the number of cyclic loading increases. This tendency was also presented in the study of Heitz et al. (2008) [2], in which the arching ratio reduced from 76 to 56% for 700 load cycles. This can be explained by the grain rearrangement which occurs during the cyclic loading. While the numerical results for the HYP and CYsoil models showed a decrease in the pile efficacy with the load cycles number, the experimental data shows that the pile efficacy increases slightly during the first 30 load cycles. It is subsequently followed by a slight decrease. The pile efficacy of the HYP model is in good agreement with the experiment data at the beginning, reaching a value of nearly 82%. It then decreases slightly with the number of load cycles. Meanwhile, the pile efficacy of CYsoil model is about 15% lower. Figure 10 presents the experimental and numerical results of the pile efficacy in the test C2_D100. Similarly to the C1_D100test, there is an increase in the experimental efficacy in the first 30 cycles. However, the increase is insignificant. The pile efficacy using the HYP model is closer to the experimental data than that the CYsoil model one. The two loading cases are compared in Table 5. The pile efficiency in both tests is similar. It means that the cyclic loading range considered does not significantly affect the soil arching development.
The evolutions of the vertical stresses applied to the inclusion head and soft soil under the number of loading cycles in test C1_D100 is presented in Figure 11. Using the HYP model for the LTP in the numerical analysis, an insignificant decrease in the inclusion head stress and a slight increase in the soft soil stress are observed. As presented by Ishihara (1996); Habib et al. (2010) [32,33], a cohesionless soil subjected to cyclic loads induces cumulated strains that cause its stiffness degradation. Therefore, the expansion of plastic zones and the decrease in the inclusion head stress under cyclic loading can be explained by the stiffness degradation. Soil experimental data under cyclic loading is then necessary to accurately calibrate the parameters for the stiffness degradation curve simulation.

3.1.2. Settlements

The settlements at the LTP base are presented under monotonic and cyclic loading tests. An increase in the surcharge results in a settlements increase, as presented in Figure 12. There is a rather good quantitative agreement between numerical results and experimental. The settlements are approximately equal to 33 mm, corresponding to a surcharge loading of 30 kPa. Irrecoverable settlements are observed in the unloading phase. Additionally, as can be seen from Figure 12, the result given by the HYP are in better accordance that the ones obtained with the CYsoil model.
Regarding the cumulative settlements at the LTP base induced by the cyclic loading test C1_D100, Figure 13 describes the experimental and numerical cumulative settlements.
As can be seen, the cumulation of settlements with the number of loading cycles is figured out, but the cumulation per cycle reduces gradually with the cycles. It leads to a rate decrease in the cumulative settlements. The cumulative settlement equals to 6 mm after 10 cycles followed by an increase of 4 mm after the following 40 cycles. There is a good accordance between the HYP model and the experimental data in terms of cumulative settlements. The numerical results of the HYP model for the LTP are more accurate than the CYsoil ones in terms of cumulative settlements. Considering the non-linearity response in the unloading-reloading process allows the constitutive model to better evaluate the cumulative settlements. Figure 14 shows the influence of the load cycles number on the cumulative settlements for the test C2_D100. A similar tendency was obtained with the C1_D100 test, the cumulative settlements with the number of cyclic loads and a good agreement between the numerical results of HYP model and experimental data are observed. As shown in Figure 3, the loading sequence started by an increase of 30 kPa; it then continued by an unloading of 10 kPa, i.e., the test C2_D100 considered the influence of the over-consolidated state of the compressible soil before applying the cyclic loading. A comparison of the two cyclic loading types is presented in Table 6. As it can be seen, the cumulative settlements in the test C2 represent only one third of the C1 test ones. It is because when the loading increases to 30 kPa, the soil pre-consolidation is updated. The following cyclic loading in the C2 test ranges from 10 to 20 kPa and is then within the elastic region. This results in less cumulative settlements induced in test C2 than in C1.
Table 6 also shows that the cumulative settlements obtained by the CYsoil model are remarkably higher than the one obtained by the experimental test after 50 load cycles. They are doubled in C1_D100 and tripled in C2_D100. The pre-consolidation pressure is not updated in the CYsoil model and its cap enlarged gradually under the loading cycles number. The cumulative settlements given by the HYP one coincide well with the experimental data in both the C1_D100 and C2_D100 tests. The HYP model allows to simulate pre-consolidated soil in terms of load transfer mechanisms and cumulative settlements, after the first load cycle. This is because after a preloading of 30 kPa, the load cycles in test C2 are in the elastic strain range. The intergranular strain concept permits to simulate them accurately.

3.2. Case of a Mattress of 100 mm on Reinforced Soil (R100)

In order to consider the boundary conditions influence, the case of a mattress of 100 mm over a reinforced soil is studied. The behavior of the system in terms of soil arching and cumulative settlements under monotonic and cyclic loading is analyzed.

3.2.1. Soil Arching

Figure 15 and Figure 16 show a slight decrease in the pile efficacy with respect to the number of loading cycles in tests C1_R100 and C2_R100. A reasonably good agreement between the experimental and both numerical results is observed. Similarly to the former studies [1,2,3,5,10,29], the arching effect decrease under the number of load cycles is observed. As compared to those mentioned in Figure 9 and Figure 10, the pile efficacy in slab the case nearly double those without slab, 82% compared to 43%. The existence of a rigid slab on mattress-reinforced soil results in an increase in the pile efficacy.

3.2.2. Settlements

Figure 17 shows a comparison between the experimental and numerical settlements at the LTP base in the monotonic test M_R100. The numerical results predict well the settlements when compared to the experimental ones. With respect to the given pre-consolidation pressure pc = 2 × a0 = 6 kPa, a good fitting of the elastic to plastic transition (where p ranges 0 to 8 kPa) between the proposed the numerical results and measured data is showed. Additionally, both the numerical slopes of the normal consolidation line (where p ranges 8 to 30 kPa) are parallel to the experimental one. In addition, the HYP model curve is closer to the experimental curve than the CYsoil one.
Figure 18 and Figure 19 present the experimental and numerical cumulative settlements at the LTP base under different cyclic loading tests. The measured cumulative settlements after 50 cycles in the C1 and C2 tests are equal to 6.5 and 1.3 mm, respectively. Additionally, the higher the number of load cycles, the larger the cumulative settlements. The cumulative settlements of the system are well modeled by using the HYP model for the LTP. The HYP model models well the cumulative settlements within the first 10 cycles while the CYsoil model always gives very high values. The stiffness and the transition between the intergranular strain and grain rearrangement deformations allows the HYP model to eliminate ratcheting (i.e., an excessive cumulation of deformations for small stress cycles) [16]. Similarly to the cyclic loading tests with a slab, the cumulative settlements of the test C2 are smaller than the C1 ones. Less cumulative settlements in the mattress-reinforced soil system (R100) than in the slab-mattress-reinforced soil (D100) are observed (about two-thirds of reduction).

3.3. Case of a Rigid Slab Over a Mattress of 50 mm on Reinforced Soil (D50)

3.3.1. Soil Arching

To consider the effect of the LTP thickness on the cyclic response of a rigid inclusion-improved soil system, the case of a mattress of 50 mm was investigated. Similarly to the case of a mattress of 100 mm in Figure 9, the measured pile efficacy increases slightly with the increase in the loading cycles number in Figure 20. However, the pile efficacy in the case of a 50-mm-thick mattress is slightly greater than in the 100-mm-thick one. As on the experiment, the numerical pile efficacy slightly increases with the number of load cycles. It is probably due to the soil compaction phenomenon induced by the low cyclic loading frequency.

3.3.2. Settlements

Figure 21 presents the loading cycles number influence on the cumulative settlements. Significant cumulative settlements are observed when the number of load cycles increases. The cumulation of the settlements, in this case, is slightly smaller than for the case of a mattress of 100 mm. The numerical model using the HYP model can address well the cumulative settlements at the LTP base. The cumulative settlements rate decreases as the number of cyclic loading decreases, this tendency is in good agreement as the previous results of Heitz et al. (2008) [2].

4. Conclusions

A 3D numerical modeling is performed to study the behavior of rigid inclusion-improved soft soils under monotonic and cyclic loads. The HYP constitutive model is used for the LTP. A comparison between numerical results and experimental data is presented in terms of the pile efficacy and cumulative settlements.
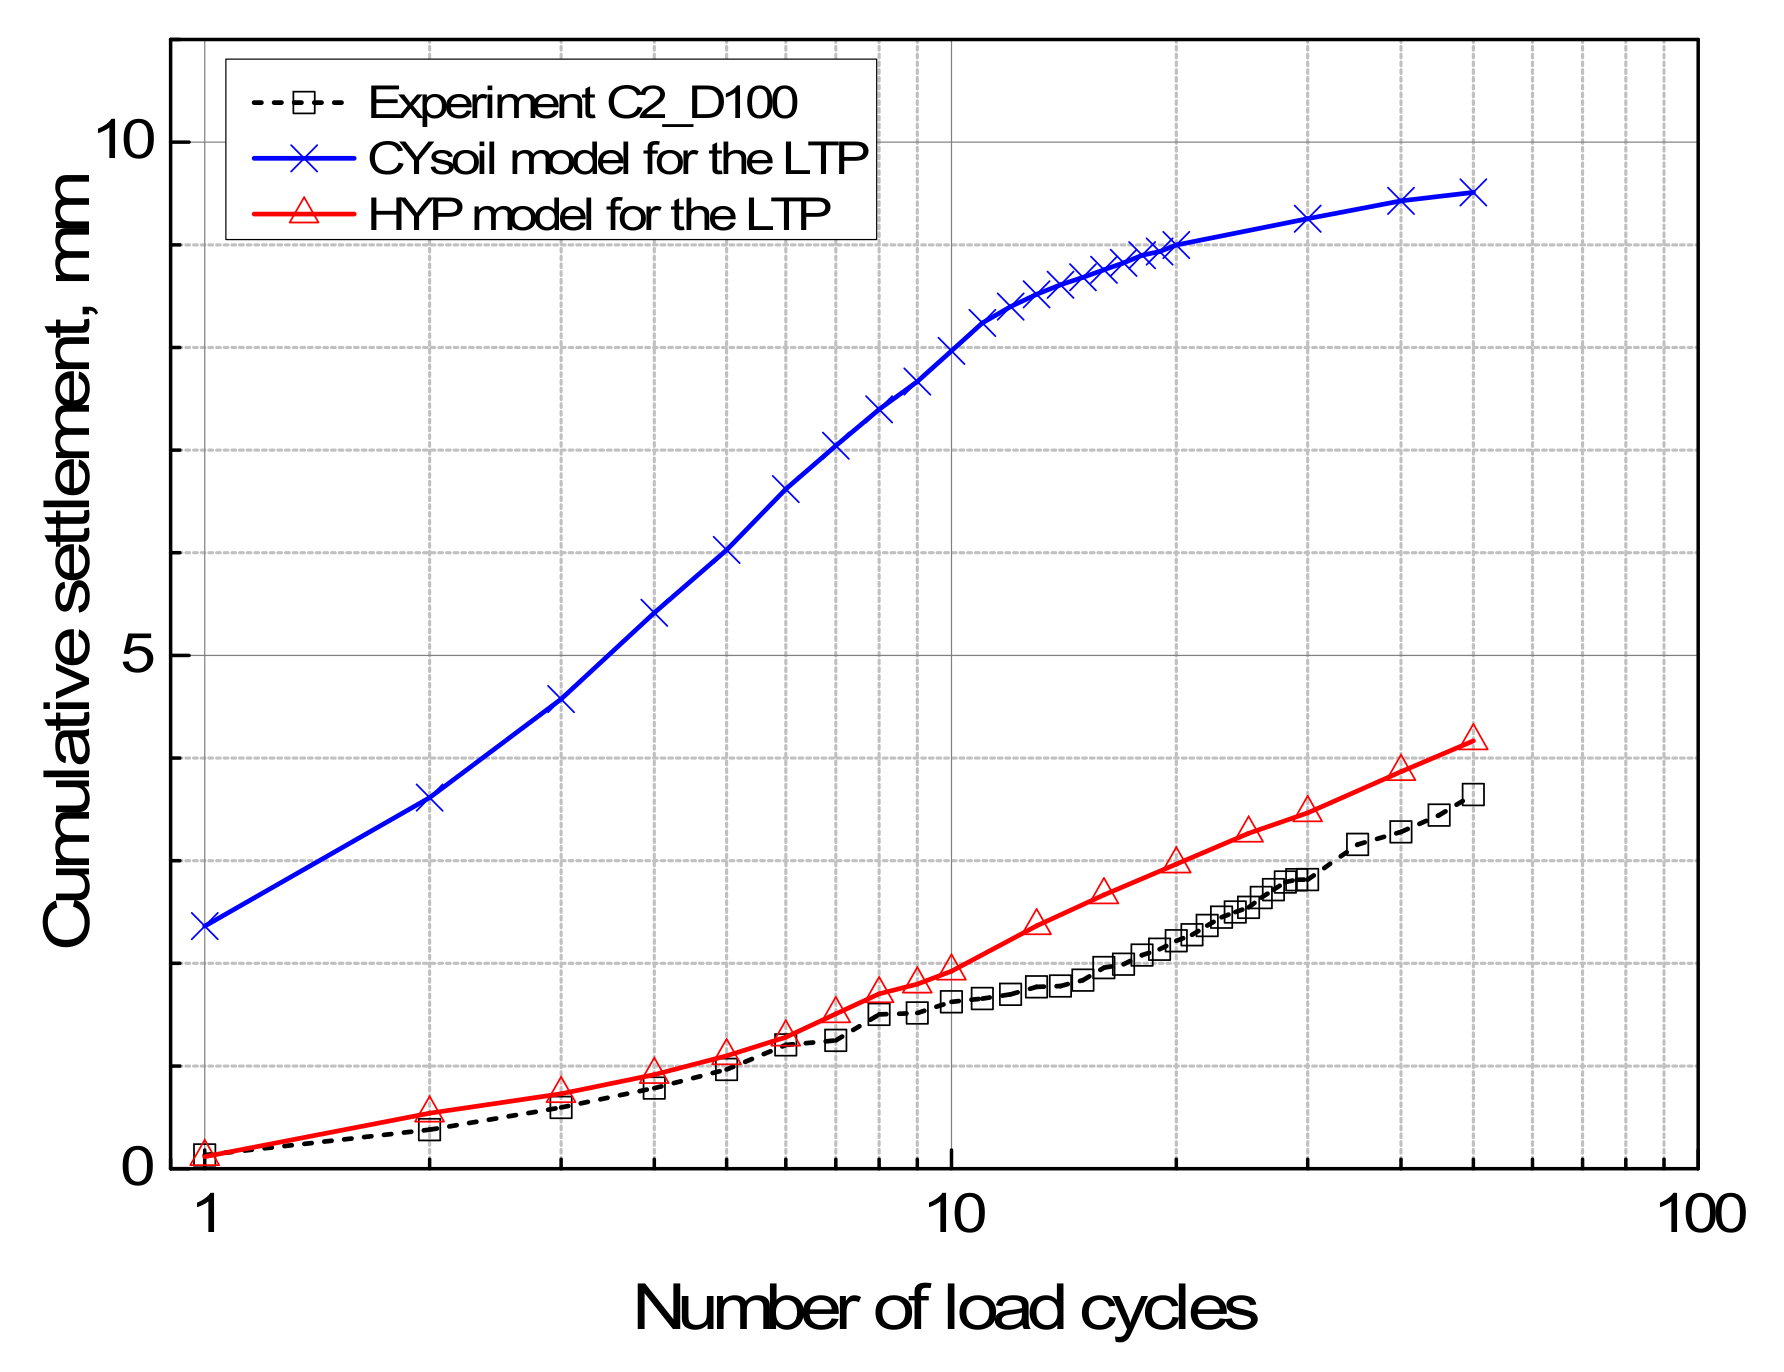
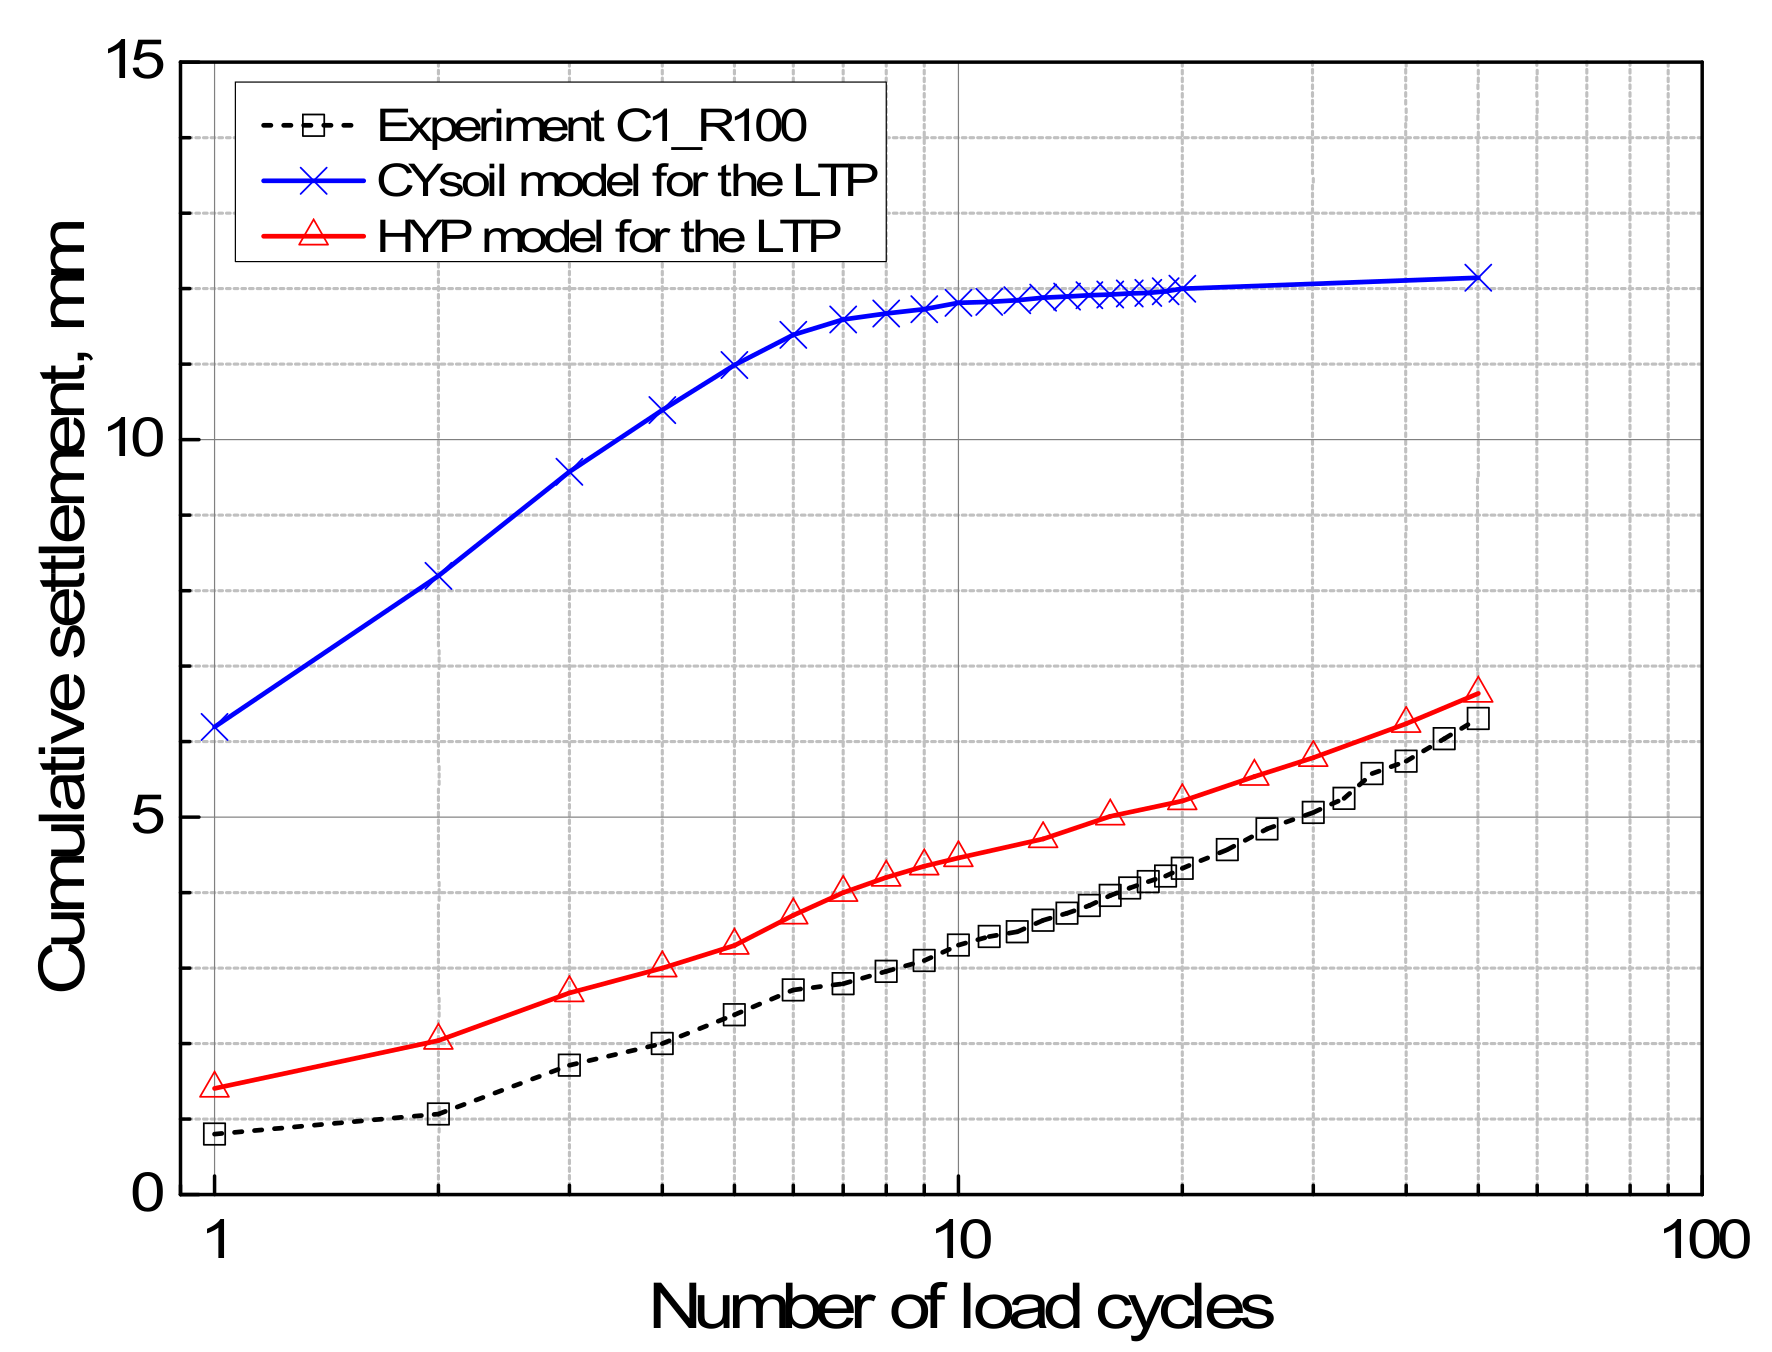
For the monotonic loading, an increase in the surcharge results in a settlements increase. There is a rather good agreement between the numerical results and experimental data. The settlements in the numerical modeling using the HYP model are closer to experimental data than the ones using the CYsoil constitutive model.
Studying the system behavior under cyclic loading allows to draw the following conclusions: (1) there is an insignificant decrease in the rigid inclusion head stress and a slight increase in the soft soil stress, which results in the pile efficacy decrease (arching effect) with the number of load cycles; (2) the cyclic loading type does not significantly affect the soil arching; (3) the cumulative settlements at the LTP base under cyclic loading were figured out, but the cumulation per cycle reduces gradually with the load cycles number. It then leads to a rate decrease in the cumulative settlements; (4) over-consolidated soft soils cumulated less settlements than normally consolidated ones under cyclic loading; (5) the cumulative settlements in the slab case are 50% larger than those in the case without slab; (6) a reduction of the mattress thickness results in a slight pile efficacy increase and a small decrease in the cumulative settlements.
The application of the HYP constitutive model for granular soils well address the behavior of rigid inclusion-improved soils under cyclic loads. The cumulative settlements and pile efficacy decrease. The numerical results obtained by using the HYP model are more accurate than those obtained by the CYsoil model.
The hypoplastic model is a sophisticated model that requires many parameters, some of them are not physical ones and some others are connected. In addition, the adjusting procedure for the parameter’s determination requires a lot of procedures and interrelationships. In this study, due to the lack of laboratory tests, some of the required parameters for the intergranular strain concept are assumed. To obtain more accurate results in the numerical analysis, a more accurate calibration of all the input parameters should be done by back analysis of complementary laboratory tests.

Author Contributions

Conceptualization, D.D. and H.V.P.; methodology, D.D. and H.V.P.; software, H.V.P.; formal analysis, H.V.P.; investigation, H.V.P.; writing—original draft preparation, H.V.P.; writing—review and editing, D.D. and H.V.P.; fund acquisition, H.V.P.; supervision, D.D.; All authors have read and agreed to the published version of the manuscript.

Funding

This research was funded by Ministry of Education and Training of Vietnam, under grant number B2020-MDA-13.

Institutional Review Board Statement

Not applicable.

Informed Consent Statement

Not applicable.

Data Availability Statement

All the used data was available in literature.

Conflicts of Interest

The authors declare no conflict of interest.

Notation

Basic SI units are given in parentheses.
a0Initial over-consolidation parameter of the modified Cam–clay model (Pa)
eVoid ratio (dimensionless)
EYoung’s Modulus (Pa)
EEfficacy (dimensionless)
HEmbankment height (m)
MCritical state ratio of the modified Cam–clay model (dimensionless)
NNumber of load cycles (dimensionless)
pMonotonic or cyclic loading on the top of the model (Pa)
sDistance between the two adjacent piles along x or y-direction (m)
tPeriod of time (s)
λLogarithmic hardening modulus of the modified Cam–clay model (dimensionless)
κLogarithmic elastic bulk modulus of the modified Cam–clay model (dimensionless)
γUnit weight of the material (N/m3)
νPoisson’s ratio (dimensionless)

Abbreviations

2DTwo-dimensional
3DThree-dimensional
CYsoilCap-Yield model
FEMFinite Element Method
HYPHypoplastic model
LTPLoad transfer platform
MCCModified Cam–clay model

References

  1. Pham, H.V.; Dias, D. 3D Numerical Modeling of a Piled Embankment under Cyclic Loading. Int. J. Geomech. 2019, 19, 04019010. [Google Scholar] [CrossRef]
  2. Heitz, C.; Luking, J.; Kempfert, H.-G. Geosynthetic Reinforced and Pile Supported Embankments Under Static and Cyclic Loading. In Proceedings of the 4th European Geosynthetics Conference EuroGeo 4, Edinburgh, UK, 7–10 September 2008; Volume 1, pp. 1–8. [Google Scholar]
  3. Han, G.; Gong, Q.; Zhou, S. Mechanical analysis of soil arching under dynamic loads. In Proceedings of the 2011 Pan-Am CGS Geotechnical Conference, Toronto, ON, Canada, 2–6 October 2011. [Google Scholar]
  4. Han, G.; Gong, Q.; Zhou, S. Soil Arching in a Piled Embankment under Dynamic Load. Int. J. Geomech. 2015, 15, 04014094. [Google Scholar] [CrossRef]
  5. Yu, C.; Pan, L.; Qian, B.; Cai, J. The Behavior of Piled Embankments under Embankment Loads and Traffic Loads. In Proceedings of the Second International Conference on Transportation Engineering, Chengdu, China, 25–27 July 2009; pp. 1566–1571. [Google Scholar]
  6. Houda, M. Comportement sous Chargement Cyclique des Massifs de sol Renforcés par Inclusions Rigides: Expérimentation en Laboratoire et Modélisation Numérique; Université de Grenoble: Grenoble, France, 2016. [Google Scholar]
  7. Houda, M.; Jenck, O.; Emeriault, F. Physical evidence of the effect of vertical cyclic loading on soil improvement by rigid piles: A small-scale laboratory experiment using Digital Image Correlation. Acta Geotech. 2016, 11, 325–346. [Google Scholar] [CrossRef]
  8. Houda, M.; Emeriault, F.; Jenck, O. Rigid Pile Improvement under Vertical Cyclic Loading: 1 g Laboratory Small Scale Modelling. International Journal of Physical Modelling in Geotechnics. 2018, 2018. 19, 89–103. [Google Scholar] [CrossRef]
  9. Houda, M.; Jenck, O.; Emeriault, F. Soft soil improvement by rigid inclusions under vertical cyclic loading: Numerical back analysis. Eur. J. Environ. Civ. Eng. 2018, 13, 1–20. [Google Scholar] [CrossRef]
  10. Han, G.; Gong, Q.; Zhou, S. An Experimental Investigation of Soil Arching under Dynamic Loads. In Proceedings of the 11th International Conference of Chinese Transportation Professionals, Towards Sustainable Transportation Systems, ASCE, Nanjing, China, 14–17 August 2011; pp. 3030–3037. [Google Scholar]
  11. Han, J.; Bhandari, A. Evaluation of Geogrid-Reinforced Pile-Supported Embankments under Cyclic Loading using Discrete Element Method. In Proceedings of the 2009 US-China Workshop on Ground Improvement Technologies, Advances in Ground Improvement, Orlando, FL, USA, 14 March 2009; pp. 242–251. [Google Scholar]
  12. Zhuang, Y.; Li, S. Three-dimensional finite element analysis of arching in a piled embankment under traffic loading. Arab. J. Geosci. 2015, 8, 7751–7762. [Google Scholar] [CrossRef]
  13. Okyay, U.; Dias, D. Dynamic analysis of pile supported embankment systems: Model generation and sensitivity study. In Proceedings of the International Conference on Numerical Computation in Geotechnical Engineering, Skikda, Algeria, 27–29 October 2008; pp. 3–9. [Google Scholar]
  14. Messioud, S.; Okyay, U.S.; Sbartai, B.; Dias, D. Dynamic Response of Pile Reinforced Soils and Piled Foundations. Geotech. Geol. Eng. 2016, 34, 789–805. [Google Scholar] [CrossRef]
  15. Messioud, S.; Sbartai, B.; Dias, D. Estimation of Dynamic Impedance of the Soil–Pile–Slab and Soil–Pile–Mattress–Slab Systems. Int. J. Struct. Stab. Dyn. 2017, 17, 1750057. [Google Scholar] [CrossRef]
  16. Niemunis, A.; Herle, I. Hypoplastic model for cohesionless soils with elastic strain range. Mech. Cohesive-Frict. Mater. 1997, 2, 279–299. [Google Scholar] [CrossRef]
  17. Gudehus, G.; Amorosi, A.; Gens, A.; Herle, I.; Kolymbas, D.; Mašín, D.; Wood, D.M.; Niemunis, A.; Nova, R.; Pastor, M.; et al. The soilmodels info project. Int. J. Numer. Anal. Methods Geomech. 2008, 32, 1571–1572. [Google Scholar] [CrossRef]
  18. Von Wolffersdorff, P.-A.; Schwab, R. The Uelzen I Lock—Hypoplastic finite-element analysis of cyclic loading. Bautechnik 2009, 86, 64–73. [Google Scholar] [CrossRef]
  19. Salciarini, D.; Tamagnini, C. A hypoplastic macroelement model for shallow foundations under monotonic and cyclic loads. Acta Geotech. 2009, 4, 163–176. [Google Scholar] [CrossRef]
  20. Poblete, M.; Fuentes, W.; Triantafyllidis, T. On the simulation of multidimensional cyclic loading with intergranular strain. Acta Geotech. 2016, 11, 1263–1285. [Google Scholar] [CrossRef]
  21. Li, Z.; Kotronis, P.; Escoffier, S.; Tamagnini, C. A hypoplastic macroelement for single vertical piles in sand subject to three-dimensional loading conditions. Acta Geotech. 2016, 11, 373–390. [Google Scholar] [CrossRef] [Green Version]
  22. Ochmański, M.; Modoni, G.; Bzówka, J. Numerical analysis of tunnelling with jet-grouted canopy. Soils Found. 2015, 55, 929–942. [Google Scholar] [CrossRef] [Green Version]
  23. Moormann, C.; Lehn, J.; Aschrafi, J. Design of reinforced piled earth structures under static and variable loads. In Proceedings of the GeoAmericas 2016 3rd Pan-American Conference on Geosynthetics, Miami, FL, USA, 10–13 April 2016. [Google Scholar]
  24. ASIRI. Recommandations pour la Conception, le Dimensionnement, L’Exécution et le Contrôle de L’Amélioration des Sols de Fondation par Inclusions Rigides. 2012. Projet National ASIRI (Amélioration des Sols par les Inclusions Rigides). Available online: www.asiri.irex.asso.fr (accessed on 20 December 2020).
  25. Jenck, O.; Dias, D.; Kastner, R. Three-dimensional modelling of an embankment over soft soil improved by rigid piles. Proceedings of Sixth European Conference on Numerical Methods in Geotechnical Engineering, Graz, Austria, 6–8 September 2006; pp. 817–822. [Google Scholar]
  26. Jenck, O.; Dias, D.; Kastner, R. Discrete element modelling of a granular platform supported by piles in soft soil—Validation on a small scale model test and comparison to a numerical analysis in a continuum. Comput. Geotech. 2009, 36, 917–927. [Google Scholar] [CrossRef]
  27. Jenck, O.; Dias, D.; Kastner, R. Three-dimensional numerical modeling of a piled embankment. Int. J. Geomech. 2009, 9, 102–112. [Google Scholar] [CrossRef]
  28. Zhuang, Y.; Wang, K.Y.; Liu, H.L. A simplified model to analyze the reinforced piled embankments. Geotext. Geomembr. 2014, 42, 154–165. [Google Scholar] [CrossRef]
  29. Zhuang, Y.; Wang, K. Finite element analysis on the dynamic behavior of soil arching effect in piled embankment. Transp. Geotech. 2018, 14, 8–21. [Google Scholar] [CrossRef]
  30. Pham, H.V.; Dias, D.; Dudchenko, A. 3D modeling of geosynthetic-reinforced pile-supported embankment under cyclic loading. Geosynth. Int. 2020, 27, 157–169. [Google Scholar] [CrossRef]
  31. H.K.S. Abaqus Analysis User’s Manual, Version 6.14. Dassault Systèmes: Paris, France, 2014.
  32. Ishihara, K. Soil Behavior in Earthquake Geotechnics; Oxford University Press: Oxford, UK; New York, NY, USA, 1996; ISBN 0198562241. [Google Scholar]
  33. Habib, S.; Dehnavi, Y.; Alavi, A. Numerical modeling of stress-strain behavior of sand under cyclic loading. Eng. Geol. 2010, 116, 53–72. [Google Scholar] [CrossRef]
Figure 1. Geometry of the physic model: (a) Plan view; (b) View A-A [6].
Applsci 11 01426 g001
Figure 2. Types of monotonic and cyclic loadings for the experimental studies [6] (from Houda (2016)).
Applsci 11 01426 g002
Figure 3. Details of the cyclic loading: (a) for the first six load cycles; (b) for the following 44 cycles [6].
Applsci 11 01426 g003
Figure 4. Representative elementary volume model used for 3D numerical analyses.
Applsci 11 01426 g004
Figure 5. 3D mesh of the quarter of a pile model.
Applsci 11 01426 g005
Figure 6. Experimental and numerical results in triaxial tests on the gravel sample.
Applsci 11 01426 g006
Figure 7. Experimental and numerical results in the oedometer test for the compressible soil sample.
Applsci 11 01426 g007
Figure 8. Experimental and numerical efficacy coefficients in test M_D100.
Applsci 11 01426 g008
Figure 9. Experimental and numerical efficacies in test C1_D100.
Applsci 11 01426 g009
Figure 10. Experimental and numerical efficacies in test C2_D100.
Applsci 11 01426 g010
Figure 11. Numerical results of average vertical stresses applied on inclusion head and soft soil in test C1_D100: (a) on inclusion head; (b) on soft soil.
Applsci 11 01426 g011
Figure 12. Experimental and numerical settlements of LTP base in test M_D100.
Applsci 11 01426 g012
Figure 13. Experimental and numerical cumulative settlements in test C1_D100.
Applsci 11 01426 g013
Figure 14. Experimental and numerical cumulative settlements in test C2_D100.
Applsci 11 01426 g014
Figure 15. Experimental and numerical efficacies in test C1_R100.
Applsci 11 01426 g015
Figure 16. Experimental and numerical efficacies in test C2_R100.
Applsci 11 01426 g016
Figure 17. Experimental and numerical settlements at the LTP base in test M_R100.
Applsci 11 01426 g017
Figure 18. Experimental and numerical cumulative settlements in test C1_R100.
Applsci 11 01426 g018
Figure 19. Experimental and numerical cumulative settlements in test C2_R100.
Applsci 11 01426 g019
Figure 20. Experimental and numerical efficacies in test C1_D50.
Applsci 11 01426 g020
Figure 21. Experimental and numerical cumulative settlements in test C1_D50.
Applsci 11 01426 g021
Table 1. Geotechnical properties of gravel and compressible soil used in the physic model [6].
Soil PropertiesUnitGravel (LTP)Compressible Soil
Peak friction angle, φ’peak°45-
Residual friction angle, φ’residual°42-
Cohesion, c’kPa0-
Dilatancy, ψ°5-
Compressibility index, Cc--1.8
Swelling index, Cs--0.1
Initial void ratio, e0--7
Pre-consolidation pressure, σpkPa-3
Table 2. Testing cases used in the tests of Houda.
Testing ConditionsLoad Transfer Platform thicknessTesting TypeTesting NameNumber of Load Cycles
With a slab100 mmMonotonicM_D100
Cyclic 1C1_D10050
Cyclic 2C2_D10050
Without a slab100 mmMonotonicM_R10050
Cyclic 1C1_R10050
Cyclic 2C2_R100
With a slab50 mmCyclic 1C1_D5050
Table 3. The HYP model parameters considered for the LTP in the analyses.
No.ParametersUnitSymbolValue
1The critical state friction angle°φc39
2The granulate hardness that controls the shape of the void ratio curvePahs5800
3The exponent that controls the shape of the void ratio curve-n0.28
4The minimum void ratio at zero pressure-ed00.53
5The critical void ratio at zero pressure-ec00.84
6The maximum void ratio at zero pressure-ei01.00
7The exponent that controls a dependency of peak friction angle on relative density-α0.10
8The exponent that controls the dependency of soil stiffness on relative density-β0.35
9The parameter that controls the initial shear modulus upon 180° strain path reversal and in the initial loading-mR5
10The constant that controls the initial shear modulus upon 90° strain path reversal-mT2
11The size of the elastic strain range in the strain space-R1 × 10−4
12The constant that manages the shape of stiffness degradation curve-βr0.5
13The constant that controls the shape of stiffness degradation curve-χ6
Table 4. The MCC model parameters considered for the compressible soil.
Type/ParametersκνλMa0(kPa)eo
Compressible soil0.020.30.91.3030007.4
Table 5. A comparison of tests C1_D100 and C2_D100 in terms of pile efficacy with the specific number of load cycles.
Cyclic Loading TestsTest C1_D100Test C2_D100
1st Cycle30th Cycle50th Cycle1st Cycle30th Cycle50th Cycle
Experimental81%86%84%86%89%86%
Numerical (HYP model)82%79%77%86%79%79%
Table 6. A comparison of tests C1_D100 and C2_D100 in terms of cumulative settlement with the specific number of load cycles (in millimeter).
Cyclic Loading TestsTest C1_D100Test C2_D100
1st Cycle30th Cycle50th Cycle1st Cycle30th Cycle50th Cycle
Experimental 27.59.60.22.83.6
Numerical (HYP model)2.28.410.10.23.44.2
Numerical (CYsoil model)4.118.720.02.49.29.5
Publisher’s Note: MDPI stays neutral with regard to jurisdictional claims in published maps and institutional affiliations.

