Article

EMG Based Gesture Recognition Using the Unbiased Difference Power

1
Department of Electronic Engineering, Soongsil University, Seoul 07040, Korea
2
Department of Software Convergence, Soongsil University, Seoul 07040, Korea
*
Author to whom correspondence should be addressed.
Appl. Sci. 2021, 11(4), 1526; https://doi.org/10.3390/app11041526
Submission received: 24 December 2020 / Revised: 31 January 2021 / Accepted: 4 February 2021 / Published: 8 February 2021
(This article belongs to the Section Electrical, Electronics and Communications Engineering)

Abstract

:
In this paper, we propose an unbiased difference power that is robust against noise as a feature for electromyography (EMG)-based gesture recognition. The proposed unbiased difference power is obtained by subtracting the noise-biased part from the difference power. We derive the difference power equation and discover that the difference power is biased by twice the noise power. For noise power estimation, we utilized the characteristics of the EMG signal and estimated the noise power from the resting period. For performance evaluation, we used EMG signals provided by the open source Ninapro project database. We used the recognition accuracy as an evaluation index. We compare the recognition accuracy of the case using the proposed unbiased feature with those of two conventional cases. Experimental results show that the proposed unbiased difference power improves the accuracy compared with conventional ones. As the noise level increases, cases where the proposed unbiased difference power is used show a clear improvement in accuracy compared with the two conventional cases. For the signal-to-noise ratio (SNR) of 0 dB, the proposed unbiased difference power improves the average accuracy by more than 12%.

1. Introduction

Electromyography (EMG) is an electrical signal observed from muscle fibers related to gestures or movements. For activating movements, the brain generates electrical signals and transmits signals to muscle fiber through spinal cord and nerve fiber. The electrical signal called electromyography controls the contraction and extension of muscles. EMG-based researches for medical aids and smart devices have been actively conducted, such as prosthetic limbs for amputated patients [1,2] and armband-type controllers for human control interfaces [3,4]. To make this research successful, a high accuracy of gesture recognition is necessary.
EMG-based gesture recognition involves classifying unknown observed data into the most likely gesture which belongs to target gestures. Gesture recognition generally comprises two aspects: feature extraction and classification [5]. Research works on feature extraction and classification have been studied to improve the recognition accuracy [6,7,8].
Feature extraction is the process of computing vectors representing signal characteristics. Moreover, the feature extraction is the basis for EMG-based gesture recognition [9]. Because the feature extraction is crucial in EMG-based gesture recognition, various features in the time-frequency domain have been studied [10,11,12,13]. Rafiee et al. introduce the feature extraction method using continuous wavelet coefficient which enables continuous wavelet coefficients which enable to distinguish complicated gestures for classification [10]. Ju et al. introduce nonlinear features and find best combination with the outstanding recognition accuracy in fourteen features [11]. Altin compares the elbow gesture recognition accuracy using fifteen time-frequency domain features [12]. Arief et al. also compare 5 kinds of time series features [13].
Most EMG features are deteriorated by inevitable noise added during the recording. To handle the problem, various studies have been conducted to reduce the effect of noise [14,15,16,17]. Several studies have been conducted to identify features that are robust to noise problems [14,15]. These studies mainly compare the accuracies using different features in various noise levels, and confirm which features are relatively robust to noise. In some studies, denoising algorithms are intorduced to reduce noise contamination in EMG signals [16,17]. These studies remove the noise by thresholding wavelet coefficients. Denoising algorithms may induce the information loss [18]. The feature selection is not a fundamental solution for making the gesture recognition robust against the noise.
The difference power is a feature frequently used in EMG-based gesture recognition [19,20,21,22]. However, the difference power is biased by the noise contaminated in the EMG signal. Because of the noise bias, the difference power varies greatly depending on noise levels. Therefore, the noise bias must be removed from the extracted difference power for the robust gesture recognition against noise.
In this paper, we propose a feature known as “unbiased difference power” for the robust gesture recognition of noise. The unbiased difference power is extracted by excluding the noise-biased part from the difference power. To determine the noise-biased part, we derive the difference power mathematically. For the performance evaluation, we use the recognition accuracy. In addition, the recognition accuracy based on the proposed unbiased difference power is compared with the accuracy of the two conventional cases. Only when the proposed unbiased difference power is used as a feature was the recognition accuracy maintained, even when the signal-to-noise ratio (SNR) decreased.

2. Materials and Methods

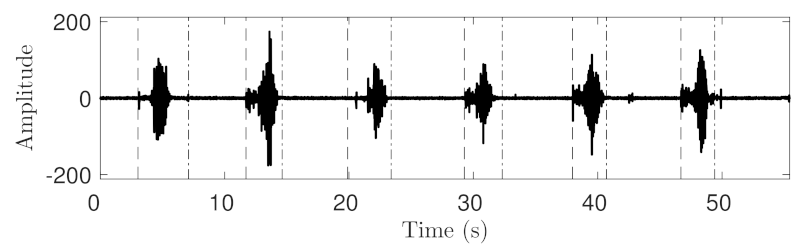
2.1. Database Information

In this study, the publicly-released Ninapro project database 2 [23,24] is used. The database has been widely used for EMG-related research because of its experimental reliability, EMG data for various gestures, and good data quality with low noise. Exercise A in database 2 contains data on 17 gestures from 40 subjects. EMG was recorded from forearm, triceps, and biceps. Also, hand kinematics and dynamics are recorded simultaneously. Eight electrodes are located on forearm at even interval, two electrodes are placed on main activity spots of flexor and extensor, and two electrodes are placed on the triceps and biceps. Subjects are asked to imitate the motions shown on the screen of the laptop with their right hand. The motions are selected from the hand taxonomy as well as from hand robotics literature. Subjects are asked to perform 6 consecutive repetitions for each motion. Each motion repetition lasted around 5 s and was followed by a 3-s resting period. The whole exercise A lasted around 23 min. Detailed information about the database can be found in the research of Atzori et al. [23]. We calculate the SNR of every recorded signal, and averaged them by subject, motion, and channel. The subjects, motions, or channels with average SNR lower than 20 dB are excluded from the study. Ten motions of 14 subjects in the Ninapro database 2 exercise A are used for the evaluation. Table 1 lists 10 motions used for the evaluation.

2.2. EMG Gesture Recognition

Many EMG gesture recognitions are based on signal representation and classification [5]. In various studies, feature extraction is used for signal representation. In this study, the difference power is used as the feature. Let x [ n ] be the input signal, then the difference power is expressed as
E [ Δ x [ n ] ] = E [ ( x [ n ] x [ n 1 ] ) 2 ] .
Classification is a stage for inferring the class of an unknown observation (test data) using information from earlier observations (training data). In this study, we use linear discriminant analysis (LDA) as a classifier. Although LDA may not be the most efficient classifier, LDA is a commonly-used and basic method due to its simplicity, robust classification to long-term usage, and its reasonable performance in gesture recognition [25,26,27]. Considering the main contribution of the paper is to propose the unbiased difference feature, we tested the proposed feature using the LDA classifier. However, for more rigorous performance evaluation and practical usage, it would be necessary to evaluate the performance using various classifiers. For LDA, we use a discriminant function with the mean value and pooled covariance of the training data to predict the test data class. For the performance evaluation we use classification accuracy. The classification accuracy is calculated as 100 N c N , where N c is the number of correct trials and N is total number of trials. We use the leave-one-out validation 100 times and we set N at 100.
One reason for the deterioration in classification performance is the noise added to the signals. Figure 1 shows the feature variation for different noise levels. SNR, a measure of noise level in Figure 1 is S N R = 10 l o g 10 P s i g n a l P n o i s e , where P s i g n a l and P n o i s e is power of noiseless signal and noise respectively. It is observed in Figure 1 that the difference power feature is highly deteriorated by noise and increased as SNR decreases.

3. Proposed Method

In this paper, we propose a feature called the unbiased difference power for robust classification through various noise levels. We preclude a noise-biased part from the noisy feature to extract the proposed unbiased difference power. The degree of noise bias is confirmed by deriving the equation of the difference power. To preclude the noise-biased part, noise power estimation is necessitated. The noise power is estimated using the characteristics of the EMG signal.

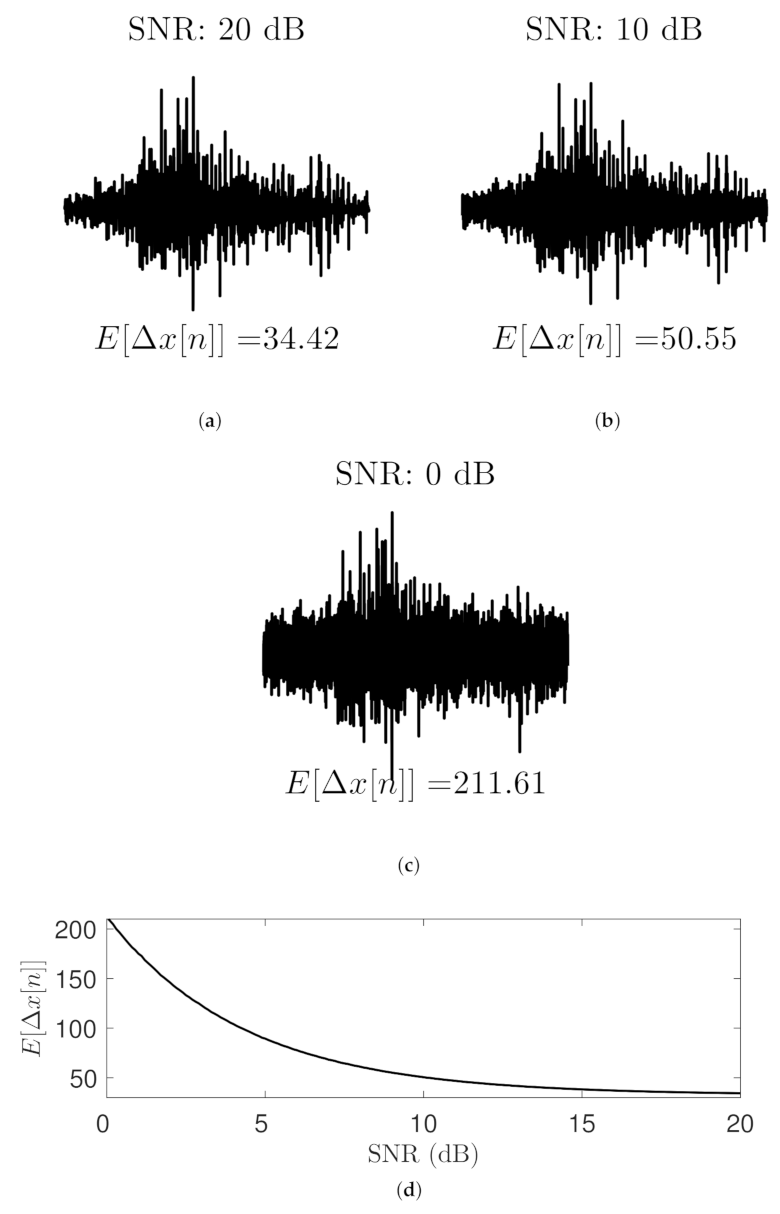
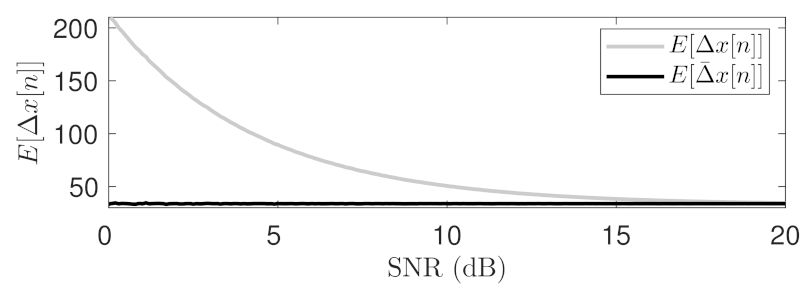
3.1. Unbiased Difference Power

To extract the unbiased difference power, we subtract the noise-biased part from the noisy feature. By deriving the noisy features, we demonstrate the degree of noise bias. The recorded signal x [ n ] can be expressed using the noiseless EMG signal s [ n ] and noise signal v [ n ] as
x [ n ] = s [ n ] + v [ n ] .
Let Δ x [ n ] be
Δ x [ n ] = ( x [ n ] x [ n 1 ] ) 2 .
Taking the expectation of defined Δ x [ n ] , we can obtain difference power as
E [ Δ x [ n ] ] = E [ s 2 [ n ] + s 2 [ n 1 ] + v 2 [ n ] + v 2 [ n 1 ] 2 s [ n ] s [ n 1 ] 2 v [ n ] v [ n 1 ] ] .
Assuming that both the noiseless EMG, s [ n ] , and the noise, v [ n ] , are uncorrelated, Equation (4) is reduced to
E [ Δ x [ n ] ] = E [ s 2 [ n ] + s 2 [ n 1 ] + v 2 [ n ] + v 2 [ n 1 ] ] = 2 σ s 2 + 2 σ v 2 ,
where σ s 2 = E [ s 2 [ n ] ] and σ v 2 = E [ v 2 [ n ] ] .
As can be seen in Equation (5), the difference power feature is biased by 2 σ v 2 . Thus, the feature becomes more contaminated as the noise power, σ v 2 , increases more.
Intuitively, the simplest method to remove the noise effect on the difference power is to subtract the noise power as
Δ ¯ x [ n ] = Δ x [ n ] 2 σ v 2 .
Subsequently, we obtain
E [ Δ ¯ x [ n ] = E [ Δ x [ n ] 2 σ v 2 ] = E [ Δ x [ n ] ] 2 σ v 2 .
In addition, Equation (7) expresses the unbiased difference power.
Figure 2 shows the difference between the difference power and unbiased difference power. The value of the difference power increases as the SNR decreases. As mentioned above, the increase in the difference power as the SNR decreased is due to noise bias. However, using the proposed unbiased difference power, the feature value stabilizes, although the SNR decreases. It is observed that the noise bias is removed in the unbiased difference power.

3.2. Noise Power Estimation
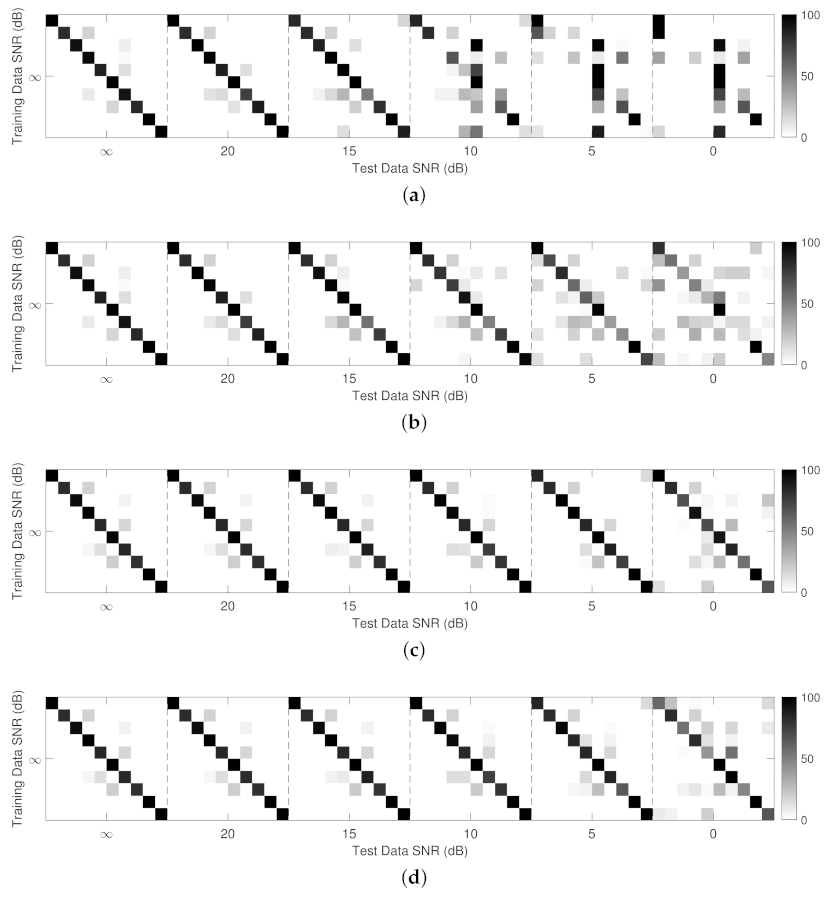
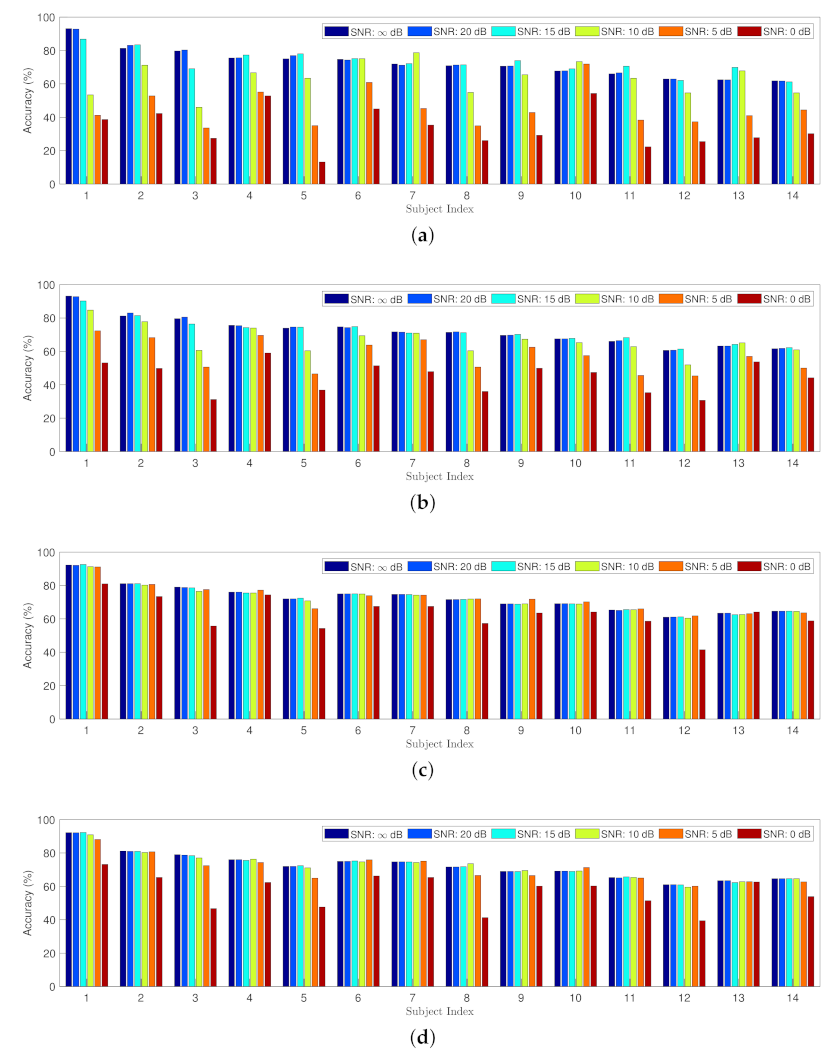
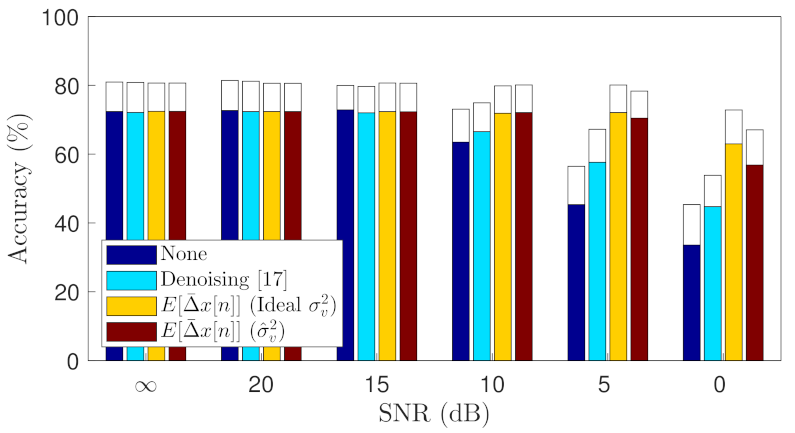
To extract the unbiased difference power, information regarding the noise power is required. Although the Ninapro project database 2 has good data quality with low noise, it is impossible to know and control SNR in EMG signals since there are countless noise sources, which are unknown and cannot be controlled. The best way to estimate SNR in EMG is to use the resting period when target muscles are fully relaxed without any motion activity and force since ideally EMG signals are not supposed to be observed in the resting period, i.e., signals observed in the resting period are only noise components [28,29]. Assuming the resting period is totally composed of noise signals, we can estimate the noise power. We used the concept of minimum statistical noise estimation method [30,31]. Since the minimum statistical method basically tracks the minimum noisy signal by continuously averaging past power spectral values, it shows good performance and is suitable to apply to the EMG signal. Figure 3 shows the recorded EMG signals. The dashed lines represent the start and end points of the gestures. In Figure 3, it is clear that the amplitude of the signal in the resting period is minute compared with that of the acting period. Using the characteristics, we can estimate the noise power as
σ v 2 ^ = 1 N k = 1 N ( x [ n k ] ) 2 ,
where k denotes the resting period of the EMG signal, N is the length of the resting period, and n stands for the time just before the start point of gestures. Figure 4 compares the unbiased difference power using two different noise powers. The unbiased difference power using the estimated noise power shows a similar value with the unbiased difference power based on the ideal noise power case. This means that the noise power is estimated well using the proposed noise power estimation method.

4. Result

We generated a noise signal using raw signal information. To add noise to the raw signal, which is known as noisy signal, we added additive Gaussian noise with zero mean and σ v n o i s e 2 variance to the raw signal. The variance of noise signal, σ v n o i s e 2 is calculated as
σ v n o i s e 2 = σ s 2 10 S N R 10 σ v r a w 2 , f o r S N R r a w S N R ϵ , o t h e r w i s e
where σ s 2 is variance of activated signal, and σ v r a w 2 is the resting period variance of raw signal. ϵ is a small value, which is set 10 5 in this study. S N R r a w is a SNR of the raw signal, which is calculated as S N R r a w = 10 log 10 ( σ s 2 / σ v r a w 2 ) . We set five different SNR levels between 0 and to 20 dB.
First, we confirm the classification rate of the raw data. Figure 5 shows the classification accuracy of the raw data. In this case, both the training and test data are selected from the raw data. Because these results confirm the accuracy of the raw data, we only used the difference power as a feature. All subjects showed an average classification accuracy of more than 60%.
For the performance evaluation, we compare the results using the proposed unbiased difference power with two different conventional cases: applying no denoising algorithm or unbiased feature (None) and conventional denoising algorithm based on wavelet reconstruction (denoising) [17]. The proposed unbiased difference power is divided into two categories based on the method used to obtain the noise power.
Leave-one-out validation is used for the performance evaluation. Moreover, we repeated the validation for 100 times to ensure the evaluation result. For the classification using the proposed unbiased difference power, noiseless feature, E [ Δ ¯ x [ n ] ] = E [ Δ x [ n ] ] 2 σ v r a w 2 , is used for training set, whereas calibrated noisy features, E [ Δ ¯ x [ n ] ] = E [ Δ x [ n ] ] 2 σ v n o i s e 2 , is used as test data. For the σ v n o i s e 2 , we use the ideal noise power and estimated noise power.
Figure 6 shows the confusion matrices of subject 1 which shows the best performance in classification of raw data. For the case none shown in Figure 6a, the diagonal, which represents the accuracy, decreases with the SNR. This phenomenon, however, is improved by applying denoising or using the unbiased difference power. In particular, the confusion matrices of the cases using the unbiased difference power in Figure 6c,d show outstanding improvement, i.e., low SNRs, compared with those of the denoising case in Figure 6b.
Then, to expand the confirmed results in single subject, we confirm the classification results of all subjects used for evaluation. Figure 7 shows the changes in the recognition accuracy of 14 subjects in four different situations. For the none case, the accuracy decreases rapidly with the SNR regardless of the subject, as shown in Figure 7a. The accuracy decrease associated with the SNR occurs even in the denoising case, as shown in Figure 7b. However, using the proposed unbiased feature, the accuracy is maintained even when the SNR decreases. As shown in Figure 7c,d, even when the SNR is 5dB, the accuracy of all subjects is maintained. When the SNR is 0dB, a slight decrease in accuracy appears in most of the subjects, but the result remained the highest. These results indicate that the proposed unbiased difference power enables robust gesture recognition against noise.
Finally, to summarize the results shown in Figure 7, we calculate the average accuracy through subjects. The subject averaged recognition accuracy graph shown in Figure 8 shows the effect of the proposed unbiased feature. Figure 8 shows a comparison of the subject average accuracy of the four cases. For an SNR exceeding 15dB, four cases indicate similar recognition accuracies. However, for 10dB, the accuracy of two conventional cases begins to decrease whereas the two cases using the proposed unbiased difference power maintain similar accuracies to that of the higher SNR. As the SNR decreases, recognition accuracy decreases in all cases in general, but the recognition accuracy using the proposed unbiased feature remains the highest. Comparing the recognition accuracies of the noiseless and 0 dB cases, it was discovered that the accuracy of the the none case decreased by approximately 39%, whereas it decreased by 27% for the denoising case. However, for the two cases using the proposed unbiased difference power, only approximately 15% and 9% decrease is observed for the estimated and ideal noise cases, respectively. These results show that the proposed unbiased difference power is extremely effective for gesture recognition in noisy situations.

5. Conclusions

In this study, we propose an effective unbiased feature for a robust gesture recognition of noise. We extract an unbiased difference power by subtracting twice the noise power, which is a noise bias for the difference power. The validity of the proposed unbiased feature is confirmed by deriving an equation using the feature. For the noise power, we use the ideal and calculated values to confirm the difference between the real and ideal situations. The noise power estimation was simply obtained by calculating the power of resting period. Due to the characteristics of EMG and background noise, it is possible to simplify the noise estimation process. For performance evaluation, the recognition accuracy is used as an index. Moreover, we compared the results using the proposed unbiased feature with the results of the other two cases. None of the denoising algorithms were used in the first case, whereas a denoising algorithm based on wavelet reconstruction was used in the second case. The recognition accuracy by not applying any denoising algorithms decreases significantly as the SNR decreased. By applying the denoising algorithm, the rapid decrease in the previous case is alleviated. However, the results obtained using the proposed unbiased difference power indicate that the decoding accuracy is maintained, although the SNR decreases. The reason why the decoding accuracy is maintained although the SNR decreases is that the proposed unbiased feature maintains a similar value even under different noise situations, whereas difference power varies greatly. The results indicate that the proposed unbiased difference power effectively overcomes the interference caused by noise in the gesture recognition.
For future work, it is necessary to apply the proposed unbiased difference power to a recorded noisy signal. Recording the EMG signal from various noisy situations and confirming the performance of the unbiased difference power should be done for practical uses. The evaluation with various classifiers is also needed for more rigorous performance evaluation. Moreover, more unbiased features should be derived. Since we only introduced an unbiased difference power, more unbiased features could be introduced in similar methods. These unbiased features would help EMG-based gesture recognition to be more robust to noise.

Author Contributions

Conceptualization, H.-C.S.; methodology, K.K.; software, K.K.; validation, K.K. H.-C.S.; writing—original draft preparation, K.K.; writing—review and editing, K.K., H.-C.S.; visualization, K.K.; supervision, project administration, and funding acquisition, H.-C.S. All authors have read and agreed to the published version of the manuscript.

Funding

This work was supported by the National Research Foundation of Korea(NRF) grant funded by the Korea government(MEST) (No. 2020R1A2C1101978).

Conflicts of Interest

The authors declare no conflict of interest.

Abbreviations

The following abbreviations are used in this manuscript:
EMGElectromyography
SNRSignal-to-noise ratio
LDALinear discriminant analysis

References

  1. Matrone, G.C.; Cipriani, C.; Secco, E.L.; Magenes, G.; Carrozza, M.C. Principal components analysis based control of a multi-DoF underactuated prosthetic hand. J. Neuroeng. Rehabil. 2010, 7, 7–16. [Google Scholar] [CrossRef] [Green Version]
  2. Castellini, C.; Van Der Smagt, P. Surface EMG in advanced hand prosthetics. Biol. Cybern. 2009, 100, 35–47. [Google Scholar] [CrossRef] [PubMed] [Green Version]
  3. Naik, G.R.; Nguyen, H.T. Non Negative Matrix Factorization for the Identification of EMG Finger Movements: Evaluation Using Matrix Analysis. IEEE J. Biomed. Health Inf. 2015, 19, 478–485. [Google Scholar] [CrossRef]
  4. Lu, Z.; Chen, X.; Li, Q.; Zhang, X.; Zhou, P. A hand gesture recognition framework and wearable gesture-based interaction prototype for mobile devices. IEEE Trans. Hum.-Mach. Syst. 2014, 44, 293–299. [Google Scholar] [CrossRef]
  5. Englehart, K.; Hudgins, B.; Parker, P.A.; Stevenson, M. Classification of the myoelectric signal using time-frequency based representations. Med. Eng. Phys. 1999, 21, 431–438. [Google Scholar] [CrossRef]
  6. Atzori, M.; Gijsberts, A.; Kuzborskij, I.; Elsig, S.; Mittaz Hager, A.G.; Deriaz, O.; Castellini, C.; Muller, H.; Caputo, B. Characterization of a Benchmark Database for Myoelectric Movement Classification. IEEE Trans. Neural Syst. Rehabil. Eng. 2015, 23, 73–83. [Google Scholar] [CrossRef] [PubMed]
  7. Chowdhury, R.H.; Reaz, M.B.I.; Ali, M.A.M. Surface Electromyography Signal Processing and Classification Techniques. Sensors 2013, 13, 12431–12466. [Google Scholar] [CrossRef]
  8. Boyali, A.; Hashimoto, N. Spectral Collaborative Representation based Classification for hand gestures recognition on electromyography signals. Biomed. Signal Process. Control. 2016, 24, 11–18. [Google Scholar] [CrossRef] [Green Version]
  9. Jiang, N.; Dosen, S.; Farina, D. Myoelectric Control of Artificial Limbs—Is There a Need to Change Focus? IEEE Signal Process. Mag. 2012, 29, 12–15. [Google Scholar] [CrossRef]
  10. Rafiee, J.; Rafiee, M.A.; Yavari, F.; Schoen, M.P. Feature Extraction of Forearm EMG Signals for Prosthetics. Expert Syst. Appl. 2011, 38, 4058–4067. [Google Scholar] [CrossRef]
  11. Ju, Z.; Ouyang, G.; Wilamowska-Korsak, M.; Liu, H. Surface EMG Based Hand Manipulation Identification via Nonlinear Feature Extraction and Classification. IEEE Sens. J. 2013, 13, 3302–3311. [Google Scholar] [CrossRef]
  12. Altin, C.; Er, O. Comparison of different time and frequency domain feature extraction methods on elbow gesture’s EMG. Eur. J. Interdiscip. Stud. 2016, 2, 35–44. [Google Scholar] [CrossRef] [Green Version]
  13. Arief, Z.; Sulistijono, I.A.; Ardiansyah, R.A. Comparison of five time series EMG features extractions using Myo Armband. In Proceedings of the International Electronics Symposium, Surabaya, Indonesia, 29–30 September 2015; pp. 11–14. [Google Scholar]
  14. Phinyomark, A.; Limsakul, C.; Phukpattaranont, P. A Novel Feature Extraction for Robust EMG Pattern Recognition. J. Comput. 2009, 1, 71–80. [Google Scholar]
  15. Phinyomark, A.; Qu, F.; Chrbonnier, S.; Serviere, C.; Tarpin-Benard, F.; Laurillau, Y. EMG feature evaluation for improving myoelectric pattern recognition robustness. Expert Syst. Appl. 2013, 40, 4832–4840. [Google Scholar] [CrossRef]
  16. Luca, C.J.D.; Gilmore, L.D.; Kuznetsov, M.; Roy, S.H. Filtering the surface EMG signal: Movement artifact and baseline noise contamination. J. Biomech. 2010, 43, 1573–1579. [Google Scholar] [CrossRef]
  17. Phinyomark, A.; Phukpattaranont, P.; Limsakul, C. Wavelet-Based Denoising Algorithm for Robust EMG Pattern Recognition. Fluct. Noise Lett. 2011, 10, 157–167. [Google Scholar] [CrossRef]
  18. Messer, S.R.; Agzarian, J.; Abbott, D. Optimal wavelet denoising for phonocardiograms. Microelectron. J. 2001, 32, 931–941. [Google Scholar] [CrossRef]
  19. Khan, S.M.; Khan, A.A.; Farooq, O. Selection of Features and Classifiers for EMG-EEG-Based Upper Limb Assistive Devices—A Review. IEEE Rev. Biomed. Eng. 2020, 13, 248–260. [Google Scholar] [CrossRef]
  20. Phinyomark, A.; Quaine, F.; Charbonnier, S.; Serviere, C.; Tarpin-Bernard, F.; Laurillau, Y. Feature extraction of the first difference of EMG time series for EMG pattern recognition. Comput. Methods Programs Biomed. 2014, 117, 247–256. [Google Scholar] [CrossRef]
  21. Phinyomark, A.; Khushaba, R.N.; Ibanez-Marcelo, E.; Patania, A.; Scheme, E.; Petri, G. Navigating features: A topologically informed chart of electromyographic features space. J. R. Soc. Interface 2017, 14, 20170734. [Google Scholar] [CrossRef] [Green Version]
  22. Phinyomark, A.; Khushaba, R.N.; Scheme, E. Feature extraction and selection for myoelectric control based on wearable EMG sensors. Sensors 2018, 18, 1615. [Google Scholar] [CrossRef] [Green Version]
  23. Atzori, M.; Gijsberts, A.; Castellini, C.; Caputo, B.; Hager, A.G.M.; Elsig, S.; Giatsidis, G.; Bassetto, F.; Müller, H. Electromyography data for non-invasive naturally-controlled robotic hand prostheses. Sci. Data 2014, 1, 140053. [Google Scholar] [CrossRef] [Green Version]
  24. Atzori, M. Ninapro Repository. Available online: http://ninapro.hevs.ch (accessed on 8 February 2021).
  25. Englehart, K.; Hudgin, B.; Parker, P.A. A wavelet-based continuous classification scheme for multifunction myoelectric control. IEEE Trans. Biomed. Eng. 2001, 48, 302–311. [Google Scholar] [CrossRef] [PubMed]
  26. Kaufmann, P.; Englehart, K.; Platzner, M. Fluctuating emg signals: Investigating long-term effects of pattern matching algorithms. In Proceedings of the 2010 Annual International Conference of the IEEE Engineering in Medicine and Biology, Buenos Aires, Argentina, 31 August–4 September 2010; pp. 6357–6360. [Google Scholar]
  27. Phinyomark, A.; Phukpattaranont, P.; Limsakul, C. Feature reduction and selection for EMG signal classification. Expert Syst. Appl. 2012, 39, 7420–7431. [Google Scholar] [CrossRef]
  28. Fang, J.; Agarwal, G.C.; Shahani, B.T. Decomposition of EMG signal by wavelet spectrum matching. In Proceedings of the 19th Annual International Conference of the IEEE Engineering in Medicine and Biology Society, Chicago, IL, USA, 30 October–2 November 1997; Volume 3, pp. 1253–1256. [Google Scholar]
  29. Thexton, A.J. A randomisation method for discriminating between signal and noise recordings of rhythmic electromyographic activity. J. Neurosci. Methods 1996, 66, 93–98. [Google Scholar] [CrossRef]
  30. Martin, R. Noise power spectral density estimation based on optimal smoothing and minimum statistics. IEEE Trans. Speech Audio Process. 2001, 9, 504–512. [Google Scholar] [CrossRef] [Green Version]
  31. Rangachari, S.; Loizou, P.C. A noise-estimation algorithm for highly non-stationary environments. Speech Commun. 2005, 48, 220–231. [Google Scholar] [CrossRef]
Figure 1. Change in raw data and feature related to signal-to-noise ratio (SNR). (ac) Noisy signals with corresponding feature. SNR of each noisy signal is (a) 20, (b) 10, and (c) 0 dB. (d) Difference power based on SNR.
Applsci 11 01526 g001
Figure 2. Feature variation based on SNR. Gray line represents difference power; black line represents the proposed unbiased difference power.
Applsci 11 01526 g002
Figure 3. Example of recorded electromyography (EMG) signal. Dashed lines show start and end points of gestures.
Applsci 11 01526 g003
Figure 4. Feature variation based on SNR. Black solid line shows unbiased difference power obtained using ideal noise power. Gray dashed line shows unbiased difference power obtained using estimated noise power.
Applsci 11 01526 g004
Figure 5. Classification result of raw data. (a) Confusion matrix of subject two. (b) Average accuracy of 14 subjects.
Applsci 11 01526 g005
Figure 6. Confusion matrix of subject 1. (a) None. (b) Denoising. [17] (c) Proposed method using ideal noise power. (d) Proposed method using estimated noise power.
Applsci 11 01526 g006
Figure 7. Average classification accuracy of fourteen subjects. (a) None. (b) Denoising. (c) Proposed method using ideal noise power [17]. (d) Proposed method using estimated noise power.
Applsci 11 01526 g007
Figure 8. Subject-averaged accuracy comparison. Colored bar represents average accuracy using each method explained in legend; white bar above colored bar represents corresponding standard deviation.
Applsci 11 01526 g008
Table 1. Synthetic descriptions of 10 gestures.
#Description
Hand Postures1Flexion of ring and little finger
2Thumb opposing base of little finger
3Abduction of the fingers
4Fingers closed together
Wrist Movements5–6Wrist supination and pronation
(rotation axis through the middle finger)
7–8Wrist supination and pronation
(rotation axis through the little finger)
9Wrist radial and ulnar deviation
10Wrist extension with closed hand
Publisher’s Note: MDPI stays neutral with regard to jurisdictional claims in published maps and institutional affiliations.

