Abstract
The crack-propagation form may appear as an arbitrary mixed-mode fracture in an engineering structure due to an irregular internal crack. It is of great significance to research the mixed-mode fracture of materials with cracks. The coupling effect of multiple variables (crack height ratio, horizontal deflection angle and vertical deflection angle) on fracture parameters such as the stress intensity factors and the T-stress are the key points in this paper. A three-point bending specimen with an inclined crack was proposed and used to conduct mixed-mode fracture research. The fracture parameters were obtained by finite element analysis, and the computed results showed that the pure mode I fracture and mixed-mode fractures (mode I/II, mode I/III and mode I/II/III) can be realized by changing the deflection angles of the crack. The pure mode I and the mixed-mode fracture toughness of sandstone were obtained by a series of mixed-mode fracture experiments. The experimental results were analyzed with the generalized maximum tangential strain energy density factor criterion considering T-stress. The results showed that the non-singular term T-stress in the fracture parameters cannot be ignored in any mixed-mode fracture research, and the generalized maximum tangential strain energy density factor criterion considering T-stress can better predict the mixed-mode fracture toughness than other criteria.
1. Introduction
The pure mode I fracture is a common in-plane open fracture, and the mode I critical stress intensity factor (KIC) is one of the important material properties characterizing material fractures. Extensive experimental research on the mode I fracture of metals [1], ceramics [2], PMMA [3,4] and rock [5,6,7] has been achieved by using different specimen configurations. However, it is necessary to consider mixed-mode fractures, owing to the disordered internal microcracks and the complex stress conditions in practical engineering materials and structures. A great deal of research has been done on mixed-mode fracture specimens related to mixed-mode I/II and I/III fractures. For example, the fracture loads of HMA from pure mode I to pure mode II by different loading methods were obtained at a low temperature [8]. The mixed-mode I/II fracture test of concrete showed that the fiber content has an effect on the fracture toughness [9]. The stress intensity factors (SIFs) and non-singular term (T-stress) were calculated, and the results showed that T-stress increased with the increase of crack angles in two disc-type specimens [10]. When the crack width was larger, the crack became a notch, and investigations of mixed-mode I/II fractures based on a U-notch [11] and a V-notch [12] were carried out. Theorical and numerical simulation investigations of the SIFs of pure mode I, pure mode II and mixed-mode I/II have been carried out based on central crack disk specimens [13,14,15]. The mixed-mode I/II fracture experiments of central crack disk specimens were studied by using sandstone [16,17,18], limestone [19] and cement mortar [20]. A penalty-based cohesive element technology was presented [21,22] and used to develop an application for predicting delamination crack growth in mixed-mode I/II [23]. Even though the mixed-mode I/II fracture experiments of four-point bending were studied [24,25], the three-point bending specimen was more widely used, and the experimental parameters were easier to control. For example, the numerical simulation and experimental study of an edge-cracked semi-circular bend (SCB) specimen subjected to three-point bend loading have been carried out [26]. The effects of thickness and Poisson’s ratio on 3D mixed-mode I/II fractures were studied by using edge-cracked semi-circular bend (SCB) specimens [27]. Further, mixed-mode I/II fracture experiments using SCB specimens with different materials, such as hot-mix asphalt (HMA) [8], marble [28], limestone [19], sandstone [29] and acrylonitrile butadiene styrene [30], have been tested and analyzed. The results showed that SCB specimens were suitable to study the fracture of HMA at a low temperature [8]. In addition to temperature, atmospheric pressure also should be considered when analyzing and predicting fractures [28]. The prediction of the crack initiation angle was affected by SIFs and the non-singular term (T-stress), and the value and sign of T-stress in the mixed-mode I/II fracture of SCB specimens played important roles [19]. The internal structure of the material also affected the fracture toughness and fracture mode [30]. An edge-cracked triangular (ECT) specimen and an edge-cracked short-bend beam specimen of mixed-mode I/II fracture were also studied [31,32]. In addition, the effect of crack angles on mixed-mode I/III fractures has also been studied. Mode I SIF increased for the angle between crack and loading direction, but mode III SIF decreased [33]. Mixed-mode I/III fatigue-fracture studies have also been carried out, and the results showed that increasing the crack angle and decreasing the crack length can effectively increase the fatigue life [34]. It was found that the prediction of crack initiation can be enhanced by considering the plastic zone and friction on the crack surface of I/III mixed-mode fractures [35]. The edge-notched disc bend (ENBD) specimen has been proposed to be suitable for mixed-mode I/III fractures, and can realize a pure mode III fracture [36]. Mixed-mode I/III fracture experiments have been carried out on various materials such as marble [37,38], asphalt concrete [38,39], PMMA [38] and graphite [38,40] by using ENBD specimens, and the mode III fracture toughness was less than the mode I fracture toughness for each material. It was found that the crack surface broke suddenly in mixed-mode I/III fractures by using a three-point bending specimen with a large thickness and an inclination angle less than 10°, and a relationship between the scale of the fragmentation and the mixed mode was established [41]. In another investigation of mixed-mode I/III fractures, the crack deflection angles of the specimen achieved larger inclination angles, but only four groups of inclination angles were considered, and the crack depth was fixed and low [42], so the persuasiveness of the research results was inadequate.
In order to study the initiation and propagation of cracks, some fracture criteria, such as the maximum tangential stress (MTS) criterion [43], the maximum tangential strain (MTSN) criterion [44] and the maximum tangential strain energy density (MTSED) criterion [45] were proposed and frequently used to analyze the fracture characteristics. These criteria only considered the singular term of the stress field at the crack tip and ignored the non-singular term (T-stress). However, a large number of experiments have proven that the fracture criterion considering the non-singular term can predict the experimental results more effectively [16,17,18,19,20,26,28,30,31,37,38,39,40]. It was found that the generalized maximum tangential stress (GMTS) or generalized maximum tangential strain (GMTSN) criteria, both considering T-stress, can better predict the central cracked disc experimental results of mixed-mode I/II fractures compared with the MTS criterion [16,17,18,19,20]. The GMTS criterion was also used to predict and verify the experimental results of three-point bending specimens in mixed-mode I/II fracture studies, whether SCB or ETC specimens [26,28,30,31]. The mixed-mode I/III fracture experimental results for various materials such as marble [37], asphalt concrete [39] and graphite [40] using ENBD specimens were in good agreement with the theoretical predicted value of the MTSED criterion without considering T-stress. The experimental results of pure mode III fracture toughness were also in good agreement with the theoretical predictions of the MTSED criterion [38]. However, an extended MTSED criterion considering T-stress was proposed, which was considered to better predict the testing results of ENDB specimens, especially for the pure mode III case [46].
Most of the existing studies on mixed-mode fractures involve I/II and I/III fractures. The mixed-mode I/II/III fracture is rare, and the applicability of the existing criteria to mixed-mode I/II/III fractures still needs more study. Therefore, based on the previous investigations, a mixed-mode fracture test configuration, called the three-point bending specimen with inclined crack (TPB-IC), was proposed in this study. By changing the deflection angles of the crack in two directions, it can cover most ranges of mode I/II/III mixed fractures. The influences of the deflection angles and crack length on fracture parameters (i.e., SIFs and T-stress) and the experiments of the TPB-IC specimen made of sandstone for mixed-mode I/II/III fracture were carried out. Through the extended analysis of the MTSED criterion, the generalized maximum tangential strain energy density (GMTSED) criterion considering T-stress was obtained, and a unified and complete three-dimensional expression under the conditions of plane stress and plane strain was derived. The experimental results and the predicted values of the GMTSED criterion considering the three-dimensional T-stress were comparatively analyzed.
2. The TPB-IC Specimen for Mixed-Mode I/II/III Fracture Study
2.1. The TPB-IC Specimen for the Mixed-Mode I/II/III Fracture Model
The loading configuration and geometric structure of the TPB-IC specimen for a mixed-mode I/II/III fracture are shown in Figure 1. The TPB-IC specimen is a rectangular beam of length (L), thickness (B) and height (W). It contains a straight edge crack of length (a) in the direction of the through thickness. a/W is defined as the crack height ratio of the specimen. The specimen is supported in a three-point bending fixture with a span (S). On the top of the specimen, there is a uniformly distributed load (P) applied along the thickness direction. The crack forms an angle α with the loading line on the bottom surface of the specimen, which is defined as the horizontal deflection angle (Figure 1c). The crack on the front surface of the specimen forms an angle β with the vertical direction, which is defined as the vertical deflection angle (Figure 1b). When α and β are both zero, the loading conditions and the geometry are symmetrical, and the specimen fails through a pure mode I fracture. However, for other angles α and β, the loading conditions and the geometry are asymmetric with respect to the crack surface, and mixed-mode fracture occurs in the specimen. The crack deflection angles α and β are the principal influencing parameters in mixed-mode fracture. The contribution of mode I, mode II and mode III SIFs in mixed fractures depends on α and β.
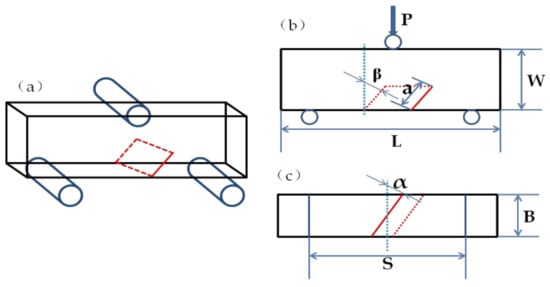
Figure 1.
The loading configuration and geometry of the TPB-IC specimen. (a) Panorama of specimen loading. (b) Front view of specimen loading. (c) Bottom view of specimen loading.
2.2. Numerical Simulation of the TPB-IC Specimen
In this study, the mixed-mode fracture parameters of the TPB-IC specimens were determined accurately based on the ABAQUS software and J-integral method. The finite element analysis defined a series of element groups around the crack tip for generating different closed paths when solving the SIFs and T-stresses. Due to the singularity of the stress-strain field at the crack tip, it was necessary to consider the singular elements at the crack tip, which can be achieved by moving the middle node of the element of the first integral loop around the crack tip to a quarter distance near the crack front [27]. The full field solution of the stress at the crack tip was obtained through finite element analysis.
The three-dimensional finite element models of the TPB-IC specimen with various crack height ratios and crack deflection angles were established and analyzed. According to previous fracture studies [36], the parameters of the crack tip of the specimen models were functions of the specimen geometry (B and W), support span (S), crack length (a), load (P) and crack deflection angles (α and β). The expressions of the fracture parameters were as follows:
where YI, YII and YIII and T* are the dimensionless SIFs and T-stresses, which are functions of the crack height ratio a/W, horizontal deflection angle and vertical deflection angle , respectively. In order to ensure the accuracy of the simulation results, the crack tip region was densified and optimized, and different element sizes of the same models were compared. The results showed that different element sizes had little effect on the results, and the error was less than 1%, as seen in Table 1. The origin of the values in Table 1 will be explained later. Considering comprehensively, 2 mm was determined as the element size for this simulation. The finite element analysis of the specimen models consisted of more than 95,000 solid elements (c3d15 elements at the crack tip, c3d20 elements in the surrounding area near the crack and c3d10 elements far away from the crack), allowing construction of a three-dimensional fracture model with different crack height ratios, and different horizontal and vertical deflection angles. Figure 2 shows a three-dimensional grid pattern of the specimen and a zoomed view of the crack tip region. The material of model is assumed to be linear elastic and isotropic. The material characteristics and geometric dimensions of the TPB-IC specimen for finite element analysis are shown in Table 2.

Table 1.
Dimensionless T-stresses and SIFs for the finite element model of the TPB-IC specimen of different element sizes when a/W = 0.5, = 30° and = 30°.
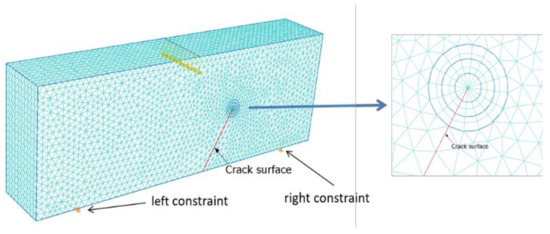
Figure 2.
Finite element model and zoomed view of crack tip region for the TPB-IC specimen.
Table 2.
Material characteristics and geometric dimensions given for the finite element model of the TPB-IC specimen.
The fixed displacement constraints were set at the bottom of the TPB-IC specimen. As shown in Figure 2, the constraint of horizontal and vertical directions on the left side was 45 mm from the center of the bottom, and the constraint of vertical direction on the right side was 45 mm from the bottom center, so as to achieve static constraint of the TPB-IC specimen. The distances between two sections of displacement constraint and the center of the TPB-IC specimen were equal, and the constraint distance (i.e., span S) was fixed at 90 mm. The crack was a natural crack without any constraints. All finite element analysis results for the SIF and T-stress on different crack height ratios, horizontal deflection angles and vertical deflection angles were obtained.
In the finite element model, the standardized parameter of the crack tip along the thickness direction was defined as z/B. This means that z/B = 0 refers to the middle position of the crack, and z/B = ±1 refers to the free surface of the TPB-IC specimen. The mode I SIF at the middle section of the thickness, i.e., z/B = 0, was defined as KIm, and the T-stress in the middle section was defined as Tm. The effective SIF was defined as:
By using the finite element analysis results of the crack tip along the thickness divided by KIm and Tm respectively, the normalized SIFs and T-stress can be obtained. Figure 3 shows the normalized results of four groups of crack deflection angles (α = 0°, β = 0°, α = 0°, β = 30°, α = 30°, β = 0° and α = 30°, β = 30°) under the conditions of crack height ratio a/W = 0.5 and span S = 90 mm. According to Figure 3, the three-dimensional effect on the SIFs and T-stress can be observed at different positions of the crack tip. When α = 0°, β = 0° (Figure 3a), KII and KIII were always zero, so the pure mode I fracture can be well realized. In the middle part of the crack, i.e., −0.6 < z/B < 0.6, there was almost no change in KI. There was a deviation (about 20%) near the free surface (z = ± 1). The investigations of SIFs in a three-dimensional specimen proved the SIF of the free surface decreased relative to the middle interface [36,38]. For other angles (see Figure 3b–d), all SIFs, including the effective SIF Keff, had a sudden change near the free surface, but the portion near the middle of the crack tended to be stable. When α = 0° and β = 30°, KIII tended to be 0 in the middle position, and the specimen was subjected to a mixed-mode I/II fracture. When α = 30°, β = 0°, KII tended to be 0 in the middle position, so the specimen was mainly subjected to a mixed-mode I/III fracture. When α = 30°, β = 30°, the specimen was subjected to a mixed-mode I/II/III fracture. It is worth noting that the negative value here only represents the direction. In order to visualize the size relationship of the SIFs, the absolute values of the SIFs are used directly in later sections.
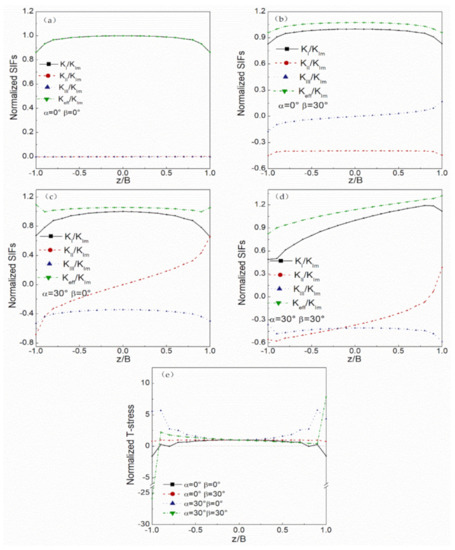
Figure 3.
Variations of the normalized fracture parameters for typical crack inclined angles (α and β) along z/B direction. (a) The normalized SIFs in α = 0° and β = 0°. (b) The normalized SIFs in α = 0° and β = 30°. (c) The normalized SIFs in α = 30° and β = 0°. (d) The normalized SIFs in α = 30° and β = 30°. (e) The normalized T-stress in four groups of angles.
In the four groups of crack deflection angles, the crack tip normalized T-stresses are shown in Figure 3e when −1 ≤ z/B ≤ 1. The variation of the normalized T-stress was similar to the SIFs along the thickness direction. There was almost no change in the middle position, but the deviation of normalized T-stress at the free surface was more obvious than the SIFs for different horizontal and vertical deflection angles. For example, when α = 30°, β = 30°, there was a difference of more than 25 times between the T-stress of z/B = ± 1 at the free surface and the middle of the model.
Even though the deviation between the free surface and the middle position was large, according to the research of Bazant and Estensoro [47], the singularity of the stress field near the free surface or corner is different from the traditional definition of the stress-strain field at the crack tip. Thus, the simulation results near the free surface of the specimen can be ignored. In the study of the effects of thickness and Poisson’s ratio by Aliha and Saghafi [30], the SIFs and T-stress in the middle position of the crack were taken as the simulation result, and a good research achievement was seen. Our study also used that method. The SIFs and T-stresses in the middle of the crack (z/B = 0) were taken as the finite element simulation result of the TPB-IC specimen.
It was necessary to verify the correctness of the simulation results. The existing SIF formulas in the relevant literature were used to compare with the numerical results in this study. The usual formula for the dimensionless SIF of mode I fracture of three-point bending specimen is [7]:
Taking the results of a/W of 0.1, 0.3, 0.5 and 0.7 for comparison, the data in Table 3 were obtained. From Table 3, it is shown that the relative error of the calculation value and the formula was within 5%, and the relative error was 1.25% which is minimal with a/W = 0.5. At the same time, according to the experimental data of Jianping Zuo [7], the fracture load and specimen parameters of 25 °C at room temperature were used in the numerical modeling of this study. The corresponding KI value was obtained from the numerical solution seen Table 4. It is shown in Table 3 and Table 4 that the numerical results obtained in this study had satisfactory accuracy and effectiveness. The verification of YII and YIII can also be obtained by the same method.
Table 3.
Comparison between formula values and the numerical results of the dimensionless mode I SIF.
Table 4.
Comparison of experimental and calculated values of mode I fracture toughness.
The fracture parameters KI, KII, KIII and T of the specimen were found by numerical simulation, and can be transformed into dimensionless expressions (YI, YII, YIII and T*) by Equations (1)–(4), respectively. Figure 4 shows the variation of YI, YII and YIII under different crack height ratios for a/W = 0.1–0.7 and four groups of typical horizontal and vertical deflection angles. It can be seen from Figure 4 that all the ranges of the crack height ratio did not change the mixed-mode fracture. The crack height ratio a/W had the same effect on the variations of the dimensionless SIFs. The value of YI, YII and YIII increased with the increase of crack height ratio, and the change rate of YI clearly increased with high crack height ratio. When the vertical deflection angle β = 0°, no matter what the values of the crack height ratio a/W and the horizontal deflection angles α were, YII was almost constant at zero. In this case, the specimen was subjected to a mixed-mode I/III fracture. When the horizontal deflection angle α = 0°, similarly, YIII was almost constant at zero, and the specimen suffered a mixed-mode I/II fracture. This phenomenon is consistent with the investigation of the mixed-mode fracture of Aliha’s edge-notched disc and semicircle disk [26,30,36,37,38].
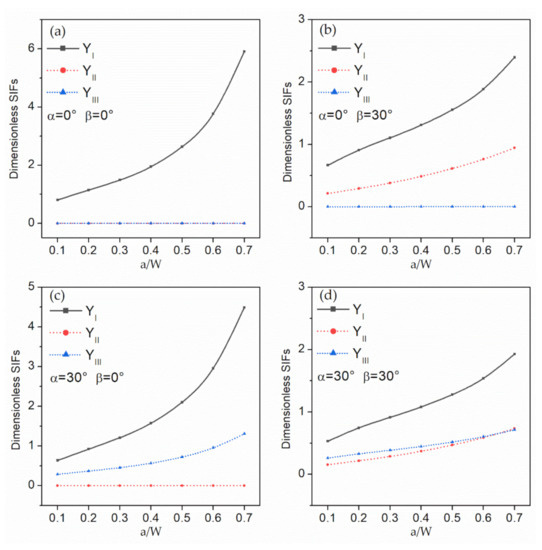
Figure 4.
The relationship between dimensionless SIFs and crack height ratio a/W for typical crack inclined angles. (a) The normalized SIFs in α = 0° and β = 0°. (b) The normalized SIFs in α = 0° and β = 30°. (c) The normalized SIFs in α = 30° and β = 0°. (d) The normalized SIFs in α = 30° and β = 30°.
In order to further research the relationship between the dimensionless SIF and crack deflection angles α and β, models with span S = 90 mm and crack height ratio a/W = 0.5 were selected. All the simulation results are shown in Figure 5. The effect of the crack deflection angles on one of the fracture parameters is shown by two graphs in each row of Figure 5. For example, according to Figure 5a,b, by increasing α and β, YI decreased but the decrease amplitudes were not the same. The decrease rate of YI increased with the increase of α, but it tended to be mild with the increase of β. Each column graph (Figure 5a,c,e) in Figure 5 shows the effect of one crack deflection angle on the three fracture parameters. By increasing horizontal deflection angle α, the value of YI and YII became less, but the magnitude value of YIII increased first and then decreased. The maximum value of YIII was obtained when α = 45°. In general, the independent change of the crack deflection angle did not affect the effect of the other angles on the dimensionless parameters, but did affect the value size shown in Figure 5.
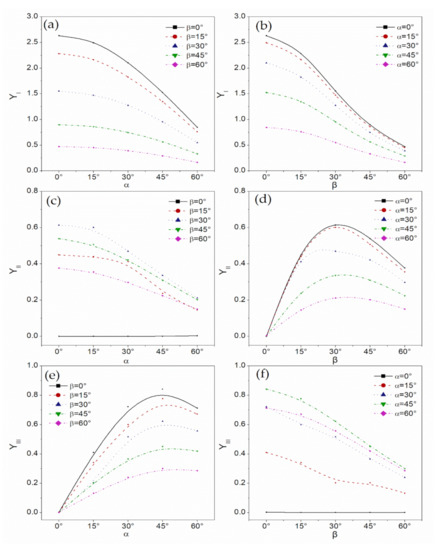
Figure 5.
The relationship between dimensionless SIFs YI, YII and YIII with respect to horizontal deflection angle α and vertical deflection angle β. (a) The relationship between YI and α. (b) The relationship between YI and β. (c) The relationship between YII and α. (d) The relationship between YII and β. (e) The relationship between YIII and α. (f) The relationship between YIII and β.
Therefore, the analysis of the simulation results indicated that when the span was fixed and the crack height ratio a/W and β increased, a pure mode II fracture of the TPB-IC specimen could be obtained. If the span was changed, a/W and β of the pure mode II fracture were correspondingly changed. For example, Mousavi [32] used short specimens with short spans to achieve a pure mode II fracture. Table 5 also shows the corresponding span S, angle value of β and crack height ratio a/W of the pure mode II fracture, or close to pure mode II fracture. According to the previous result, if the specimen suffers a pure mode III fracture, KII needs to be kept at zero and the value of α changes only under the condition of β = 0°. However, no matter what the values of the crack height ratio a/W and α were, KI was not zero, as seen in Figure 5a. Thus, pure mode III fractures and mixed-mode II/III fractures cannot be realized using this specimen, which is similar to the investigations of Lin [41] and Ahmadi-Moghadam [42].
Table 5.
Pure mode II fracture angle values corresponding to different span S and a/W.
Figure 6 shows the variation of the dimensionless T-stress (i.e., T*) for different crack height ratios a/W. According to Figure 6, no matter what mixed-mode fracture is considered, T* increased with an increasing crack length. Furthermore, when the vertical deflection angle β was small, T* had a negative value for the two curves of β = 0° in the case of low crack height ratio. Figure 7 shows the variations between the crack deflection angles and T*, but the variations are relatively complex. As shown in Figure 7a, when β was large, by increasing α, T* decreased. When β was small, the change of T* cannot be clearly determined due to its relatively small value and small change. From the observation in Figure 7b, except for α = 60°, T* increased with an increasing β, and the peak value was obtained when β = 45°.
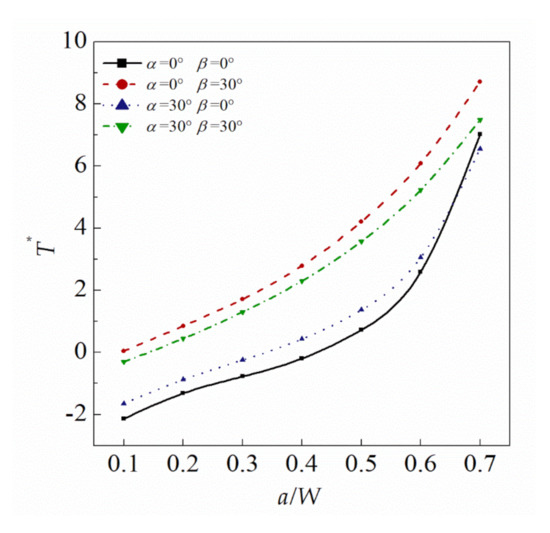
Figure 6.
Variation of dimensionless T-stress T* under typical crack inclined angles for varying values of crack height ratio a/W.
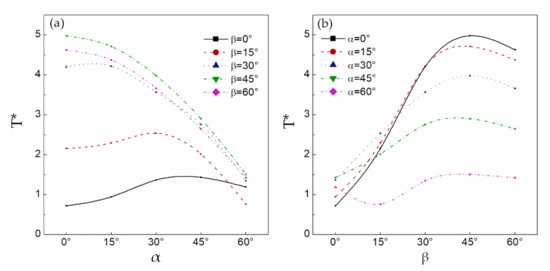
Figure 7.
Variation of dimensionless T-stress T* with respect to horizontal deflection angle α and vertical deflection angle β. (a) The relationship between T* and α. (b) The relationship between T* and β.
The relationship between the nonsingular term T relative and the singular term SIFs in the mixed-fracture process was considered and usually defined by biaxiality ratio B [10], which is defined as:
The larger the parameter B of the fracture specimen was, the more important the T-stress was in the mixed-fracture behavior. Figure 8 shows the variations under different vertical and horizontal deflection angles. It can be seen from Figure 5b that the biaxiality ratio B had a significant change, in the range of 0~2.5. So, the influence and importance of T-stress on the mixed fracture of specimens is obvious.
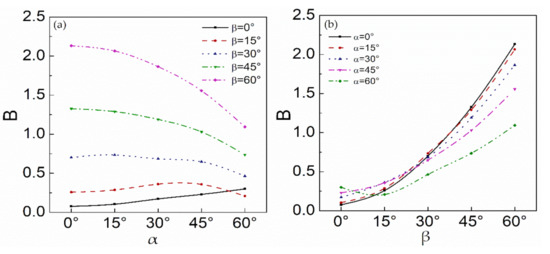
Figure 8.
Variation of biaxiality ratio B with respect to horizontal deflection angle α and vertical deflection angle β. (a) The relationship between B and α. (b) The relationship between B and β.
The three-dimensional mixed-mode fracture experiments using TPB-IC specimens were carried out with typical sandstone materials, and the influence of fracture parameters on mixed-mode fractures is analyzed in the next sections.
2.3. Experimental Investigation of TPB-IC Specimens
Sandstone was selected as the material for the 3D mixed-mode fracture experiments using the TPB-IC specimen because of its low price, convenient processing, wide distribution and application in various engineering projects and experimental research. All the specimens in this experiment were taken from one large homogeneous piece of sandstone. The stone was cut into 20 mm thin sections, and then the thin sections were cut into long rectangular specimens of sizes (120 mm long and 40 mm wide). The cracks with different horizontal and vertical rotation angles were cut out using a circular slicer with a thickness of only 0.8 mm. The crack tip was sawn again with a 0.3 mm thick saw line, which made the crack height ratio a/W reach 0.5. The specimens were tested four times for each angle, and the experiments were carried out on the same universal compression testing machine (Figure 9). This consistent manufacturing and experimental process eliminated part of the error sources.
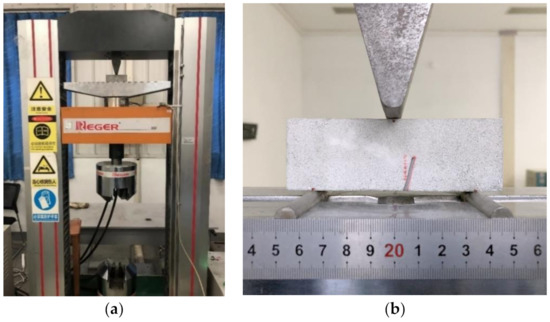
Figure 9.
(a) The full view of experimental machine. (b) The loading situation.
The specimens were loaded at a constant rate of 0.05 mm per minute until a fracture occurred. The fractured TPB-IC specimens (α = 30° β = 30°) are shown in Figure 10. When the loading began, the crack tip was under tensile effect and the upper and lower crack surfaces opened, which resulted in a mode I deformation. Due to the existence of a horizontal deflection angle, the deformation direction of the front-to-back crack was opposite, and the crack surface rotated and resulted in a mode III deformation. The relative displacement of the upper and lower crack surfaces occurred because of the vertical deflection angle, so the crack surfaces sheared, and the mode II deformation occurred. The crack propagation of the specimens started from the crack tip and then propagated to the loading site (Figure 10a,b). Although the end of the crack propagation path was far away from the loading point and stopped at a small displacement from the loading point (see Figure 10a), it was believed that when the specimen height was large enough, the final end of the crack propagation path would reach the loading point, as in previous experimental results for large thickness on I/III mixed-mode fractures [48]. The kinks and deflections of the crack propagation path appeared during the I/II/III mixed-mode fracture seen Figure 10c. Although kinks were common in composite fractures [49], the same phenomenon occurred in a fracture experiment using sandstone when the displacement gradient of the crack propagation of sandstone was large, which led a displacement discontinuity of the crack surface [50]. Figure 10c shows the obvious deflection of the crack during crack propagation, which indicates that KII and KIII have a significant influence on the mixed-mode fracture behavior.
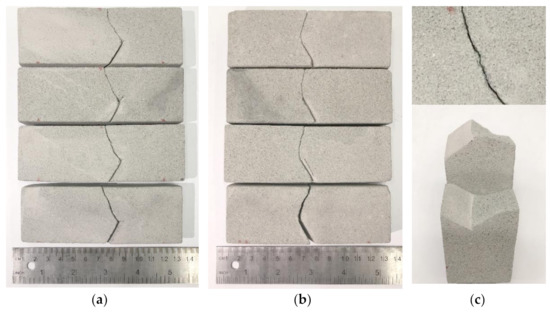
Figure 10.
The fractured TPB-IC specimen when α = 30° and β = 30°. (a) The front of the fractured specimens. (b) The back of the fractured specimens. (c) A close view of fracture surface.
Nine groups of load-displacement curves are shown in Figure 11. The load-displacement curves are concave curves with low loads and are short. This is because there were some microparticles on the surface of sandstone and microcracks in the interior, and the specimen was not compacted at the beginning of loading. However, it can be seen from the subsequent curve that there was a linear relationship between the displacement and load before the peak load. So, sandstone can be assumed to be a linear elastic material. The same phenomenon was found in the investigation on the correlation of mode II fracture toughness of sandstone with tensile strength [51]. In the case of three-point bending, the inclined crack needed more fracture load and fracture energy than the straight crack, which made the fracture load of the inclined crack specimen increase [32]. This is why the displacement and fracture were the largest when α = 60° and β = 60°. The peak fracture load curves at different angles are shown in Figure 12. When the horizontal deflection angle α increased, the fracture load increased in a small range globally, and the maximum change was less than 1.46 times (for the vertical deflection angle β = 30°). However, with the increase of vertical deflection angle β, the fracture load increased gradually, and the maximum change was more than 3.13 times at α = 15°. Although certain errors were considered and reduced in the experiments, the deviation of each group of experimental fracture loads still occurred. This may be due to the distribution of internal microcracks and microdefects, or manual machining and grinding the crack tip by using blades. By substituting the critical peak load obtained from the experiment into Equations (1)–(4), where the corresponding geometric factors YI, YII and YIII are extracted from the above diagram (Figure 5), and referring to Table 6, the fracture toughness of different mixed-mode fractures can be obtained. The experimental results, including the fracture load and corresponding fracture toughness, are shown in Table A1 and Table A2. More details on the fracture toughness analysis are given in the next section.
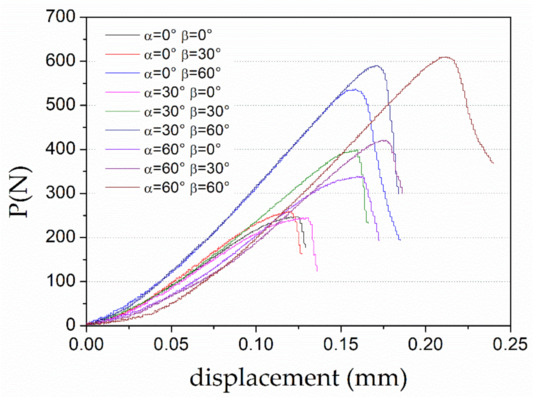
Figure 11.
Curve of displacement and load with respect to horizontal vertical deflection angles.
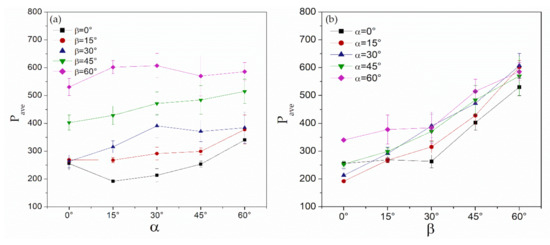
Figure 12.
Variation of fracture load Pave with respect to horizontal deflection angle α and vertical deflection angle β. (a) The relationship between Pave and α. (b) The relationship between Pave and β.
Table 6.
Values of dimensionless SIFs at various horizontal and vertical deflection angles.
3. Fracture Toughness and Criterion Analysis
The pure mode I fracture toughness KIC of the tested sandstone material was 0.38 according to the experimental results calculation. KIC in the sandstone experiment conducted by Hua [52] was about 0.187 , and that in the sandstone experiment conducted by Dehestani [53] was 0.6 . The experimental value in this study was around midway between them. Considering the influence of regional factors and sandstone types, the value from the experiment was within the normal range of KIC for sandstone. When the crack deflection angles α = β = 0°, the mixed-mode fracture toughness ratio KII/KIC = KIII/KIC = 0. For other crack deflection angles, when α = 0° and β = 60°, KI/KIC was about 0.387, and KII/KIC was about 0.307. When α = 60, β = 0, KI/KIC was about 0.426, and KIII/KIC was about 0.361. As mentioned above, the mixed-mode fracture toughness is also related to the presence of T-stress in the TPB-IC specimens. Therefore, when analyzing the fracture toughness of TPB-IC specimens, the traditional MTS criterion, MTSN criterion and MTSED criterion cannot be used for accurate predictions. However, it was shown that the generalized maximum tangential strain energy density (GMTSED) criterion can significantly improve the prediction of experimental results by considering the influence of T-stress, in addition to KI, KII and KIII.
Under the loading condition of general mixed-mode fractures, the elastic stress field at the crack tip can be expressed as a tensor S:
where σr, σθ, σz, σrθ, σzθ and σrz are the stress components near the crack tip, which are available in literature [54], and r and θ are the coordinates of the crack tip, as illustrated in Figure 13.
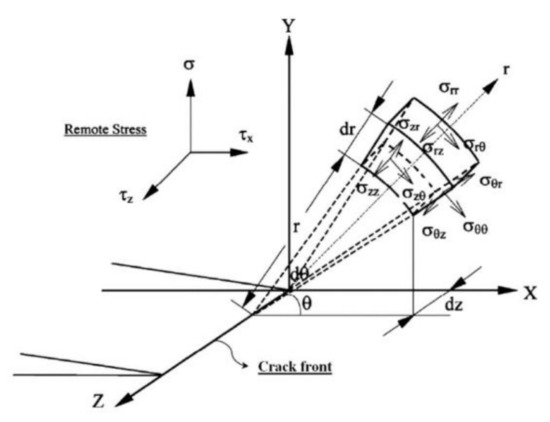
Figure 13.
Mixed-mode I/II/III stress fields near the crack tip [46].
The stress state in the initial coordinate plane (θ–z) was assumed to be equal to the angle of rotation of element ϕ around the r-axis at the initial stage of crack propagation (Figure 14), so the stress tensor after coordinate transformation is expressed as:
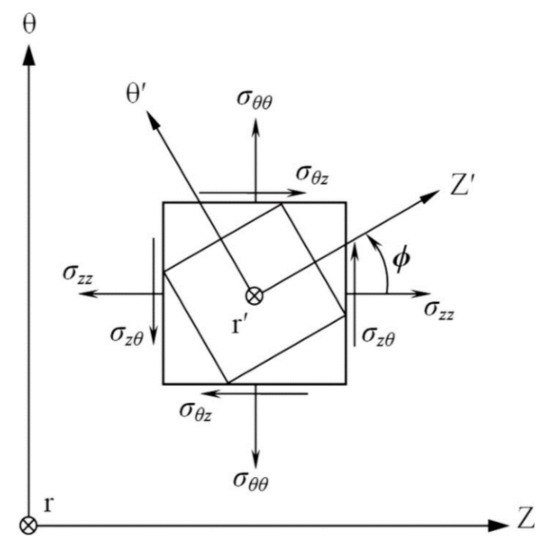
Figure 14.
Stress state in the θ–z plane [46].
Q is the transformation matrix and is expressed as:
The GMTSED criterion considering the combined effect of tangential stress and tangential strain in three-dimensional fracture parameter was used to predict the fracture test results of sandstone materials. Therefore, according to the definition of the GMTSED criterion, the tangential strain energy density factor can be calculated from:
Due to the three-dimensional mixed-mode fracture, the plane strain state of was adopted. According to Hooke’s law, , therefore the tangential strain energy density factor C is:
where η is the relative critical distance defined as . Ayatollahi and Saboori [45] and Hua [46] used α to represent the relative critical distance, however, α was used to represent horizontal deflection angle in the previous section, so η was used here. All the coefficients () are shown in Table A3 and Table A4.
According to the hypothesis of the GMTSED criterion, a mixed-mode fracture occurs when the maximum tangential strain energy density factor C reaches a maximum under the critical load near the crack tip. The angle and condition of crack propagation based on the GMTSED criterion are as follows:
and sufficient conditions:
The second hypothesis can also be written as:
where and are the in-plane and out-of-plane initiation angles, respectively, and are calculated from Equations (13)–(15). When a pure I mode fracture occurs, , , is expressed using as:
where is the biaxiality ratio for the pure mode I loading. Part of the derivation process can refer to Hua [46]. When different fracture parameters (i.e.,,, and ) are confirmed, the in-plane and out-of-plane fracture angles can be obtained by Equations (13) and (14), and the mixed-mode fracture toughness ratio can also be predicted by Equations (12) and (16).
Figure 15 shows the relationship between mixed-mode I/II and I/III fracture toughness ratios under the plane stress condition. It can be seen that the GMTSED criterion had a high sensitivity in predicting I/II mixed fractures. The ratio of pure mode II fracture toughness change under different positive and negative T-stresses was more than 220%. However, the prediction of a mixed-mode I/III fracture using GMTSED criterion was very poor. As shown in Figure 16, the predicted value of the GMTSED criterion under the plane strain condition with different T-tress had a good sensitivity to I/II and I/III mixed-mode fracture toughness when ν = 0.35, where the value of pure III mode fracture toughness decreased regardless of the positive and negative T-stresses. Therefore, T-stress cannot be ignored in investigations of mixed-mode fractures. In mixed-mode fracture experiments, the mixed-mode fracture toughness is reduced under the influence of positive T-stress, which makes the material more vulnerable to failure.
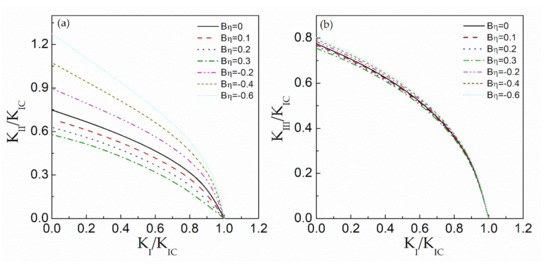
Figure 15.
Mixed fracture toughness–predicted values of the fracture criterion under plane stress. (a) The mixed mode I/II fracture toughness–predicted values. (b) The mixed mode I/III fracture toughness–predicted values.
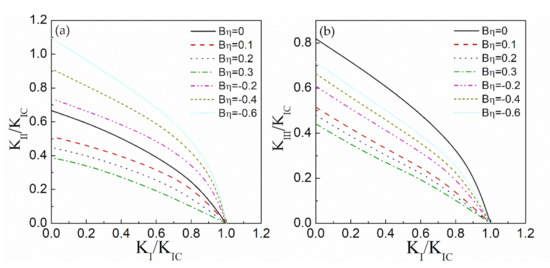
Figure 16.
Mixed fracture toughness–predicted values of the fracture criterion under plane strain with ν = 0.35. (a) The mixed mode I/II fracture toughness–predicted values. (b) The mixed mode I/III fracture toughness–predicted values.
When comparing and analyzing the experimental data with the GMTSED criterion and other criteria, it was found that the predicted value calculated by the GMTSED criterion was in good agreement with the experimental data, whether for a mixed-mode I/II fracture or I/III fracture, as shown in Figure 17. Wang [55] also believed that the crack propagation and failure of material cannot be effectively judged only on the stress or strain of a certain point at the crack tip in reaching the maximum value, and that energy is more appropriate. Moreover, the prediction of mixed-mode I/II/III fractures was also consistent. As shown in Figure 18, under any mixed-mode I/II/III fracture model, the experimental data of effective SIF and the predicted value of GMTSED criterion agreed well over a large range. There was a slight deviation when the experimental data was very small. That can be considered to play the role of a safety factor in engineering protection when the prediction results are larger than the experimental data. In general, the predicted values of the GMTSED criterion were in good agreement with the experimental values. The GMTSED criterion was applicable to the three-dimensional mixed-mode I/II/III fracture.
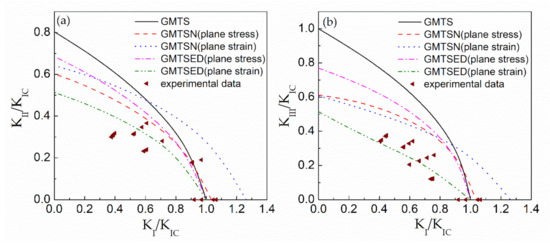
Figure 17.
Mixed fracture toughness–predicted values of the fracture criterion and the testing data for sandstone. (a) The mixed mode I/II fracture toughness–predicted values. (b) The mixed mode I/III fracture toughness–predicted values.
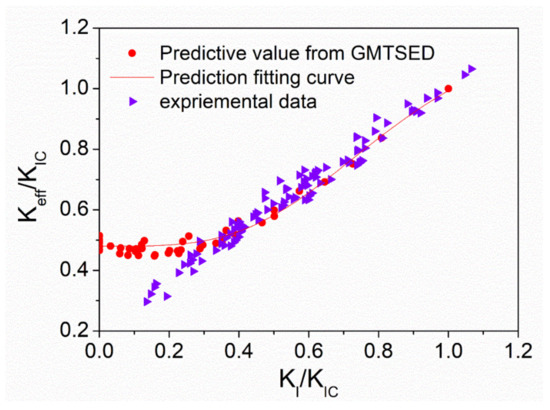
Figure 18.
Effective SIF predicted values of the fracture criterion and the testing data for sandstone.
4. Conclusions
In this study, a TPB-IC specimen of arbitrary crack forms was proposed. Through various finite element analyses of the TPB-IC specimens, the fracture parameters, SIFs and T-stresses, including biaxiality ratio B, were obtained at different crack height ratios a/W and horizontal and vertical crack deflection angles α and β. The TPB-IC specimen could achieve mixed-mode I/II/III fractures through the analysis of SIFs compared with the traditional three-point bending specimen. When the horizontal deflection angle α changed, the mixed-mode I/III fracture was affected. The value of horizontal deflection angle β affected the mixed-mode I/II fracture. It was shown that the T-stress played an important role in mixed-mode fractures through analysis of the biaxiality ratio B.
The mixed-mode fracture experiments for TPB-IC specimens were carried out using sandstone, and the corresponding mixed-fracture toughness was obtained. The GMTSED criterion considering T-stress was proposed and used to analyze the experimental results. The GMTSED criterion proved once again that T-stress cannot be ignored in the prediction of mixed-mode fracture toughness. Compared with the GMTS and GMTSN criteria, it was found that the three-dimensional GMTSED criterion under plane strain considering T-stress could successfully predict the mixed-mode fracture toughness.
Author Contributions
Conceptualization, X.P.; methodology, X.P.; validation, X.P., J.H., Z.G., W.H. and S.D.; formal analysis, X.P.; investigation, X.P.; resources, X.P., J.H. and Z.G.; data curation, X.P. and W.H.; writing—original draft preparation, X.P.; writing—review and editing, S.D.; visualization, X.P.; supervision, W.H. and S.D.; project administration, X.P.; funding acquisition, W.H. and S.D. All authors have read and agreed to the published version of the manuscript.
Funding
This work was funded by the National Natural Science Foundation of China (No. 11872042), the Sichuan Science and Technology Program (Nos. 2018JY0024 and 2019YJ0156), the China Postdoctoral Science Foundation (2019M653395) and the Postdoctoral Research Foundation of Sichuan University (2019SCU12049).
Institutional Review Board Statement
Not applicable.
Informed Consent Statement
Not applicable.
Data Availability Statement
The data presented in this study are available in Appendix A.
Conflicts of Interest
The authors declare no conflict of interest.
Appendix A
Table A1.
The geometric parameters of specimens and fracture loads obtained for the tested sandstone material under different loading modes.
Table A1.
The geometric parameters of specimens and fracture loads obtained for the tested sandstone material under different loading modes.
| α (°) | β (°) | W (mm) | B (mm) | P (N) | Pave (N) | β (°) | W (mm) | B (mm) | P (N) | Pave (N) |
|---|---|---|---|---|---|---|---|---|---|---|
| 0 | 0 | 40.0 | 20.0 | 268.324 | 255.631 | 15 | 39.0 | 20.0 | 275.573 | 268.925 |
| 39.8 | 20.0 | 246.565 | 39.0 | 20.0 | 275.573 | |||||
| 39.0 | 20.0 | 227.227 | 39.0 | 19.8 | 256.234 | |||||
| 40.7 | 20.0 | 280.407 | 40.0 | 20.0 | 268.321 | |||||
| 30 | 39.0 | 20.0 | 297.328 | 263.486 | 45 | 38.5 | 20.0 | 432.697 | 402.481 | |
| 40.0 | 19.3 | 246.565 | 39.0 | 20.0 | 377.099 | |||||
| 39.0 | 20.0 | 251.400 | 39.0 | 20.0 | 418.193 | |||||
| 39.4 | 20.0 | 258.651 | 39.0 | 20.0 | 381.934 | |||||
| 60 | 39.8 | 20.0 | 565.649 | 530.598 | ||||||
| 39.0 | 20.0 | 536.641 | ||||||||
| 39.0 | 20.0 | 529.389 | ||||||||
| 39.0 | 19.0 | 490.713 | ||||||||
| 15 | 0 | 39.3 | 19.5 | 193.384 | 192.176 | 15 | 40.6 | 20.0 | 258.651 | 267.716 |
| 40.0 | 19.2 | 193.384 | 39.0 | 19.6 | 263.486 | |||||
| 39.5 | 19.5 | 190.967 | 39.6 | 19.4 | 268.321 | |||||
| 39.4 | 19.3 | 190.967 | 39.4 | 19.6 | 280.407 | |||||
| 30 | 39.0 | 20.0 | 336.005 | 315.458 | 45 | 38.8 | 20.0 | 396.438 | 428.467 | |
| 40.0 | 20.0 | 290.076 | 40.2 | 20.0 | 468.957 | |||||
| 39.0 | 19.8 | 304.580 | 39.0 | 20.0 | 442.366 | |||||
| 39.0 | 19.0 | 331.171 | 39.0 | 19.8 | 406.107 | |||||
| 60 | 39.0 | 20.0 | 580.153 | 601.909 | ||||||
| 39.5 | 20.0 | 594.657 | ||||||||
| 39.0 | 20.0 | 597.074 | ||||||||
| 39.5 | 19.2 | 635.751 | ||||||||
| 30 | 0 | 40.0 | 20.0 | 244.148 | 213.327 | 15 | 39.2 | 20.0 | 265.903 | 291.285 |
| 38.0 | 19.8 | 210.305 | 40.5 | 20.0 | 277.99 | |||||
| 40.0 | 20.0 | 212.723 | 40.2 | 20.0 | 306.998 | |||||
| 39.8 | 19.5 | 186.132 | 39.0 | 20.0 | 314.249 | |||||
| 30 | 40.6 | 20.0 | 398.855 | 390.999 | 45 | 39.0 | 20.0 | 418.193 | 471.374 | |
| 40.5 | 20.0 | 396.438 | 39.0 | 20.0 | 497.964 | |||||
| 41.0 | 20.0 | 435.115 | 41.5 | 20.0 | 510.051 | |||||
| 39.0 | 20.2 | 333.588 | 39.0 | 19.7 | 459.288 | |||||
| 60 | 39.2 | 20.0 | 669.593 | 607.347 | ||||||
| 39.7 | 20.0 | 568.066 | ||||||||
| 40.0 | 20.0 | 601.908 | ||||||||
| 39.8 | 19.0 | 589.822 | ||||||||
| 45 | 0 | 39.0 | 20.0 | 253.817 | 253.213 | 15 | 39.0 | 20.0 | 297.328 | 299.141 |
| 41.0 | 19.3 | 246.565 | 40.0 | 20.0 | 294.911 | |||||
| 39.4 | 20.0 | 268.321 | 38.0 | 20.0 | 287.659 | |||||
| 39.8 | 19.8 | 244.148 | 40.0 | 20.2 | 316.667 | |||||
| 30 | 40.5 | 20.0 | 328.753 | 371.056 | 45 | 40.5 | 20.0 | 478.626 | 484.065 | |
| 40.0 | 20.0 | 352.926 | 40.6 | 20.0 | 456.870 | |||||
| 40.9 | 20.0 | 394.020 | 39.0 | 20.0 | 442.366 | |||||
| 39.0 | 20.4 | 408.524 | 40.0 | 19.8 | 558.397 | |||||
| 60 | 40.5 | 20.0 | 613.995 | 569.879 | ||||||
| 41.0 | 20.0 | 464.122 | ||||||||
| 40.0 | 19.3 | 597.074 | ||||||||
| 39.3 | 19.2 | 604.326 | ||||||||
| 60 | 0 | 41.0 | 20.0 | 336.005 | 340.235 | 15 | 40.6 | 20.0 | 369.847 | 377.706 |
| 39.0 | 20.0 | 338.422 | 39.5 | 20.0 | 311.832 | |||||
| 41.0 | 20.0 | 343.257 | 38.8 | 19.5 | 391.603 | |||||
| 39.0 | 20.0 | 343.257 | 39.3 | 19.6 | 437.532 | |||||
| 30 | 39.5 | 20.0 | 323.919 | 384.351 | 45 | 40.0 | 20.0 | 495.547 | 514.886 | |
| 39.4 | 20.0 | 350.509 | 40.2 | 20.0 | 536.641 | |||||
| 39.5 | 20.0 | 420.611 | 40.0 | 20.0 | 464.122 | |||||
| 40.0 | 19.0 | 442.366 | 40.0 | 19.2 | 563.232 | |||||
| 60 | 39.0 | 20.0 | 616.412 | 585.592 | ||||||
| 40.0 | 20.0 | 551.145 | ||||||||
| 38.4 | 20.0 | 563.232 | ||||||||
| 39.0 | 19.2 | 611.578 | ||||||||
Table A2.
The SIFs and T-stresses of experimental fracture results obtained for the tested sandstone material under different loading modes.
Table A2.
The SIFs and T-stresses of experimental fracture results obtained for the tested sandstone material under different loading modes.
| α (°) | β (°) | Tave(Mpa) | |||
|---|---|---|---|---|---|
| 0 | 0 | 0.380 | 0.000 | 0.000 | 0.116 |
| 15 | 0.356 | 0.070 | 0.000 | 0.370 | |
| 30 | 0.238 | 0.094 | 0.000 | 0.710 | |
| 45 | 0.212 | 0.128 | 0.000 | 1.290 | |
| 60 | 0.147 | 0.117 | 0.000 | 1.585 | |
| 15 | 0 | 0.283 | 0.000 | 0.047 | 0.119 |
| 15 | 0.336 | 0.068 | 0.053 | 0.395 | |
| 30 | 0.273 | 0.112 | 0.038 | 0.863 | |
| 45 | 0.213 | 0.126 | 0.050 | 1.289 | |
| 60 | 0.159 | 0.125 | 0.047 | 1.696 | |
| 30 | 0 | 0.260 | 0.000 | 0.089 | 0.186 |
| 15 | 0.302 | 0.068 | 0.099 | 0.466 | |
| 30 | 0.277 | 0.102 | 0.112 | 0.864 | |
| 45 | 0.202 | 0.114 | 0.099 | 1.188 | |
| 60 | 0.137 | 0.104 | 0.084 | 1.421 | |
| 45 | 0 | 0.221 | 0.000 | 0.122 | 0.231 |
| 15 | 0.233 | 0.041 | 0.134 | 0.383 | |
| 30 | 0.197 | 0.070 | 0.129 | 0.636 | |
| 45 | 0.154 | 0.085 | 0.123 | 0.882 | |
| 60 | 0.095 | 0.073 | 0.098 | 0.960 | |
| 60 | 0 | 0.162 | 0.000 | 0.137 | 0.254 |
| 15 | 0.167 | 0.032 | 0.147 | 0.185 | |
| 30 | 0.122 | 0.047 | 0.124 | 0.332 | |
| 45 | 0.097 | 0.059 | 0.123 | 0.490 | |
| 60 | 0.057 | 0.052 | 0.099 | 0.540 |
Table A3.
The coefficients of Equation (12) under the plane stress state.
Table A3.
The coefficients of Equation (12) under the plane stress state.
Table A4.
The coefficients of Equation (12) under the plane strain state.
Table A4.
The coefficients of Equation (12) under the plane strain state.
References
- Columbus, D.; Grujicic, M. A comparison of mode I fracture behavior of fcc and bcc metallic materials: A discrete dislocation analysis. Appl. Surf. Sci. 2001, 180, 138–161. [Google Scholar] [CrossRef]
- Horovistiz, A.L.; De Campos, K.A.; Shibata, S.; Prado, C.C.; Hein, L.R.D.O. Fractal characterization of brittle fracture in ceramics under mode I stress loading. Mater. Sci. Eng. A 2010, 527, 4847–4850. [Google Scholar] [CrossRef]
- Ayatollahi, M.; Moghaddam, M.R.; Razavi, S.; Berto, F. Geometry effects on fracture trajectory of PMMA samples under pure mode-I loading. Eng. Fract. Mech. 2016, 163, 449–461. [Google Scholar] [CrossRef]
- Bura, E.; Seweryn, A. Mode I fracture in PMMA specimens with notches—Experimental and numerical studies. Theor. Appl. Fract. Mech. 2018, 97, 140–155. [Google Scholar] [CrossRef]
- Iqbal, M.; Mohanty, B. Experimental calibration of stress intensity factors of the ISRM suggested cracked chevron-notched Brazilian disc specimen used for determination of mode-I fracture toughness. Int. J. Rock Mech. Min. Sci. 2006, 43, 1270–1276. [Google Scholar] [CrossRef]
- Iqbal, M.J.; Mohanty, B. Experimental Calibration of ISRM Suggested Fracture Toughness Measurement Techniques in Selected Brittle Rocks. Rock Mech. Rock Eng. 2006, 40, 453–475. [Google Scholar] [CrossRef]
- Zuo, J.-P.; Xie, H.-P.; Dai, F.; Ju, Y. Three-point bending test investigation of the fracture behavior of siltstone after thermal treatment. Int. J. Rock Mech. Min. Sci. 2014, 70, 133–143. [Google Scholar] [CrossRef]
- Ameri, M.; Mansourian, A.; Pirmohammad, S.; Aliha, M.; Ayatollahi, M. Mixed mode fracture resistance of asphalt concrete mixtures. Eng. Fract. Mech. 2012, 93, 153–167. [Google Scholar] [CrossRef]
- Razmi, A.; Mirsayar, M. On the mixed mode I/II fracture properties of jute fiber-reinforced concrete. Constr. Build. Mater. 2017, 148, 512–520. [Google Scholar] [CrossRef]
- Ayatollahi, M.; Aliha, M. Wide range data for crack tip parameters in two disc-type specimens under mixed mode loading. Comput. Mater. Sci. 2007, 38, 660–670. [Google Scholar] [CrossRef]
- Berto, F.; Lazzarin, P.; Gomez, F.J.; Elices, M. Fracture assessment of U-notches under mixed mode loading: Two procedures based on the ‘equivalent local mode I’ concept. Int. J. Fract. 2007, 148, 415–433. [Google Scholar] [CrossRef]
- Gómez, F.J.; Elices, M.; Berto, F.; Lazzarin, P. Fracture of V-notched specimens under mixed mode (I + II) loading in brittle materials. Int. J. Fract. 2009, 159, 121–135. [Google Scholar] [CrossRef]
- Dong, S. Theoretical analysis of the effects of relative crack length and loading angle on the experimental results for cracked Brazilian disk testing. Eng. Fract. Mech. 2008, 75, 2575–2581. [Google Scholar] [CrossRef]
- Dong, S.; Wang, Y.; Xia, Y. Stress intensity factors for central cracked circular disk subjected to compression. Eng. Fract. Mech. 2004, 71, 1135–1148. [Google Scholar] [CrossRef]
- Dong, S.; Wang, Y.; Xia, Y. A finite element analysis for using Brazilian disk in split Hopkinson pressure bar to investigate dynamic fracture behavior of brittle polymer materials. Polym. Test. 2006, 25, 943–952. [Google Scholar] [CrossRef]
- Hua, W.; Dong, S.; Li, Y.; Wang, Q. Effect of cyclic wetting and drying on the pure mode II fracture toughness of sandstone. Eng. Fract. Mech. 2016, 153, 143–150. [Google Scholar] [CrossRef]
- Hua, W.; Dong, S.; Peng, F.; Li, K.; Wang, Q. Experimental investigation on the effect of wetting-drying cycles on mixed mode fracture toughness of sandstone. Int. J. Rock Mech. Min. Sci. 2017, 93, 242–249. [Google Scholar] [CrossRef]
- Hua, W.; Li, J.; Dong, S.; Pan, X. Experimental Study on Mixed Mode Fracture Behavior of Sandstone under Water–Rock Interactions. Processes 2019, 7, 70. [Google Scholar] [CrossRef]
- Aliha, M.; Ayatollahi, M.; Smith, D.; Pavier, M. Geometry and size effects on fracture trajectory in a limestone rock under mixed mode loading. Eng. Fract. Mech. 2010, 77, 2200–2212. [Google Scholar] [CrossRef]
- Aliha, M.R.M.; Ayatollahi, M.R. Brittle fracture evaluation of a fine grain cement mortar in combined tensile-shear deformation. Fatigue Fract. Eng. Mater. Struct. 2010, 32, 987–994. [Google Scholar] [CrossRef]
- Pantano, A.; Averill, R.C. A penalty-based finite element interface technology. Comput. Struct. 2002, 80, 1725–1748. [Google Scholar] [CrossRef]
- Pantano, A.; Averill, R.C. A penalty-based interface technology for coupling independently modeled 3D finite element meshes. Finite Elem. Anal. Des. 2007, 43, 271–286. [Google Scholar] [CrossRef]
- Pantano, A. Cohesive Model for the Simulation of Crack Initiation and Propagation in Mixed-Mode I/II in Composite Materials. Appl. Compos. Mater. 2019, 26, 1207–1225. [Google Scholar] [CrossRef]
- Margevicius, R.; Riedle, J.; Gumbsch, P. Fracture toughness of polycrystalline tungsten under mode I and mixed mode I/II loading. Mater. Sci. Eng. A 1999, 270, 197–209. [Google Scholar] [CrossRef]
- Choi, S.; Zhu, D.; Miller, R. Fracture behavior under mixed-mode loading of ceramic plasma-sprayed thermal barrier coatings at ambient and elevated temperatures. Eng. Fract. Mech. 2005, 72, 2144–2158. [Google Scholar] [CrossRef]
- Ayatollahi, M.; Aliha, M.; Hassani, M. Mixed mode brittle fracture in PMMA—An experimental study using SCB specimens. Mater. Sci. Eng. A 2006, 417, 348–356. [Google Scholar] [CrossRef]
- Aliha, M.; Saghafi, H. The effects of thickness and Poisson’s ratio on 3D mixed-mode fracture. Eng. Fract. Mech. 2013, 98, 15–28. [Google Scholar] [CrossRef]
- Aliha, M.; Ayatollahi, M. Mixed mode I/II brittle fracture evaluation of marble using SCB specimen. Procedia Eng. 2011, 10, 311–318. [Google Scholar] [CrossRef]
- Funatsu, T.; Kuruppu, M.; Matsui, K. Effects of temperature and confining pressure on mixed-mode (I–II) and mode II fracture toughness of Kimachi sandstone. Int. J. Rock Mech. Min. Sci. 2014, 67, 1–8. [Google Scholar] [CrossRef]
- Ameri, B.; Taheri-Behrooz, F.; Aliha, M. Fracture loads prediction of the modified 3D-printed ABS specimens under mixed-mode I/II loading. Eng. Fract. Mech. 2020, 235, 107181. [Google Scholar] [CrossRef]
- Aliha, M.R.M.; Hosseinpour, G.R.; Ayatollahi, M.R. Application of Cracked Triangular Specimen Subjected to Three-Point Bending for Investigating Fracture Behavior of Rock Materials. Rock Mech. Rock Eng. 2012, 46, 1023–1034. [Google Scholar] [CrossRef]
- Mousavi, S.; Aliha, M.; Imani, D. On the use of edge cracked short bend beam specimen for PMMA fracture toughness testing under mixed-mode I/II. Polym. Test. 2020, 81, 106199. [Google Scholar] [CrossRef]
- Avci, A.; Akdemir, A.; Arikan, H. Mixed-mode fracture behavior of glass fiber reinforced polymer concrete. Cem. Concr. Res. 2005, 35, 243–247. [Google Scholar] [CrossRef]
- Seifi, R.; Omidvar, N. Fatigue crack growth under mixed mode I + III loading. Mar. Struct. 2013, 34, 1–15. [Google Scholar] [CrossRef]
- Liu, S.; Chao, Y.J.; Zhu, X. Tensile-shear transition in mixed mode I/III fracture. Int. J. Solids Struct. 2004, 41, 6147–6172. [Google Scholar] [CrossRef]
- Aliha, M.; Bahmani, A.; Akhondi, S. Numerical analysis of a new mixed mode I/III fracture test specimen. Eng. Fract. Mech. 2015, 134, 95–110. [Google Scholar] [CrossRef]
- Aliha, M.R.M.; Bahmani, A. Rock Fracture Toughness Study under Mixed Mode I/III Loading. Rock Mech. Rock Eng. 2017, 50, 1739–1751. [Google Scholar] [CrossRef]
- Aliha, M.; Bahmani, A.; Akhondi, S. Determination of mode III fracture toughness for different materials using a new designed test configuration. Mater. Des. 2015, 86, 863–871. [Google Scholar] [CrossRef]
- Aliha, M.; Bahmani, A.; Akhondi, S. A novel test specimen for investigating the mixed mode I+III fracture toughness of hot mix asphalt composites—Experimental and theoretical study. Int. J. Solids Struct. 2016, 90, 167–177. [Google Scholar] [CrossRef]
- Bahmani, A.; Aliha, M.; Berto, F. Investigation of fracture toughness for a polycrystalline graphite under combined tensile-tear deformation. Theor. Appl. Fract. Mech. 2017, 90, 53–64. [Google Scholar] [CrossRef]
- Lin, B.; Mear, M.E.; Ravi-Chandar, K. Criterion for initiation of cracks under mixed-mode I + III loading. Int. J. Fract. 2010, 165, 175–188. [Google Scholar] [CrossRef]
- Ahmadi-Moghadam, B.; Taheri, F. An effective means for evaluating mixed-mode I/III stress intensity factors using single-edge notch beam specimen. J. Strain Anal. Eng. Des. 2013, 48, 245–257. [Google Scholar] [CrossRef]
- Erdogan, F.; Sih, G.C. On the Crack Extension in Plates under Plane Loading and Transverse Shear. J. Fluids Eng. 1963, 85, 519–525. [Google Scholar] [CrossRef]
- Chang, K.J. On the maximum strain criterion—A new approach to the angled crack problem. Eng. Fract. Mech. 1981, 14, 107–124. [Google Scholar] [CrossRef]
- Ayatollahi, M.R.; Saboori, B. Maximum tangential strain energy density criterion for general mixed mode I/II/III brittle fracture. Int. J. Damage Mech. 2014, 24, 263–278. [Google Scholar] [CrossRef]
- Hua, W.; Huang, J.; Pan, X.; Li, J.; Dong, S. An extended maximum tangential strain energy density criterion considering T-stress for combined mode I–III brittle fracture. Fatigue Fract. Eng. Mater. Struct. 2020, 44, 169–181. [Google Scholar] [CrossRef]
- Bažant, Z.P.; Estenssoro, L.F. Surface singularity and crack propagation. Int. J. Solids Struct. 1979, 15, 405–426. [Google Scholar] [CrossRef]
- Bidadi, J.; Akbardoost, J.; Aliha, M.R.M. Thickness effect on the mode III fracture resistance and fracture path of rock using ENDB specimens. Fatigue Fract. Eng. Mater. Struct. 2020, 43, 277–291. [Google Scholar] [CrossRef]
- Patel, J.; Ayyar, A.; Peralta, P. Kink band evolution in polymer matrix composites under bending: A digital image correlation study. J. Reinf. Plast. Compos. 2020, 39, 852–866. [Google Scholar] [CrossRef]
- Zhang, H.; Fu, D.; Song, H.; Kang, Y.; Huang, G.; Qi, G.; Li, J. Damage and Fracture Investigation of Three-Point Bending Notched Sandstone Beams by DIC and AE Techniques. Rock Mech. Rock Eng. 2015, 48, 1297–1303. [Google Scholar] [CrossRef]
- Hua, W.; Dong, S.; Fan, Y.; Pan, X.; Wang, Q. Investigation on the correlation of mode II fracture toughness of sandstone with tensile strength. Eng. Fract. Mech. 2017, 184, 249–258. [Google Scholar] [CrossRef]
- Hua, W.; Dong, S.; Li, Y.; Xu, J.; Wang, Q. The influence of cyclic wetting and drying on the fracture toughness of sandstone. Int. J. Rock Mech. Min. Sci. 2015, 78, 331–335. [Google Scholar] [CrossRef]
- Dehestani, A.; Hosseini, M.; Beydokhti, A.T. Effect of wetting—Drying cycles on mode I and mode II fracture toughness of sandstone in natural (pH = 7) and acidic (pH = 3) environments. Theor. Appl. Fract. Mech. 2020, 107, 102512. [Google Scholar] [CrossRef]
- Williams, M.L. The Bending Stress Distribution at the Base of a Stationary Crack. J. Appl. Mech. 1961, 28, 78–82. [Google Scholar] [CrossRef]
- Wang, B. Material Strength: A Rational Nonequilibrium Energy Model for Complex Loadings. J. Appl. Mech. 2021, 88, 1–23. [Google Scholar] [CrossRef]


Publisher’s Note: MDPI stays neutral with regard to jurisdictional claims in published maps and institutional affiliations. |
© 2021 by the authors. Licensee MDPI, Basel, Switzerland. This article is an open access article distributed under the terms and conditions of the Creative Commons Attribution (CC BY) license (http://creativecommons.org/licenses/by/4.0/).