Article

Monitoring the Hydration Process in Carbon Nanotube Reinforced Cement-Based Composites Using Nonlinear Elastic Waves

by
Ilias K. Tragazikis
,
Theodoti Z. Kordatou
,
Dimitrios A. Exarchos
,
Panagiota T. Dalla
and
Theodore E. Matikas
*
Department of Materials Science & Engineering, University of Ioannina, 45110 Ioannina, Greece
*
Author to whom correspondence should be addressed.
Appl. Sci. 2021, 11(4), 1720; https://doi.org/10.3390/app11041720
Submission received: 27 January 2021 / Revised: 2 February 2021 / Accepted: 11 February 2021 / Published: 15 February 2021
(This article belongs to the Section Acoustics and Vibrations)

Abstract

:
There is currently an increased need for associating construction material properties and behavior with the nature of their microstructure. One of the major issues in this context is the need for understanding the curing process in freshly poured cement-based materials. This is particularly important when nanoreinforcement materials, such as carbon nanotubes, are used to enhance the mechanical behavior and multifunctionality of the final structure. The solidification point, at which the state of liquid suspension transmutes to the solid state, is of particular interest since it greatly influences the load-bearing capacity of the cement-based material and its structural behavior at the long term. The main purpose of the present work is to develop a reliable method for monitoring the hydration process during the early stages of freshly poured cementitious composites enhanced with carbon nanotubes. This methodology is based on the use of nonlinear elastic waves. To achieve this goal, a combination of contact ultrasonics with noncontact optical detection was used. The detection method for evaluating the setting process is based on the assessment of higher-harmonic amplitudes of an ultrasonic wave, with a given frequency, propagating through the cementitious material. It was observed that the material nonlinearity changes significantly during the hardening process, compared to velocity or attenuation measurements which are based on linear acoustics. These changes were more noticeable as the concentration of carbon nanotubes in the cement matrix increases, indicating that higher harmonics are more susceptible to minute microstructural changes.

1. Introduction

As concrete is the most widely used material in construction, broad research efforts are invested in enhancing its properties. One of its essential advantages, in comparison with other common building materials, is that concrete can bear different kinds of supplementary materials and admixtures. The diversity that presents is remarkable because of its heterogeneity and complex microstructure, as well as the fact that its phase modifications occur over a short time after mixing [1,2]. In cement-based materials, in which aggregates have been used, a transition zone at the interface between cement paste and aggregates takes place. Since aggregates limit the water motion at this zone, the area is prone to microcracking due to the formation of porosity after hydration. Moreover, initial microcracking may occur at the bulk phase since the hydration process consumes water causing drying and reduction of the material volume. Such formation of microcracking during the hardening process could lead to the degradation of the concrete’s durability. [3].
In addition, the brittleness of the cement-based specimens could be modified by the implementation of common natural, polymeric or steel fibers [4,5,6]. The use of such additives, besides some drawbacks like increased cost and decreased workability, present significant advantages since they promote improved cohesion in the fresh concrete, elevated shear and flexural strengths, enhanced load capacity and ductility and improved fracture toughness and less cracking due to early-age shrinkage. Carbon-based additives, such as multiwalled carbon nanotubes in cementitious materials are admixtures that play the role of strain and damage sensors inside the matrix and improve plenty of properties like flexural and compressive strength, the fracture energy as well as the tensile strength and electrical conductivity of the carbon nanotube (CNT)-reinforced cement [7,8,9,10,11,12,13].
Critical region for ensuring load-carrying capacity and other remarkable characteristics of nanoenhanced materials is the interphase between the matrix and the nanocomposite [14]. For this reason, various models have been developed that simulate the inner interaction of the final material’s ingredients [15,16,17].
Different researchers report on the initial stages of concrete curing process that effects on the material’s durability, while there are approaches reported in the literature focusing on the relation between nonlinear properties of the hardened concrete and microcracking formation [18]. The hydration process leads to the concrete hardening because of its greatly exothermic behavior [19], while it occurs when dry cement interacts with water and as a result the microstructure of the hardened materials is affected. It has been observed that, during hydration, the physical properties of concrete develop depending on the critical phase change behavior that occurs in the solidification process [20].
Furthermore, in order to monitor the material’s structural integrity, nondestructive ultrasonic characterization methods were applied to the freshly poured concrete [20]. The reflection transmission of compressional and transversal elastic waves are widely used to quantify processes, while the compressional wave velocity is extensively used as an indicator of the hardening process. In general, the devices used for compressional wave transmission measurements are intended to automatically record the compressional wave velocity, frequency and relative energy [21,22].
During concrete’s hardening, the linear elastic properties of the material have been assessed using active ultrasonic echographic measurements [1,23,24]. In their study, Boumiz [25,26] and Morin [27], investigated the formation of a capillary network during the hydration process study of a high-performance concrete and presented the impact of linear elastic material modulii combined with measurements of volumetric shrinkage. In addition, other studies evaluated the effect of elastic wave propagation in suspensions on hardening properties of cementitious materials [24,28,29], while Keating et al. [30,31] observed that the velocity of longitudinal waves exhibits a three-stage behavior after the mixing procedure.
In the content of cementitious materials technology and their nondestructive evaluation, ultrasonic experiments are commonly applied in order to investigate the materials properties, its strength, as well as the setting and hardening process at early ages [21,22,32,33,34,35,36,37,38,39,40,41]. Using ultrasonic techniques, the mechanisms of interaction between the elastic waves and the material microstructure can be revealed, allowing for the assessment of the material properties compared with those at the virgin state [1]. The in-situ application of the ultrasound technique presents advantages since it only requires one side of the testing specimen to be accessible.
The present study aims at presenting a reliable nondestructive approach, based on nonlinear elastic wave propagation, to monitor the early stages of cement-based composites reinforced with carbon nanotubes during their hydration process. To this goal, experiments were carried out by using a custom-built monitoring system integrating different nondestructive techniques. The system consists of a contact ultrasonics transducer that induces elastic waves into the material and a noncontact laser vibrometer detection device, which operates based on the Doppler effect. Monitoring the amplitudes of the second and third order harmonic vibrations of elastic waves propagating through the material allowed the determination of nonlinear parameters which can be associated to the materials’ microstructure during the hydration process.

2. Theoretical Background

In general, an ultrasonic pulse propagating through a nonlinear medium exhibits dispersion, i.e., each frequency of the pulse wave propagates at a different velocity value, and the pulse is distorted. This could be presented at the A-scan acoustic pressure as a function of time. In the frequency domain (the signal magnitude as a function of frequency), there is a graph with a maximum value at the central frequency of the pulse. In the present study, monochromatic ultrasonic waves, i.e., waves with a single frequency that are induced in the material, are used. In the frequency domain, the magnitude over frequency is, therefore, a single vertical line, which is described by the amplitude of the characteristic wave propagating through the material. According to nonlinear acoustics, A0 is the amplitude (magnitude) of the fundamental frequency that is induced in the material. A1, A2, and A3 are respectively the amplitudes (magnitudes) of the waves that are received after they propagated through the material; A1 is the amplitude of the fundamental frequency, A2 of the 2nd harmonic and A3 of the 2nd harmonic. While a pure fundamental frequency f is induced in the material, the material itself being a nonlinear medium generates the harmonics 2f, 3f and higher.
In brief, the combination of the fundamental and harmonics amplitudes, as shown in the theoretical background, represents the way that these harmonics interact in the medium during the hardening process.
Inherently, the materials that are applied in technological needs are nonlinear media and this has as a result, the deformation of a fundamental elastic wave (sin ωt) when the wave is propagating in such material [42,43,44]. The expansion of acoustic wave propagation equation by introducing nonlinear terms into the stress–strain relationship, leads to the estimation of higher-order elastic constants of a structure. The parameter that is symbolized with β is the expression of the material’s intrinsic nonlinearity. The generation of second- and higher-order harmonics is derived from a monochromatic longitudinal wave propagating through a solid medium. Equation (1) refers to the differential equation of motion which presents a coefficient for each term that distinguishes the linear and nonlinear terms,
ρ ο u ¨ = α 2 u a i 2 + δ u a i ( 2 u a i 2 )
the values α and δ express the elastic constants. In addition, the coefficient α is expressed only in terms of the second-order elastic constants; however, the coefficient δ is expressed in terms of elastic constants of both the second and third orders [44,45].
An approximate solution involving the second harmonic can be obtained by considering a solution to Equation (1) in the form u = uo + u’ and by performing suitable substitutions:
u ( a , t ) = A s i n ( k a ω t ) a   δ k 2 A 2 8   ρ 0 C 0 2 c o s [ 2 ( k a ω t ) ]
where C0 = (α/ρ0)1/2 is the ultrasonic phase velocity.
In the wave equation, the nonlinear acoustics parameter, β, is defined as the ratio of the nonlinear to the linear term. It is then possible to rewrite Equation (2) as:
u ( a , t ) = A s i n ( k a ω t ) + a β 2 ( k A ) 2 8 c o s [ 2 ( k a ω t ) ]
The amplitude A in the first term and the expression a β 2 ( k A ) 2 8 in the second term of Equation (3), are respectively, the fundamental amplitude A1 and the second harmonic amplitude A2. The nonlinearity parameter of the second order, β2, can therefore be expressed in terms of amplitudes A1 and A2:
β 2 = 8 a k 2 ( A 2 A 1 2 )
where a is the propagation distance and k = 2π/λ is the wavenumber.
In addition, the third-order nonlinear parameter, β3 can be expressed as a function of the amplitude A1 of the fundamental frequency and the amplitude A3 of the third harmonic, as presented in the following equation:
β 3 = 8 a k 2 ( A 3 A 1 3 )
The nonlinearity parameters concern the higher order elastic constants of the material [44,46,47]. Noncontact vibration measurements were performed in the present research in order the amplitudes of the harmonics to be calculated and the nonlinear parameters to be exported.

3. Materials and Methods

The methodology used in this study is based on the propagation of an ultrasonic wave through the material with a single frequency and the detection of the higher-order harmonic signals at the other side, for measuring the second- and third-order harmonic amplitudes. To transmit the wave through the material, a narrow bandwidth transducer was used, driven at a certain frequency f. The ultrasonic waves propagated through the material were detected using a Laser Doppler Vibrometer (LDV).The scanning vibrometry system used in this study was PSV-400 by Polytec, equipped with a digital velocity decoder, with 8 velocity ranges from 1 mm/s/V to 50 mm/s/V and a maximum bandwidth of 350 KHz and two digital displacement decoders, one with bandwidth 0–2.5 MHz and another for high frequency measurements up to 24 MHz. LDV is commonly used for nondestructive flaw detection for the calculation of structural dynamics. Using a noncontact optical detection device like a laser Doppler Vibrometry presents certain advantages such as its high resolution in velocity and out-of-plane displacement measurements. The testing sample is not affected by the light that the vibrometer uses as a sensor, making it completely noninvasive and allowing measurements to be performed on any type of structure. LDV’s operating principle is based on Doppler effect. In case of a wave reflected by a moving object, detected by a Laser Doppler Vibrometer, the frequency shift fD can be expressed as:
f D   =   2   ν λ
where v is the velocity of the object. λ is the wavelength.
In addition, based on the principle of operation of a laser interferometer, the Doppler frequency shift should be measured at a known wavelength for the velocity of an object to be determined. The LDV’s laser beam is directed to the surface of interest. Because of the motion of the surface, the Doppler frequency shift of the reflected laser beam leads to extracting the frequency and amplitude of vibration.
In the present study, the measurements were performed on a mold that volumes 150 × 170 × 50 mm3. During the initial 48 h of hydration data were recorded every 4 min. In total eighteen different mixtures were used with water to cement ratio equal to 0.5, while they were all enhanced with multiwalled carbon nanotubes. Nine mixtures of cement paste, three for each concentration of 0.2, 0.4, 0.6 wt.% of cement CNTs, and respectively nine mixtures for mortar mixtures with the same nanoreinforcement percentages. The multiwalled carbon nanotubes used in this study were synthesized by catalytic chemical vapor deposition (Shenzhen Nanotech Port Co. Ltd., Shenzhen, China). Their nominal physical properties are shown in Table 1. Viscocrete Ultra 300 (Sika AG, Baar, Switzerland) was selected as dispersion agent because of its efficiency in carbon-based materials’ production [48]. For the production of nanocomposite cement pastes and mortars, the superplasticizer and tubes were mixed in regular tap water at a mass ratio of 1.5/1 and then magnetically stirred for 2 min. The resulting liquid suspensions were then ultrasonicated for 90 min at room temperature using a Hielscher UP400S ultrasonicator (Hielscher Ultrasonics GmbH, Teltow, Germany) equipped with a cylindrical Ø22 mm sonotrode, which delivers a 4500 J/min power throughput at a frequency of 24 kHz. The ultrasonicated suspensions were next transferred into a vacuum desiccator for the complete removal of entrapped air prior to mixing with sand and cement. The suspension was placed into a rotary mixer, where it was blended according to BS EN 196-1 standard. Ordinary Portland cement (OPC type I-42.5N) was used in the case of cement paste. As it was mentioned before, the water to cement ratio was 0.5, both for pastes and mortars. Natural sand was additionally used for mortars, where sand to cement ratio equals 3.
As it concerns the mold used for the active ultrasonic measurements, it consists of a circular opening on the backside for the ideal fit of the longitudinal piezoelectric contact transducer. To avoid the leakage at the opening, a thin plastic film was placed around the hole. The transducer’s peak frequency was at 0.20 ΜHz while its distance from the thin glass was 50 mm. To prevent the influence of the glass to harmonic oscillations amplitudes, a hole was opened, and a 1 mm-thick special glass was placed on the back side of the mold. In addition, the mold was positioned on a vice and was clamped using a torque wrench for achieving perfect contact between the transducer and the fresh cement mixture.
For generating nonlinear ultrasonic oscillations an absolute linear pulser, RPR-4000-VHP High Power Pulser Receiver system by Ritec was used. This way, it was ensured that the received nonlinear signals were due to the material’s nonlinear behavior and not due to the measuring device itself. In addition, it was placed a thermocouple for monitoring the maturity process. The maturity method is a reliable technique determining the real-time strength values during the hardening of concrete, based on monitoring the concrete temperature over time. It is according to the ASTM C1074 standard and represents the progression of concrete hardening. The ConReg-700 device by Germann Instruments was used for recording maturity values in this study. For controlling the outside temperature, the whole experimental setup was placed into an environmental chamber (VC³ 4018 by Vötsch). At the beginning of the experiment, the wave propagation parameters such as frequency, high-power voltage and tone burst signal cycles were determined using the LABVIEW software, which communicated with the RITEC instrument with a custom-built routine. Data were collected via PXIe-1071 chassis by National Instruments, consisting of a PXIe-8360 card (PXI Remote Control Module) which was connected with a central computer, while a PXI-8430/2 card (PXI Serial Interface Module) was connected with the Ritec-4000. For the data and waveforms recording, an 8-channel 12-Bit 60 MS/s PXI-5105 (PXI Oscilloscope) was used. Figure 1 depicts the experimental setup. ConReg-700 was controlled via the central computer.

4. Results and Discussion

As it was also observed in previous research [20,24], three stages of the cement paste hardening process occur. These three phases are quite apparent on the obtained diagram of strength as shifts in the slope of the curve.
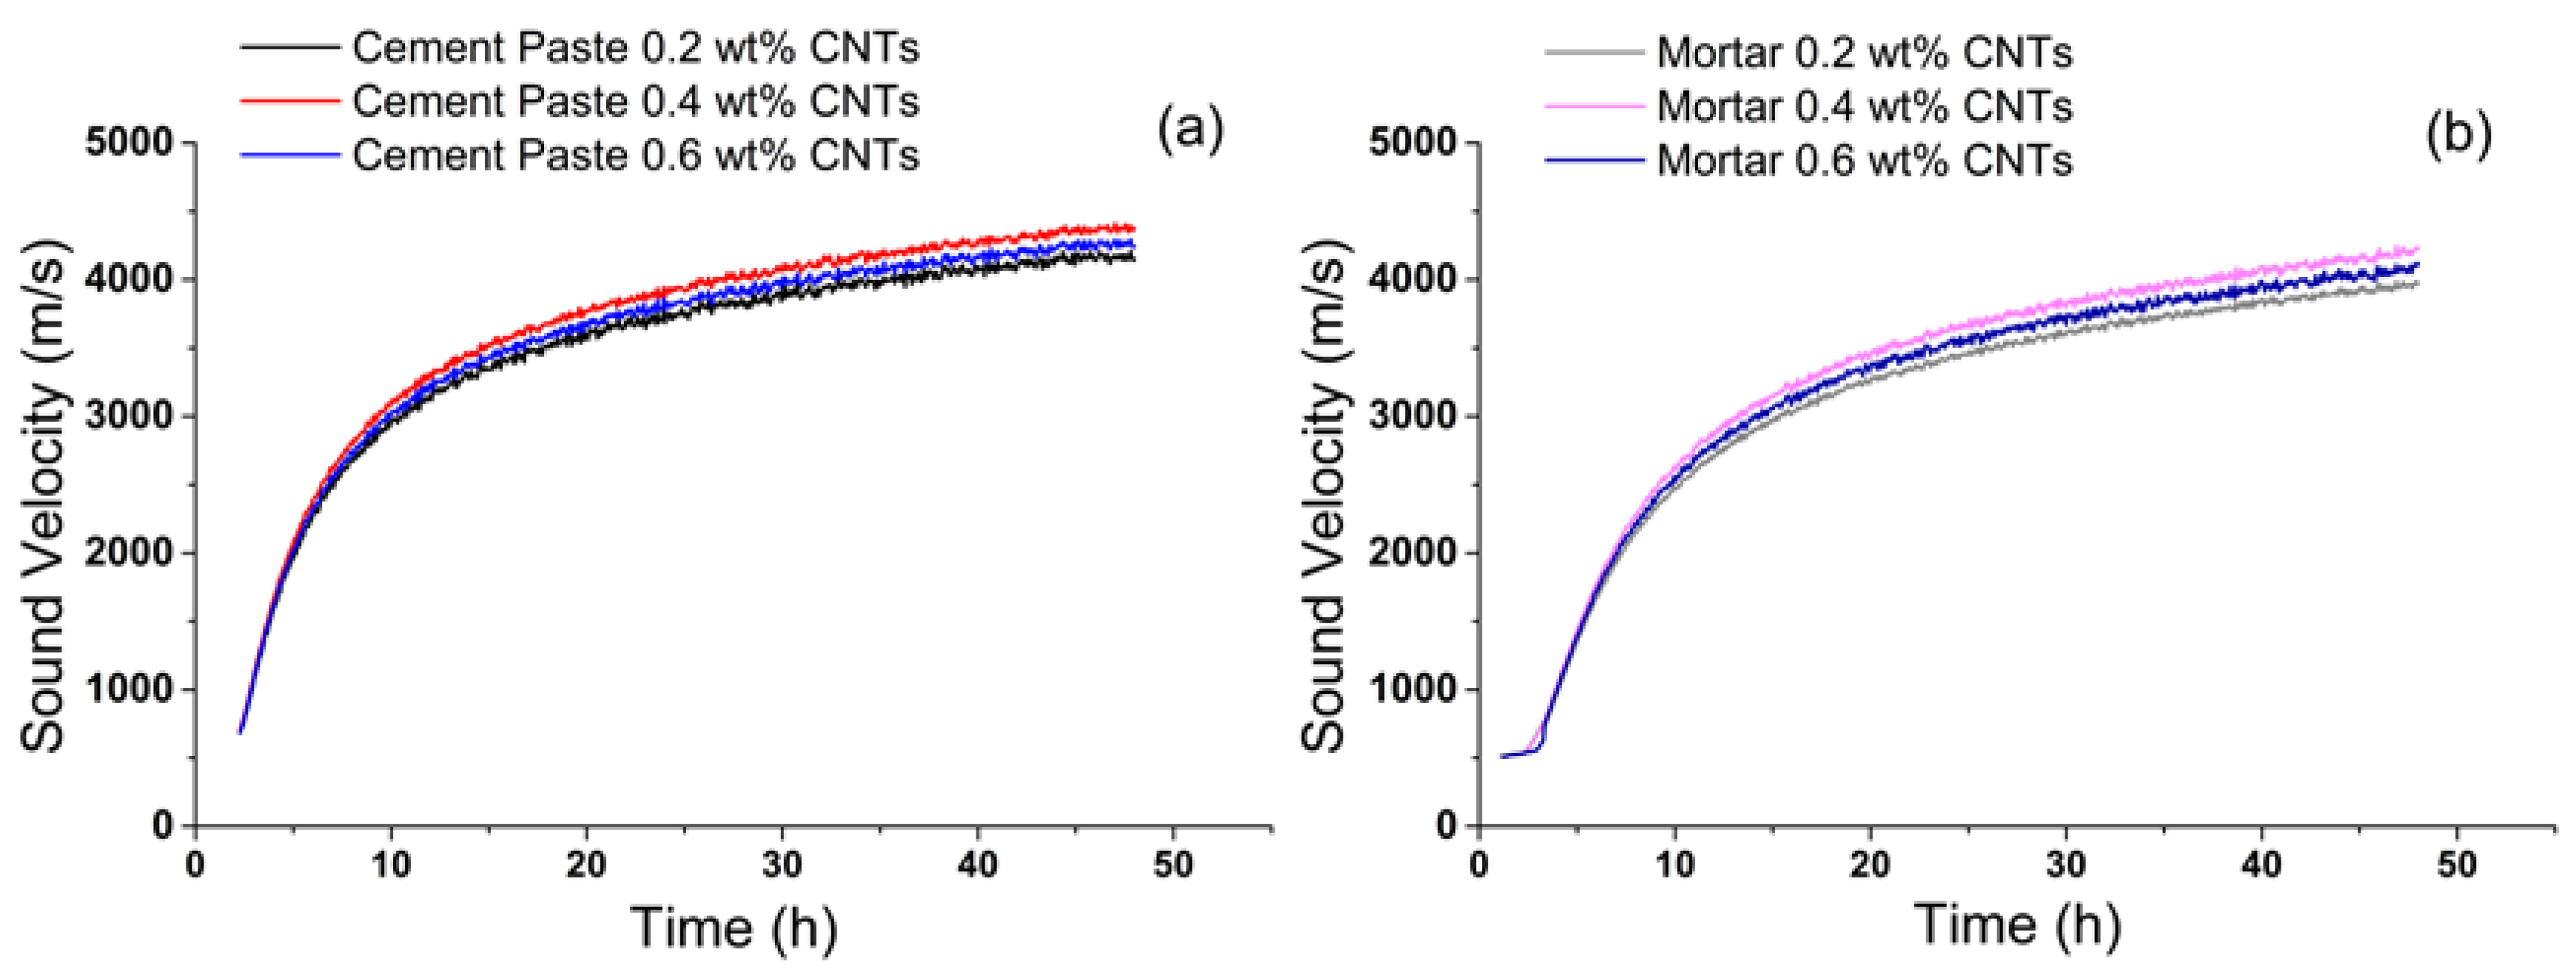
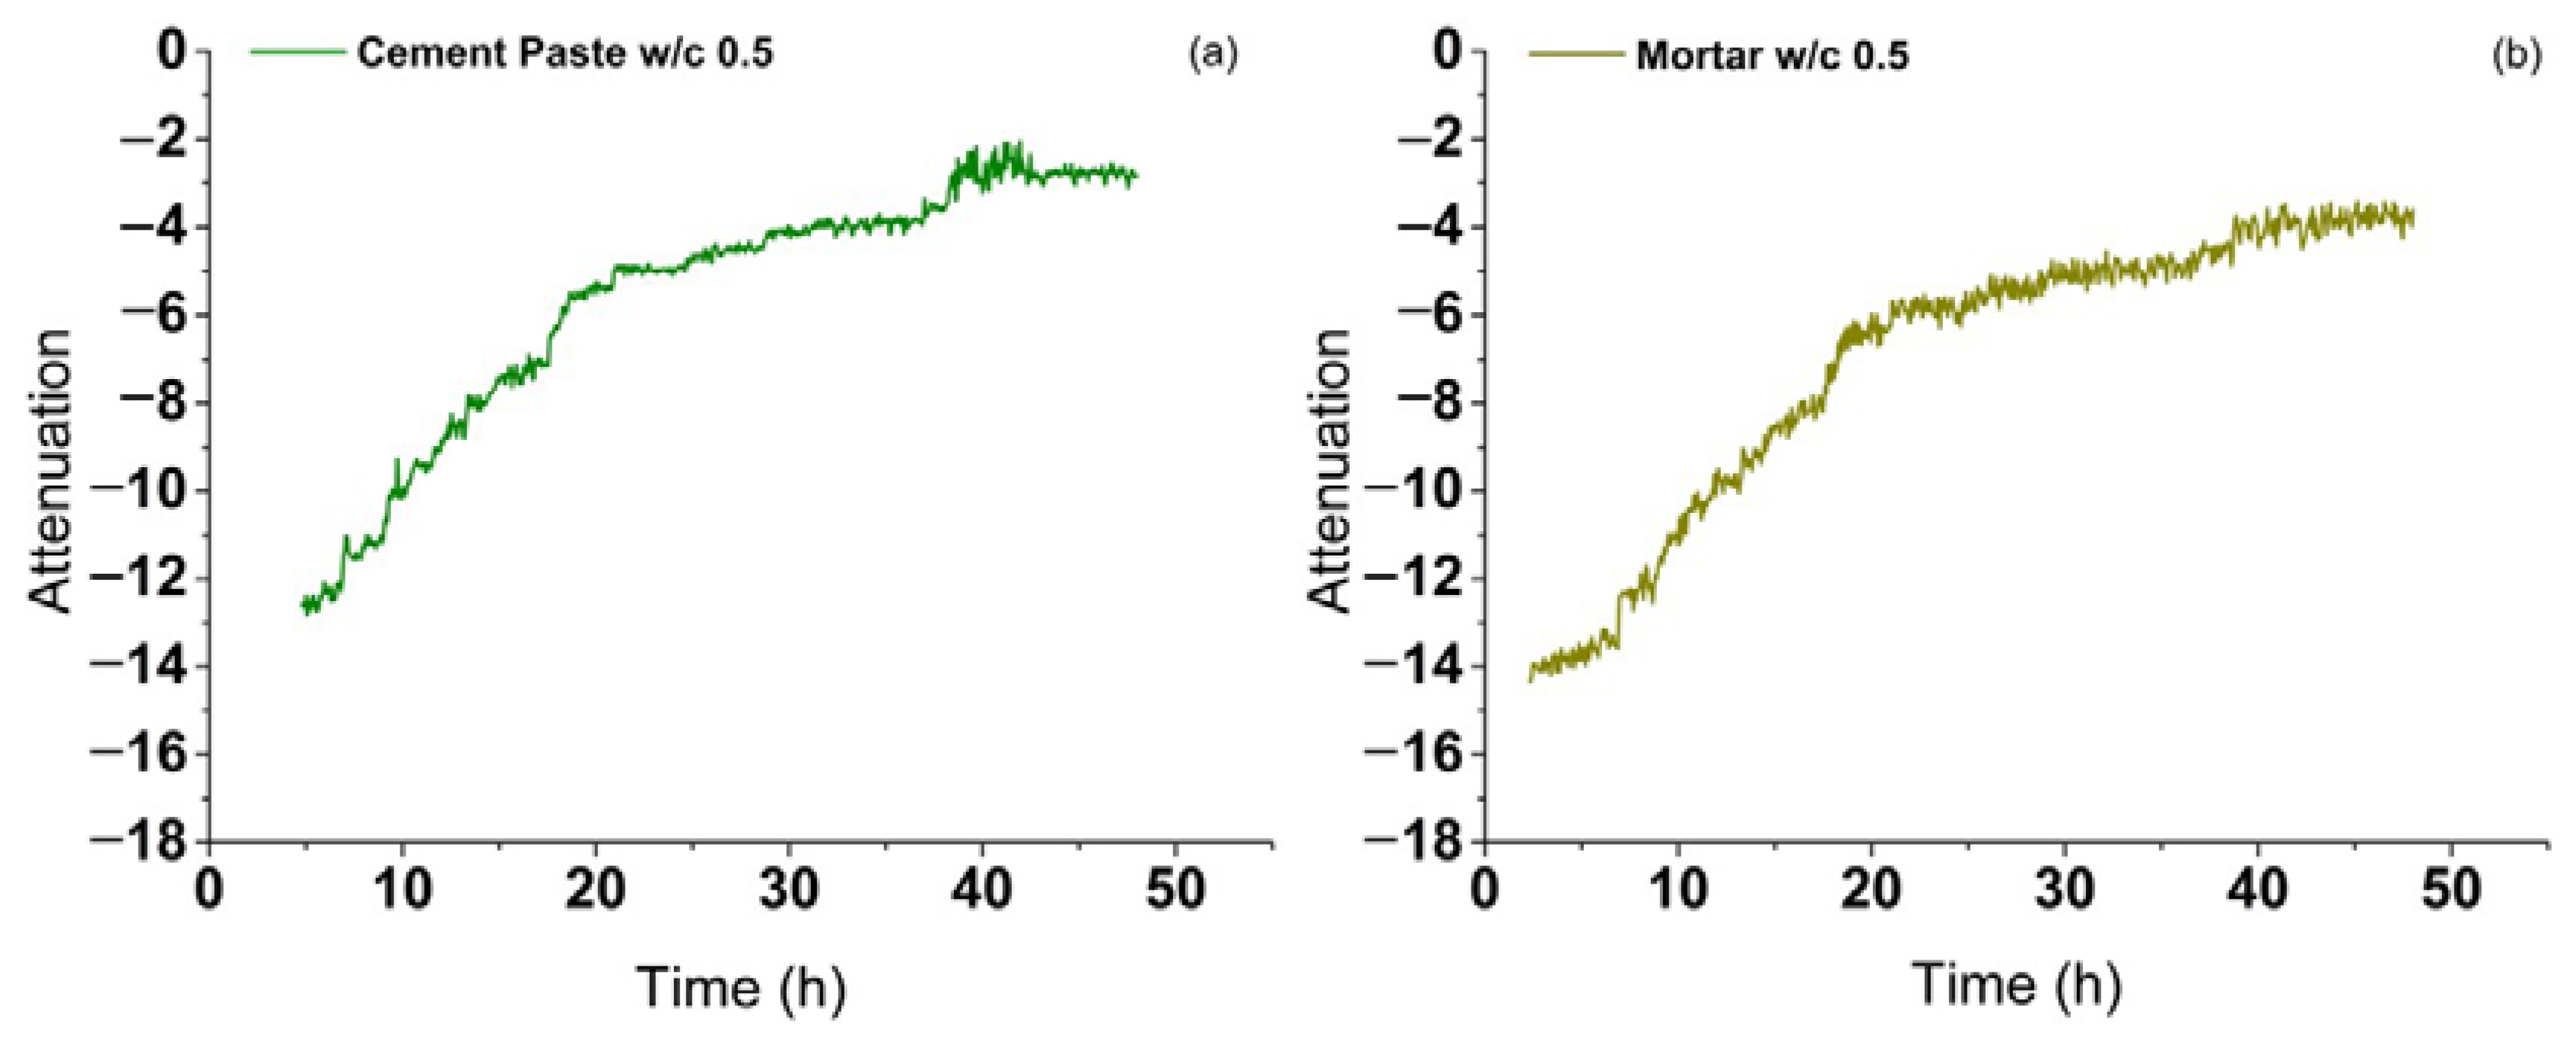
  • On the initial stage, the ultrasonic velocity starts with a value close to the velocity in air (340 m/s), then increases progressively up to values close to 1500 m/s, which is close to the ultrasonic velocity in water.
  • The second stage appears between 1500 m/s and 3000 m/s. The rise of ultrasonic velocity is due to a decrease in water volume and an increase of hydration products with progress of cement paste hydration [20,24,49].
  • Finally, stage 3 occurs after stage 2 is completed, until the end of measurements.
It should be mentioned here that during the initial stage of hydration, during the first 3 to 4 h which is considered as the period needed for the connection of small particles, it was observed an inability to detect any ultrasound signal, a fact that has been also noticed in previous investigations [2,26,50,51,52,53]. This repeatable behavior can be attributed to the high attenuation of the fresh cement-based products.
Regarding the values of sound velocity as a function of time (Figure 2), it was observed that the specimens with 0.4 wt.% of cement CNTs in both the cement paste and mortar, present higher wave speeds in comparison with the rest of nanoinclusion concentrations. Previous studies reported on the correlation of sound velocity with strength of the cementitious materials [38,54,55]. Furthermore, the same trend follow the findings of a previous research regarding the relation between carbon nanotube concentrations and strength values [12]. The specimens reinforced with 0.6 wt.% CNTs present lower strength values than the specimens with 0.4 wt.% CNTs, due to agglomerate creation; they also present higher strength values in comparison with the specimens with 0.2 wt.% CNTs. In addition, according to Figure 2b, the recording of sound velocities began earlier for the mortar specimens in comparison to the cement paste, which took twice as long during the first stage of hydration, when the ultrasonic signals could not be observed (Figure 2a). The fine aggregates are responsible for this behavior because they absorb water and thereby bind a proportion of the water that would make the mixture waterier.
Additionally, the first ultrasonic waves for both types of mixtures were registered at the same velocities, at around 600 m/s (Figure 2). It was observed that there is a rapid rise in sound velocity during Stage 1 and Stage 2 of hydration. The chemical properties of the materials had unexpectedly altered, and the cement paste and mortar textures became denser, leading to an increase of the ultrasonic velocity [24].
Figure 3a,b show the strength over time curves for both types of mixtures. According to the above observations, it would be expected that the strength curve would have the similar trend with the velocity over time graph. However, it is observed that the strength does not follow the exact same trend as the sound velocity. This is due to the strength calculation by ConReg 700, the equipment for the maturity calculation. Τhe algorithm takes various parameters into account for calculating the strength, such as the temperature released during cement hardening. The ConReg 700 algorithm does not consider the concentration of CNTs in the mixture. However, based on the sound velocity measurements it is implied that the samples of cement paste present higher strength values compared to the mortar samples, for all the carbon nanotube concentrations. These elevated strength values occur because the cement paste exhibits higher hydration rates than mortar, since in this case an amount of water is bounded by aggregates. This is further expected since specimen volume and water to cement ratio are kept constant for all specimens; therefore, paste samples contain more cement compared to mortar samples, which have also aggregates.
Figure 4 presents a comparative graph of cement paste and mortar specimens as concerns the materials’ strength during their hardening process. These specimens have no nanoreinforcement and the results are derived from a previous study [20]. Comparing Figure 3 and Figure 4, it is graphically proved the prior acceptance that the algorithm that ConRef-700 equipment uses does not take into consideration at the strength results the existence of the nanoinclusions. Both the form and the values of the strength are extremely similar.
In materials research, the monitoring of hardening process of fresh cement-based materials is an essential for the quality assessment of the material. A sharp rise in temperature, which lasts for about 9 h, was observed during the first stage of the hardening process. The temperature difference was computed by the difference between the temperature of the cement paste (or mortar) and the ambient temperature. According to previous investigations [20], the clustering between the different particles reaches a peak during this stage. First, the smallest particles are created, then follow the largest particles. It was observed that the maximum temperatures for the cement paste specimens were greater than those for the mortar samples. In addition, the pattern of temperature difference was found to be similar for samples of the same type (Figure 5) due to the same value of water to cement ratio for all specimens and the fact that that ConReg’s 700 algorithm does not take into account the CNT concentrations in the mixture, as also mentioned in previous paragraph. In addition, CNTs do not take part in the exothermic chemical reaction.
The higher temperature value in the cement paste specimens indicates that, for a given period more cement powder reacts with water, resulting to higher energy release. This result was expected because for producing the cement paste double amounts of cement powder are used, comparing to mortar samples of same volume.
Figure 6 presents a comparative graph of cement paste and mortar specimens regarding the materials’ released temperature during their hardening process. These specimens have no nanoreinforcement and the results were derived from a previous study [20]. Comparing Figure 5 and Figure 6, it is evident that the algorithm used by the ConRef-700 device does not take into consideration the presence of nanoinclusions. Both the form and the values of the deference in temperature look similar for the released temperatures of both the cement paste and mortar.
The use of linear and stable in time experimental devices should be the prerequisite of any reliable measurement of nonlinear acoustic behavior. This is necessary for the material inherent nonlinear elastic behavior to be reflected rather than the artificial harmonic generation that is produced by the measuring electronics. To demonstrate the long-term stability of the experimental setup for performing nonlinear measurements, the system was assessed over a period of 48 h.
The system was also tested to verify its linearity. If a measurement system is not linear, it cannot be ascertained whether the nonlinear data are due to the material under testing or from the system itself. This test was performed for 48 h on a 28-day hardened specimen (Figure 7a). Based on the relationships A2 = β2A12 and A3 = β3A13, the nonlinearity parameters β2 and β3 were determined [47,56,57,58,59,60]. Based on the above, it becomes obvious that A2 over A12 and A3 over A12 should have a linear slope, since other variables such as sample length and ultrasonic frequency remain constant during the test (Figure 7b,c).
Recording harmonic oscillations during the fluid phase is very difficult due to high attenuation [2]. This issue was solved, using the high power pulser RPR-4000. During the hardening process, noticeable changes in the nonlinear parameter occurred that relate to microstructural changes in the material. The attenuation during the first few hours is too high, but the chemical activity within the material continues to develop. During this stage, a decrease in the nonlinear parameters occurs due to the micromechanical interconnection of the forming particles. Figure 8 presents the nonlinear parameters β2 and β3 as a function of time for the cement paste for the different CNT concentrations. Since the water to cement ratio is constant for all specimens, the changes in the nonlinear parameters for the different specimens are due to the different percentage of the carbon nanotubes.
Figure 9 depicts a summary diagram of the nonlinear parameters β2 and β3 (Figure 9a,b, respectively) as a function of time for the CNT-reinforced cement paste samples. It can be observed that higher CNT concentrations correspond to higher relative nonlinear parameter values for both the second and third order nonlinear parameter. Furthermore, the third order nonlinear parameter β3 is more sensitive to microstructural modifications in the material during its hardening process.
It was observed that, as the percentage of nanotubes in cement matrix increases, the values of nonlinear parameters also increase. During the first 18 h of the experiment, the nonlinear parameter values were higher in comparison to the following hours, when they reached a plateau. The changes were even more pronounced in the third harmonic parameter. This indicates that the third harmonic oscillation is much more sensitive to the material’s microstructural changes. Μicrostructural changes during the first hours occur in the fresh cement paste. The chemical reactions in the material are rapid and the sample undergoes progressive mechanical setting. In addition, the carbon nanotube mesh is integrated into the cement matrix. These alterations are less dramatic after the first 18 h. Regarding the mortar samples with the different carbon nanotube concentrations, the results were similar to those obtained for the cement paste samples, as it is shown in Figure 10.
Figure 11 shows a summary diagram of the nonlinear parameters β2 and β3 (Figure 9a,b, respectively) as a function of time for the CNT-reinforced mortar specimens. It can be observed that higher CNT concentrations correspond to higher relative nonlinear parameter values for both the second and third order nonlinear parameter. The third order nonlinear parameter β3 is also found to be more sensitive to microstructural modifications in the material during its hardening process.
The attenuation coefficient of the ultrasonic wave was measured using the relationaship α = 20log (A1/A0). Figure 12 shows the results of attenuation; it was observed that for the same types of specimens the attenuation coefficient follows a similar pattern. It is clear that the attenuation is affected mainly by the chemical reactions that take place between water and cement powder during the hardening process but not by the amount of carbon nanotubes in the cement composite.
The trend of attenuation over time for nanoreinforced specimens and plain specimens with w/c ratio 0.5 for both cement paste and mortar, agrees with results from previous study [20]. As Figure 13 shows, at a very early age the attenuation coefficient exhibits a sharp increase for about the first 18 h, then the changes become less pronounced. As the mortar/cement paste hardens, the changes in attenuation occur due to the formation of certain hydrating products, mainly alumina, iron oxide and trisulfate. The capillary pores are filled by these products and hence the scattering is minimized.

5. Conclusions

This study aims to monitor the hardening process of cement paste and mortar specimens that are reinforced with different concentrations of carbon nanotubes. These results are obtained by integrating measurements of temperature conditions as well as linear and nonlinear ultrasonic elastic wave propagation. Although the linear ultrasonic measurements, such as the sound velocity, are generally an indication of the state of a material, during the hardening process does not appear to be fully reliable for characterizing its chemical and physical properties. During the hydration process of cement composites, the inherent nonlinearity exhibited by the material as expressed by higher-order nonlinear parameters was found to be correlated with the micromechanical structural changes that occur due to chemical reactions and mechanical changes.
It was found that while the nonlinear parameters exhibit significant changes, the attenuation coefficients do not present a significant change as their measurement is based on linear acoustic measurements. In addition, the changes in the nonlinear parameters were more pronounced as the concentration of carbon nanotubes in the cement matrix increases. This indicates that the higher harmonic signals are more susceptible to minute microstructural changes, whether chemical or physical. Finally, due to its produced capillary pores that influence the harmonics oscillations, mortar’s nonlinear parameters present higher values compared to those of the cement paste.

Author Contributions

Investigation, I.K.T., T.Z.K., D.A.E. and P.T.D.; Methodology, T.E.M.; Supervision, T.E.M.; Writing—Original draft, I.K.T.; Writing—Review and editing, T.E.M. All authors have read and agreed to the published version of the manuscript.

Funding

This research received no external funding.

Institutional Review Board Statement

Ethical review and approval are not applicable for studies not involving humans or animals.

Informed Consent Statement

Informed consent is not applicable for studies not involving humans.

Data Availability Statement

The data that support the findings of this study are available from the corre-sponding author upon reasonable request.

Conflicts of Interest

The authors declare no conflict of interest.

References

  1. Belie, N.; Grosse, C.; Baert, G. Ultrasonic transmission to monitor setting and hardening of fly ash concrete. ACI Mater. J. 2008, 105, 221. [Google Scholar]
  2. Lacouture, J.-C.; Johnson, P.; Cohen-Tenoudji, F. Study of critical behavior in concrete during curing by application of dynamic linear and non linear means. J. Acoust. Soc. Am. 2003, 113, 1325–1332. [Google Scholar] [CrossRef] [PubMed]
  3. Wong, H.; Zobel, M.; Buenfeld, N.; Zimmerman, R. Influence of the interfacial transition zone and microcracking on the diffusivity, permeability and sorptivity of cement-based materials after drying. Mag. Concr. Res. 2009, 61, 571–589. [Google Scholar] [CrossRef] [Green Version]
  4. Zhao, K.; Xue, S.; Zhang, P.; Tian, Y.; Li, P. Application of Natural Plant Fibers in Cement-Based Composites and the Influence on Mechanical Properties and Mass Transport. Materials 2019, 12, 3498. [Google Scholar] [CrossRef] [Green Version]
  5. Baricevic, A.; Rukavina, M.J.; Pezer, M.; Štirmer, N. Influence of recycled tire polymer fibers on concrete properties. Cem. Concr. Compos. 2018, 91, 29–41. [Google Scholar] [CrossRef]
  6. Soulioti, D.V.; Barkoula, N.M.; Paipetis, A.; Matikas, T.E. Effects of Fibre Geometry and Volume Fraction on the Flexural Behaviour of Steel-Fibre Reinforced Con-crete. Strain 2011, 47, e535–e541. [Google Scholar] [CrossRef]
  7. Cwirzen, A.; Habermehl-Cwirzen, K.; Penttala, V. Surface decoration of carbon nanotubes and mechanical properties of ce-ment/carbon nanotube composites. Adv. Cem. Res. 2008, 20, 65–73. [Google Scholar] [CrossRef]
  8. Eftekhari, M.; Mohammadi, S. Multiscale dynamic fracture behavior of the carbon nanotube reinforced concrete under impact loading. Int. J. Impact Eng. 2016, 87, 55–64. [Google Scholar] [CrossRef]
  9. Eftekhari, M.; Ardakani, S.H.; Mohammadi, S. An XFEM multiscale approach for fracture analysis of carbon nanotube reinforced concrete. Theor. Appl. Fract. Mech. 2014, 72, 64–75. [Google Scholar] [CrossRef]
  10. Musso, S.; Tulliani, J.M.C.; Ferro, G.A.; Tagliaferro, A. Influence of carbon nanotubes structure on the mechanical behavior of cement composites. Compos. Sci. Technol. 2009, 69, 1985–1990. [Google Scholar] [CrossRef]
  11. Dalla, P.T.; Dassios, K.G.; Tragazikis, I.K.; Exarchos, D.A.; Matikas, T.E. Carbon nanotubes and nanofibers as strain and damage sensors for smart cement. Mater. Today Commun. 2016, 8, 196–204. [Google Scholar] [CrossRef]
  12. Tragazikis, I.K.; Dassios, K.G.; Exarchos, D.A.; Dalla, P.T.; Matikas, T.E. Acoustic emission investigation of the mechanical performance of carbon nanotube-modified ce-ment-based mortars. Constr. Build. Mater. 2016, 122, 518–524. [Google Scholar] [CrossRef]
  13. Dalla, P.T.; Tragazikis, I.K.; Exarchos, D.A.; Dassios, K.G.; Barkoula, N.M.; Matikas, T.E. Effect of Carbon Nanotubes on Chloride Penetration in Cement Mortars. Appl. Sci. 2019, 9, 1032. [Google Scholar] [CrossRef] [Green Version]
  14. Wang, J.; Zhang, L.; Liew, K. A multiscale modeling of CNT-reinforced cement composites. Comput. Methods Appl. Mech. Eng. 2016, 309, 411–433. [Google Scholar] [CrossRef]
  15. Wang, J.; Liew, K.M. On the study of elastic properties of CNT-reinforced composites based on element-free MLS method with nanoscale cylindrical representative volume element. Compos. Struct. 2015, 124, 1–9. [Google Scholar] [CrossRef]
  16. Ru, C.Q. Column buckling of multiwalled carbon nanotubes with interlayer radial displacements. Phys. Rev. B 2000, 62, 16962–16967. [Google Scholar] [CrossRef]
  17. Qian, D.; Wagner, A.G.J.; Liu, W.K.; Yu, M.-F.; Ruoff, R.S. Mechanics of carbon nanotubes. Appl. Mech. Rev. 2002, 55, 495–533. [Google Scholar] [CrossRef]
  18. Johnson, P.A. The new wave in acoustic testing. Mater. World 1999, 7, 544–546. [Google Scholar]
  19. De Schutter, G.; Taerwe, L. Specific heat and thermal diffusivity of hardening concrete. Mag. Concr. Res. 1995, 47, 203–208. [Google Scholar] [CrossRef]
  20. Tragazikis, I.K.; Koutrakou, A.N.; Kordatou, T.Z.; Dalla, P.T.; Matikas, T.E. Monitoring the Nonlinear Acoustic Behavior of Fresh Cementitious Materials during the Hardening Process Using Laser Doppler Vibrometry. Acoustics 2020, 2, 833–846. [Google Scholar] [CrossRef]
  21. Voigt, T.; Grosse, C.U.; Sun, Z.; Shah, S.P.; Reinhardt, H.W. Comparison of ultrasonic wave transmission and reflection measurements with P- and S-waves on early age mortar and concrete. Mater. Struct. 2005, 38, 729–738. [Google Scholar] [CrossRef]
  22. Lu, Y.; Ma, H.; Li, Z. Ultrasonic monitoring of the early-age hydration of mineral admixtures incorporated concrete using cement-based piezoelectric composite sensors. J. Intell. Mater. Syst. Struct. 2015, 26, 280–291. [Google Scholar] [CrossRef]
  23. Whitehurst, E. Use of the Soniscope for Measuring Setting Time of Concrete; ASTM International: West Conshohocken, PA, USA, 1951; pp. 1166–1183. [Google Scholar]
  24. Kamada, T.; Uchida, S.; Rokugo, K. Nondestructive Evaluation of Setting and Hardening of Cement Paste Based on Ul-trasonic Propagation Characteristics. J. Adv. Concr. Technol. 2005, 3, 343–353. [Google Scholar] [CrossRef] [Green Version]
  25. Boumiz, A.; Vernet, C.; Tenoudji, F.C. Mechanical Properties of Cement Pastes and Mortars at Early Ages: Evolution with Time and Degree of Hydration. Adv. Cem. Based Mater. 1996, 3, 94–106. [Google Scholar] [CrossRef]
  26. Abeele, K.V.D.; Desadeleer, W.; De Schutter, G.; Wevers, M. Active and passive monitoring of the early hydration process in concrete using linear and nonlinear acoustics. Cem. Concr. Res. 2009, 39, 426–432. [Google Scholar] [CrossRef]
  27. Morin, V.; Cohen-Tenoudji, F.; Feylessoufi, A.; Richard, P. Evolution of the capillary network in a reactive powder concrete during hydration process. Cem. Concr. Res. 2002, 32, 1907–1914. [Google Scholar] [CrossRef]
  28. Biot, M.A. Theory of Propagation of Elastic Waves in a Fluid-Saturated Porous Solid. I. Low-Frequency Range. J. Acoust. Soc. Am. 1956, 28, 168–178. [Google Scholar] [CrossRef]
  29. Kakuta, S.; Akashi, T. Study on Physical Properties of Cement Paste and Mortar at Early Age by Ultrasonic Pulse Method. J. Soc. Mater. Sci. Jpn. 1983, 32, 175–181. [Google Scholar] [CrossRef]
  30. Keating, J.; Hannant, D.; Hibbert, A. Comparison of shear modulus and pulse velocity techniques to measure the build-up of structure in fresh cement pastes used in oil well cementing. Cem. Concr. Res. 1989, 19, 554–566. [Google Scholar] [CrossRef]
  31. Keating, J.; Hannant, D.; Hibbert, A. Correlation between cube strength, ultrasonic pulse velocity and volume change for oil well cement slurries. Cem. Concr. Res. 1989, 19, 715–726. [Google Scholar] [CrossRef]
  32. Garnier, V.; Corneloup, G.; Sprauel, J.; Perfumo, J. Setting time study of roller compacted concrete by spectral analysis of transmitted ultrasonic signals. NDT E Int. 1995, 28, 15–22. [Google Scholar] [CrossRef]
  33. Lee, H.; Lee, K.; Kim, Y.; Yim, H.; Bae, D. Ultrasonic in-situ monitoring of setting process of high-performance concrete. Cem. Concr. Res. 2004, 34, 631–640. [Google Scholar] [CrossRef]
  34. Reinhardt, H.; Grosse, C. Continuous monitoring of setting and hardening of mortar and concrete. Constr. Build. Mater. 2004, 18, 145–154. [Google Scholar] [CrossRef]
  35. Voigt, T.; Ye, G.; Sun, Z.; Shah, S.P.; Van Breugel, K. Early age microstructure of Portland cement mortar investigated by ultrasonic shear waves and numerical simulation. Cem. Concr. Res. 2005, 35, 858–866. [Google Scholar] [CrossRef]
  36. Zhang, Y.; Zhang, W.; She, W.; Ma, L.; Zhu, W. Ultrasound monitoring of setting and hardening process of ultra-high performance cementitious materials. NDT E Int. 2012, 47, 177–184. [Google Scholar] [CrossRef]
  37. Zhang, J.; Qin, L.; Li, Z. Hydration monitoring of cement-based materials with resistivity and ultrasonic methods. Mater. Struct. 2008, 42, 15–24. [Google Scholar] [CrossRef]
  38. Demirboğa, R.; Türkmen, İ.; Karakoç, M.B. Relationship between ultrasonic velocity and compressive strength for high-volume mineral-admixtured concrete. Cem. Concr. Res. 2004, 34, 2329–2336. [Google Scholar] [CrossRef]
  39. Gu, H.; Song, G.; Dhonde, H.; Mo, Y.L.; Yan, S. Concrete early-age strength monitoring using embedded piezoelectric transducers. Smart Mater. Struct. 2006, 15, 1837–1845. [Google Scholar] [CrossRef]
  40. Wang, D.; Zhu, H. Monitoring of the strength gain of concrete using embedded PZT impedance transducer. Constr. Build. Mater. 2011, 25, 3703–3708. [Google Scholar] [CrossRef]
  41. Farmaki, S.; Exarchos, D.A.; Tragazikis, I.K.; Matikas, T.E.; Dassios, K.G. A Novel Infrared Thermography Sensing Approach for Rapid, Quantitative Assessment of Damage in Aircraft Composites. Sensors 2020, 20, 4113. [Google Scholar] [CrossRef]
  42. Johnson, P.; Zinszner, B.; Rasolofosaon, P. Resonance and Elastic Non-linear Phenomena in Rock. J. Geophys. Res. 1996, 101, 11553–11564. [Google Scholar] [CrossRef]
  43. Wu, H.-C.; Warnemuende, K. Non-linear Active Wave Modulation Approach for Micro-Damage Detection. In Proceedings of the International Society for Optical Engineering, Bellingham, WA, USA, 4–8 March 2001; p. 4335. [Google Scholar]
  44. Matikas, T.; Aggelis, D. Nondestructive Testing; Kallipos Publications: Athens, Greece, 2015. [Google Scholar]
  45. Frouin, J.; Matikas, T.E.; Na, J.K.; Sathish, S. In-situ monitoring of acoustic linear and nonlinear behavior of titanium alloys during cycling loading. Nondestruct. Eval. Tech. Aging Infrastruct. Manuf. 1999, 3585, 107–116. [Google Scholar] [CrossRef]
  46. Frouin, J.; Maurer, J.; Sathish, S.; Eylon, D.; Na, J.; Matikas, T. Real-Time Monitoring of Acoustic Linear and Nonlinear Behavior of Titanium Alloys During Cyclic Loading. MRS Proc. 1999, 591, 79–84. [Google Scholar] [CrossRef]
  47. Frouin, J.; Sathish, S.; Matikas, T.E.; Na, J.K. Ultrasonic Linear and Nonlinear Behavior of Fatigued Ti–6Al–4V. J. Mater. Res. 1999, 14, 1295–1298. [Google Scholar] [CrossRef]
  48. Alafogianni, P.; Dassios, K.; Farmaki, S.; Antiohos, S.K.; Matikas, T.E.; Barkoula, N.M. On the efficiency of UV–vis spectroscopy in assessing the dispersion quality in sonicated aqueous sus-pensions of carbon nanotubes. Colloids Surf. A Physicochem. Eng. Asp. 2016, 495, 118–124. [Google Scholar]
  49. Reinhardt, H.W.; Große, C.U.; Herb, A.T. Ultrasonic monitoring of setting and hardening of cement mortar—A new device. Mater. Struct. 2000, 33, 581–583. [Google Scholar] [CrossRef]
  50. Alafogianni, P.; Tragazikis, I.; Balaskas, A.; Barkoula, N.-M. Structural Properties and Damage Detection Capability of Carbon Nanotube Modified Mortars after Freeze-Thaw. Materials 2019, 12, 1747. [Google Scholar] [CrossRef] [PubMed] [Green Version]
  51. TragazikisI, K.; Dassios, K.G.; Dalla, P.T.; Exarchos, D.A.; Matikas, T.E. Acoustic emission investigation of the effect of graphene on the fracture behavior of cement mortars. Eng. Fract. Mech. 2019, 210, 444–451. [Google Scholar] [CrossRef]
  52. Aggelis, D.; Mpalaskas, A.; Matikas, T. Acoustic signature of different fracture modes in marble and cementitious materials under flexural load. Mech. Res. Commun. 2013, 47, 39–43. [Google Scholar] [CrossRef]
  53. Matikas, T.E.; Karpur, P. Ultrasonic reflectivity technique for the characterization of fiber-matrix interface in metal matrix composites. J. Appl. Phys. 1993, 74, 228–236. [Google Scholar] [CrossRef] [Green Version]
  54. Shariati, M.; Ramli-Sulong, N.H.; Arabnejad, M.M.; Shafigh, P.; Sinaei, H. Assessing the strength of reinforced Concrete Structures Through Ultrasonic Pulse Velocity and Schmidt Rebound Hammer tests. Sci. Res. Essays 2011, 6, 213–220. [Google Scholar]
  55. Muhammad Ridha Abdul Rasool Kindeel, Z. Correlation between the Compressive Strength of Concrete and Ultrasonic Pulse Velocity. J. Kerbala Univ. 2009, 7, 17–29. [Google Scholar]
  56. Frouin, J.; Matikas, T.E.; Na, J.K.; Sathish, S. In-situ monitoring of acoustic linear and nonlinear behavior of titanium alloys during cycling loading. In Proceedings of the Nondestructive Evaluation Techniques for Aging Infrastructure and Manufacturing, 3–5 March 1999, Newport Beach, CA, USA; SPIE-International Society Optical Engineering (SPIE): Bellingham, WA, USA, 1999; pp. 107–116. [Google Scholar]
  57. Van Den Abeele, K.; Visscher, J. Damage Assessment in reinforced concrete using spectral and temporal nonlinear vibration techniques. Cem. Concr. Res. 2000, 30, 1453–1464. [Google Scholar] [CrossRef]
  58. Abeele, K.V.D.; Carmeliet, J.; Van De Velde, K. Inferring the degradation of pultruded composites from dynamic nonlinear resonance measurements. Polym. Compos. 2001, 22, 555–567. [Google Scholar] [CrossRef]
  59. Matikas, T.E. Damage Characterization and Real-Time Health Monitoring of Aerospace Materials Using Innovative NDE Tools. J. Mater. Eng. Perform. 2009, 19, 751–760. [Google Scholar] [CrossRef]
  60. Matikas, T.; Paipetis, A.; Kostopoulos, V. Real-time Monitoring of Damage Evolution in Aerospace Materials Using Nonlinear Acoustics. In Proceedings of the 18th International Symposium on Nonlinear Acoustics (ISNA 18), Stockholm, Sweden, 7–10 July 2008; Volume 1022, pp. 549–552. [Google Scholar]
Figure 1. Experimental setup.
Applsci 11 01720 g001
Figure 2. Sound velocity for all the carbon nanotubes concentrations for: (a) cement paste and (b) mortar.
Applsci 11 01720 g002
Figure 3. Strength values for different carbon nanotube concentrations for: (a) cement paste and (b) mortar.
Applsci 11 01720 g003
Figure 4. Strength values for cement paste and mortar with absence of nanoinclusions.
Applsci 11 01720 g004
Figure 5. Difference in temperature for all carbon nanotube concentrations for: (a) cement paste and (b) mortar.
Applsci 11 01720 g005
Figure 6. Difference in temperature for cement paste and mortar with absence of nanoinclusions.
Applsci 11 01720 g006
Figure 7. (a) Long-term stability test of the measurement system at room temperature, (b) Assessment of the system linearity for the second harmonic and (c) Assessment of the system linearity for the third harmonic.
Applsci 11 01720 g007
Figure 8. Nonlinear parameters for cement paste with (a) 0% CNTs, (b) 0.2% CNTs, (c) 0.4% CNTs and (d) 0.6 % CNTs.
Applsci 11 01720 g008
Figure 9. Nonlinear parameter (a) β2 and (b) β3 as a function of time for CNT-reinforced cement paste specimens.
Applsci 11 01720 g009
Figure 10. Nonlinear parameters for mortar with (a) 0% CNTs, (b) 0.2% CNTs, (c) 0.4% CNTs and (d) 0.6 % CNTs.
Applsci 11 01720 g010
Figure 11. Nonlinear parameter (a) β2 and (b) β3 for the nanoreinforced mortar specimens.
Applsci 11 01720 g011
Figure 12. Attenuation for different CNT loadings: (a) cement paste and (b) mortar.
Applsci 11 01720 g012
Figure 13. Attenuation for w/c = 0.5: (a) cement paste and (b) mortar.
Applsci 11 01720 g013
Table 1. Properties of multiwall carbon nanotubes.
PropertyValue
Length5–15 μm
Main range of diameter20–40 nm
Purity≥97%
Ash content≤0.2 wt.%
Special surface area40–300 m3/g
Amorphous carbon content≤3%
Publisher’s Note: MDPI stays neutral with regard to jurisdictional claims in published maps and institutional affiliations.

