Abstract
Traditionally, when undertaking feasibility studies for designing new storage facilities such as storage silos, engineers will extract design information from experiments and evaluate potential risks associated with health and safety, suitability design for reliable material flow, and quality of products. The simulation approach applied incorporates Computational Fluid Dynamics (CFD), and Discrete Element Modelling (DEM) approaches and experimental tests will be used for validating these simulation results. One important aspect related to handling fine and dusty materials (particles smaller than 100 microns) is the associated risk of dust explosions, which needs to be evaluated before the commissioning of storage silos; to evaluate the accumulation of fines during the silo filling process, simulations and experiments were conducted. Alumina and salt were used here as reference materials for calibration and the validation purposes. The validation efforts are significant due to the fact that the data that is accessible in simulations is vastly different to the accessible data in experiments, which is restricted by measurement techniques and equipment. Such restrictions are observed in the evaluation of particle concentrations in a large confined volume. A new methodology has been developed to evaluate concentrations in both simulations and experiments by employing a non-dimensional factor [k], here called “Concentration Rank Factor” (CRF). A significant finding of this research is that experiments and simulations can be compared using CRF. It has been found to be within 2% of the experiment averaged value of 0.64.
1. Introduction
In recent years, the electricity generation, supplied to society and industry (predominately in Europe), has been changing from fossil fuel to renewable energy sources such as biomass with the aim of reducing carbon dioxide (CO2) gas emissions [1]. As part of this drive for renewable energies, companies such as Drax power burn around 7 million tonnes of wood pellets every year. One of the largest challenges for plant operators is the suppression of dust and minimising health and safety risks during biomass handling and storage operations. In particular, one major threat for the plant operators handling fine combustible dust is the potential for dust explosions. Dust explosions can destroy plant infrastructure and can lead to loss of life. These explosions can occur when an ignition source, oxygen and fuel, such as airborne dust, is present in a confined space [2]. Plant operators install dust suppression systems in biomass handling and storage facilities to control risks of dust explosions and minimise the entrainment of dust into the air. One driving force for dust entrainment into the air is secondary air currents which are driven by a falling material stream during the silo filling process. The secondary air currents carry the fines away from the central feeding jet. The effect is called air current segregation (ACS) and was studied intensively in experiments and simulations [3]. ACS was experimentally evaluated in bench scale testers and results were compared to CFD simulations. Yet, the direct comparison of data was not possible because the accessible information in simulations was vastly different to the accessible data in experiments, which was restricted by measurement techniques and equipment.
This paper aims to provide a methodology for evaluating dust concentration ratios in cylindrical silos and for comparing CFD simulations with experimental results. The objective is to test the suitability of a MATLAB based algorithm for converting optical intensity measurements into dust concentration ratios for different reference materials and material flow rates. The dust concentration ratios are obtained by converting the optical intensity data (reflection of light from particles) to colour maps. The colour map contains relevant optical particle concentration information which is visualised in a contour plot as shown in Figure 1.
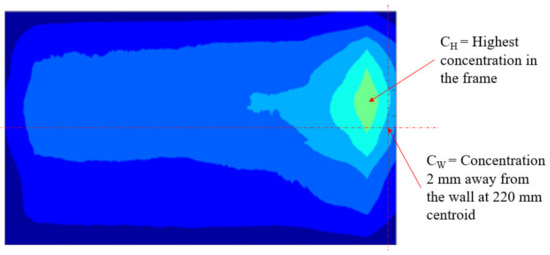
Figure 1.
Non dimensional Concentration Rank Factor [k] calculated from the contour plot.
To be able to compare optical particle concentrations, a dimensionless number [k] here defined as “Concentration Rank Factor” (CRF) is introduced. CRF is calculated using arbitrarily selected positions in the bench scale silo such as the concentration near the silo wall (CW) and the highest optical particle concentrations (CH) as shown in Equation (1). CRF can also be applied to industrial sized silos where (CW) can be the dust/ material sampling point and (CH) is the highest optical concentration measured in the silo.
This research builds on previous work modelling multiphase flows for industrial applications [4]. However, previous research has been limited to transfer stations [5] and underground mining [6,7,8] which used intrusive sampling methods such as dust monitors and collection trays similar to that used by Stone et al. [9]. Researchers, such as Rani et al. [10] have used numerical simulation (CFD) to predict dust concentration levels in cylindrical storage silos. This study investigated the dust distribution near the central filling stream during silo filling and identified areas of high concentrations close to the explosion limit of the given material. The challenges faced by Rani et al. [10] were that experimental data did not contain a high enough resolution to match the simulation work. This made a direct comparison between experiments and simulations difficult. To obtain higher resolution data, researchers such as Gouesbet and Wang [11,12] used laser-based optical methods to measure dust concentrations in enclosed spaces. References [13,14] based their experimental method around particle velocity measurements using Particle Imaging Velocimetry (PIV) systems. PIV systems do not allow for direct measurement of dust concentrations during the silo filling process based on time averaged data to generate contour plots. This paper also provides experimental and simulation approaches to obtain CRF values for fine particles moving in cylindrical silos which allows a direct comparison between experiments and CFD simulations. The experimental approach to obtain the optical dust concentration is described in the following sections.
2. Material and Methods
2.1. Experiment Setup
A small scale cylindrical silo was used for the experiments. The silos inside diameter was 400 mm and the height 1200 mm, as shown in Figure 2. Four air extractors were located on top of the silo with fitted flow meters and regulators (MR 3000). The air was extracted from the silo using a vacuum system. The airflow was controlled through needle valves. The air extracted was balanced with the air and material coming into the silo. This material created the circulating air currents which moved the dust particles and fines (particles smaller than 100 microns) away from the central feeding jet. The reference materials salt was fed centrally with a feeding rates of 14 g/s into the experimental silo. The dust particles circulating with the air currents in the silo were illuminated by a laser sheet. This laser sheet was created with a Coherent® DPSS 532 which projects a 532 nm green light laser beam through a 5 mm glass rod; as shown in Figure 3.
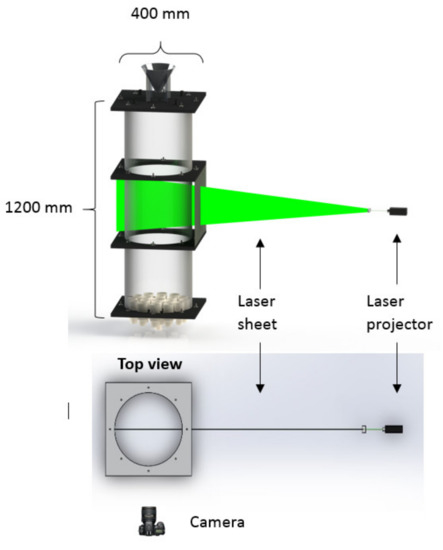
Figure 2.
Top and side elevation views of the experimental silo and camera set up.
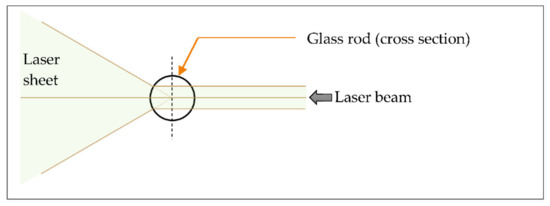
Figure 3.
Cross-section of the optical arrangement to create a flat laser sheet. The laser beam is perpendicular to the glass rod.
As particles circulated with the secondary air currents in the cylindrical silo, they reflected the laser light. The intensity of reflected light was correlated to the optical particle concentration. The optical particle concentration was captured by a BlackMagic URSA mini Pro 4.6k camera. The camera recorded the video footage (at 60 fps) of particles passing through the laser sheet. The zoom lens used on the camera was a Nikon (AF-S Nikkor 24–70 mm 1:2.8G ED).
The post processing of the obtained video footage is shown in Figure 4. The frames from the video footage were cropped and particles were identified by the algorithm. An averaged filter was applied for every cropped frame and contour plots with brightness levels were plotted.
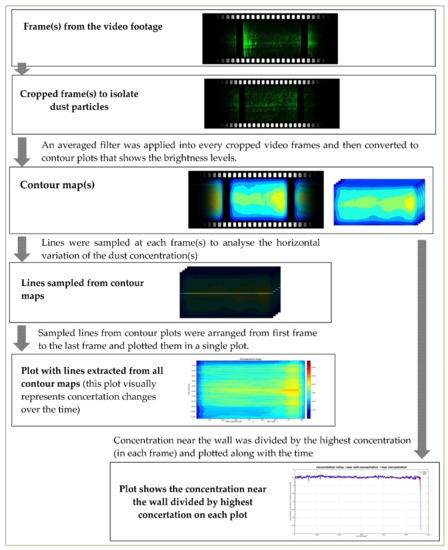
Figure 4.
Workflow for obtaining the optical particle concentration.
Optical particle concentrations in the contour plots were plotted according to a “colour-bar”, as shown in Figure 5. The colours in the colour bar corresponded to brightness levels where the blue colour represented the minimum brightness level and the red colour represented the maximum brightness level.
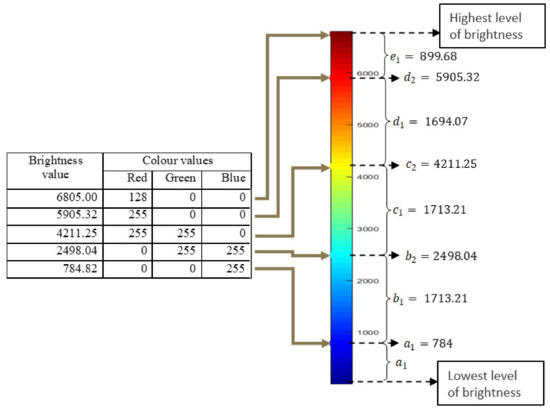
Figure 5.
Colours of “colour-bar” represents the corresponding brightness levels of the contour plot.
The brightness parameters a1 to e1 were obtained by using a computer programme. The programme structure is described as a flowchart in the Figure 6. After the brightness parameters a1 to e1 were identified the colour grading, a two-dimensional array of brightness values was generated and the pixel brightness in the contour maps were analysed. The brightness values from the contour plots were sampled in lines which allowed the plotting of optical particle concentrations over time, providing information on the highest optical particle concentration occurring in the experimental silo during the silo filling. In order to obtain meaningful optical particle concentrations for the experimental silo, the central particle jet was excluded from the image analysis and a large number of video frames were included in the analysis.
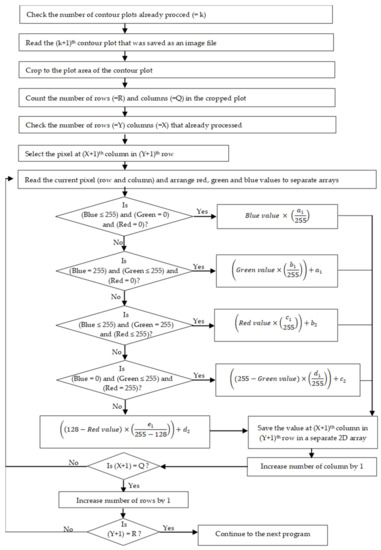
Figure 6.
Flowchart of the computer program that reads colour values in contour plots.
The experiments were conducted to identify the region of highest particle concentrations in the bench scale silo as shown in Figure 7. The region of the highest optical particle concentration in the experimental silo was identified to be at a height of 220 mm from the silo bottom and 27.5 mm radially away from the centreline of the silo i.e., the central material feeding stream. The materials used in the experiments are described in the next section.
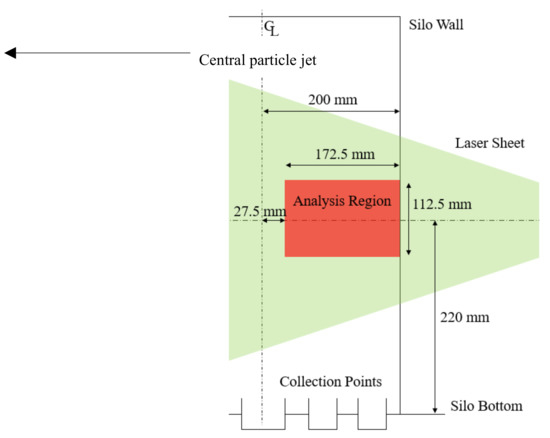
Figure 7.
Region used for analysis of images and in Computational Fluid Dynamics-Discrete Phase Model (CFD-DPM) simulations.
When observing the particles optically in experiments it is difficult to distinguish between lumps of particles or single particles, hence, the averaging of a large number of frames is an important step to obtain meaningful contour plots.
2.2. Materials
The experiments were conducted with two different materials i.e., salt and alumina. Salt was selected because of its defined cuboid shape and alumina because of the particle size distribution (PSD) and its free-flowing nature. The salt particle sizes ranged from coarse (3.15 mm to 4 mm) to fine material (60 μm to 350 μm with a mean value of 267.3 μm), see Figure 8. The large particles were required to drive the air flow inside the silo in addition to the air extractors. The fine salt particles were used as tracer particles visualising the optical particle concentrations in the bench scale silo.
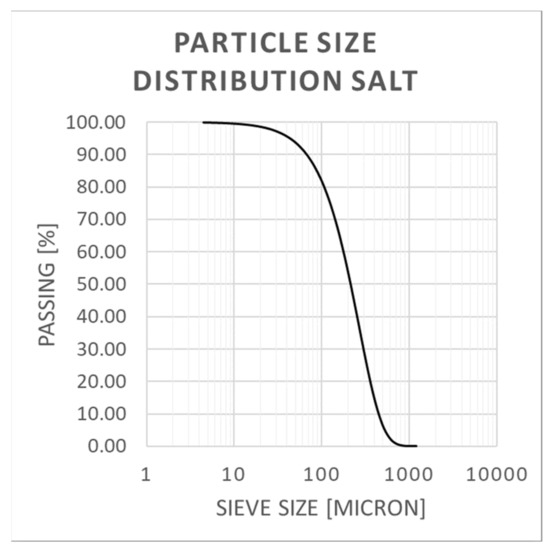
Figure 8.
Salt PSD.
Alumina particle sizes ranged from 5.2 μm to 350 μm with a mean value of 72.8 μm, as outlined in Figure 9. These particles appeared octahedral in shape, as shown in Figure 10.
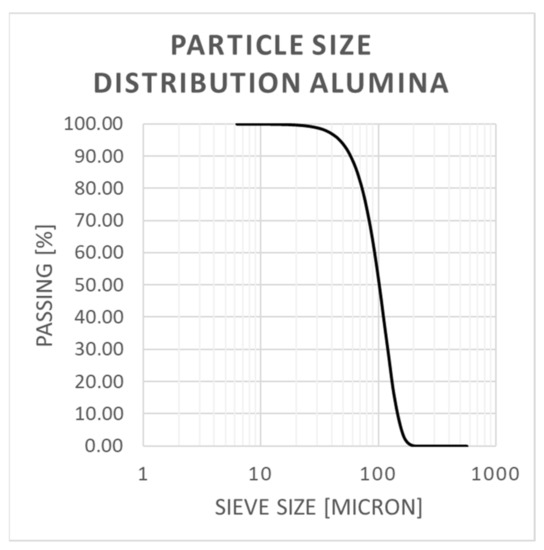
Figure 9.
Alumina PSD measured with Laser diffraction method (Sympatec).
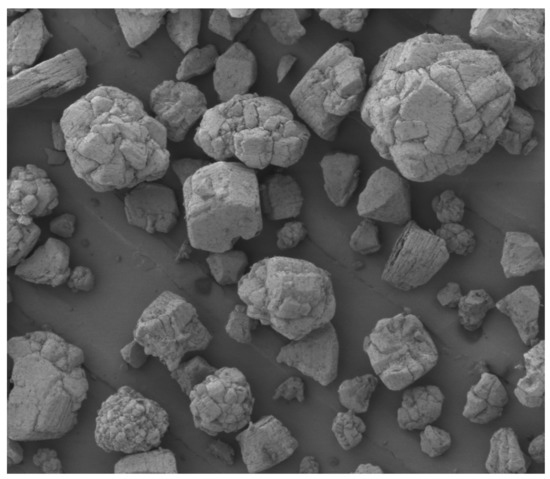
Figure 10.
Scanning electron microscope (SEM) image of alumina.
2.3. Simulation Overview
This section provides an introduction to CFD-DEM simulations conducted to study dust concentrations in a simulated bench scale silo. The simulation of dust concentrations relied on the selected CFD-DEM techniques. These techniques had limiting factors which effected the overall simulation capacity and dictated the resolution of various aspects i.e., mesh size and particle count. These limits included: the number of particles that can be simulated, concentration of particles in the domain (governing equation limitations) and finally the ratio of particles to cell size (stability limitations). When simulating flow rates similar to experiments, millions of fine particles would be injected per time step which was not practical to simulate because of the high computational costs and solver limitations. Therefore, the mass flow rate of fines was reduced by a factor 1000 in order to increase the simulation stability and remain within the software limitations of 10% loading of material. The fine particles were used as tracers in the simulation and the driving force in the simulation was generated by the coarse material settling in the circular silo. The coarse material flow rates created enough air movement in the silo to resemble the hydrodynamics observed in the experiments. Fines were represented by the full PSD whereas, the coarse material was defined as mono-sized particles. By taking this approach the simulation had an adequate number of particles to obtain optical particle concentrations for alumina at high material flow rates. The simulation software Fluent was selected because it is commercially used by many companies and it allows the modelling of micron sized particles. The full set up of the simulation model is explained in the next section.
2.4. Simulation Parameters
The setup parameters used in the Fluent (ANSYS Workbench 2020) analysis are outlined in Table 1; for parameters that are not stated, the default values were used. In this analysis the fluid phase was solved using the Eulerian method while the particle phase was solved using the Lagrangian method as per the in-built discrete phase model.

Table 1.
Simulation parameters.
This simulation set up proofed to be robust and suitable to compare dust concentrations between simulations and experiments using the CRF value. The comparison of simulations and experiments presented some challenges which are described in the next section.
2.5. Challenges of Comparing Simulations to Experiments
One of the key factors in the use of CFD-DEM for predicting particle concentrations lies in the justification that the simulation method has been verified and calibrated correctly and that the simulation results can be extracted in a useable format [6]. When considering simulation extraction procedures; many challenges are faced such as: mesh alignment (comparison of one mesh definition to another), material loading (number of particles contained in a simulation), the particle size distribution and the particle shape. These challenges need to be addressed such that the resulting simulation data is reliable and the results it produces can be used for comparison. Mesh alignment was a problem faced in the final stages of data comparison, once the data had been extracted from a simulation the format was given as concentrations on nodes. The simulation mesh then needed to be overlaid onto the experimental data (in this case a pixel grid) for comparison of the results. However, the mesh for the simulation depended on the meshing method used, whether it be tetrahedrons, hexahedrons or cubic. In this analysis the cut cell method was used as it provides a highly uniform mesh. Further, cut cells resembled a cubic grid and therefore allowed for better comparison to the pixels used in experimental data post processing while also offering more consistent node spacing.
For this investigation a mesh cell size of 9 mm was used; this was found to give an independent mesh as outlined in work conducted by Lulbadda Waduge et al. [15] for the same domain and silo. In addition to the previous study, the traditional methods of CFD analysis needed be adjusted. Typically, the mesh was refined to the point where independence is reached i.e., further refinements indicate no improvement in the results observed. However, due to the limitation that each mesh cell must contain a fluid volume, stability issues could arise if the cell was completely occupied by a particle; the governing equations could not be solved. The mesh size was three times the maximum particle diameter to ensure there was always fluid volume in a cell even when particles were present. From the sensitivity analysis and subsequent simulations, a mesh cell size of 9 mm was found to be sufficient in order to maintain an independent mesh while achieving a stable simulation. The mesh parameters are outlined in Table 2 and for values not specified the software defaults were used.
Table 2.
Mesh parameters.
In addition to the challenges of mesh alignment it was important to understand how Fluent reports the concentrations calculated in the simulations. The dust concentration calculation is illustrated by assuming a cell (blue) of volume ONE meter cube as shown in Figure 11. The blue cell contains one particle which has a mass of 1 kg and, therefore, the cell concentration is 1kg/m3. The other cells are assumed to have a concentration of 0 kg/m3. When the concentration is exported, Fluent converts the cell concentration to a node concentration which takes into account neighbouring cells. As such, the following node concentrations would be reported for the example mesh:
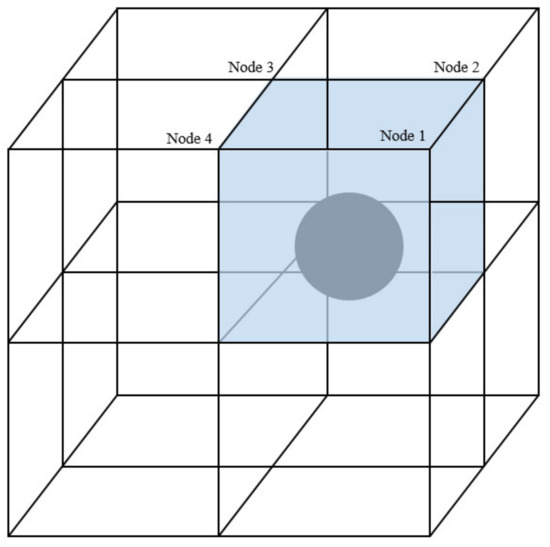
Figure 11.
Particle information distribution technique used in Fluent.
Node 1 shares no other cells therefore the concentration is 1 kg/m3
Nodes 2 and 4 share two cells and therefore have an average concentration, in this case 0.5 kg/m3
Node 3 shares four cells and therefore has an average concentration of 0.25 kg/m3.
This variation in reporting concentrations causes difficulties when comparing the simulation results to those generated by the experiments. Finally, particle shape and size can also cause challenges when attempting to analyse the results.
The output data from the simulations differed from experiments and, thus the “Concentration Rank Factor” (CRF) was utilised to evaluate dust concentrations in the cylindrical silo. Since the CRF was defined here as optical concentrations ratio between locations near the silo wall (CW) and the highest concentration (CH), the value was used to compare simulations with experimental results. The results of the experiments and simulations are presented in the next section.
3. Results and Discussion
3.1. Experimental Results
The reference material salt was tested first and the results are presented in Figure 12. It can be seen that an average value of 0.65 was obtained for the whole time of silo filling. This number represents a constant particle concentration ratio between the wall and the highest particle concentration measured in the experimental silo.
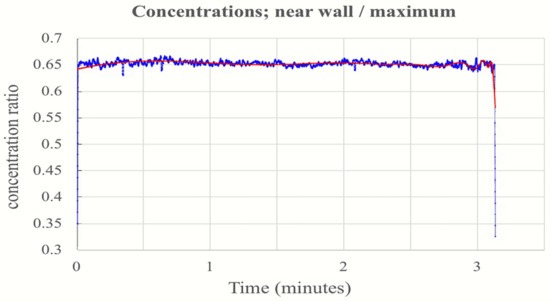
Figure 12.
Non dimensional Concentration Rank Factor [k] calculated for the period of silo filling.
Repeatability tests were conducted to evaluate the usefulness of the CRF experiments using salt. Results are shown in Figure 13. The CRF values obtained from the three experiments were averaged and a value of 0.65 was obtained. The averaged value showed only small experimental variations and, thus, it can be concluded that the CRF value was suitable to capture the behaviour of spatially distributed particles during the silo filling process.
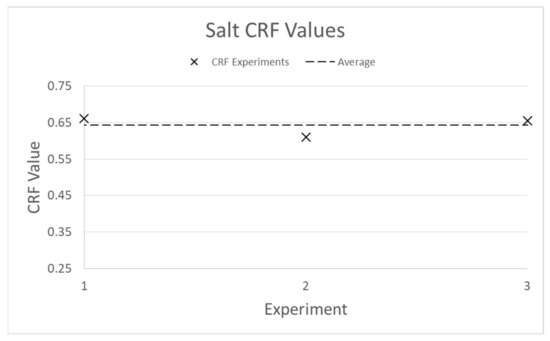
Figure 13.
Repeatability tests with the same experimental set up for the reference material salt.
The k factor is like a fingerprint of the material i.e., salt and can now be used to evaluate dust concentrations in cylindrical silos filled with the same material.
The dust concentrations may vary with process parameters such as the material feeding rate and this may causes the CRF value to vary as well. In the following experiments alumina was tested under similar experimental conditions to evaluate the suitability of the CRF approach for materials with different material properties and under different flow conditions i.e., varying the feeding rates. Experimental results are shown in Figure 14 and Figure 15. It can be seen that the CRF values were constant for a significant amount of time after a sudden increase. This increase was related to the finishing of the filling process and only fines circulated as tracer particles in the air. This sudden increase was kept in the figure to show the fast response of the CRF value to changing silo filling conditions. It can also be observed that very similar CRF values were obtained for varying flow rates of alumina powder which is very promising because it shows the independence of the CRF value from the flow rate for the same material.
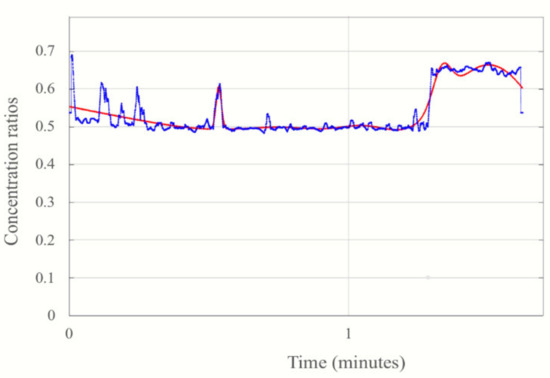
Figure 14.
CRF value for alumina at flow rates of 7 × 10⁻³ kg/s.
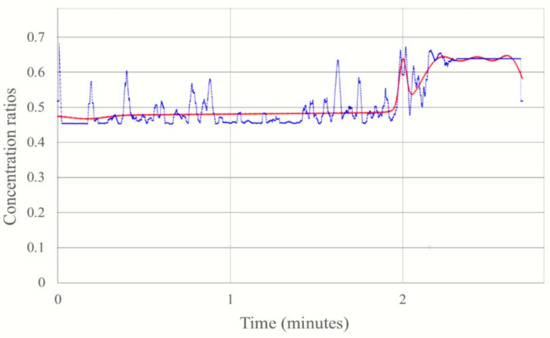
Figure 15.
CRF value for alumina at flow rates of 1.9 × 10⁻² kg/s.
The comparison of experiments with the reference material salt and alumina revealed that the k value for the salt experiments was slightly higher for alumina. These differences are partly accounting for instabilities in the flow field and the variation of fines content measured near the wall in the alumina experiments. The variations in the flow field caused fines to segregate more near the central particle jet because the hydrodynamic forces which acted on the alumina particles were less strong than in the salt experiments. At larger scales, such as industry scale, these instabilities could be neglected because stronger and more stable air currents normally occur in industrial sized silos. The results from the alumina experiment with the high feeding rate was used as a benchmark for CFD simulations. The sampling approach in the simulations and results are discussed in the next sections.
3.2. Comparing Simulations to Experiments
The simulation approach to sampling was slightly different to the experiments because the meshing of the domain in the simulation did not allow for the sampling of particles in a vertical plan and thus, particles were sampled horizontally and averaged over space time to get the particle concentration in a line. The simulation ran for 30 s, after which the relevant data was extracted, including the particle concentrations and positions at a defined export plane. In this instance, a reference plane of 220 mm from the silo base, as shown in Figure 16, has been selected. The basis of this selection is from analysing the peak concentration areas in the silo from experimental testing. The exported data was analysed using post processing tools to obtain the CRF value.
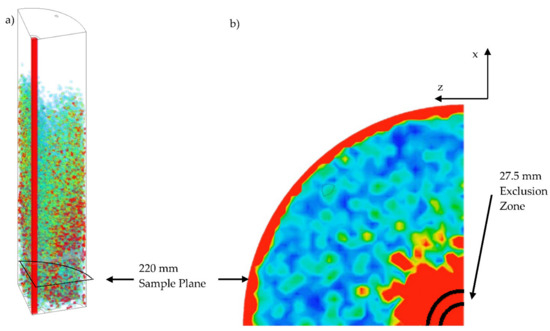
Figure 16.
(a) Isometric view of the 3D silo highlighting the 2D sample plane location. (b) Top view of the 220 mm sample plane depicting the particle mass concentrations used in the simulation analysis.
As discussed earlier, the main particle stream was modelled using the ‘coarse’ particle set. As this is not of interest in the analysis, this region (diameter of 27.5 mm) was excluded from post processing as shown in Figure 16b.
The CRF was now used to compare data from experiments and simulations. The comparison was based on the following assumptions:
- The 220 mm plane contains both the CW and CH values, as this is where the laser sheet intensity is greatest. The simulation results compare the nodes at 219.06 mm and 224.04 mm (as shown in Figure 17); this is due to the previously mentioned effects of node averaging.
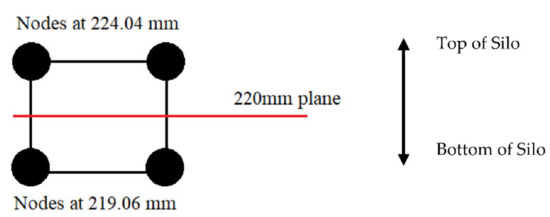 Figure 17. Node locations considered for the 220 mm plane; side elevation view.
 - The X and Z coordinates for these nodes can be compressed into a 2D line by considering their polar coordinates.
The concentration profile after 30 s of silo filling in the simulation is shown in Figure 16a. At this time step the simulation had reached steady state. Figure 16b provides concentration values obtained from the nodes above and below the sampling plane. The X and Z coordinates are converted using Equation (2) so that concentrations of equal distance from the silo centre can be averaged.
The CW and CH data for calculating the CRF values were extracted for each time step of the simulation for the averaged nodes on the plane as shown in Figure 17. These values were then averaged for several time steps after the simulation reached steady-state (assumed due to steady flow rate of material and recirculation) and compared to the CRF values obtained in the experiments. This analysis resulted in an average value of 0.001847 kg/m3 for the highest concentration and a value of 0.000677 kg/m3 for the concentration near the wall, see example of alumina data in Figure 18 leading to a CRF value of 0.37.
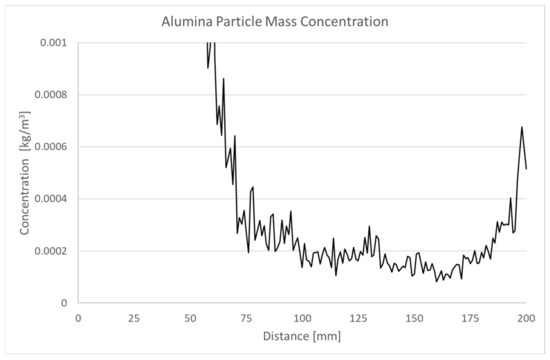
Figure 18.
Alumina particle mass concentrations [kg/m3] from simulation.
The values between simulations and experiments for the alumina material are compared in Figure 19. Even so the simulation slightly over predicted the k value obtained in the alumina experiments the values were somehow in a similar region which shows the applicability of the CRF value for comparing CFD simulations with experiments. The difference between the simulation results and the experiments may be due to a number of reasons, the first being the smaller time frame considered. In this work only 16 data points were used; the experiments used the full duration of video footage (2 min at 60 frames per second). Additionally, the simulation has considered the centre of the laser sheet intensity only. When comparing this to the experimental results, the image processing in the experiments considered a wider region (112.5 mm wide as shown in Figure 7). Therefore, a more advanced search algorithm for the CFD data would be required to analyse a wider section of the silo.
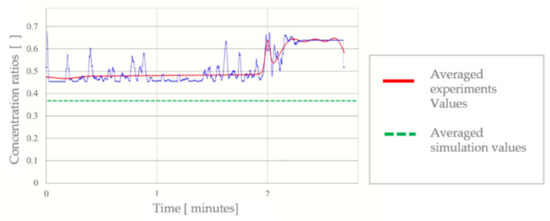
Figure 19.
CRF value for experiments and simulations of alumina at flow rates of of 1.9 × 10⁻² kg/s.
4. Conclusions and Future Work
As shown in the previous sections there are many challenges comparing simulation and experimental results. The challenge is to calibrate the CFD models to accurately represent the experimental dust concentration measurements, in particular the ability to compare data directly between experiments and simulations. This has been overcome through the development of a novel method that is easily implemented and delivers repeatable results for experiments.
It has been found that the simulation results can be analysed using the same technique with the exception that the simulation can over predict the concentration ratio. CRF could be used to calibrate CFD simulations. A calibration methodology is presented here:
- Simulation data is extracted at the 220 mm plane; a plane above at 320 mm and a plane below at 120 mm.
- The CW value is found at 2 mm away from the silo wall for each plane.
- A CH value is calculated using CW/CRF for each plane.
- The CH values are compared. If the simulation is calibrated correctly then the 220 mm plane should contain the largest CH value.
Results of the calibration method are outlined in Table 3. The results show that the 220 mm plane results in the highest concentration when using 0.64 as the CRF value. This is promising as the ratio method seems to hold true for identifying high risk areas within the silo.
Table 3.
Alternative method for calibrating the CFD-DEM simulation.
Although progress has been made in developing a method for comparing simulation results with experiments, there is still a requirement to develop further the search algorithm for fine particles in the CFD domain. This improved search algorithm can then be applied to provide more reliable results for validations of CFD simulations and for scalability efforts to larger sized silos. Additional tests with different materials will provide more confidence in the calibration of the simulation approach and the validation of the simulation model based the newly developed CRF value. The other challenge faced is undertaking a simulation that has sufficient particles in the simulation domain. In this research, the silo has been simulated at a reduced flow rate. The effect of this can be seen in the reduced concentration ratio, as it is around 20% smaller than the experimental value. The particle mass concentrations are extracted from the simulation in terms of mass per unit volume. This means that there is a cubic relationship that may be influencing the CRF value. Future research could explore the following points:
- -
- Measure the particle mass concentration close to the silo wall (2 mm) in the experiments and apply the CRF value to this concentration.
- -
- Running experiments at a reduced scale to identify how the ratio scales.
- -
- Extend the simulation duration to improve the average results i.e., a more representative sample due to a larger data set.
This research presented a methodology to use improved optical measurement techniques for dust assessments in material handling and storage equipment. The proposed dimensionless ratio (CRF value) can be applied to validate also CFD simulation models. The CRF can also be used by design engineers for evaluating dust explosion risks and dust mitigation strategies for new-build industrial storage silos by identifying high dust concentration areas in industrial storage facilities.
Author Contributions
Scientific contribution on simulation, conducted the research and developed the simulation model, main section of the paper was written by author (L.S.). Supervision of research topic and researchers and contributed to the paper by writing large sections of it (S.Z.). Scientific contribution on experimental investigation, conducted the research and developed the optical method, experimental section of the paper was written by author (L.L.L.W.). Supervision of researcher, and academic evaluation and proof reading of the paper (D.B.H.). All authors have read and agreed to the published version of the manuscript.
Funding
No external grants from funding bodies were used for this research.
Institutional Review Board Statement
Not applicable.
Informed Consent Statement
Not applicable.
Data Availability Statement
Not applicable.
Conflicts of Interest
The authors declare no conflict of interest.
References
- Carbo, M.C.; Abelha, P.M.R.; Cieplik, M.K.; Mourão, C.; Kiel, J.H.A. Fuel pre-processing, pre-treatment and storage for co-firing of biomass and coal. In Fuel Flexible Energy Generation: Solid, Liquid and Gaseous Fuels; Woodhead Publishing: Sawston, UK, 2015; pp. 121–143. [Google Scholar]
- Eckhoff, R.K.; Randeberg, E. Electrostatic spark ignition of sensitive dust clouds of MIE<1 mJ. J. Loss. Prevent. Proc. 2007, 20, 396–401. [Google Scholar] [CrossRef]
- Zigan, S.; Thorpe, R.B.; Tuzun, U.; Enstad, G.G.; Battistin, F. Theoretical and experimental testing of a scaling rule for air current segregation of alumina powder in cylindrical silos. Powder Technol. 2008, 183, 133–145. [Google Scholar] [CrossRef]
- Cleary, P.W.; Hilton, J.E.; Sinnott, M.D. Modelling of industrial particle and multiphase flows. Powder Technol. 2017, 314, 232–252. [Google Scholar] [CrossRef]
- Chen, X.L.; Wheeler, C.A.; Donohue, T.J.; McLean, R.; Roberts, A.W. Evaluation of dust emissions from conveyor transfer chutes using experimental and CFD simulation. Int. J. Miner. Process. 2012, 110–111, 101–108. [Google Scholar] [CrossRef]
- Wang, Y.; Jiang, Z.; Chen, J.; Chen, J.; Wang, M. Study of high-pressure air curtain and combined dedusting of gas water spray in multilevel ore pass based on CFD-DEM. Adv. Powder Technol. 2019, 30, 1789–1804. [Google Scholar] [CrossRef]
- Geng, F.; Luo, G.; Wang, Y.; Peng, Z.; Hu, S.; Zhang, T.; Chai, H. Dust dispersion in a coal roadway driven by a hybrid ventilation system: A numerical study. Process Saf. Environ. 2018, 113, 388–400. [Google Scholar] [CrossRef]
- Sun, B.; Cheng, W.; Wang, J.; Wang, H. Effects of turbulent airflow from coal cutting on pollution characteristics of coal dust in fully-mechanized mining face: A case study. J. Clean. Prod. 2018, 201, 308–324. [Google Scholar] [CrossRef]
- Stone, L.; Hastie, D.; Zigan, S. Using a coupled CFD—DPM approach to predict particle settling in a horizontal air stream. Adv. Powder Technol. 2019, 30, 869–878. [Google Scholar] [CrossRef]
- Rani, S.I.; Aziz, B.A.; Gimbun, J. Analysis of dust distribution in silo during axial filling using computational fluid dynamics: Assessment on dust explosion likelihood. Process Saf. Environ. 2015, 96, 14–21. [Google Scholar] [CrossRef]
- Gouesbet, G. Laser-Based Optical Measurement Techniques of Discrete Particles: A Review. Int. J. Multiph. Flow. 2015, 288–297. [Google Scholar] [CrossRef]
- Wang, Y. Experimental study of flow regimes and dust emission in a free falling particle streams. Powder Technol. 2016, 14–22. [Google Scholar] [CrossRef]
- Ansart, R.; de Ryck, A.; Dodds, J.A.; Roudet, M.; Fabre, D.; Charru, F. Dust emission by powder handling: Comparison between numerical analysis and experimental results. Powder Technol. 2009, 190, 274–281. [Google Scholar] [CrossRef]
- Smits, A.J.; Lim, T.T. Photographic Equipment and Techniques. In Flow Visualization: Techniques and Examples, 2nd ed.; Imperial College Press: London, UK, 2012; p. 66. [Google Scholar]
- Lulbadda Waduge, L.L.; Zigan, S.; Stone, L.E.; Belaidi, A.; García-Triñanes, P. Predicting concentrations of fine particles in enclosed vessels using a camera based system and CFD simulations. Process. Saf. Environ. 2017, 105, 262–273. [Google Scholar] [CrossRef]


Publisher’s Note: MDPI stays neutral with regard to jurisdictional claims in published maps and institutional affiliations. |
© 2021 by the authors. Licensee MDPI, Basel, Switzerland. This article is an open access article distributed under the terms and conditions of the Creative Commons Attribution (CC BY) license (http://creativecommons.org/licenses/by/4.0/).