1. Introduction
Hybrid electric vehicles (HEVs), with the potential to reduce the effects of the current energy crisis and environmental pollution, have become the main trend in automotive technology and industrial development [
1,
2]. As the vehicle powertrain systems include different mechanical connection structures, the common hybrid powertrain systems are series hybrid systems, parallel hybrid systems, series-parallel hybrid systems, and power-split hybrid systems [
3,
4]. HEVs with different hybrid configurations have great fuel economy owing to their automatic engine start/stop strategies [
5,
6]. However, the dynamic characteristics of the motor and engine are inconsistent during the engine start-up process. The separation action of the clutch and brake is also a factor to generate some shocks in some cases. These characteristics make the control system more complex and the transmission system more prone to shock and vibration.
Experiments were conducted to better understand the dynamic characteristics of the hybrid powertrain system and the effects of the system’s shocks during the engine start-up process. Tong [
7] and Du [
8,
9] found that when the target torques of the motor and engine change abruptly during the mode switching process, the powertrain system has a significant jerk due to the different torque characteristics of the motor and engine. Zhang [
10] et al. conducted an experimental study on vehicle jerk during the typical switching and gear shifting process in the vehicle drive state. The results showed that vehicle jerk is generated due to the opening and closing of the clutch and the coordination actions of the engine and motor torque. Zhu [
11] found from road tests on parallel hybrid cars that switching between different gears and different modes and the coordination between multiple power sources are the main reasons for greater shocks to the powertrain system. The reverse drag and the sudden torque change of the motor have clear effects on the impact and vibration of vehicles. Hong [
12] found that the action of the engine’s clutch leads to vehicle impact and vibration in the process of mode switching. Hu [
13] and Lin [
14] analyzed the mode switching process of a parallel hybrid car. They found that vehicle speed has little impact on vehicle shocks, while the system torque change rate has a greater impact on shocks and vibrations. Yoshioka [
15,
16], Komada [
17], and Kawabata [
18] studied the engine starting process of Toyota’s hybrid transmission system. They concluded that the engine pump pressure is the most important factor in causing vibration when starting the engine. Wang [
19] tested the hybrid vehicle jerk in the engine start-up process. It was found that the engine pulsating torque is the main factor causing system shock. Kuang [
20] conducted a vehicle test study on the engine start-up process. The results showed that the engine cylinder pressure and the initial rotation angle of the engine during start-up are the main reasons for vibration and noise. Hwang [
21] and Chen [
22] studied the dynamic characteristics of the transmission system in the start-up process. They found that the initial angle of the engine crankshaft has a great impact on the angular acceleration of the seat track. Liu [
23,
24] proposed that the engine pulsation torque and the initial position of the engine crankshaft have a great influence on the excitation fluctuation of the transmission system. Kim [
25] designed a vehicle control algorithm in Simulink and validated the Autonomie Volt component models and control strategy using vehicle test data. According to papers published by Davis [
26], Tomura [
27], Hyunsup [
28], and Dongsuk [
29], in the engine starting process, the pulsating torque of the engine produces significant impact and vibration. Therefore, it is necessary to use a specific experimental test to analyze the shocks and vibrations of the vehicle powertrain system.
According to the literature, current research mainly focuses on the impact of the engine cylinder pressure/pulsation torque, engine starting initial angle, engine/motor/clutch torque mutation, and other factors affecting vehicle jerk. However, there is a need for further research into the dynamic response characteristics of the components of the hybrid powertrain and the influencing factors of shock and vibration in the mode switching process during engine start-up. Such research is helpful to optimize the design of hybrid powertrain, develop a more appropriate dynamic coordination control method, and improve the driving comfort of vehicles. This paper analyzes the output characteristics of the battery motor, engine, and driveshaft of a hybrid powertrain test bench. The main variable parameters of the engine control unit (ECU) are also investigated during the engine start-up process. In addition, influencing factors such as system shock and vibration caused by the engine start-up are investigated.
The remainder of this paper is organized as follows: The structure of the compound power-split hybrid powertrain system is introduced in
Section 2. Then, in
Section 3, the basic control strategy of the engine start-up is formulated.
Section 4 shows the test bench built for the experiment. Next, the bench test results obtained in the mode switching process during engine start-up are analyzed in
Section 5. Finally,
Section 6 presents the conclusions of this study.
2. Structure of Compound Power-Split Hybrid Powertrain System
Figure 1 shows the compound power-split hybrid electric vehicle (PSHEV), which is studied in this article. The compound PSHEV contains a gasoline engine, a power battery pack, two permanent magnet synchronous motors (MG1 and MG2), a motor controller, a coupling mechanism based on a Ravigneaux planetary gear train, two brakes (B
1 and B
2), a torsional damper (TD), a main reducer and differential, and some wiring harnesses. The Ravigneaux planetary gear train contains the small sun gear S
1, the large sun gear S
2, the front short planetary gear P
b, the rear long planetary gear Pa, the front and rear common planet carrier C, and the front and rear common gear ring R. In the powertrain system of the compound PSHEV, the engine is connected to the planet carrier C through the TD. The planet carrier C can be locked by brake B
1. The small motor MG1 connects to the sun gear S
1, which can be braked by brake B
2. The big motor MG2 connects to the large sun gear S
2. The ring gear R is the output terminal of power, which is directly connected to the final drive.
Table 1 shows the vehicle parameters of the compound PSHEV and its main components.
3. Control Strategy during Engine Start-Up Process
A compound PSHEV starts in pure electric mode. When the battery state of charge (SOC) is less than its threshold, or the vehicle speed exceeds its threshold, or the driver’s required torque exceeds the maximum torque threshold, the system starts to enter the engine start-up process.
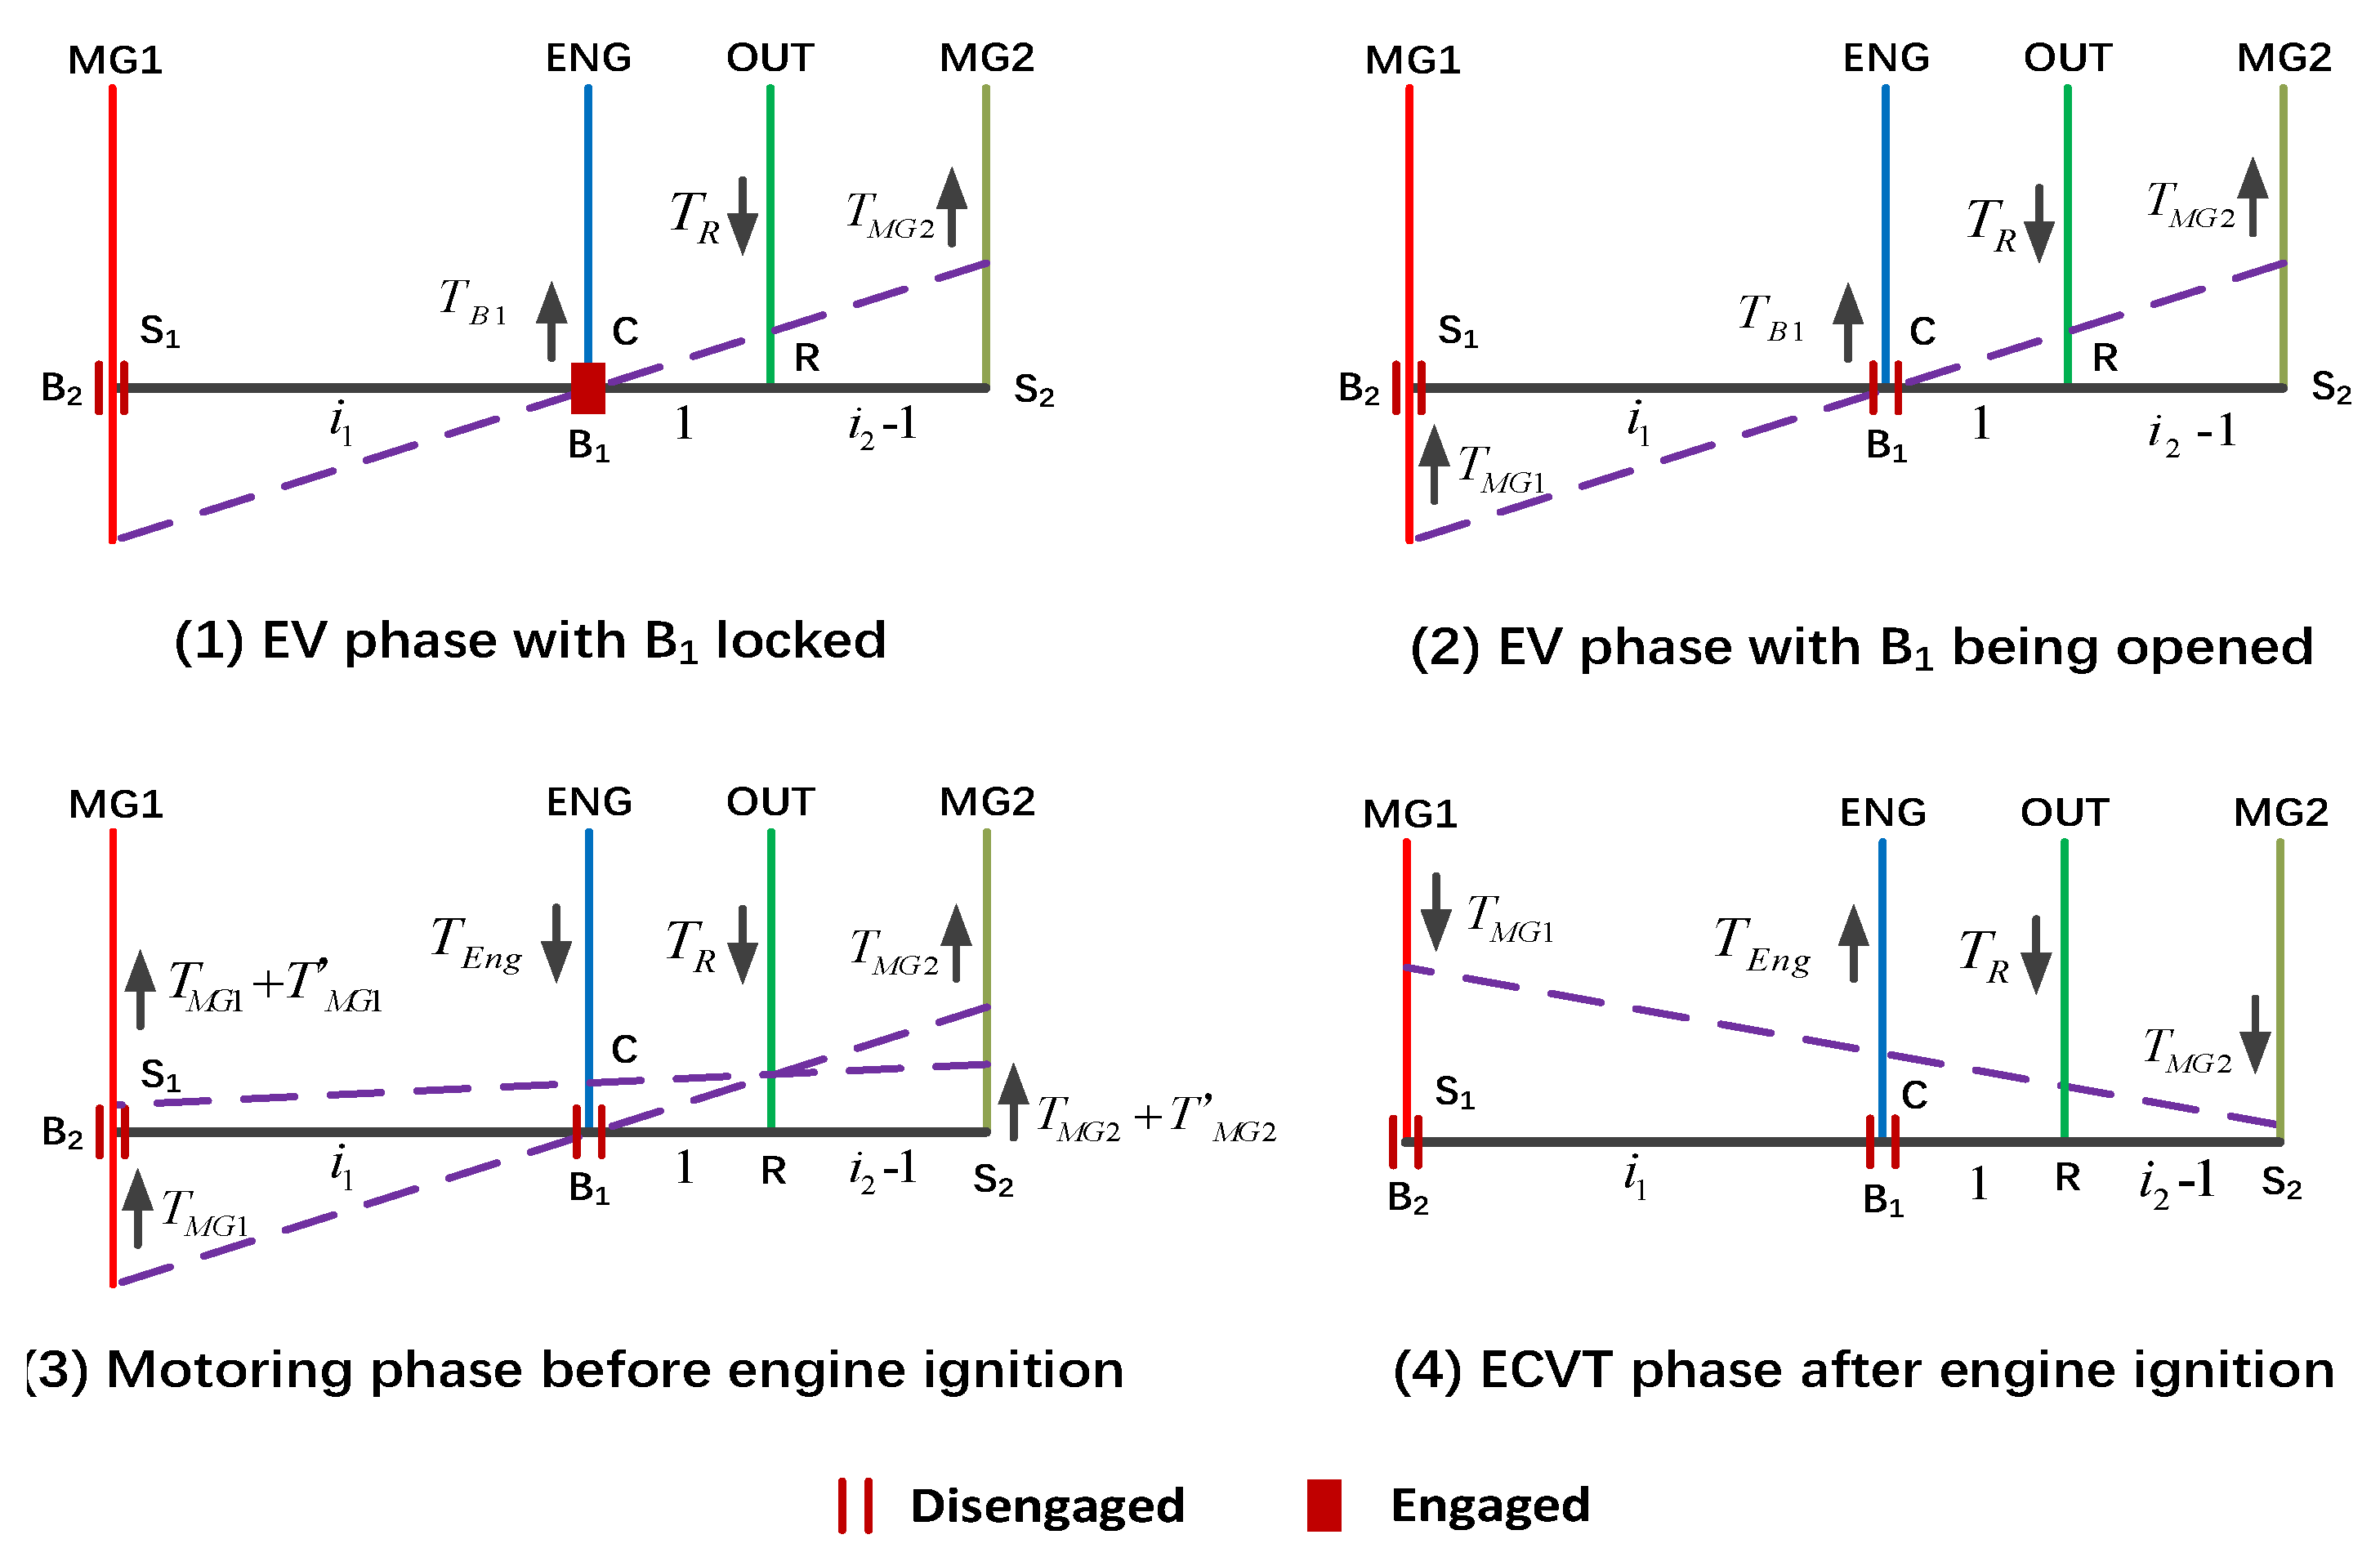
Figure 2 illustrates these four steps as follows: (1) electric vehicle (EV) phase in which B1 is locked, (2) EV phase in which B1 is being opened, (3) electric engine starting phase before the engine is firing, and (4) electro continuously variable transmission (ECVT) phase after the engine is firing.
In
Figure 2, the solid black line is the lever balance line, where the speed on the balance line is zero, the speed below the balance line is negative, and the speed above the balance line is positive. The torque arrow facing upward is positive, and the torque arrow facing downward is negative.
According to the lever chart in
Figure 2 and the dynamic relationship of the transmission system, the torque relationship of two motors during the engine start-up process can be expressed as follows: The basic control strategy can be expressed by Equations (1)–(3).
(1) EV phase in which B1 is locked.
In the first stage, B
1 is braked by the hydraulic system. The whole car is driven by the torque of MG2. At this stage, the torques produced by two motors can be expressed as follows:
where
is the wheel demand torque,
is the balance torque produced by brake 1,
and
are the speed ratio parameters of the front row and the rear row, and
is the final drive ratio.
and
are the rotational inertias of MG1 and MG2, respectively.
is the angular acceleration of the vehicle in longitudinal motion.
(2) EV phase in which B1 is being opened.
In the second stage, B1 is rapidly opened through the electro-hydraulic control system. The torques of the two motors keep the engine stationary as much as possible while the car is driven. At this stage, the torque relationship of the two motors can be expressed as follows:
(3) Electric engine starting phase before ignition and ECVT phase after ignition
In the third stage, B1 has been completely separated. The MG1 compensates for
to pull the engine’s speed to its target ignition speed. The MG2 provides
to ensure that the car runs in response to the driver’s actions. In the fourth stage, the engine starts the fuel injection and the engine and motors work together to drive the car. Since the brakes are completely separated in the third and fourth stages, their dynamics formulas are the same:
where
or
is the engine demand torque,
is the rotational inertia of the engine, and
is the demand angular acceleration during the engine start-up.
Firstly, the control strategy of the engine start-up, Formulas (1)–(3), was modeled using the Matlab/Simulink software and was integrated into the control software in the model’s existing hybrid control unit (HCU) bench test system. Thereafter, model-in-the-loop (MIL) and SIL software-in-the-loop (SIL) tests by Dspace/TargetLink software were performed, and C language code of the application layer and A2L file were generated. By combining and compiling the application layer codes and bottom layer codes, program files in HEX and A2L formats were generated. The upper computer utilized an Inca ES581 module and the controller area network (CAN) network to communicate and wrote the HEX file into the powertrain controller HCU.
4. Test Bench System for Compound Power-Split Hybrid Electric Vehicle
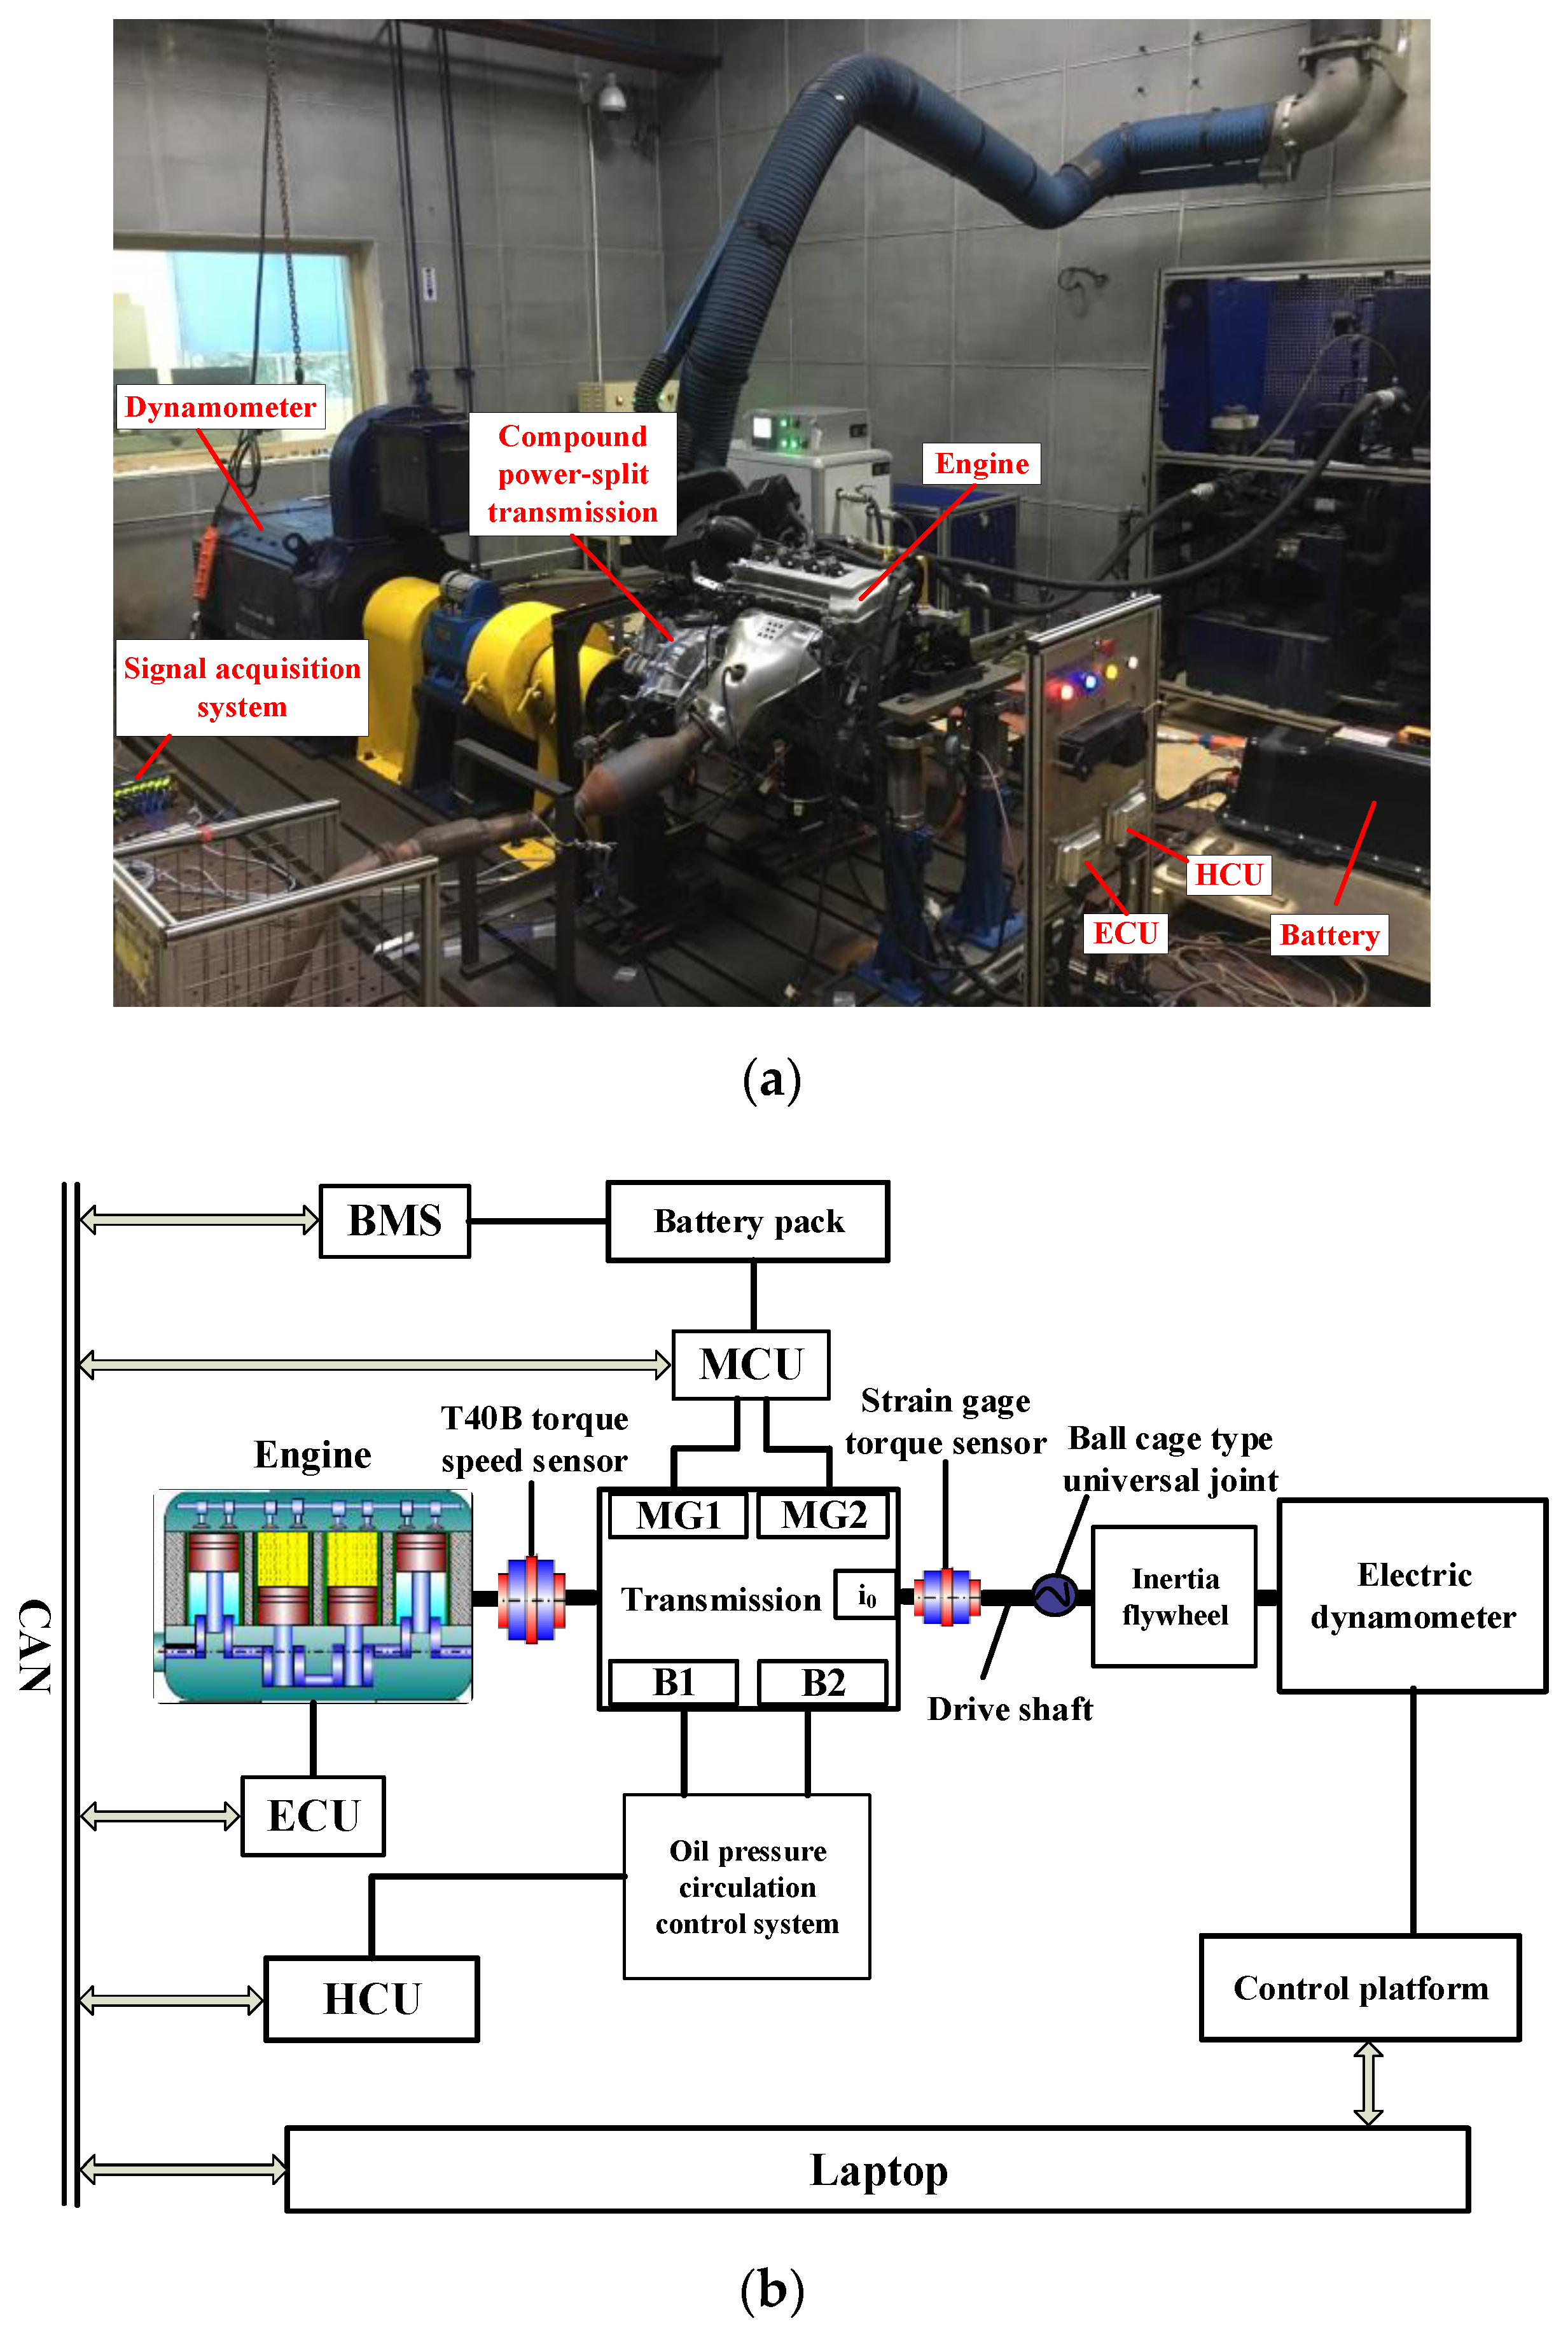
Figure 3a,b show the compound PSHEV test bench and its design layout, respectively. The test bench includes the following: power battery and battery management system (BMS) controller, the engine and its ECU, cooling water circulation system, the outside air intake system, angular displacement measuring encoder, HBM T40B torque/speed sensor, compound power-split transmission, two motors (MG1 and MG2) and the corresponding motors’ control unit (MCU), two brakes (B1 and B2) and the strain gauge hydraulic loop control system, driveshaft torque sensor, hybrid control unit (HCU), multifunctional data acquisition system, ball cage universal joint, inertia flywheel, electrical dynamometer and its control platform, laptop, low voltage battery, and wiring harness.
Table 2 lists the test equipment and its parameters.
The measurement and control interface of the HCU system is used to send control commands to the HCU, and variable data are recorded in the CAN network. The measurement and control interface of the ECU collects variable ECU data through the CAN network. The measurement and control interface of the LMS signal acquisition system collects data from the CAN network, T40B torque and speed sensor, driveshaft strain gauge torque sensor, and vibration acceleration sensor and collects other data through multiple channels in high frequency. The measurement and control interface of the dynamometer control system is mainly used to monitor the power dynamometer and simulate the load of the whole vehicle.
5. Characteristic Analysis of Bench Test Results during Engine Starting Process
The bench test conditions are shown in
Table 3. The electric dynamometer bench test system ran at a constant speed and in change torque mode. The dynamometer ran at a constant speed of 27 rad/s (equivalent to the vehicle running at 30 km/h) during the test. The powertrain system first ran in EV mode and then started the engine after the vehicle controller sent the control command to start the engine.
For a better comparative analysis of the bench test data obtained from the vehicle controller HCU, the engine controller ECU, and the LMS data acquisition tool, the time coordinate axes from EV mode to ECVT mode are uniformly converted into coordinate axes with the time domain from 0 to 1.6 s, as shown in
Figure 4,
Figure 5,
Figure 6,
Figure 7,
Figure 8 and
Figure 9.
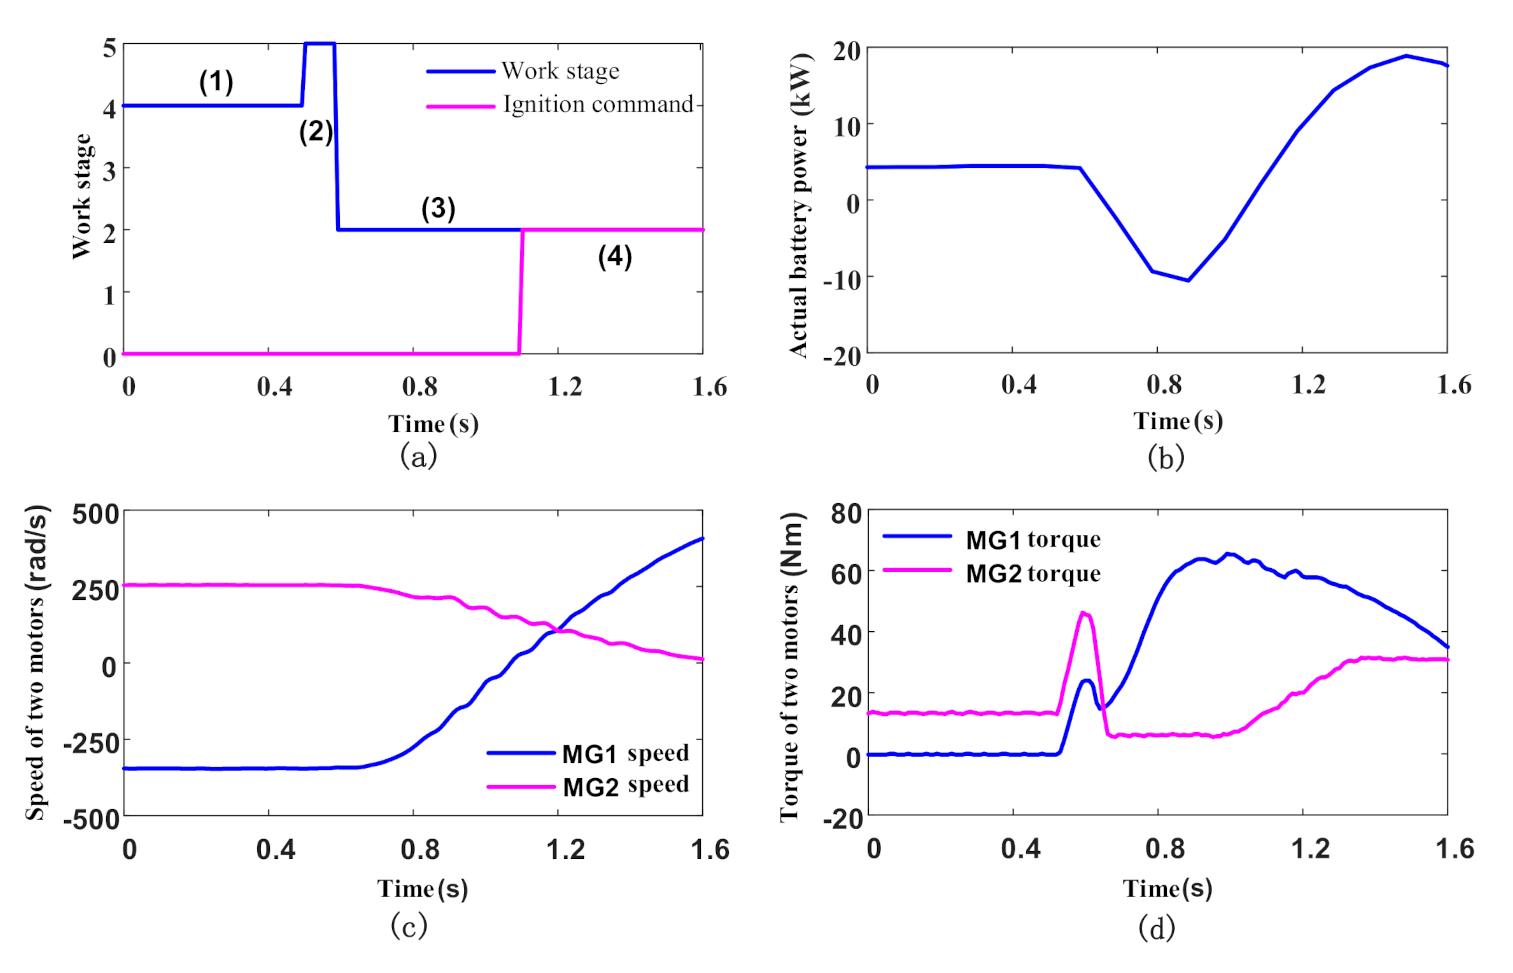
Figure 4a shows the working stages during the mode switching process during engine start-up. The red line is the engine ignition command. A value of 0 indicates that the engine is not firing, and 2 means the engine is firing (started at 1.1 s).
Figure 4b demonstrates the actual power of the battery which, during the electric engine starting stage, is negative, which indicates the battery is being charged by the motor. After ignition, the power of the battery is positive, indicating that the battery is in its discharge state. It can be seen from
Figure 4c,d that, before ignition, the result of the speed and torque of the small motor MG1 during the electric starting stage is negative, that is, the power is negative, which denotes that MG1 is generating power for the battery. In contrast, the large motor MG2 is in an electrically driven state. In addition,
Figure 4d shows that, in the engine starting process, MG1 torque increases significantly, whereas the MG2 torque is in a stable state. To start the engine, a larger torque is needed to overcome the engine resistance moment. That is, the small motor MG1 is the main power source to start the engine, and the large motor MG2 keeps the powertrain system running stably.
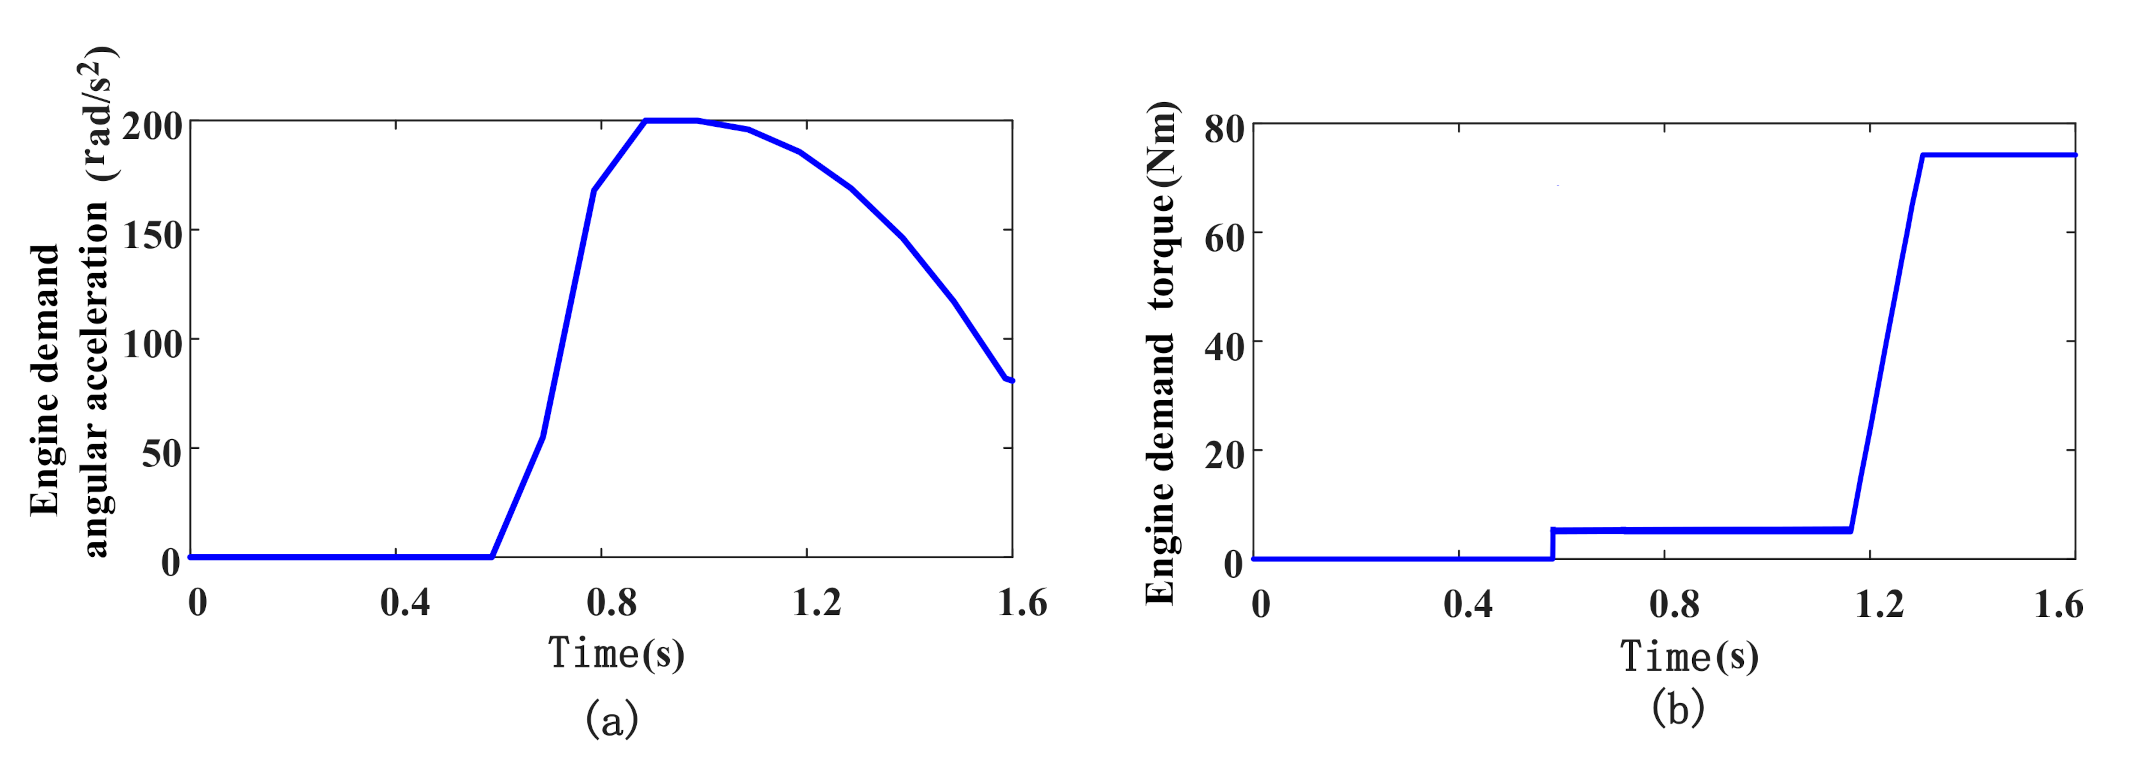
Figure 5a presents the demand angle acceleration of the engine at the electric starting stage before ignition. It resembles an “S-curve”. The maximum demand angle acceleration in this case is 200 rad/s
2 and decreases with time after ignition.
Figure 5b shows the demand torque sent to the engine by the HCU. It shows that the engine has a demand torque of 5 Nm even though there is no ignition or fuel injection during the electric starting stage. After ignition, the engine demand torque increases to 74 Nm.
Figure 6 illustrates the values of the main variables collected by the test bench system in the ECU.
Figure 6a shows the throttle percentage of the engine, where its initial value is 6.86%. During the engine’s electric start phase, it drops to about 0.5%. The throttle percentage changes from the closed state to the gradual opening process during the initial combustion process of the engine.
Figure 6b denotes the air intake of the engine. It tends to increase gradually during the initial combustion process of the engine. As shown in
Figure 6c, the intake manifold pressure of the engine decreases during the initial combustion process of the engine, even though its initial value is 101 kPa.
Figure 6d demonstrates the set excess air coefficient. The excess air coefficient during the engine starting process exceeds 1, which denotes a diluted mixture. The excess air coefficient tends toward the ideal value of 1 during the ignition and combustion process.
Figure 6e presents the set fuel injection pulse width of the engine. It falls from the maximum of 21.17 ms to almost 7 ms during the initial combustion process. The preset engine ignition advance angle shown in
Figure 6f rises from the ignition delay angle of 1.5° to the ignition advance angle of 21.75° during the initial combustion process, contrary to the usual trend of engine fuel injection pulse width.
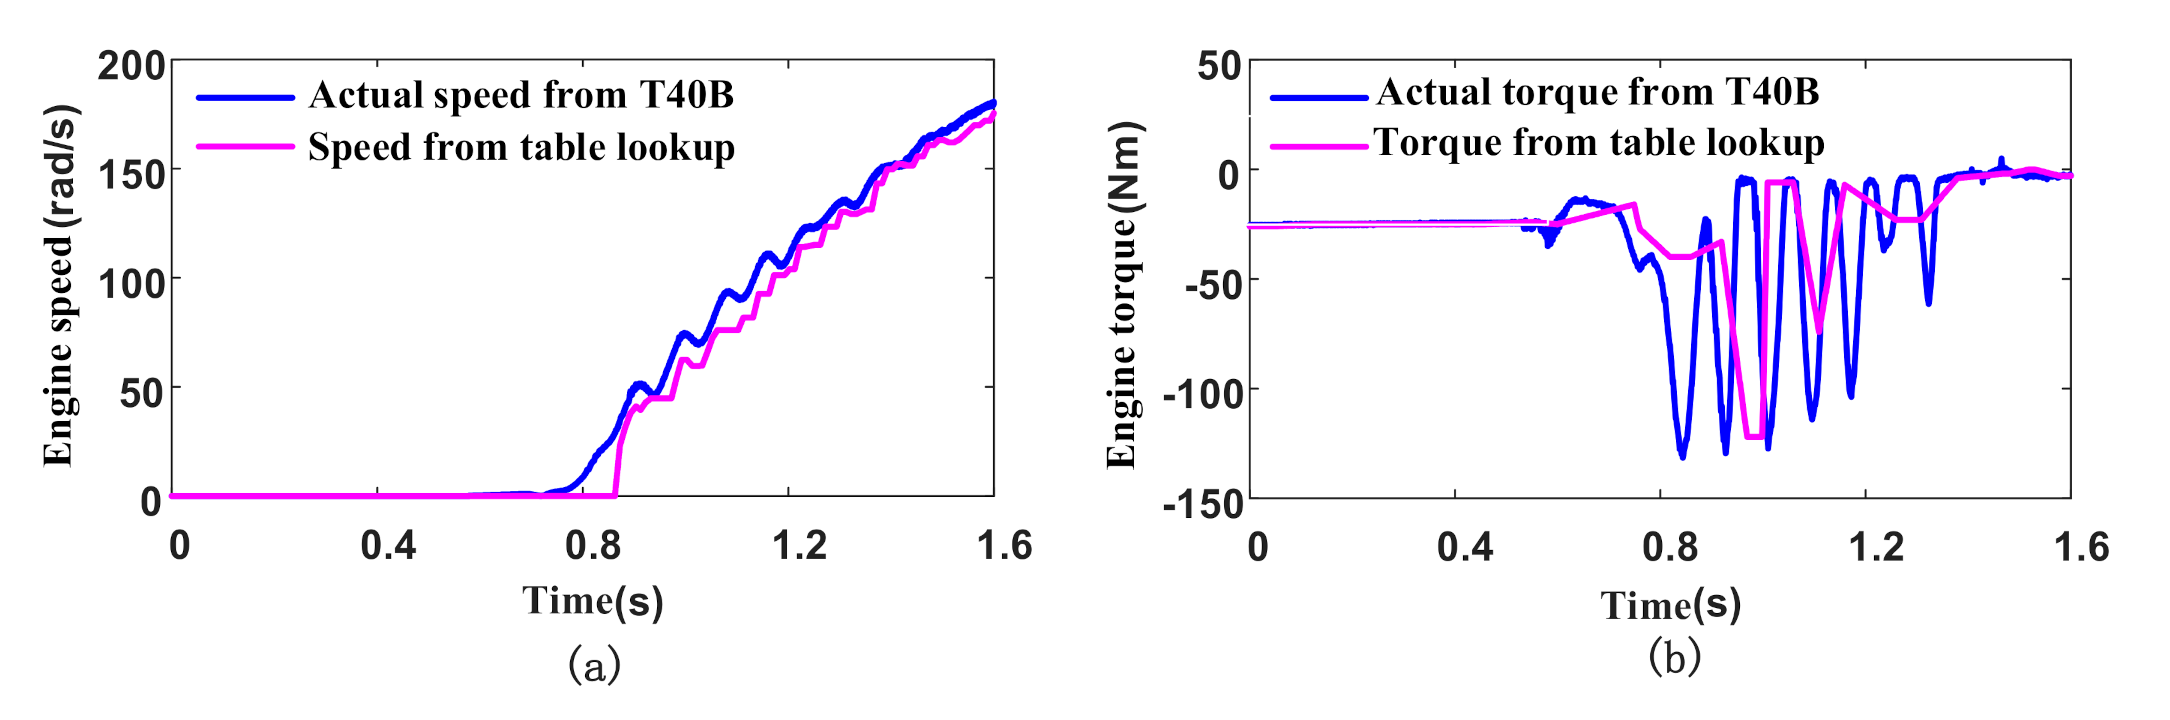
Figure 7 shows the engine speed and torque characteristics, including the engine starting process. In the case of
Figure 7a,b, the actual speed and torque of the engine output shaft (which is directly connected to the planetary frame) collected from the HBM T40B torque sensors are very different from those of the CAN network. In
Figure 7a, the engine speed appears at an obvious low-frequency fluctuation, where the collected engine speed fluctuation is more evident than the engine speed fluctuation in the CAN network. Moreover, the speed characteristics of the latter are never below 300 rpm. In
Figure 7b, the collected engine torque fluctuation is much more obvious than that shown in the CAN network. The pulsating torque fluctuation of the engine is most distinct during the electric start phase of the engine, and it then declines with an increase in the engine speed. Therefore, in the mode switching process involving the engine start-up, the engine speed and torque of the CAN network cannot satisfy the requirements necessary to control a PSHEV. In actual control conditions, the engine output shaft speed and torque need to be estimated online to suit the requirements of actual control accuracy.
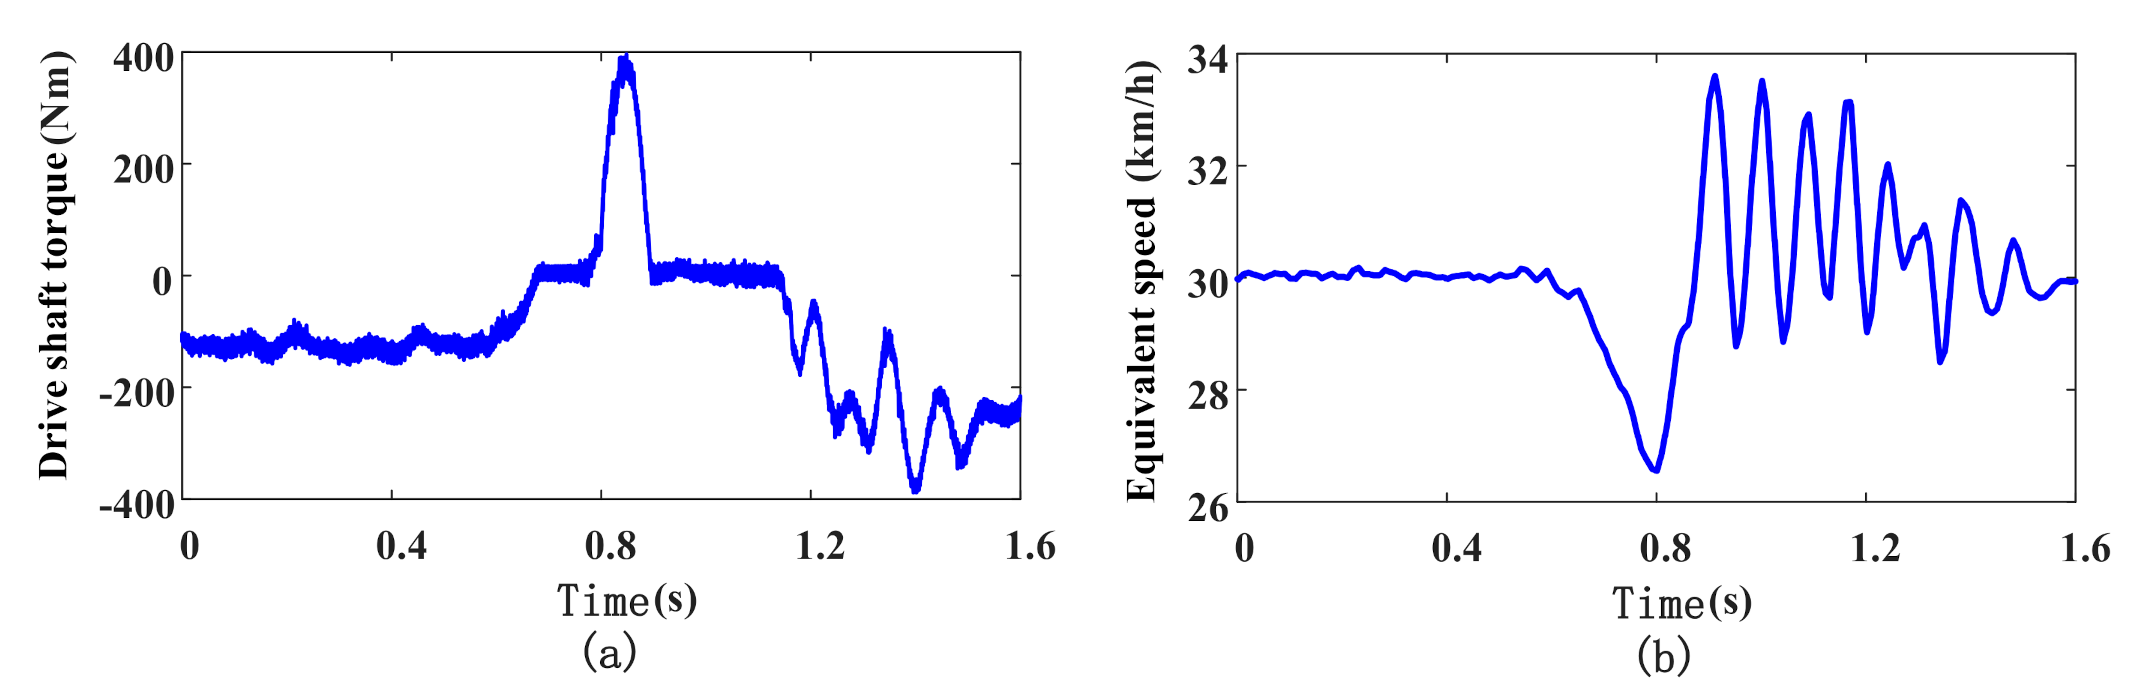
Figure 8a illustrates the collected torque of the actual driveshaft. The torque of the driveshaft in the bench test mainly comes from the superposition of the torque at the output of the reducer, the torque of the power dynamometer, and the inertia resistance torque of the system flywheel. The driveshaft torque keeps a constant positive torque in the EV stage. In the electric engine starting process, the torque of the driveshaft shows a large positive torque mutation and then remains constant. After ignition at 1.1 s, the driveshaft torque fluctuates and starts to trend towards negative torque.
Figure 8b shows the equivalent speed without considering the influence of flywheel inertia. In the EV stage, the equivalent speed basically remains at about 30 km/h. Once the electric engine starting process occurs, the equivalent speed decreases before it starts to fluctuate. Then, the fluctuation ranges of speed decrease gradually after ignition.
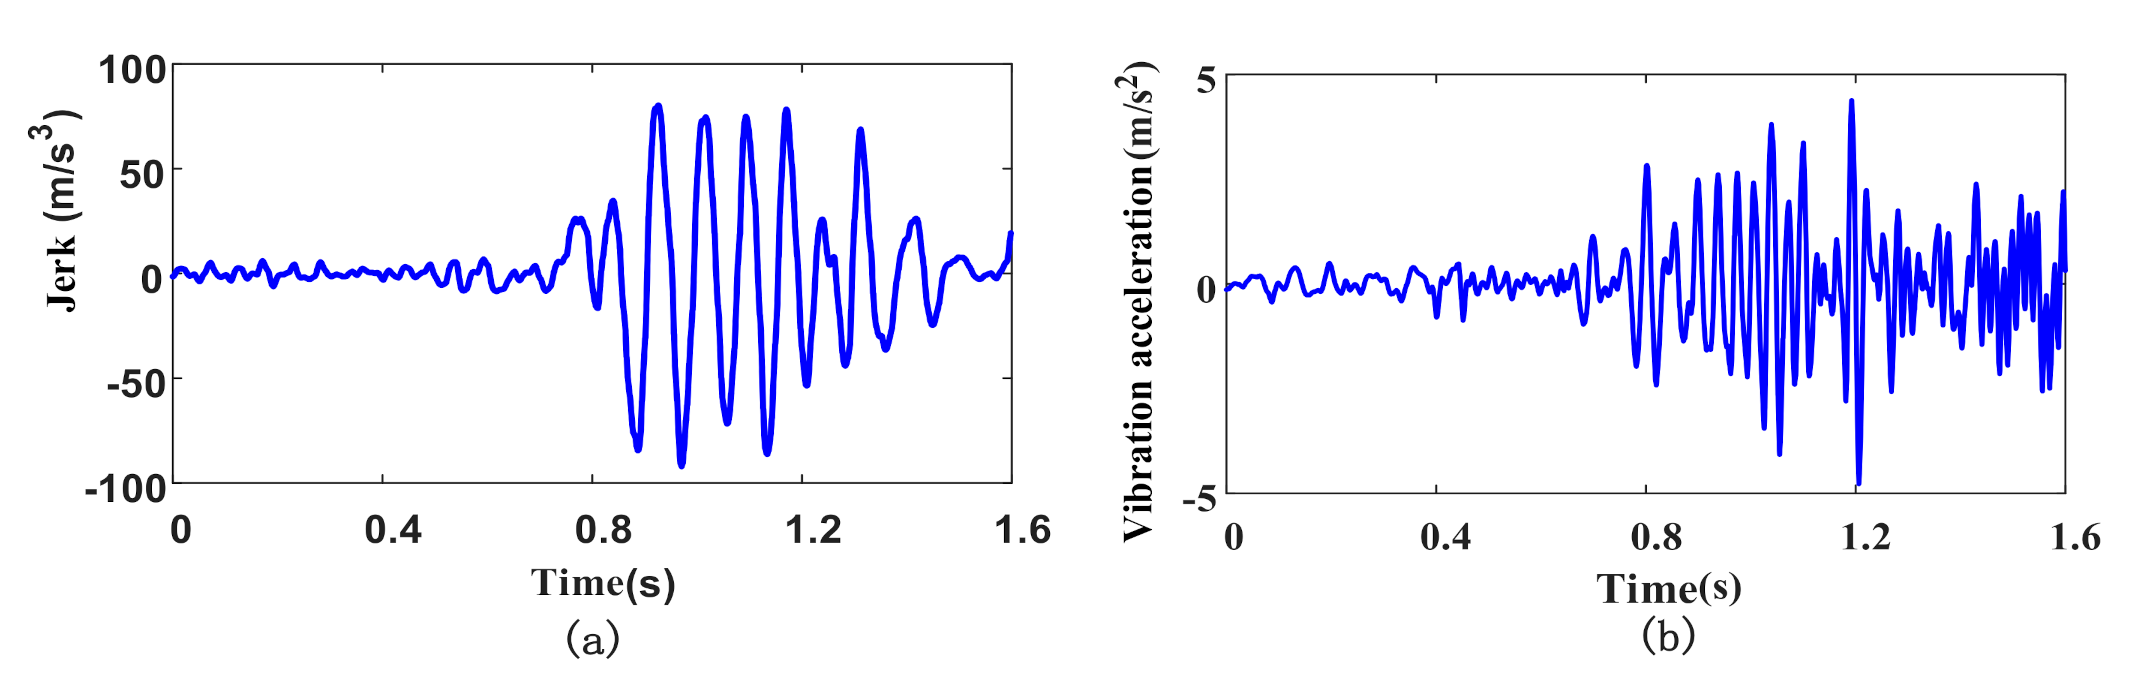
As shown in
Figure 9a, the equivalent vehicle jerk is the second derivative of equivalent speed. In the EV stage, the equivalent jerk is less than 10 m/s
3. When entering the electric engine starting process, the equivalent jerk presents a wide fluctuation. The maximum value of the equivalent jerk reaches 92.12 m/s
3.
Figure 9b denotes the data results of vibration acceleration in the x-direction, which are collected by the vibration acceleration sensors mounted on the transmission housing. It shows that the vibration acceleration fluctuates slightly in the EV stage and is less than 0.9 m/s
2. Again, when entering the electric engine starting process, the vibration acceleration fluctuates, and the maximum value of the absolute value of the vibration acceleration in this process is 4.077 m/s
2. After the ignition and fuel injection, the vibration acceleration fluctuates considerably, and its maximum value reaches 4.78 m/s
2. After this, the fluctuation is maintained at 2.5 m/s
2. It should be noted that the maximum vibration amplitude after ignition is caused by the combustion heat accumulation explosion of the engine transient ignition injection cylinder.
Figure 6c and
Figure 7b show that the engine torque drops as the intake manifold pressure decreases during the electric start phase. Since the inlet manifold pressure of the engine directly affects the pressure change in the engine cylinder before ignition and injection, the excessive inlet manifold pressure before ignition and injection is one of the main reasons for the large output torque ripple of the engine. In addition,
Figure 7b and
Figure 9a,b demonstrate that the large fluctuations in the engine’s pulsation torque are the main cause of the system shocks and vibrations.


