1. Introduction
Programming by demonstration (PBD) is an approach in which software is developed partly or completely by an interactive demonstration to the computer of how to behave in specific situations, i.e., how to perform actions and data processing on specific examples. With PBD, a designer can demonstrate to a computer how to behave in individual cases, while the generalized specification is created by a computer with possible assistance and suggestions from designers.
In software development research, the programming by example (PBE) and programming by demonstration (PBD) techniques emerged as ways to define a set of operations without the need to learn a programming language. The user does not need to know some specific programming language in order to automate repetitive tasks; instead, the user presents the programs using the program’s own user interface (or a stub of it). Such demonstrational interfaces allow the user to perform actions on specific examples of objects (often using direct manipulation), although examples represent a much more general class of objects. The term “demonstration” is used because the user demonstrates the desired results through examples of values.
1.1. Motivation for Interactive Construction of Business Processes Models
The topic of this paper is a prototype program with a graphical user interface (GUI) for interactive construction of a specific category of business processes models. The idea of interactive specification of behavior by demonstration is not new, it exists in papers of many PBE and PBD paradigm researchers, and is precisely described by Lieberman [
1], where the term “intelligent interface agent” implies a system (machine) which communicates with the user directly through user interface, which has the ability to reason and conclude and uses procedures to perform tasks that are demonstrated by a user. However, this paper shows how this same paradigm can be applied to process mining [
2,
3] and inference of a specific category of business process models by a system through interactive demonstration.
Many information systems have the possibility to record their execution and, in this way, generate a trace of events describing the real system behavior. Process mining techniques are based on the assumption that there is a strong relationship between process models and the “reality” recorded in the event log in the form of traces [
2]. From behavioral sample records in the event log, the α-algorithm [
4] automatically generates a process model that belongs to a subclass of Petri nets, known as workflow (WF) nets [
5]. The property of completeness of the log required by the original α-algorithm often implies the necessity of having a large number of traces in the log based on which the “representative” model for the behavior seen in the log has to be constructed. Therefore, our challenge was to find logs with potentially much lower number of traces, which may not be complete, but are sufficiently valid so that, using the appropriate algorithm based on the evidences recorded in such logs, a “representative” model can be obtained. To achieve this, we have partially modified the technique of process model discovering and also the α-algorithm itself, the modified version of which we named the α
|| -algorithm [
6,
7].
The graphical user interface that we created is a tool that visually shows steps of the α||-algorithm. Such a tool could serve as a learning tool and playground for those who want to learn more about how the more general α-algorithm that is based on the same principles as its modified version α|| functions.
In existing process mining techniques used to automatically discover process models from event logs, the user has very little influence. On the other hand, the traditional process modeling tools which are completely user-driven do not use historical evidence from the event logs during process modeling. Our idea was to find a way to engage the user in discovering process models by taking part in the creation of the event log, so that the user can make certain decisions taking into consideration the contents of the event log. Moreover, we wanted to explore possibilities of incremental discovering of process models, where each incremental process model, the candidate model, would reflect the event log demonstrated up to the point. The model created in that way would be a real reflection of the process realization up to that moment and would result in total conformity of the model within the event log. That might enable better process model upgrading and greater flexibility in selection of scenarios of the observed process activity executions. This has been achieved through the idea shown in the paper where the user enters log entries (scenarios) step by step and observes the current candidate model shown and obtained on the basis of the input log entries.
In the specific case presented in this paper, the user performs possible scenarios of executed activities of a block-structured parallel business process using a graphical user interface and according to this performance, the system generates a business process model. After each played scenario, a candidate model is generated, which represents the model of all the performed scenarios of executed activities, but which does not have to be the model of all possible scenarios of the regarded process activity execution. The idea is that the system creates a model that also fits to all possible scenarios of the regarded process activity execution, which is called the final model, as soon as possible, i.e., based on as few performed scenarios as possible. In order to achieve that, the system provides guidance to the user to perform a scenario which would offer the system the biggest number of useful information for model generalization, which is explained in detail in the paper.
The paper is organized as follows: The continuation of this section provides an overview of the literature from the area of interest for our work. In
Section 2, some basic concepts and terms (already published in our papers [
6,
7]) on which the realization of the interactive model construction is based are briefly presented, along with the elements of automatic inference in the demonstrational program. In the third section, the procedure of interactive construction of block-structured parallel business processes models by demonstration on a single demonstrative example is explained in detail, together with the graphical user interface used to perform the demonstration. In the fourth section, the results of the conducted experimental analysis are presented and discussed.
Section 5 contains a comparative analysis of some other solutions with our approach. The paper ends with some conclusions and guidelines for future work.
1.2. Related Work
Creation of business process models by using demonstration presented in this paper is akin to Lieberman’s elements of scenario-oriented recommendation [
8] and especially on Harel’s play-in/play-out techniques [
9].
By addressing the issue of describing the actions and objects selected by users in the user interface in PBE, and thus determining which type of generalization is possible, Lieberman et al. propose a visual generalization [
10]. In visual generalization, visual properties of the interaction elements themselves, such as size, shape, color, and appearance of graphical objects, are used to describe user intentions. Likewise, we used differently colored scenarios to indicate their different roles in the model generation process by demonstration.
Harel et al. [
9] have developed an approach where especially profiled interaction models with formal semantics of execution, called Live Sequence Charts (LSC), can be specified by behavior demonstration of systems based on scenarios (which they call play-in). After the specification of the LSC model, the system can reproduce the defined scenarios in specific cases itself (the technique which they call play-out). In order to realize the mentioned techniques based on scenarios, the tool called Play-Engine was created. This approach is designed primarily for the development of reactive, event-driven systems of general purpose.
The main characteristics of our proposed tool are interactivity, incremental model construction, and visualization, which are represented as concepts in many works. Of particular importance to us are works dealing with business process models having the same or similar characteristics with our tool, although they serve different purposes.
Seeliger et al. have presented ProcessExplorer [
11,
12], which allows analysts to interactively explore and analyze event logs with the automatic guidance provided by the ranked subset and insights recommendation. This significantly makes the analysts’ work easier, especially for event logs with large sets of events.
Visualization as a technique for displaying differences between the control flow of the model and the event log has been used in an interactive and incremental approach to process model repair for models in the BPMN language [
13]. Such an approach overlays each discrepancy on top of the model, and lets the user decide incrementally which discrepancies to fix and how, based on the provided visual guidance.
However, the greatest overlap of the ideas and characteristics of the used tool have been found in the works of Dixit et al. [
14,
15,
16,
17,
18]:
- -
Interactive event log repair addresses the issue of interactive repairing the event logs in the process mining analysis, with the domain knowledge of an informed user.
- -
Interactive process model construction addresses the issue of modeling/discovering process models interactively by using information derived both from the event log and the expertise of a user.
- -
Interactive process model repair addresses the issue of interactively repairing a pre-existing process model by using the domain knowledge and information derived from the event log.
- -
Interactive process analytics addresses the issue of interactively exploring real-life execution of a process based on the process model and the event log in order to evaluate the possible compliance and performance-oriented issues.
Using the synthesis rules kit from [
19], which serves as the building block for well-formed free-choice nets, Dixit and associates implemented a robust engine [
14] which can be used by an end user for modeling/discovering process models in an interactive fashion.
Today, the PBD technique is most widely used in the field of robotics [
20], where, based on examples or demonstrations, a strategy is created that allows the robot to perform a certain activity, which is known in the literature as learning from demonstration (LfD) [
21]. Within LfD, during demonstration of the desired robot behavior, a number of pairs of state-action are defined and recorded. LfD algorithms use this set of examples to develop a strategy by which a robot chooses a particular action based on the current state and reproduces the demonstrated behavior. Other than serving us as an idea for adopting a strategy for playing out process execution scenarios, the term LfD [
21] itself has encouraged us that our graphical user interface could serve as a learning device on the way of process model discovery from event log demonstration.
1.3. Challenges
Discovering models based on recorded scenarios of process execution has led us to process mining techniques and the α-algorithm [
2,
3,
22]. However, the α-algorithm is only applicable to complete event logs [
3] and did not allow us to achieve our goal. Our research in that area has resulted in a modification of the process mining technique as well as of the α-algorithm itself by introducing the indirect relation [
23] between activities and also in defining new types of event logs and the conditions that they fulfill. The results of that part of our research in the form of a modified PM technique, the α
||-algorithm, and causally complete and weakly complete event logs are presented in our previous papers [
6,
7].
In [
6], we briefly introduced our modified PM technique and the α
|| -algorithm, and we defined two types of logs, the so-called causally complete and weakly complete logs. Other than that, the results of the application of the modified PM technique and the α
||-algorithm on these types of logs, as incomplete event logs, has been shown in the example of the parallel business process.
The paper [
7] is largely devoted to causally complete logs. A more detailed presentation of our modified PM technique and algorithm is given in that paper, with the formal support of definitions, theorems, and proofs. Moreover, the comparison of results obtained by applying our algorithm with the results of other process mining algorithms on causally complete logs was done. Finally, that paper brings an extensive experimental analysis whose results are presented. In this analysis, values of the minimal sizes of complete logs and causally complete logs are compared for 100 real examples of parallel business processes. Furthermore, plug-ins are also presented in the existing ProM framework [
24] designed for the needs of the experimental analysis.
For the realization of the idea of interactive business process model generation, a modified PM technique and the α
||-algorithm applied on weakly complete event logs [
6] were used. In that paper, the attention was focused on a specific class of parallel processes—block-structured parallel processes [
7], which are suitable for the use of a modified PM technique and the α
||-algorithm, as it will be shown later in this paper.
This paper is dedicated to incrementally generating models of block-structured parallel business process by direct manipulation through the created graphical user interface. Other than the detailed presentation of the procedure of generating models, the description of the manner of the graphical user interface functioning as an “intelligent”, user interface is also given, which is essential for the realization of our idea.
2. Materials and Methods
In this section, we will address some of the concepts that are necessary to understand this paper. For the purpose of illustration of the effect of our modified method on the capability and efficiency of process model discovering, we shall define the particular class of business processes to which our method is restricted at this stage, namely parallel processes. Process models we have dealt with make a subclass of block-structured process models that we named block-structured parallel process models [
6,
7].
2.1. Properties of Weakly Complete Event Logs
The ability of the α||-algorithm that its application on weakly complete event logs may lead to model discovery was successfully used for the generation block-structured parallel process models by demonstration. Therefore, the basic concepts and properties of weakly complete event logs, which were used to interactively generate process models, will be presented below.
The defined relations between activities can be represented with a matrix, which represents a footprint [
2,
3] of the event log, where the relations between any two activities in the modified PM technique for discovering process models are defined as it is presented in [
7].
For a particular process model to be discovered, there may be a large (in general, an unlimited) number of different complete logs [
6,
7]. However, all these complete logs have the same footprint, i.e., the same causality relation. We call this relation the basic causality relation and we mark it with →
BN [
6,
7]. As we have shown in [
7], it can be concluded that the main task is to find a log with the causality relation that is equal to the basic causality relation, and then apply the α
||-algorithm, which then leads to discovery of the original network of parallel processes.
During our research, we have found that there are logs from which one can discover a causality relation equal to →
BN, but one cannot come to it only from the evidence recorded in the log, but the individual elements of the causality relation can be inferred in the process of applying the α
|| algorithm of them. Examples that we have analyzed showed that the original network could be discovered from an incomplete log
L for which the following holds: →
BN ⊂ (→
L∪ ⇒
L), and →
L ⊂ →
BN. Such a log we called a weakly complete log and we marked it with
Lw [
6].
Although in such logs, based on footprints in the log, it cannot be concluded that →
Lw = →
BN (but →
Lw ⊂ →
BN, instead), the elements of the causality relation that are not in →
Lw but are found in →
BN can be subsequently inferred from the footprint of the log. These elements form the causality relation we called inferred causality relation, and we marked it with →
i. The causality relation that inserted the final appearance of the log footprint (denoted with →
Lf), and on which the α
||-algorithm is applied, becomes: →
Lf = →
Lw ∪ →
i, which gives that →
Lf = →
BN. Finding the footprint causality relation →
Lf that is equal to the basic causal relation →
BN is a sufficient condition for discovering a process model based on →
Lf using the α
||-algorithm, as it was shown in a concrete example in [
6].
2.2. The Dangling Nodes Problem
A network obtained from a weakly complete log often contains dangling nodes, i.e., activities (nodes in the Petri net [
4]) without predecessors and/or successors. The definition of a WF-net [
5] includes an assumption of network connectivity, which means connectivity of all nodes in the network, and which prohibits the existence of dangling nodes. In an attempt to overcome the problem of dangling nodes, we observed the relations in footprints, and based on these, we have defined the rules of inference of direct from indirect successors and predecessors. Thus, for each activity that is a dangling node, a successor and/or predecessor can be found [
6].
A network obtained based on a weakly complete event log that contains dangling nodes has at least one activity in the event log footprint that in its table row does not have the relation → (if the activity has no successor) or relation ← (if the activity has no predecessor) [
6]. Let
a,
b, and
c be the activities of the observed process, then, in the case of dangling nodes, the following rules apply:
Rule 1. (Determining the inferred causality relation →i when activity has no successor) Let a be an activity which in its log footprint row has no relation →; then, by definition: a →i c iff a ⇒ c and there is b such that b → c, where a||b.
Rule 2. (Determining the inferred causality relation ←i when activity has no predecessor) Let a be an activity which in its log footprint row has no relation ←; then, by definition: a←i c iff a ⇐ c and there is b such that b ← c, where a||b.
2.3. Elements of Automatic Inference
The basic idea of applying the PBD paradigm in this paper is that the user performs possible scenarios of executed activities of a business process and according to this performance, the system generates the process model which will be in accordance with all demonstrated scenarios of process execution. For this purpose, a graphical user interface has been created, which enables the user to perform different scenarios of activity using direct manipulation. The created graphical user interface is accessible at [
25].
The system contains some of the components of artificial intelligence which are reflected in the fact that the system itself suggests the order of process activity performance (in order to discover the process model as soon as possible). In addition, the system ‘‘infers” some relations between the activities that have not been performed during the demonstration procedure.
In addition to recording relations which are demonstrated by the user, the system concludes certain relations in order to generalize them by using heuristics and specific rules, although those relations were not performed and therefore cannot be seen in the demonstrated event log. In order to find and infer relations that have not been performed (inferred relations), the system uses the event log footprint and Rule 1 and Rule 2, in a manner described in
Section 2.2. The system’s capability to infer relations among activities that are not recorded in the event log during the demonstration allows the system to generate the model of the performed process based on a very small number of traces in the event log. This statement was confirmed by the results of the conducted experimental analysis that will be presented later in this paper.
The system itself largely influences the size of the event log, i.e., the number of recorded traces necessary for generating the final process model. The system suggests to the user the order of performing process activities. This way, the system “leads’’ the user to perform the scenario of process execution that would provide the most useful information for generalization of the process model specification. For the choice of the order of activities that the system suggests to the user, it is important that the system can infer causal relations →
i (←
i). According to Definition 1 [
6] and Definition 4 [
7], respectively, it can be discovered on the basis of relations of indirection ⇒ (⇐). The system therefore “knows” that the scenario of process execution in which the largest number of relations of indirection (parallelism) occurs will be of most use for generalization of process model specification. Тhat will be the scenario in which the activities are to be performed in a reversed order with regard to the last performed scenario. By such a principle, a large number of parallel activities that can be performed in a mutually independent order will replace the performed order in the next scenario. This will make it possible to determine parallel relationships between them, as required by the modified PM technique. Following this principle further, the system can very quickly detect all parallel relations in the model, as well as causal relations, either from the records themselves, or by following Rules 1 and 2 for finding causal relations for the dangling nodes. This way, the system can quickly discover the basic causal relation →
BN and therefore the final model of the demonstrated process.
The system influences user performance in one more way, all with the objective of discovering the process model from the smallest possible number of performed scenarios. Namely, the system uses different colors to mark the performed scenarios of process execution depending on whether the scenario has provided some new information for obtaining the process model or not. Therefore, green marks the scenarios whose performance led to changes in the process model, and red marks the repeated scenarios. The appearance of red on the screen leads the user to step away from the suggested order and perform a scenario that is different to the previous ones. It is then up to the user to provide more useful information, which is explained in detail in the following description of the demonstration procedure. In that way, by using heuristics and inference, the system influences the user’s performance and therefore the obtained results.
3. Interactive Model Generation
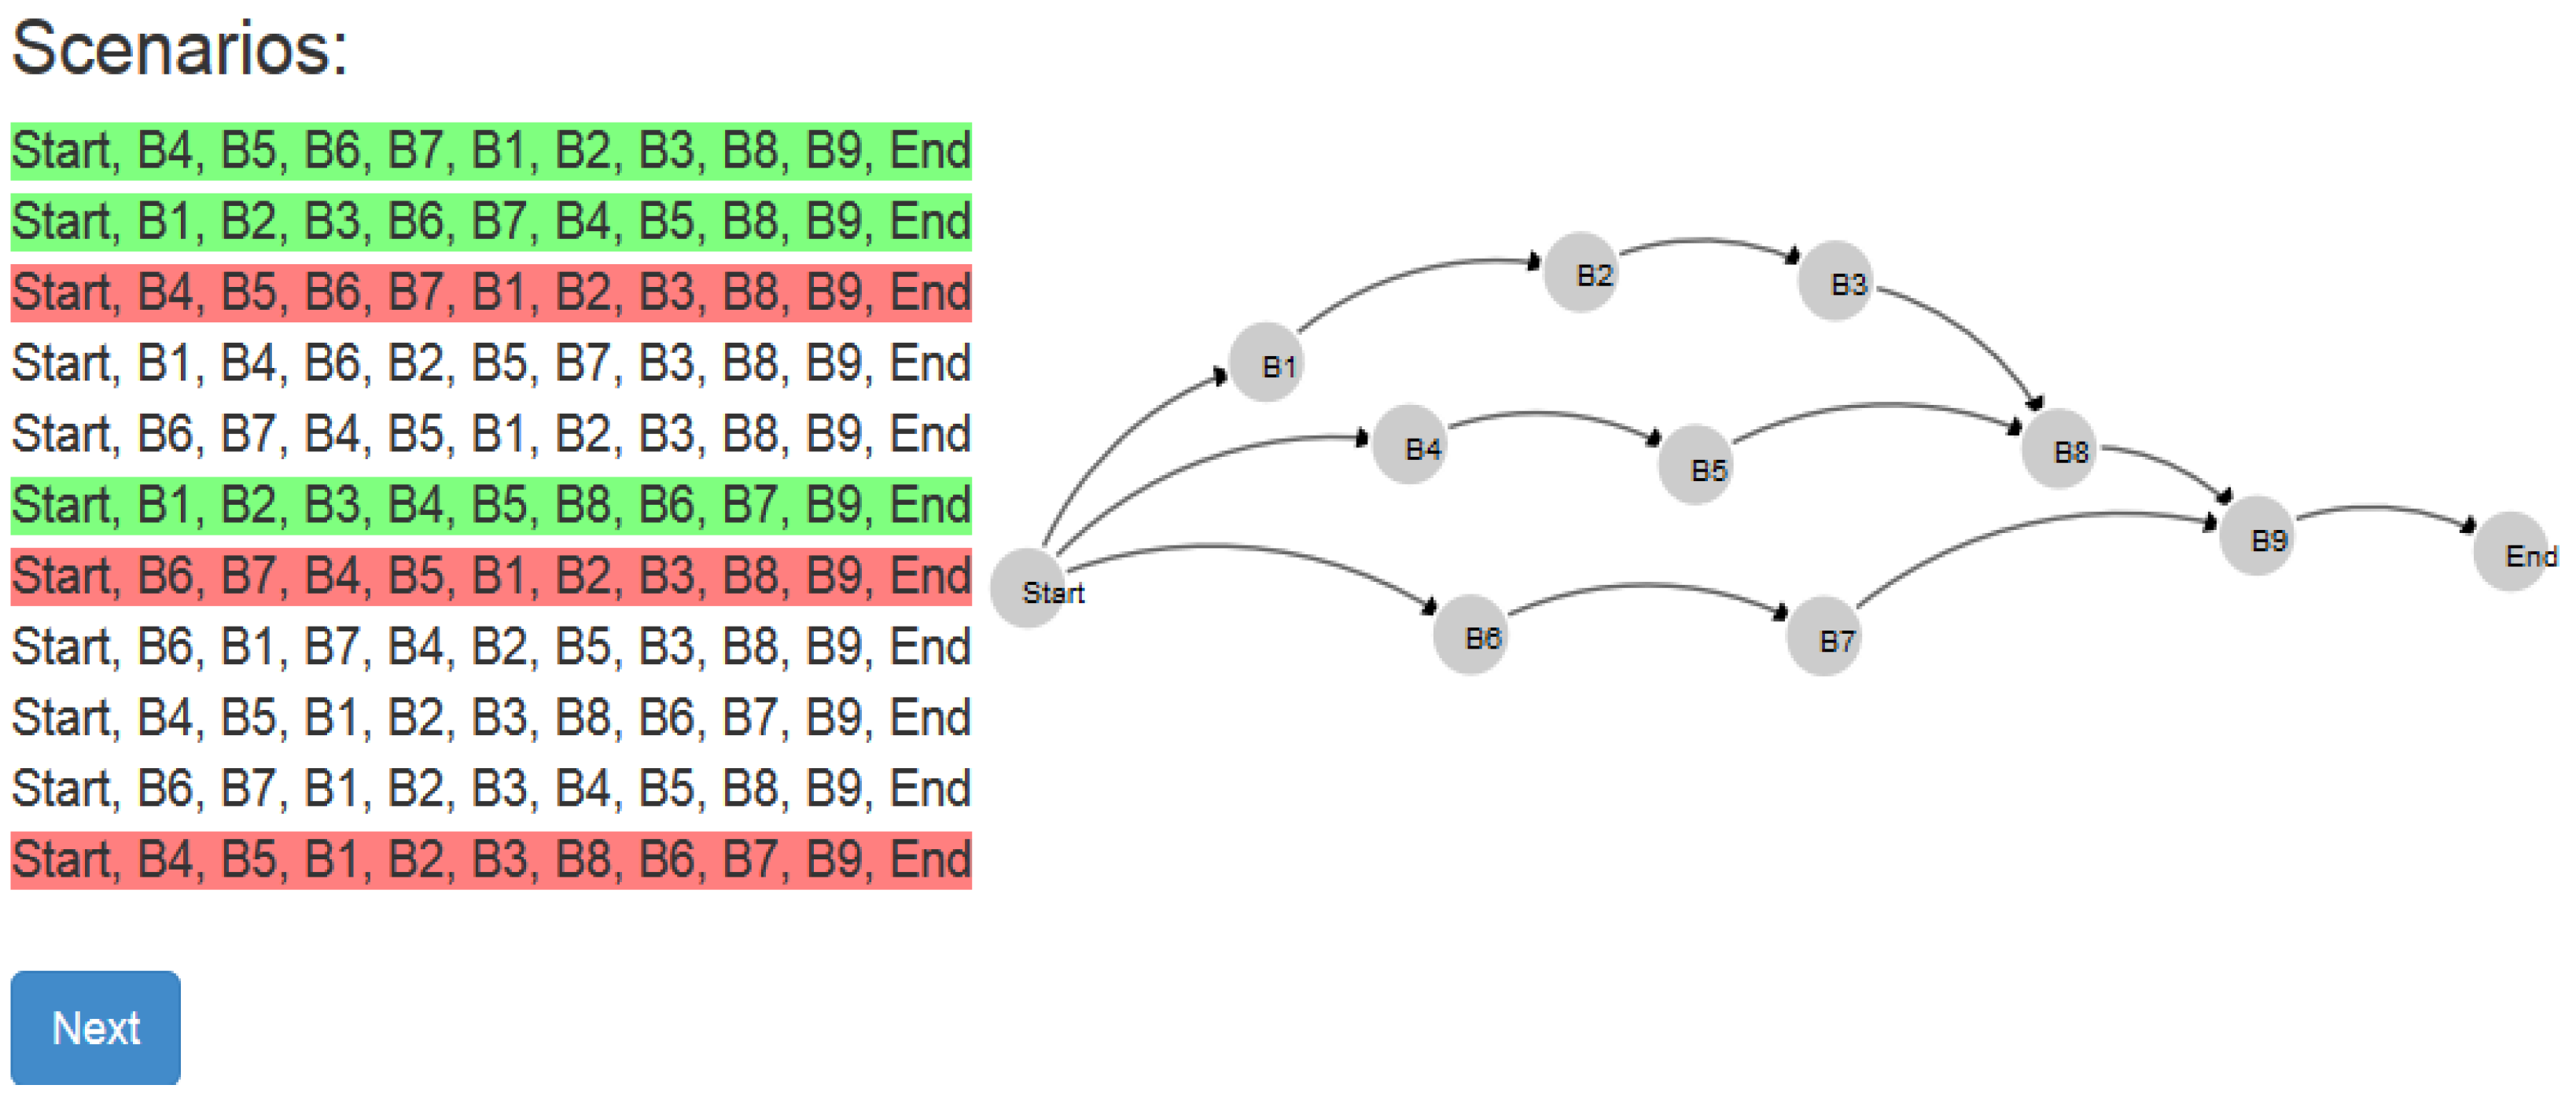
The process of demonstration and parallel business process model creation will be shown in the example of the process shown in
Figure 1, which represents our running example in this paper (branches represent forks of parallel execution). This process example was found by internet search and is located at [
26].
By starting the program [
25], the screen provides a space for entering one possible sequence of business process activities whose model is being created, as shown in
Figure 2.
In the initial layout of the graphical user interface, the activities that are performed the first and the last during the execution of the process are entered in the first and the last place, respectively. This is consistent with the requirement for block-structured parallel processes to have one input and one output activity [
7]. All other process activities can be entered in an arbitrary order independent of the order in which they are executed, only as a list of activities. One possible order of insertion of the process activities from
Figure 1 is shown in
Figure 3.
By pressing
Continue, the sequence of activities proposed by the next-to-perform system (from left to right) appears on the screen, which is the same as the order of the initial entry of the activities (
Figure 4). As with block-structured parallel processes, there is one input and one output activity, the system will always include the first and the last process activity in the order of play, according to how they are entered the first time.
By pressing the sequence of activities from the offered order, the user creates a scenario for execution of the process activity (
Figure 5). The choice of the order of execution of activities in the first scenario by the user is completely free (except for the first and last activity) and can be independent of the proposed order. By pressing the
Undo key, the previous activity selection can be eliminated.
After the completion of the first scenario of process execution, the screen shows it and the process model which is obtained based on the performed scenario, which represents a candidate model (
Figure 6). The green color that marks the scenario means that the performance of this scenario led to a change in the model, which is expected, considering that this is the first scenario and the first candidate model.
By pressing
Next, as in
Figure 6, the screen shows the order of activities proposed by the system for performing in the next scenario (
Figure 7).
For the next performance, the system actually suggests performing the activities in an order reversed from the last performance. The user’s task is furthermore to follow the next rule of activity selection from the order proposed by the system:
From the proposed order of activities, always select the first activity (from left to right) whose execution is possible, and so on, up to the last activity.
If the performance of the new scenario leads to a change in the model (as in this case), the scenario is marked green and a new candidate model process is obtained (
Figure 8) that supports both performed scenarios.
The procedure is continued by pressing the
Next button, after which the user performs the next scenario by following the above rule of selecting the activities from the order proposed by the system. If one of the already performed scenarios is repeated during demonstration, the repeated scenario will be highlighted in red (
Figure 9). Due to the fact that the candidate model corresponds to all performed scenarios, the repeated scenario does not lead to any changes in the model.
Repetition of the scenario means that, by following the mentioned rule of selection of activities from the proposed order, the other scenarios will be repeated as well, which can lead to the prevention of some other scenarios. Consequently, this would lead to the inability to detect any other candidate model which they correspond to. Therefore, the appearance of a repeated scenario suggests the user not to follow the mentioned rule of selection of activities from the proposed order in the next demonstration, but to perform the scenario of his choice (if possible, different from those he already performed), as shown in
Figure 10.
Then, the procedure continues with following the rules of selecting activities from the proposed order until a new occurrence of the repeated scenario (marked in red), when we deviate from the rule and continue in the before-mentioned way. If some of the played scenarios in this procedure lead to a change in the model, it will be marked in green, and a new candidate model will be obtained, as shown in
Figure 11.
The described demonstration procedure suggests the user to perform as many different scenarios of process execution as possible, in order to create the final process model. However, the fact that many scenarios were performed, whether different or repeated, does not mean that they will certainly lead to some changes in the model (
Figure 12).
By using the described demonstration procedure, in the majority of cases examined, the first appearance of the repeated scenario means that the performance of all the following scenarios will not lead to a change in the model, that is, the last obtained candidate model is in fact the final model of the process as well, which will be discussed later.
During the demonstration, after each performed scenario, all relations defined in the modified PM technique (Definition 1 [
6], Definition 4 [
7]) appeared on the screen (
Figure 13), as well as the footprint of the event log from which the relationships were established (
Figure 14), obtained on the basis of all the scenarios performed.
Figure 13 shows the layout of the relationships that were obtained after two played scenarios of execution of the observed process, shown in
Figure 8. In addition to the relations defined by the modified PM technique, the layout showed:
NO_DIRECT →—activities which do not have a direct successor,
NO_DIRECT →—activities which do not have a direct predecessor,
INFERRED → i, INFERRED ←i—causality relations that have not been revealed on the basis of the scenarios performed, but have been subsequently concluded from the event log using Rule 1 or Rule 2, for the activities that do not have a direct successor or predecessor, respectively.
Figure 14 shows the layout of the event log footprint after the two performed scenarios of execution of the observed process, shown in
Figure 8. In addition to other relations of the modified PM technique obtained based on the scenarios, the causal relations obtained either on the basis of performed scenarios or concluded by the application of Rule 1 and Rule 2 are given in the event log footprint, i.e., causal relations given in INFERRED, marked with →
i and ←
i.
4. Results
Our experimental analysis was performed on a sample of 100 real examples obtained by arbitrary manual search of the Internet and selecting publicly available models of business processes (or models similar to them), which fulfill our conditions of block-structured models of parallel processes [
7]. Note that the models were found by searching the Web for the keywords: block-structured parallel process, parallel business process, activity diagram, BPMN diagrams, etc.The considered examples can be found at [
26].
Some characteristics that reflect the network structure and size of the analyzed examples are given in Tables 2 and 3 in [
7]. These characteristics are expressed by the total number of activities in the network and a number of branches in the network. As with block-structured parallel processes, there is one input and one output, and it can be presented by the structure of a tree [
7], with ‘‘branch’’ meaning a direct route from the entrance to the exit of the network. In the example presented in
Figure 1, there are three branches with activities:
- -
B1-B2-B3-B8-B9,
- -
B4-B5-B8-B9 and
- -
B6-B7-B9.
The experimental analysis consisted of multiple different executions of process activities given at [
26], tracking the results obtained by these executions, and making conclusions based on the results obtained. In the case of multiple different executions of the considered parallel process, it was noticed that after the set of performed scenarios, the candidate model no longer changed. This, in fact, means that the last obtained candidate model, in addition to the performed scenarios of process execution, also supported the scenarios that could eventually be performed by the observed process. This way, the last obtained candidate model becomes the final model of the process.
It was of particular interest to consider after how many scenarios could the final model be achieved, and on what this depends. Namely, multiple different executions of the same process indicate that the final model of the observed process does not always occur after the same number of scenarios played. The obtained results showed that the number of execution scenarios necessary for obtaining the final model depends, quite expectedly, on the order of activities in the first scenario, given the structure of the network. We came to the conclusion that the necessary number of scenarios played depends on whether all activities belonging to one branch are successively performed. In this regard, we adopted two different strategies according to which we performed the processes from the sample and followed the results obtained:
Strategy 1. (Depth-first) In the first performed scenario, the execution order of activities is such that all the activities of one branch are executed first, then, all the activities of the other branch that are parallel to the previous one, and so on, until all activities from all parallel branches are executed.
Strategy 2. (Breath-first) In the first performed scenario, the order of execution of activities is such that activities from different parallel branches are alternately executed.
Strategy 1
By applying Strategy 1, the results obtained from the experimental analysis showed that in 99 examples (out of the total of 100 examples), the final model was always obtained after only two different performed scenarios (marked in green). This means that the first appearance of the repeated scenario (marked in red) was an indication that the obtained candidate model was actually the final model as well. In only one case, it was necessary to proceed with the procedure given in the description of the demonstration flow after the first appearance of the repeated scenario in order to achieve the final model.
The demonstrative example shown in
Figure 1 can also be obtained after only two different scenarios performed if we adhere to Strategy 1 when performing the first scenario, as shown in
Figure 15.
Figure 15 shows that the appearance of the first repeated scenario (marked in red) indicates that the final model of the considered process has been discovered. It can also be seen from
Figure 15 that the appearance of the final model of the considered process is the same as the model shown in
Figure 12, although different scenarios for obtaining them was necessary.
Strategy 2
By applying Strategy 2, the obtained results of the conducted experimental analysis showed that in 88 examples (out of the total of 100 examples), the final model of the process was always obtained after only three different successively performed scenarios (marked in green). This means that the first appearance of the repeated scenario (marked in red) is an indication that the candidate model is in fact the final process model as well. In 12 cases, it was necessary to proceed with the procedure given in the description of the demonstration flow after the first appearance of the repeated scenario in order to reach the final process model. The total number of performed scenarios necessary for obtaining the final model in these 12 process examples depended on randomly performing the scenarios by a user in the described procedure, ranging from five to more scenarios.
As it can be seen from the demonstration procedure shown, when the demonstration example of the process shown in
Figure 1 is executed according to Strategy 2, the appearance of the first repeated scenario is not an indication that the final model is discovered. Only after the sixth scenario was performed, the appearance of the second repeated scenario meant that the final model of the considered process was discovered. That means that the example of the process from
Figure 1 belongs to a group of 12 examples of the processes from the experimental analysis executed by the application of Strategy 2, where it was necessary to perform more different scenarios of process execution in order to obtain the final process model after obtaining the first repeated scenario.
Thus, the results of the experimental analysis performed on 100 examples of parallel business processes have shown the following:
- -
Using Strategy 1, in 99% of the considered examples, the final model was obtained upon the occurrence of the first repeated scenario of process execution, which happens after two performed scenarios,
- -
Using Strategy 2, in 88% of the considered examples, the final model was obtained upon the occurrence of the first repeated scenario of process execution, which happens after three performed scenarios.
It can be concluded that the final model of a parallel business process whose execution is demonstrated can occur after a very small number of performed scenarios (usually 2 or 3 scenarios). In addition, the obtained model (candidate model) correctly reflects the structure and behavior expressed by all previously demonstrated scenarios at any time.
5. Discussion
Although both use an interactive process mining approach and represent tools that visually show process models obtained from event logs, ProcessExplorer [
11,
12] and our graphical user interface are substantially different. ProcessExplorer uses existing event logs from which it separates subsets of interesting cases that follow a certain behavioral pattern. This provides recommendations to analysts on how to select a subset of cases and what statistics may be interesting and insightful. Our graphical user interface does not use existing event logs, but instead it allows interactive log creation by the user. During the procedure of event log creation, our system guides the user how to select activities and thus creates traces that will give the most useful information to the system for process model generating. As a consequence, process models are generated on the basis of event logs with a very small number of traces. The user interface of ProcessExplorer shows the subset and insights recommendations, the process map of the selected subset, the stage view, and the subset statistics. Our user interface shows a generated process model, event log with played scenarios, as well as relations between activities and footprint relations interpreted by the system based on the created event log. One of the common characteristics might be that both tools deal with a problem of big event logs, but in their own ways: ProcessExplorer does it by simplifying their analysis, whereas our system does it by guiding towards event log generating with a small number of traces.
Cervantes et al. [
13] approached the problem of representing differences between graphs and processes models by using color-coding of differences in a merged graph for the visualization of differences. In our tool, color-coding was used for marking different properties of traces (scenarios) in event logs. The color of a scenario is of essential importance to the system for process model generation, since the user, when creating the next scenario, makes a decision based on the color of the previously executed scenario. In the approach presented in [
13], there is an interactive business process model repair based on visual guidance, whereas in our tool, visual guidance is used to create an event log and the process model from the created log. Cervantes et al. have implemented their approach as part of the OSGi plugin Compare [
27] for the Apromore online process analytics platform [
28].
A concept of interactive modeling of a process model based on interactive editing engine is presented in [
14]. It allows editing of process models in an incremental and structured manner [
29]. In that approach, labeled free-choice workflow net [
19], in combination with the rules of synthesis, is used to represent process models. The proposed synthesis engine enables the user to make decisions using the information from the event logs. These decisions are related to the location in the process model where the user should define the place of an activity. The user is offered multiple automatically generated recommendations for positioning an activity in the process model. Each recommendation contains information on the rank, fitness, and precision of the interactively generated model for a position of an activity in network. This guides the user through the impact of each recommendation. Similarly, our tool also provides recommendations to the user, not about the selection of activity positioning in the network, but about activity positioning in the scenario, i.e., event log trace.
During interactive modeling of a process model based on the proposed synthesis engine, the user enters one activity at a time into the network according to recommendations given in the recommendations table, which is automatically created for each activity. Recommendations in our tool is given in the form of serial of marked activity boxes, according to the recommended order of implementation. In the procedure of interactive modeling in [
14], marking of activities, presented as nodes in the network, plays a very significant role. The user can select as the input a node colored in red and select one of the possible output nodes colored in green. Blue colored places indicate candidate transitions with multiple outputs for the selected input place. The purple (yellow) color indicates the degree to which the selected activity occurs after (before) the activity represented by the transition. Whenever the user chooses a recommendation, the labeled free-choice workflow net in the process model view is updated by placing the new activity in the net based on the recommendation.
Although incremental processing is an important characteristic of both approaches, it refers to different things in these approaches. In the approach shown in [
14], the process model is expanded incrementally by adding one activity at a time until all activities are added to the network when the final model is obtained. In our approach, the final model is obtained incrementally by playing new scenarios, i.e., by adding new traces to the event log. In this way, the final model is obtained after a series of incremental models that represent candidate models.
Although there is overlapping of ideas, the principles and presentation are different. Perhaps one of the greatest differences is that all the mentioned approaches use already created logs and draw various information from them on the basis of which the user could interactively create a model that would better reflect the actual behavior of the process; only in our approach, the user creates event logs. In this way, the user influences the display of process behavior, where the coherence of the displayed behavior and the process model is absolute. However, the greatest difference is that we have dealt with a special category of processes—block-structured parallel business processes, which reduces the overall applicability, and which we will try to overcome in the future.
The purpose of a tool such as the one we presented would be to incrementally generate a business process model that would allow evolutionary development of the model with each new order of execution of process activities that is not supported by the previous model. This would allow greater flexibility of the system for changes in the order of execution of activities and thus finding better relationships between activities.
6. Conclusions
The paper has presented the use of elements of programming by demonstration in the area of process mining for the interactive and incremental model construction of block-structured parallel business processes. The idea was that the user performs possible scenarios of business process activity execution, and that the system generates a process model (candidate model) based on this execution, which would correspond to the demonstrated process execution. In addition, the goal was also to provide, on the basis of demonstrated behavior, a generalized specification of the process model (final model) that would correspond to the desired behavior. The problem of noncompliance between the model and the actual system behavior that is evident in handmade models was overcome by the interactive creation of the process model. The special advantage of the presented way of model creation is that the last created model always supports all the previously performed scenarios, so that it is always a valid model for the presented system’s behavior. That provides a large number of possibilities for modification and expansion of the system, since the model always adapts to each newly performed scenario.
To accomplish our goal, a graphical user interface was created, through which the user demonstrates different scenarios of process execution. In realization of the idea of generating the parallel business process model based on the demonstrated scenarios, the ability of the system to use heuristics and the possibility of inferring the nonperformed relations between the activities is of key importance.
The paper could potentially have several contributions. The first could be in describing a tool that visually shows steps of the α||-algorithm. Such a tool could serve as a learning tool and playground for those who want to learn more about how the much better-known and more general α-algorithm functions.
The second contribution is related to the experimental analysis shown in the paper in order to find how many log entries should be used to obtain a model that is the same as the original model, which would lead to fast discovery of processes. The results of the experimental analysis showed that a very small number of log entries was required, which makes those event logs (weakly complete event logs) very small. This proves the assertion made in [
6] that weakly complete event logs can be significantly smaller than complete event logs used by the
α-algorithm.
The third contribution is the incremental generation of the process model achieved through the principle of generating a candidate model that supports all played scenarios (traces in the event log). This enables the evolutionary development of the process model in accordance with the changes in the behavior of the process recorded in the event log. In this way, it is possible to smoothly upgrade the process with new relationships between activities and adapt the model to these presented new relationships.
The research presented in this paper was focused on a specific class of business processes, which is block-structured parallel business processes. Our future work will be focused on finding the possibility of expanding the idea of creating a process model through demonstration and achieving it for any type of process. This will bring us back to process mining, where we will try to find an algorithm and event logs that would allow us to get similar effects with any type of process. The graphical user interface could then be modified in accordance with the results obtained.

