Article

Stress–Strain Strength Characteristics of Undisturbed Granite Residual Soil Considering Different Patterns of Variation of Mean Effective Stress

1
State Key Laboratory of Geomechanics and Geotechnical Engineering, Institute of Rock and Soil Mechanics, Chinese Academy of Sciences, Wuhan 430071, China
2
School of Engineering Science, University of Chinese Academy of Sciences, Beijing 100049, China
*
Author to whom correspondence should be addressed.
Appl. Sci. 2021, 11(4), 1874; https://doi.org/10.3390/app11041874
Submission received: 19 January 2021 / Revised: 15 February 2021 / Accepted: 19 February 2021 / Published: 20 February 2021
(This article belongs to the Section Civil Engineering)

Abstract

:
Granite residual soil is one of the most frequently encountered problem soils in tropical regions, whose mechanical behavior heavily depends on the pattern of variation of mean effective stress (p’) during shearing, which can be classified into three categories: increasing-p’, constant-p’, and decreasing-p’. Unfortunately, so far, the stress–strain strength characteristics of granite residual soils have been studied mainly under increasing-p’ stress paths, although it is very likely to encounter stress paths with decreasing p’ in practice, especially in excavation engineering. Moreover, most pertinent research has focused on remolded granite residual soils, whereas undisturbed specimens have not yet received enough attention. In this paper, stress path triaxial tests considering different patterns of variation of mean effective stress were conducted on an undisturbed granite residual soil. Subsequently, a variable termed loading angle was introduced to quantitatively represent stress path. The influences of stress path on the Mohr–Coulomb strength parameters, deformation characteristics, ductility, and shearing stiffness were analyzed, with an emphasis on the role of pattern of variation of mean effective stress. The experimental results show that friction angle of the soil increases while cohesion decreases with the increase in loading angle. The increase in loading angle leads to less volume contraction and smaller failure strain. During shearing, the soil exhibited a less brittle response under stress paths with smaller loading angles. The initial secant shear modulus first decreased and then increased as the loading angle increased, with the minimum shearing stiffness occurring at a certain loading angle lying between 90° and 123.7°.

1. Introduction

As the product of the weathering of parent rocks, granite residual soils are widely distributed in the tropics and subtropics, including some developed regions such as Singapore, Hong Kong, and the southeast coastal areas of China [1,2,3]. In the past few decades, with the rapid development of the economy and the continuous advancement of urbanization in these regions, granite residual soils have been encountered more and more frequently in geotechnical engineering projects such as the excavation of foundation pits and subway tunnels [4,5,6,7]. Moreover, granite residual soils are also frequently-used building materials, utilized for the filling of embankments and dams [3,8]. As a result, granite residual soils have attracted considerable attention from many scholars. Many aspects of granite residual soils have been studied, including the engineering geological characteristics [2,9], index properties [10,11], mechanical properties [8,12,13,14], heterogeneity [15,16,17,18] (soil properties vary vertically and horizontally due to the variable degree of weathering), small strain stiffness [19,20], unsaturated soil behavior [21,22,23,24,25], and the in situ measurement of soil properties [26,27,28,29]. It is generally recognized that granite residual soils have unusual grain size distributions from gravel to clay [2,30]. Another two typical features of granite residual soils are the degradation of soil properties when soaked [31] and the heterogeneous nature [17], both making it hard to predict engineering behavior of the soils. Due to the special microstructures developed in the process of weathering, granite residual soils exhibit quite different engineering properties from those of sedimentary soils [32], and are generally considered as problem soils [33,34].
In geotechnical engineering, the stress paths experienced by soil elements are diverse and can be very complicated [35], causing various possible patterns of variation of mean effective stress (p’), which can be roughly classified into three categories: increasing-p’, constant-p’, and decreasing-p’. It is widely known that during excavation of a foundation pit, stress paths experienced by soil elements in different positions of the foundation pit are quite different [36], as shown in Figure 1. Different from the stress path of conventional triaxial tests (constant σ3 and increasing σ1), soil elements in the side of pits experience stress paths with decreasing σ3 and constant σ1, while σ3 remains constant and σ1 decreases for soil elements in the bottom. It is obvious that both soil elements in the bottom and the side of the pit experience decreasing-p’ stress paths. Therefore, prior to the design of retaining structures and the prediction of deformation for a foundation pit, the mechanical behavior of soil under decreasing-p’ stress paths must be sufficiently studied [37].
However, to the best of the authors’ knowledge, in most of reported experimental studies concerning granite residual soils [3,14,38,39], soil specimens were sheared using the conventional stress path with constant σ3 and increasing σ1 in triaxial tests, in which case soil elements experience an increasing-p’ stress path. Although some scholars investigated the mechanical behaviors of decomposed granite under the stress paths of rainfall-induced slope failures [8,13], which are characterized by constant q and decreasing p’, soil behaviors under decreasing-p’ stress paths have not been systematically compared with those under increasing-p’ stress paths. Moreover, the effects of patterns of variation of mean effective stress on shearing strength and the stiffness of granite residual soils have not been evaluated quantitatively; it is hard to make practical suggestions for excavation engineering.
On the other hand, the residual cemented bonds, which are inherited from parent rocks, among particles making up the soil skeleton are believed to have a significant impact on the mechanical behavior of granite residual soils [40,41]. In fact, the mechanical properties of soil, such as anisotropy and path-dependent behavior, are undoubtedly the macroscopic manifestation of its internal evolving microstructure. Constitutive modelling of soil behavior with the influence of soil fabric addressed have been a concern of researchers in this field, and many works [42,43,44,45,46,47,48] have been reported so far. For example, in the framework of elasto-plasticity, some anisotropic models [46,48] were developed by introducing the concept of internal variable (usually in the form of tensor) which corresponds to soil fabric; the development of soil fabric is characterized by the evolution equation of fabric tensor (hardening rule). By introducing an analytical relationship between an elastic and a plastic fabric tensor, Amorosi et al. [49] proposed an approach for modeling elastic anisotropy and plastic anisotropy simultaneously. However, in reality, previous experimental research on granite residual soils has mainly focused on recompacted samples [3,8,23,24,50,51] whose natural structure had been destroyed during the preparation of soil specimens, making it necessary to proceed with experimental study and data accumulation for undisturbed granite residual soils (UGRSs).
In the context of excavation engineering, this paper aimed to study the effects of patterns of variation of mean effective stress on the mechanical behavior of UGRS, with attention focused on decreasing-p’ stress paths. To this end, anisotropic consolidation triaxial tests under five typical stress paths, covering three patterns of variation of mean effective stress: increasing-p’, constant-p’ and decreasing-p’, as well as the conventional triaxial tests, were conducted on UGRS sampled in Shenzhen, a major city in South China. During the analysis of test results, the stress path effects on shearing strength were analyzed in terms of the Mohr–Coulomb strength parameters, i.e., the cohesion and the friction angle. As for the deformation behavior, failure strain and volume change characteristics were discussed. Furthermore, quantitative investigation concerning the ductility and shearing stiffness of the soil was carried out. Finally, soil behaviors under increasing-p’ and decreasing-p’ stress paths were compared, and suggestions were proposed for excavation engineering, in which decreasing-p’ stress paths are inevitably encountered.

2. Materials and Methods

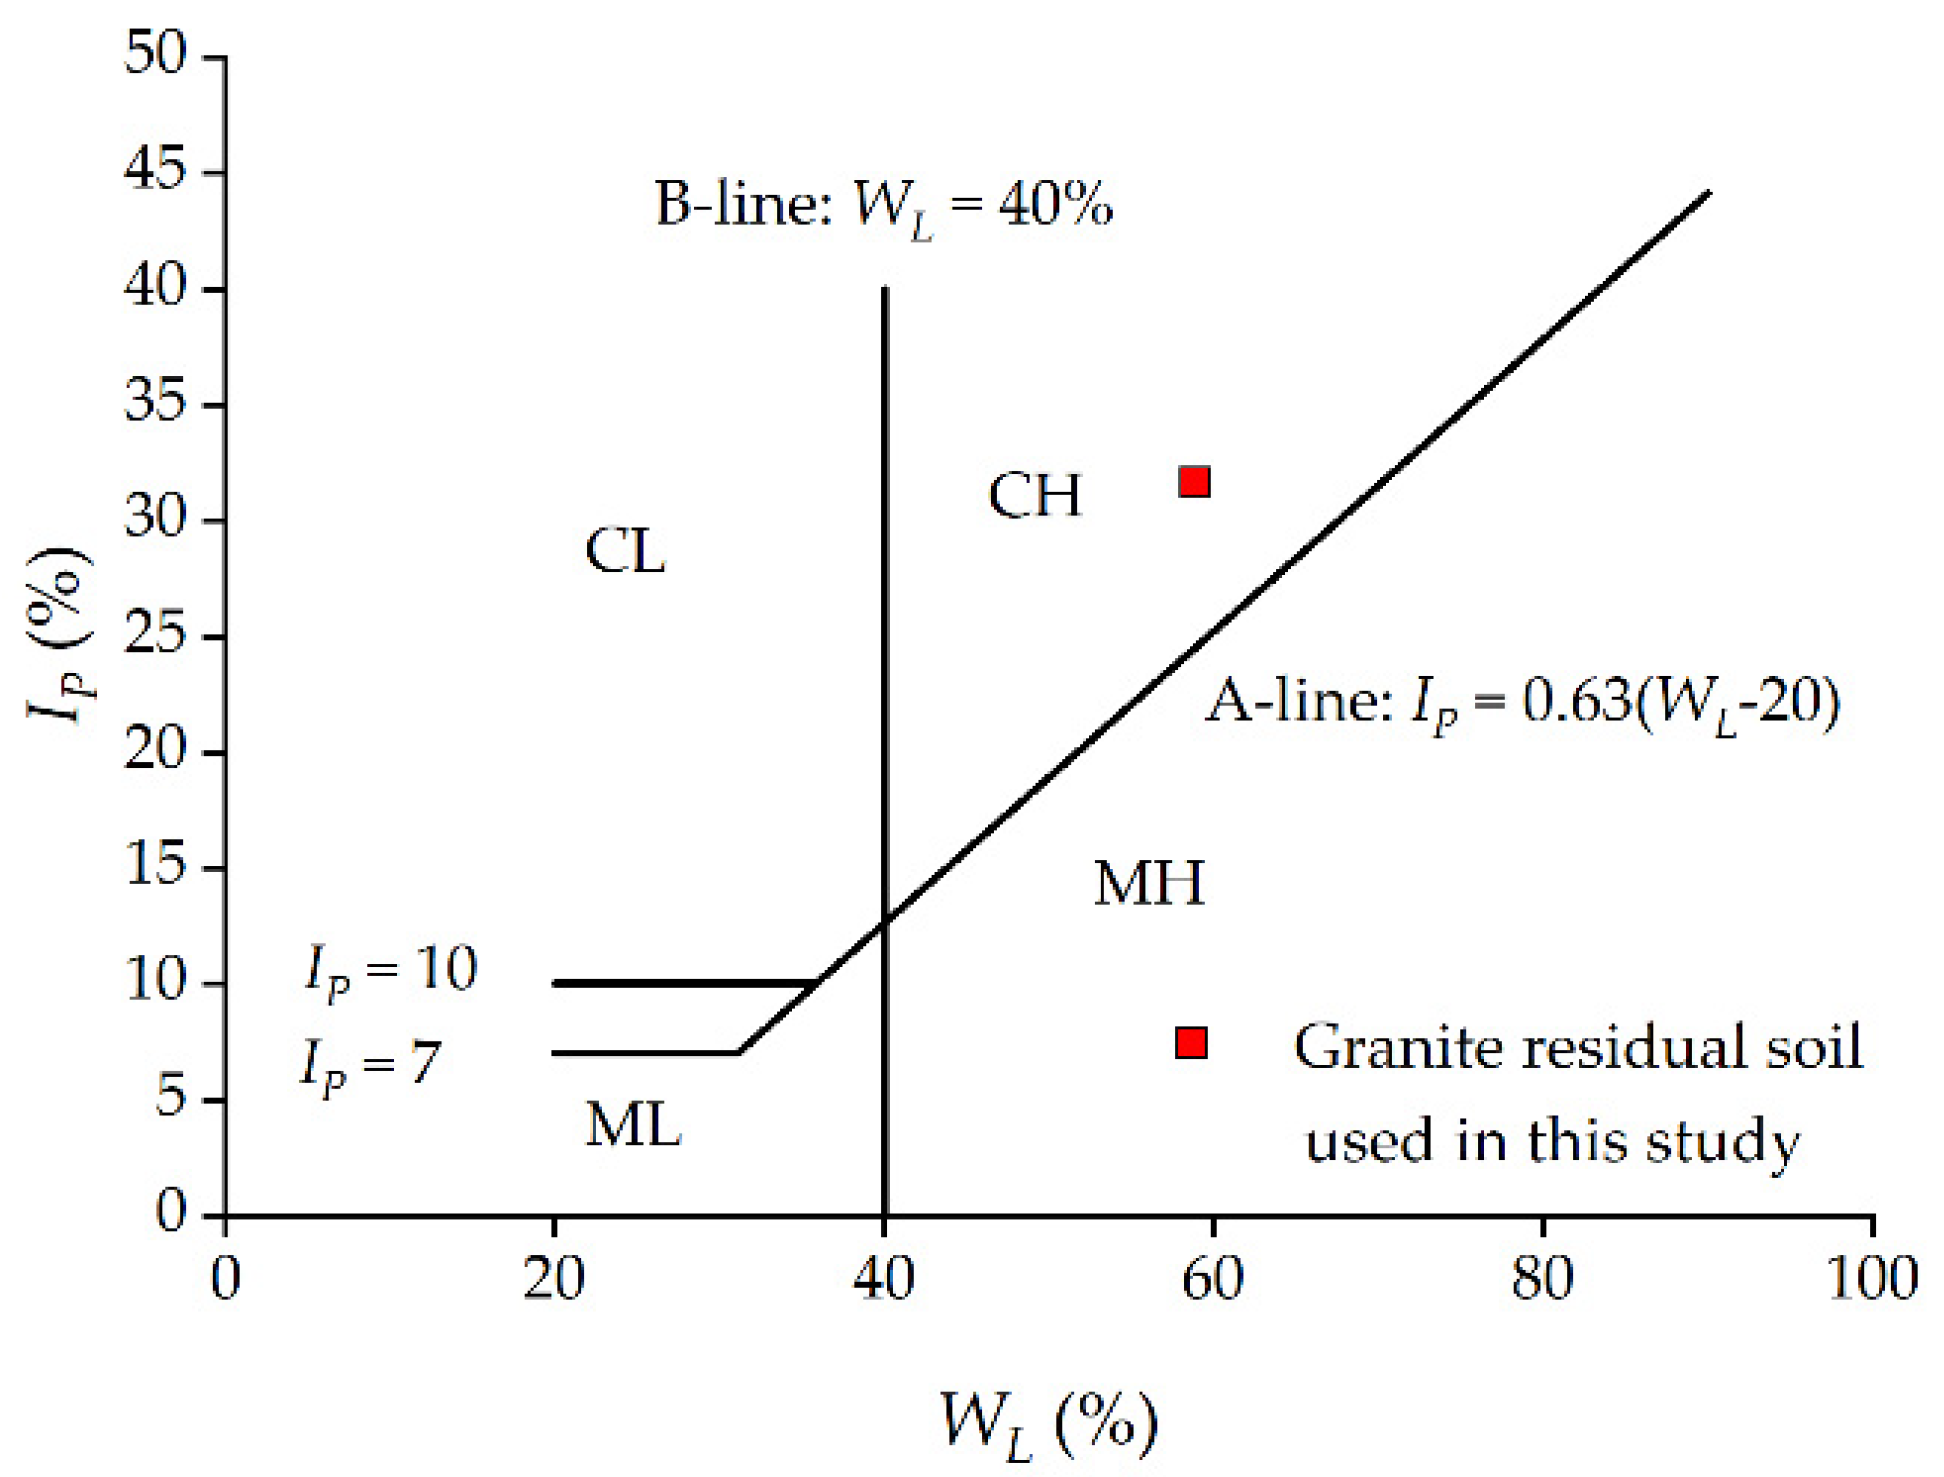
2.1. Materials and Specimen Preparation

The granite residual soils studied in this research were sampled from a foundation pit in Shenzhen city, Guangdong province, China. With a warm and humid climate, Shenzhen is a typical area of distribution of granite residual soils. To obtain undisturbed samples of high quality, a hand-carved block sampling method [52] was adopted. First, block samples with dimensions of about 30 × 30 × 30 cm3 were obtained using spades and knives. After that, soil samples were sealed immediately with plastic wrap and placed in wooden boxes padded with foam. Finally, the samples were transported to the storage room with a constant temperature of 20 °C and relative humidity of 98%. The fundamental physical properties of the granite residual soil were determined in a laboratory and are shown in Table 1. The natural water content, liquid limit, and plastic limit of the soil were 26.7%, 58.9%, and 27.3%, respectively. The mineral composition of the soil was obtained by X-ray diffraction analysis and the result is presented in Table 2. It can be seen that the soil studied mainly consisted of quartz and kaolinite. The grain size distribution curve of the soil was determined according to ASTM standard D422-63, 2007 [53]. As shown in Figure 2, the proportion of soil particles with grain size larger than 1 mm reached 32.4%, while the proportion of soil particles with grain size smaller than 0.075 mm was 48.7%. Soil particles with intermediate grain size are relatively few. This is consistent with the typical grading characteristics of granite residual soils [30]. Based on the position of the soil in the well-known Casagrande plasticity chart, as shown in Figure 3, the granite residual soil used in this study can be classified as clay with high plasticity.
Before testing, triaxial specimens of 50 mm in diameter and 100 mm in height were carefully trimmed from the block samples. The procedures of specimen preparation are as follows: first, in order to minimize the disturbance caused by trimming, a wire cutting machine was used to cut the original block sample into 18 blocks of smaller size. During this stage, the plastic wrap was kept confined to the block samples so they would not break into pieces; secondly, the smaller blocks were trimmed by hand with a knife and saw, to obtain nearly cylindrical specimens. Finally, with the help of a split cylinder mold, cylindrical specimens with required dimensions were obtained.

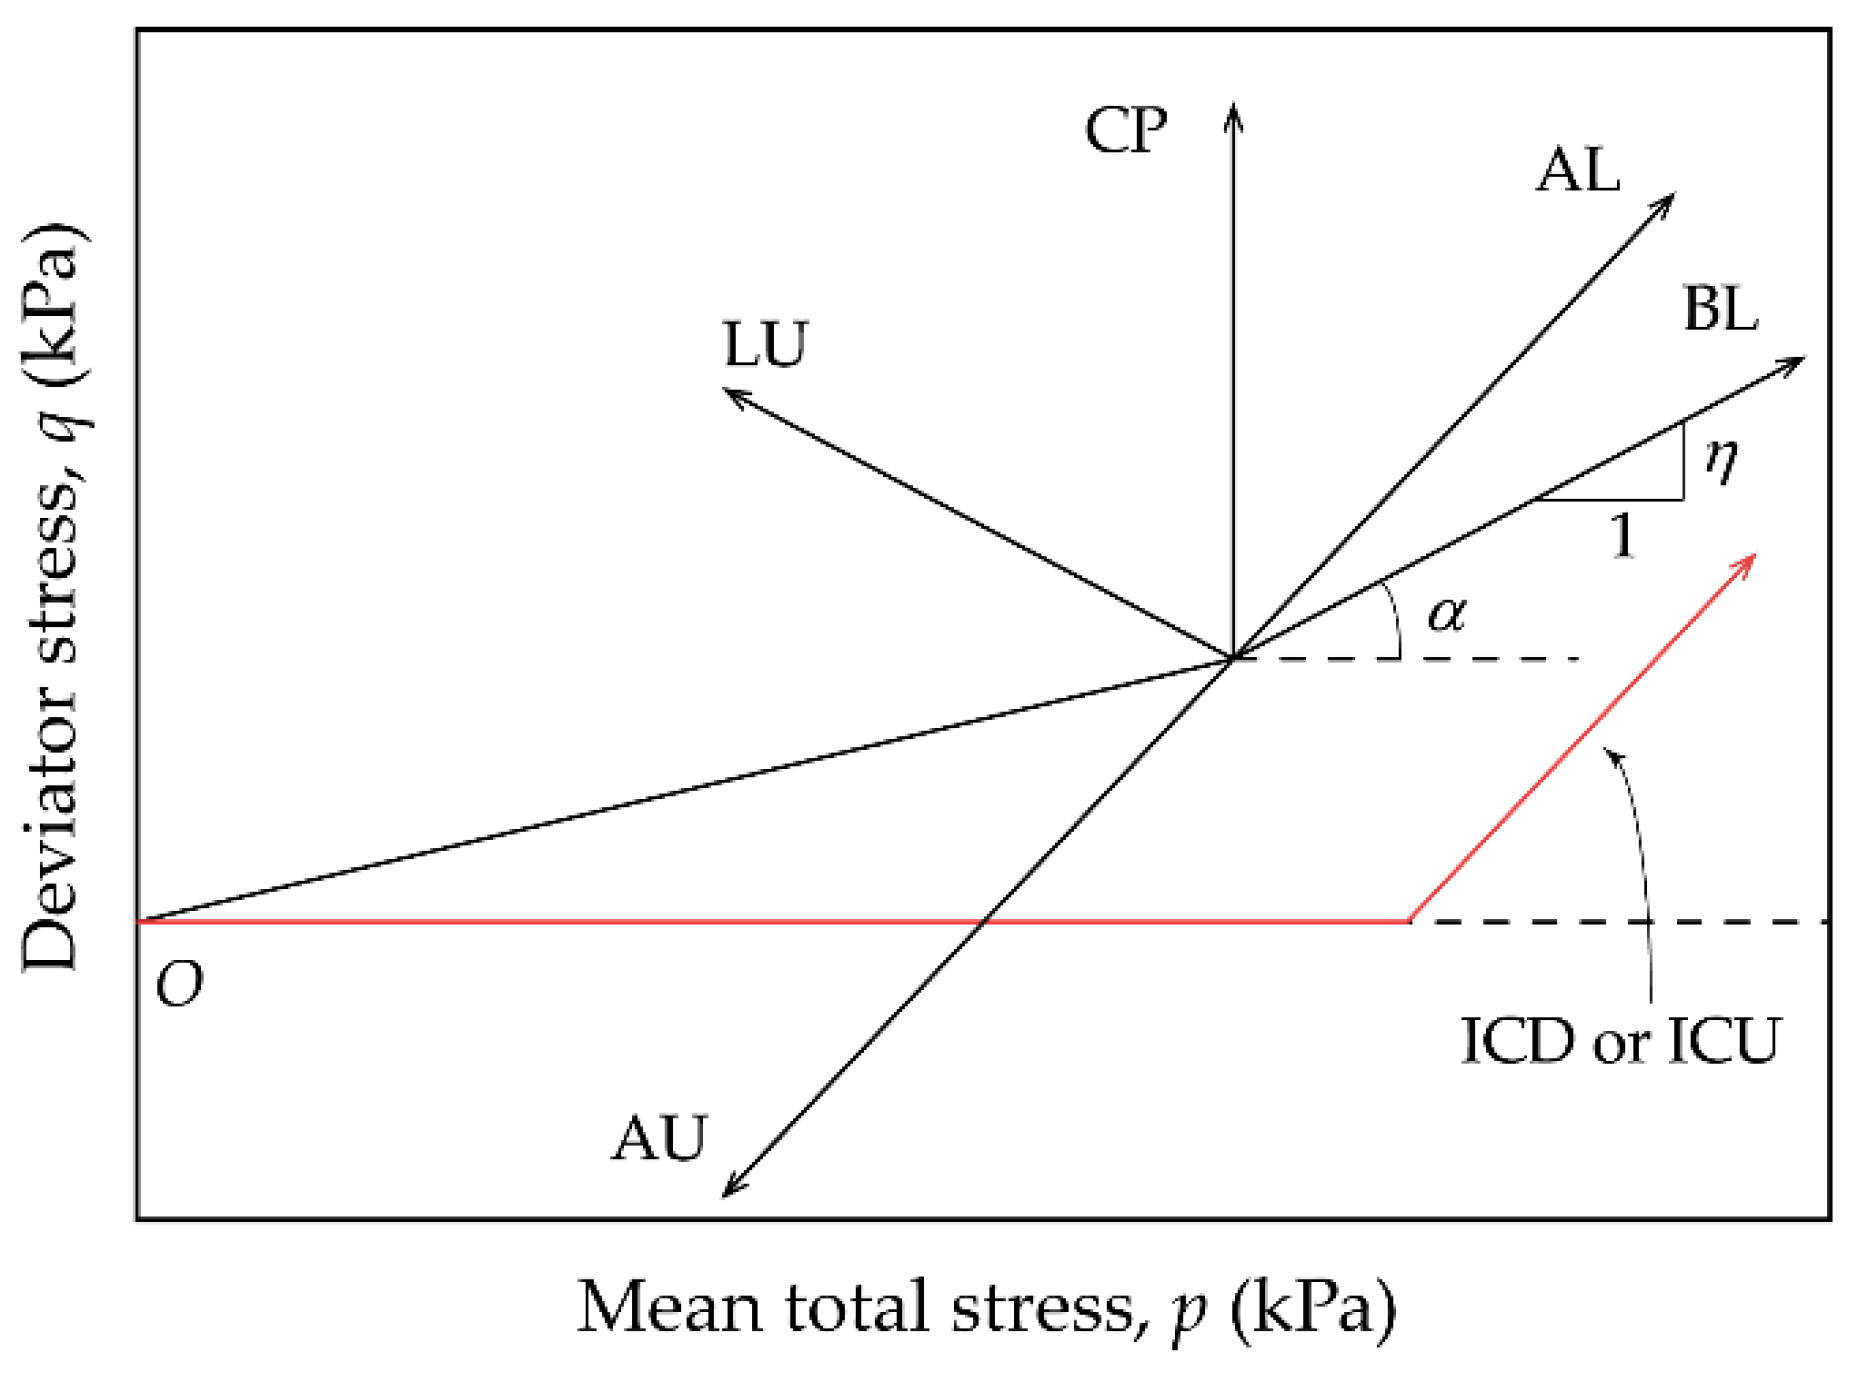
2.2. Test Program and Procedures

Two types of tests were conducted in this study, including (1) drained and undrained isotropic consolidation triaxial compression tests (ICTTs), and (2) stress path triaxial tests (SPTT). The test program is summarized in Table 3. The objective of the former is to investigate the fundamental mechanical properties for reference. The SPTT is aimed at studying the stress–strain strength behavior of the UGRS under different stress paths and different patterns of variation of mean effective stress. In order to obtain specimens with high saturation, the specimens were preliminarily saturated using a vacuum pump before being mounted onto the device. In addition, a back pressure of 200 kPa was applied to achieve a minimum B-value of 0.95.
In ICTTs, the specimens were consolidated isotropically under four different confining pressures (100, 200, 300 and 400 kPa). The consolidation stage was considered complete when the drainage rate of pore water was less than 1 mm3/min. Afterwards, the specimens were sheared under strain-controlled condition. The axial strain rates for drained (ICD) and undrained (ICU) tests were 0.005%/min and 0.05%/min, respectively. When the axial strain reached 20%, the tests were terminated.
In triaxial tests, soil specimens are under the condition of axisymmetric-loading, so the stress paths can be expressed in the pq space, where p denotes the mean total stress and q represents the deviator stress. All stress paths involved in this research are presented in Figure 4. Shearing stress ratio η and loading angle α were introduced to represent stress paths quantitatively, as shown in Figure 4. It is clear that η is the ratio of the increment of q to the increment of p, and α is the angle of rotation from the p-axis to the shearing stress path. These can be determined according to:
η = d q d p ,
α = { tan 1 ( η ) , 0 < α < π 2 π + tan 1 ( η ) , π 2 < α < 3 π 2 .
Five stress paths with loading angles of 56.3°, 71.6°, 90°, 123.7° and 251.6° were chosen in SPTT, corresponding to BL, AL, CP, LU and AU tests, respectively, listed in Table 3. For BL (loading in both axial and lateral directions) tests, both σ1 and σ3 increase with η kept at 1.5. In AL (axial-loading) tests, σ1 increases with σ3 remains constant, and it is the most frequently-used stress path in triaxial tests. To implement CP (constant p’) tests, σ3 decreases at half the speed of that of the increase in σ1. LU (lateral-unloading) tests were conducted to simulate the stress paths of soil elements in the side of foundation pits, by reducing σ3 and keeping σ1 constant. The purpose of AU (axial-unloading) tests was to study the mechanical behavior of soil elements in the bottom of foundation pits, as shown in Figure 1. It is worth noting that in AU tests, σ3 remains unchanged and σ1 is reduced to be less than σ3, so that negative q occurs. The first two series are increasing-p’ stress paths, and the latter two belong to decreasing-p’ stress paths, while the third represents the constant-p’ stress path.
In SPTT, soil specimens were consolidated anisotropically along the K0 line in order to simulate the in situ stress state. K0 was calculated according to the well-known Jaky’s equation [54], i.e., K0 = 1 − sin φ’ = 0.53. During this stage, σ3 was increased at a rate of 10 kPa/h to ensure the dissipation of excess pore water pressure. When the target anisotropic stress state was reached, both σ1 and σ3 were kept constant for another 2 h until the drainage rate of pore water was less than 1 mm3/min. Afterwards, the anisotropically consolidated soil specimens were sheared along predetermined stress paths. To avoid the accumulation of pore water pressure, the tests were performed slowly enough, with q increased linearly at a rate of 8 kPa/h, which was determined according to the research of Wang [19]. All the triaxial tests in this study were conducted using the TAS-LF (Triaxial Automated System—Load Frame) experiment system. The system consists of a load frame used to control axial load or displacement, two pressure volume controllers (PVC) for cell and back pressure or volume controlling, a data acquisition device, and the control software. The range of the submersible load cell for axial-loading is 10 kN with an accuracy of 0.01 kN. For PVC, the resolutions of measurement of volume and pressure are 1 mm3 and 1 kPa, respectively.

3. Results and Analysis

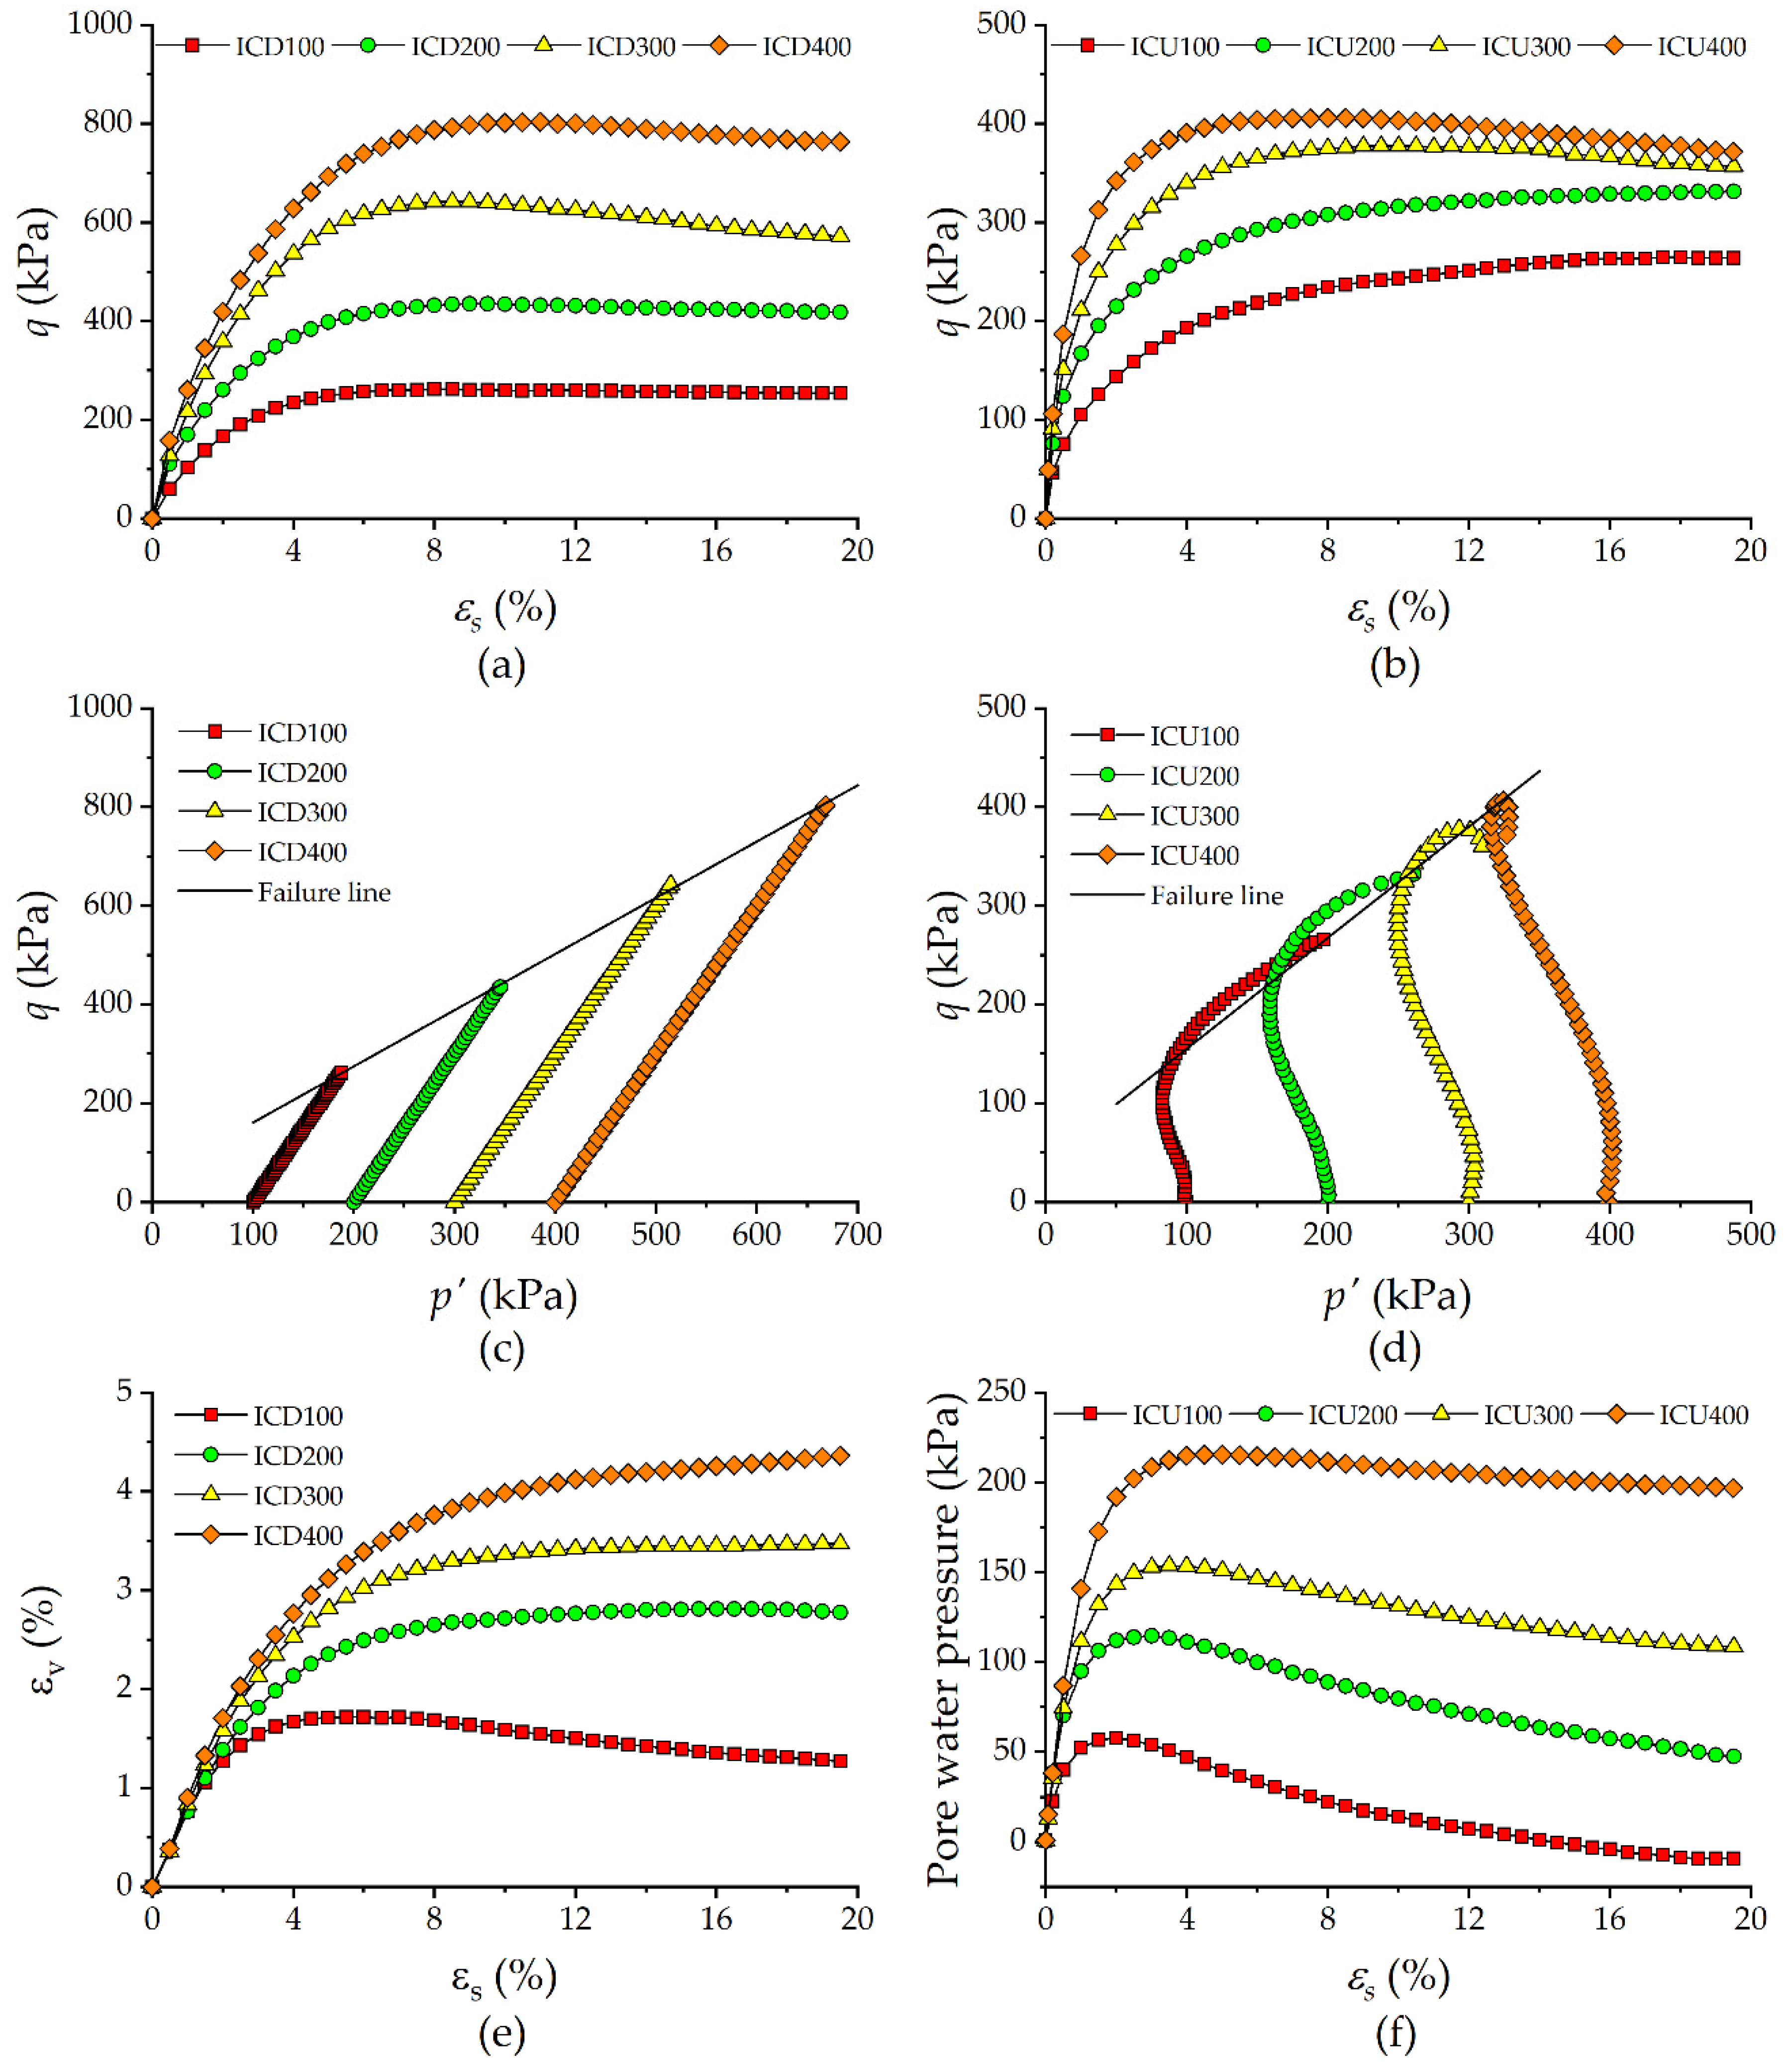
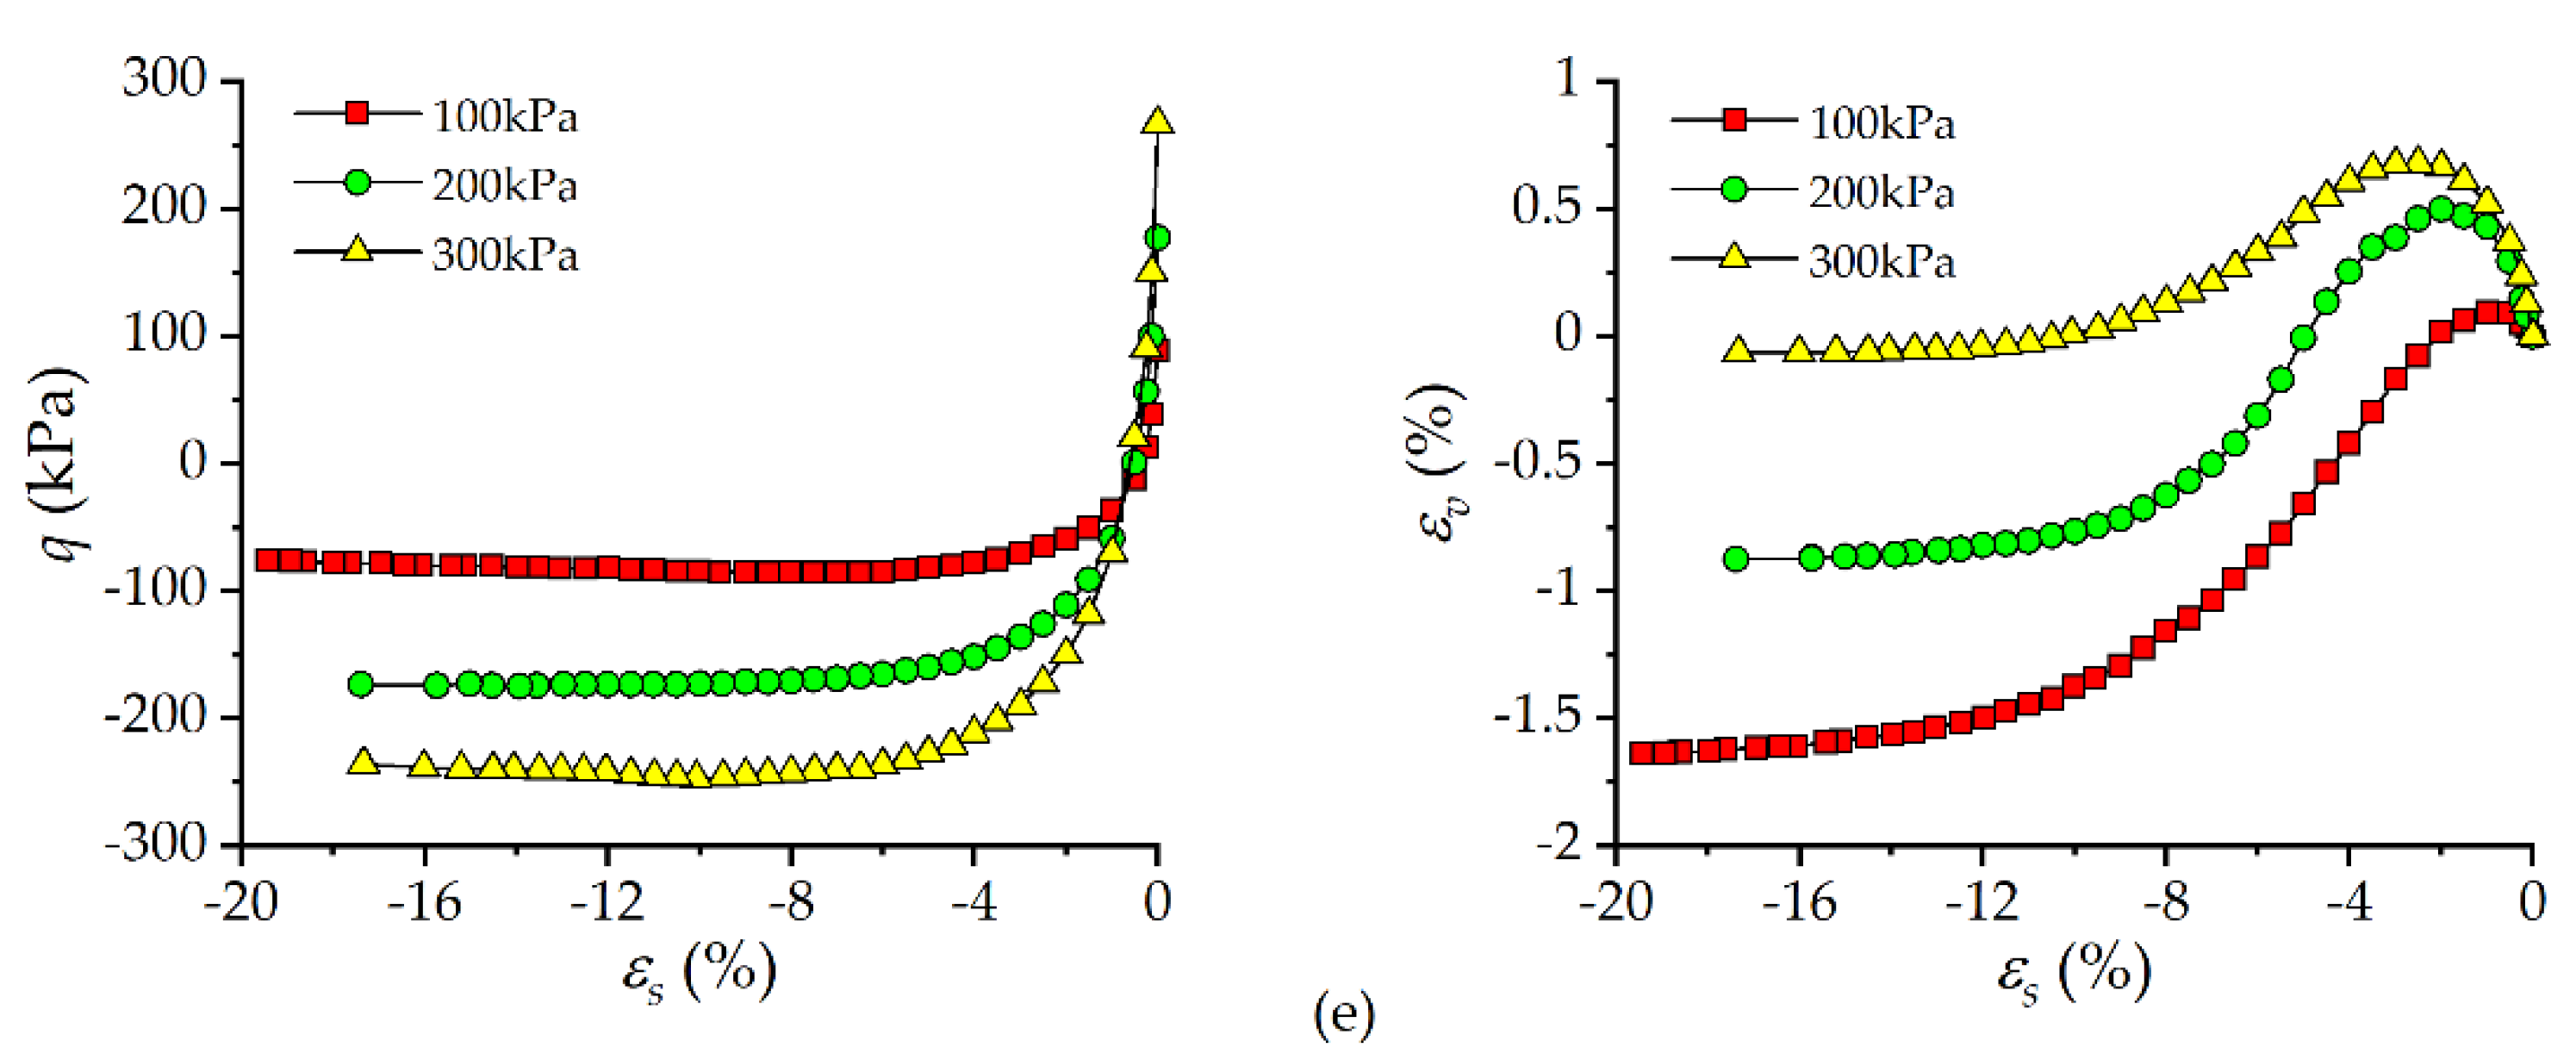
3.1. Behavior of Isotropically Consolidated UGRS

The results of drained and undrained shearing tests with constant σ3 on the UGRS consolidated isotropically are shown in Figure 5. As shown in Figure 5a,b, all specimens exhibited characteristics of strain-hardening before the emergence of failure planes passing through soil specimens. It is evident that confining pressure exerts a significant impact on the shearing strength. The peak shearing strength mobilized in the drained test is higher than that in the undrained test under the same confining pressure due to a higher level of mean effective stress.
The shearing stress paths are displayed in p’q space in Figure 5c,d. For undrained tests, the difference along the p’-axis between total and effective stress path represents the excess pore water pressure built up during shearing. As presented in Figure 5f, the evolution patterns of excess pore water pressure are similar for different confining pressures: positive excess pore water pressure is developed at first and a subsequent decrease is observed after reaching the peak, indicating the tendency of initial contraction followed by volume dilatancy. When sheared under drained conditions, the UGRS displays nearly monotonic volume contraction except for the specimen with a confining pressure of 100 kPa, as can be seen in Figure 5e. Moreover, it is found that the shear-induced volume contraction is enhanced as confining pressure increases.
By defining the failure of soil specimen as the arrival of peak deviator stress, failure lines are also demonstrated in p-q(or p’-q) plane. With the slope and the intercept of failure line denoted by M and Q, the cohesion c and friction angle φ, which are the most important strength parameters used in geotechnical engineering, can be determined using Equations (3) and (4) according to Wood [55]:
sin φ = 3 M 6 + M ,
c = Q ( 3 sin φ ) 6 cos φ .
The obtained strength parameters of the isotropically consolidated UGRS are presented in Table 4. The effective cohesion obtained from drained tests is about triple that obtained from undrained tests, as a result of the volume contraction during drained shearing. However, the effective friction angles are almost the same. This result indicates that the cohesion of the UGRS are sensitive to the drainage condition, while the friction angle seems unaffected.

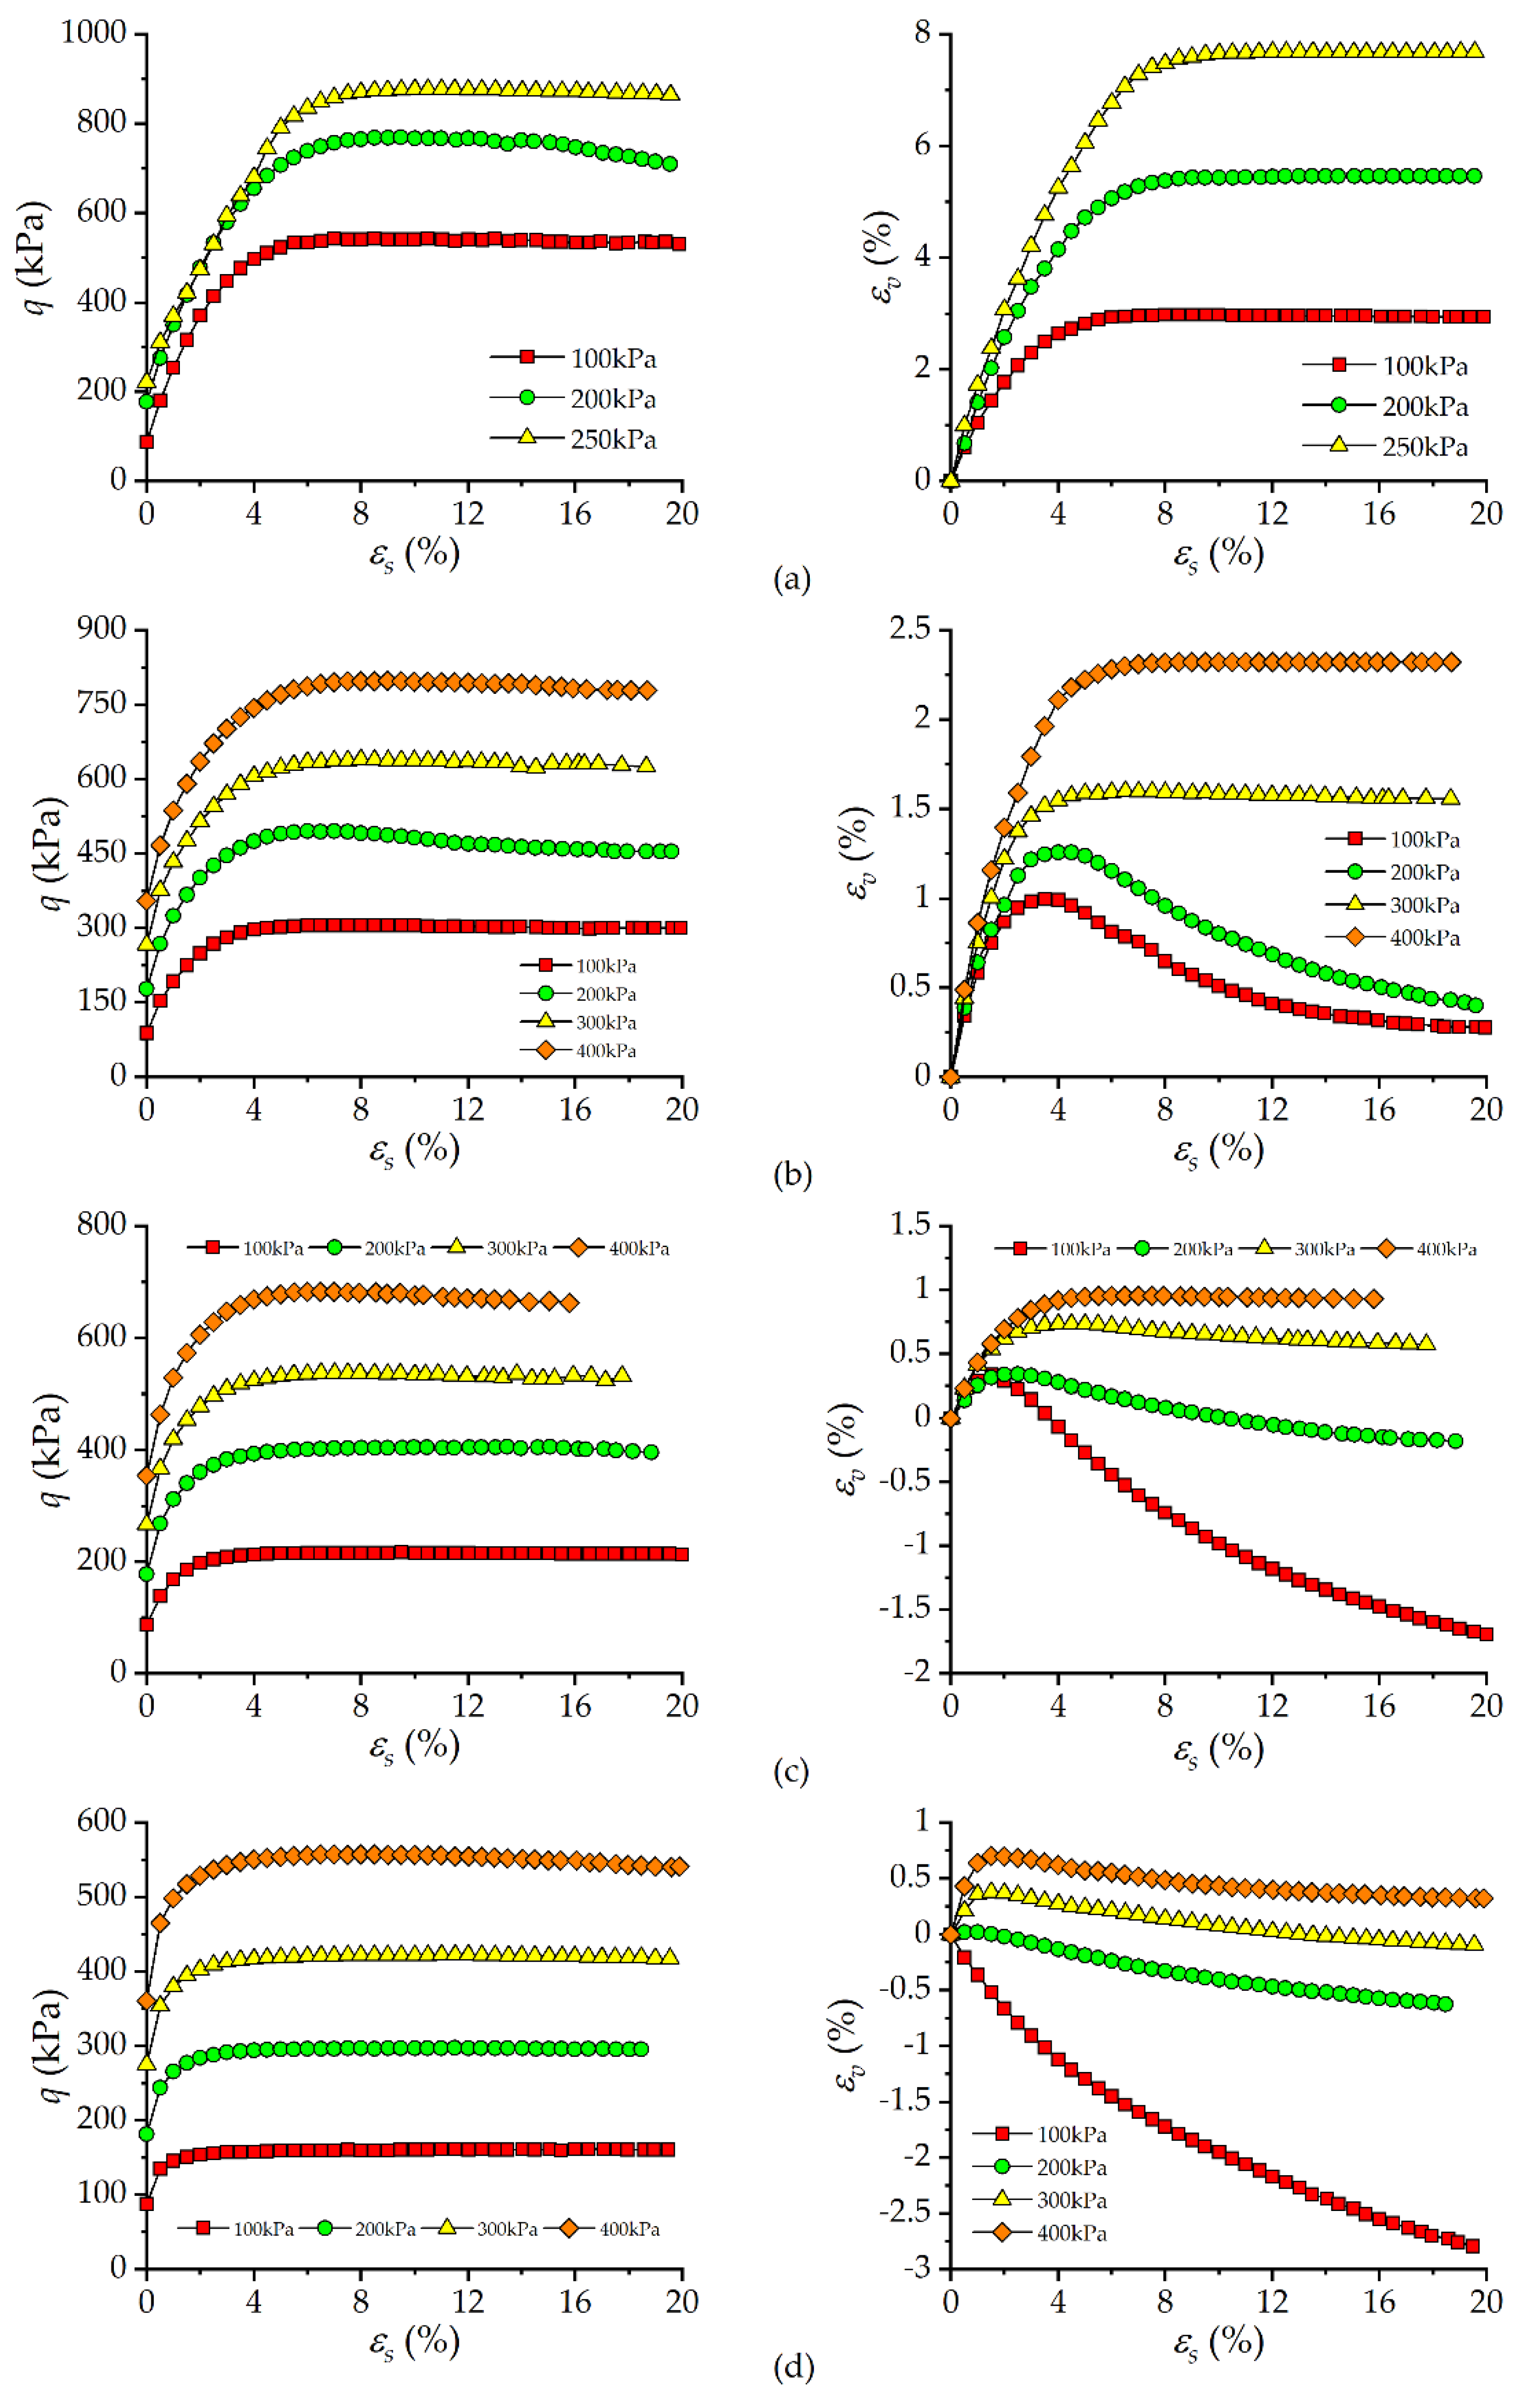
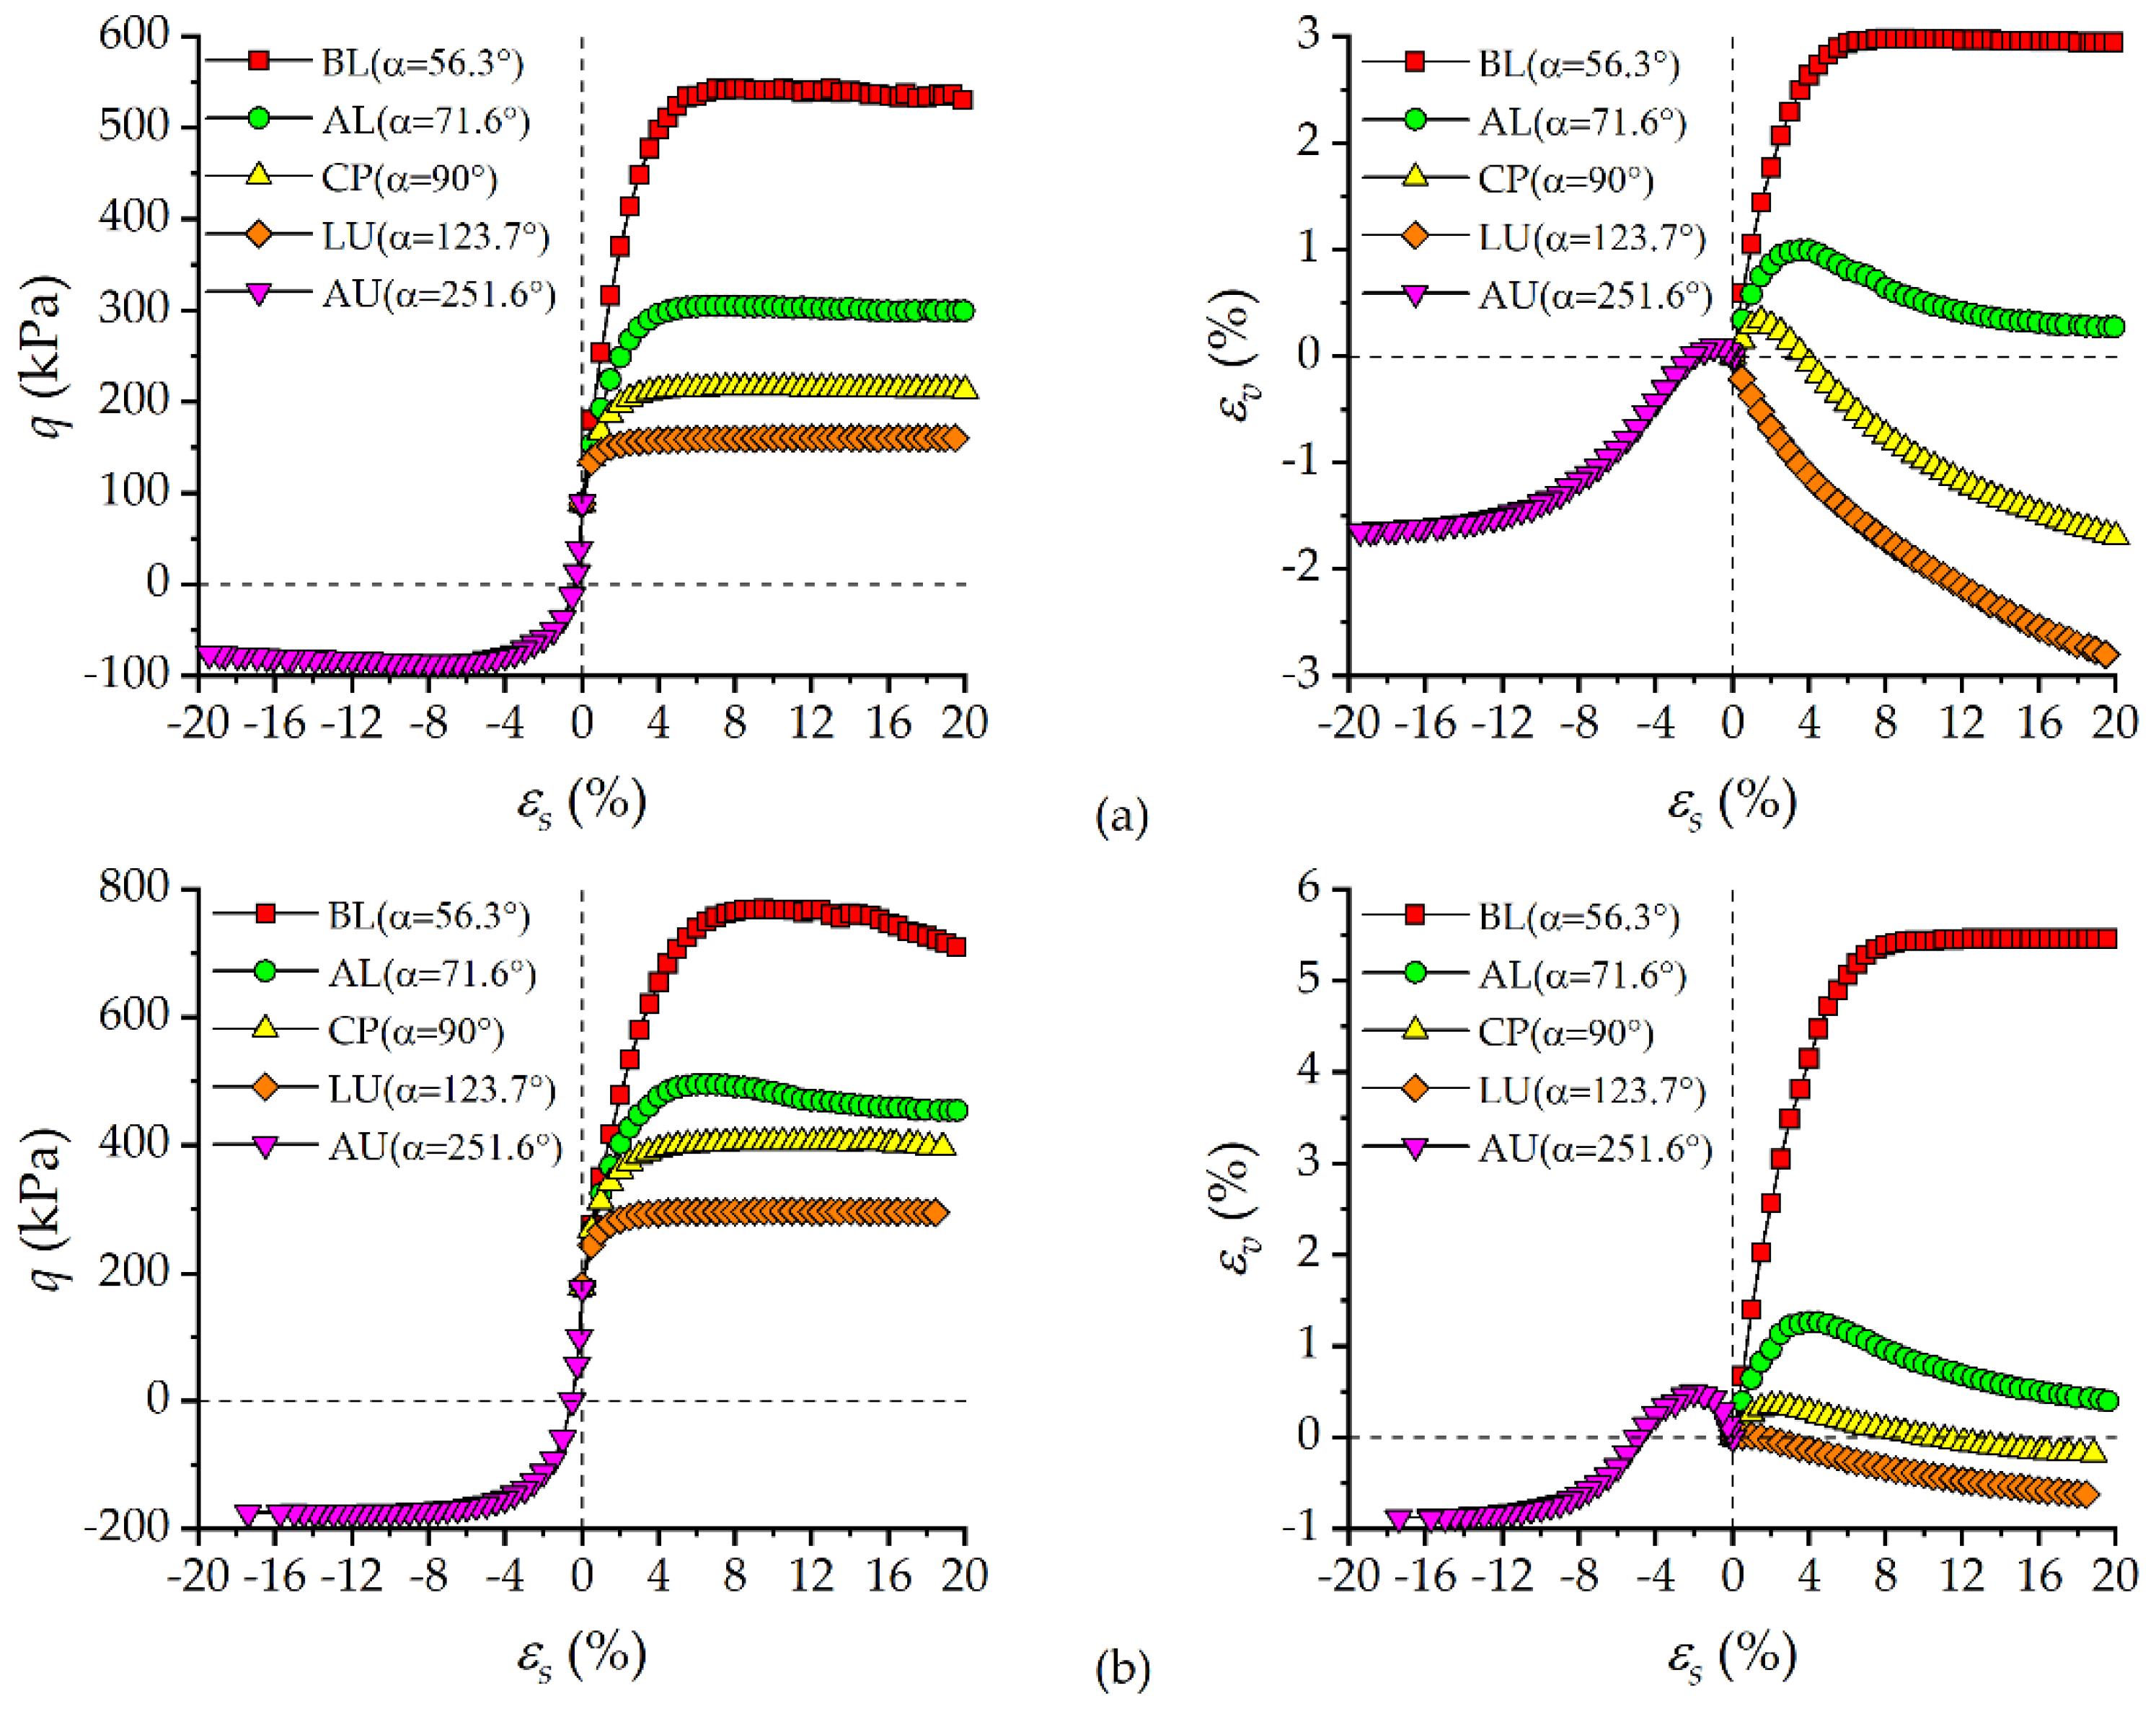
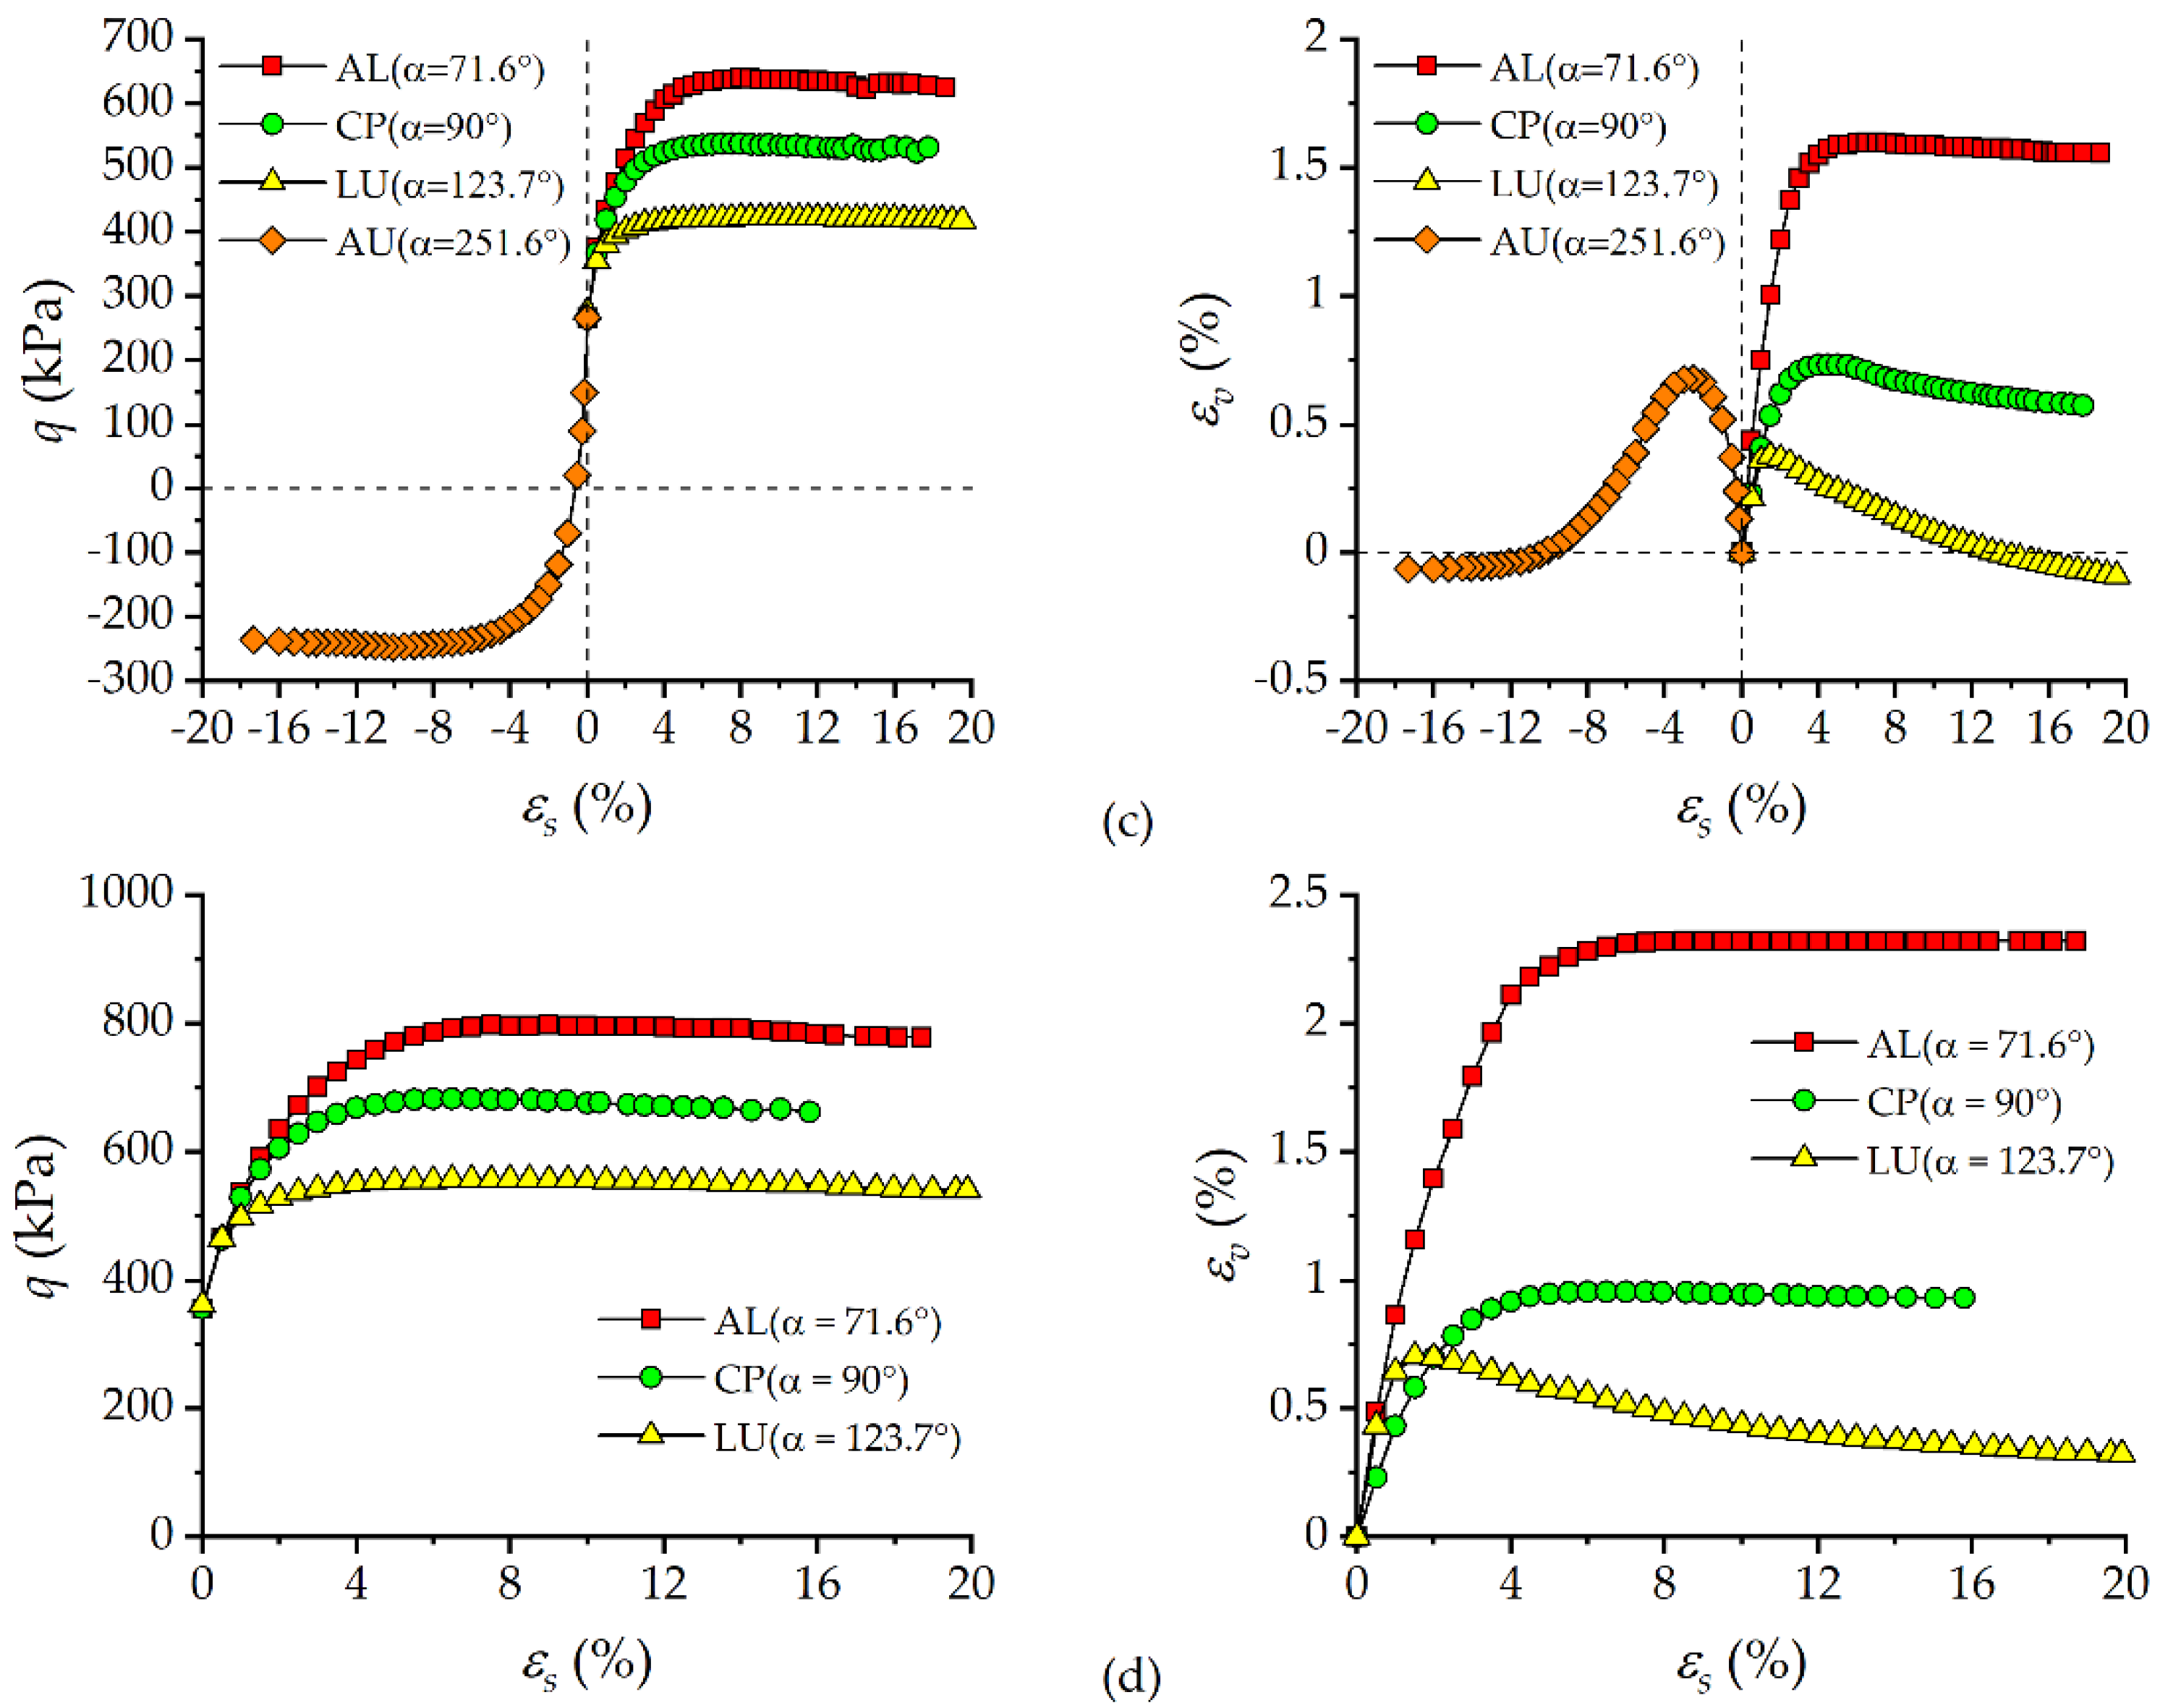
3.2. Stress-Strain Behavior under Different Stress Paths

Figure 6 presents the variations of deviator stress q and volumetric strain εv in response to shear strain εs for the soil under 3 or 4 consolidation pressures. For all stress paths investigated in this study, there is no distinct drop of deviator stress after peak points in the q-εs curves, which reflects the strain-hardening behavior of the UGRS. The shear strain corresponding to peak deviator stress is defined as failure strain. It is found that the failure strain increases with the increase in consolidation pressure regardless of stress path. Similar test results were reported by Mofiz [50] for compacted decomposed granite soil.
The volume change behavior of the soil strongly depends on consolidation pressure, as expected. When α = 56.3°, steady volume contraction is developed until the εvs curve reaches a plateau. The effects of consolidation pressure on the volume change behavior under α = 71.6° and 90° are identical: while contractive behavior followed by volume dilatancy is observed under low consolidation pressures, volume dilatancy at large shear strain is suppressed when high consolidation pressures were used. Similar results appear in tests with α = 123.7° and the volumetric strains at the end of test of soil specimens under σ3c = 100, 200, 300 and 400 kPa are −2.82%, −0.62%, −0.10% and 0.32%, respectively. The mean effective stress remains unchanged when α = 90°; therefore, only the increment of deviator stress is responsible for the considerable volumetric strains developed, a large proportion of which is irreversible. In other words, deformation of the soil is the result of the coupled effects of mean effective stress and deviator stress; the UGRS shows a coupled and irreversible response, which cannot be represented by uncoupled models such as the simple linear elasticity, to stress path testing. For the case where α = 251.6° (i.e., extension tests), besides the aforementioned inhibitory effect of high consolidation pressure on volume dilatancy, it is surprising that soil specimens develop appreciable volume contraction at the beginning of the test. Due to the fact that the increment of mean effective stress Δp’ is negative in this situation, the result above indicates the initial shear-contraction behavior of the UGRS under this stress path.
In order to investigate the influence of stress path on the stress–strain behavior of the UGRS, the qεs and εvεs curves of soil specimens under the same consolidation pressure but different loading angles are provided in Figure 7. Stress paths make a significant difference to the deformation characteristics of the UGRS. As can be seen, a considerable decrease in failure strain is observed as the loading angle increases for compression tests with α = 56.3°, 71.6°, 90° and 123.7° under the same consolidation pressure. This observation will be discussed later in this section in a quantitative manner. As for the volume change behavior, the role of the stress path is evident: soil specimens show less volume contraction as the loading angle increases. For the same increment of deviator stress Δq, the corresponding increment of mean effective stress Δp’ decreases and even becomes negative as the loading angle increases. Different ratios of Δq to Δp’ cause different relative magnitudes of distortion and compaction of soil fabric. This may explain the differences in the εvεs curves under different stress paths.
Ng et al. [8] adopted the axial strain where 90% of the maximum deviator stress was mobilized to characterize the ductility of decomposed granite. Similarly, the shear strains corresponding to 50% and 90% of (qmaxqc) are employed in this research, where qmax and qc denote the maximum deviator stress and the deviator stress after K0 consolidation, respectively, to investigate the influence of consolidation pressure and stress path on the ductility of the UGRS. These two strains adopted are denoted by (εs)50 and (εs)90, respectively. The variations of (εs)50 and (εs)90 with consolidation pressure are presented in Figure 8a,b, respectively. Under the same loading angle, both (εs)50 and (εs)90 increase with the increase in consolidation pressure, indicating that the brittleness of the UGRS is weakened after consolidation. It seems that the effect of consolidation pressure becomes more remarkable as the loading angle decreases. (εs)50 and (εs)90 change with consolidation pressure drastically when α = 56.3°, while for α = 123.7° only a minor change is observed. Figure 9a,b show the variations of (εs)50 and (εs)90 with loading angle. For each consolidation pressure, the larger the loading angle, the smaller the shear strains required to mobilize 50% and 90% of (qmaxqc). In other words, soil specimens under smaller loading angles show a less brittle response in the shearing stage. This may be explained by the stronger confining effect experienced by soil elements, because stress paths with a smaller loading angle have a higher level of mean effective stress.
To examine the influence of stress path on shearing stiffness, the initial secant shear moduli E0 of the UGRS under different stress paths were calculated and the results are provided in Figure 10. It should be noted that the initial secant shear modulus is defined in this paper as the slope of the straight line passing through the two points where εs = 0 and 0.1%, respectively, on the qεs curve. According to Atkinson [56], the shear strain 0.1% falls into the scope of small strain. As expected, the initial secant shear modulus increases with the increase in consolidation pressure, indicating the hardening of the soil. It is clear that the shearing stiffness of the UGRS is path-dependent. With the increase in loading angle, the initial secant shear modulus first decreases and then increases. There is a certain value of loading angle lying between 90° and 123.7°, at which the shearing stiffness of the UGRS is lowest. When the loading angle is close to this certain value, the soil shows poor performance in terms of resisting shear deformation. Moreover, it is worth noting that the initial secant shear modulus in the AE test was much larger than those in compression tests. The results reveal that the average level of mean effective stress is not the only factor affecting the shearing stiffness of the UGRS, because soil specimen under a smaller loading angle (i.e., a higher average level of mean effective stress) may show a less stiff response during shearing. Not only the volumetric deformation, but also the distortion of the soil skeleton determines the evolution of shearing stiffness of the soil. As mentioned before, the relative magnitudes of distortion and compaction of soil fabric during shearing vary as the loading angle changes, reflecting the evolution of soil fabric towards different directions. The results above reveal that the resistance to the evolution of soil fabric towards different directions can be quite different, and there is a certain type of soil fabric which is the easiest one to achieve.

3.3. Effects of Stress Path on Shearing Strength

The shearing strength characteristics of soil vary as a function of stress path experienced by soil element. In this work, the Mohr–Coulomb strength parameters (including cohesion and friction angle) are adopted to quantitatively evaluate the effect of stress path on the strength properties of the UGRS. Figure 11 shows failure lines for tests with different loading angles, and each failure line is plotted based on test results of three or four specimens with identical loading angles but different consolidation pressures. Using the method mentioned in Section 3.1., the Mohr–Coulomb strength parameters of the UGRS experiencing various stress paths were determined and a comparison among them is provided in Figure 12. It can be seen from Figure 12 that the variation trends of cohesion are contrary to those of friction angle: as loading angle increases, cohesion of the soil decreases monotonically, while friction angle continues to increase. Specifically, with the increase in loading angle from 56.3° to 123.7° (all on the compression side of p’q space, categorized as the compression test), cohesion of the UGRS decreases from 49.1 to 17.9 kPa and friction angle increases by as much as 23.3%, changing from 25.8° to 31.8°. The Mohr–Coulomb strength parameters for triaxial extension tests with constant σ3 and decreasing σ1 are also included in Figure 12. There were significant differences between strength parameters obtained from the compression and extension tests. Soil specimens in extension tests showed a lower cohesion but a higher friction angle than those in compression tests. This result is slightly different from that obtained by Mofiz et al. [50], probably due to their use of reconstituted soil, of which the natural structure was destroyed. Moreover, comparison between the Mohr–Coulomb strength parameters obtained from ICD and AL tests were made, to evaluate the effect of the consolidation state. Both cohesion and friction angles of the UGRS in AL tests were slightly smaller than those in ICD tests, which were the results of the anisotropy induced by the anisotropic consolidation stress. On the other hand, comparison between strength parameters under α = 123.7° and 251.6° indicated the existence of inherent strength anisotropy of the UGRS.
It has been mentioned in Section 3.2. that the relative magnitudes of distortion and compaction of soil fabric change as a function of loading angle. As a result, soil specimens sheared under different loading angles achieve different arrangement patterns and contact characteristics of soil particles at failure, which may be responsible for the effect of stress path on the strength properties of the UGRS.

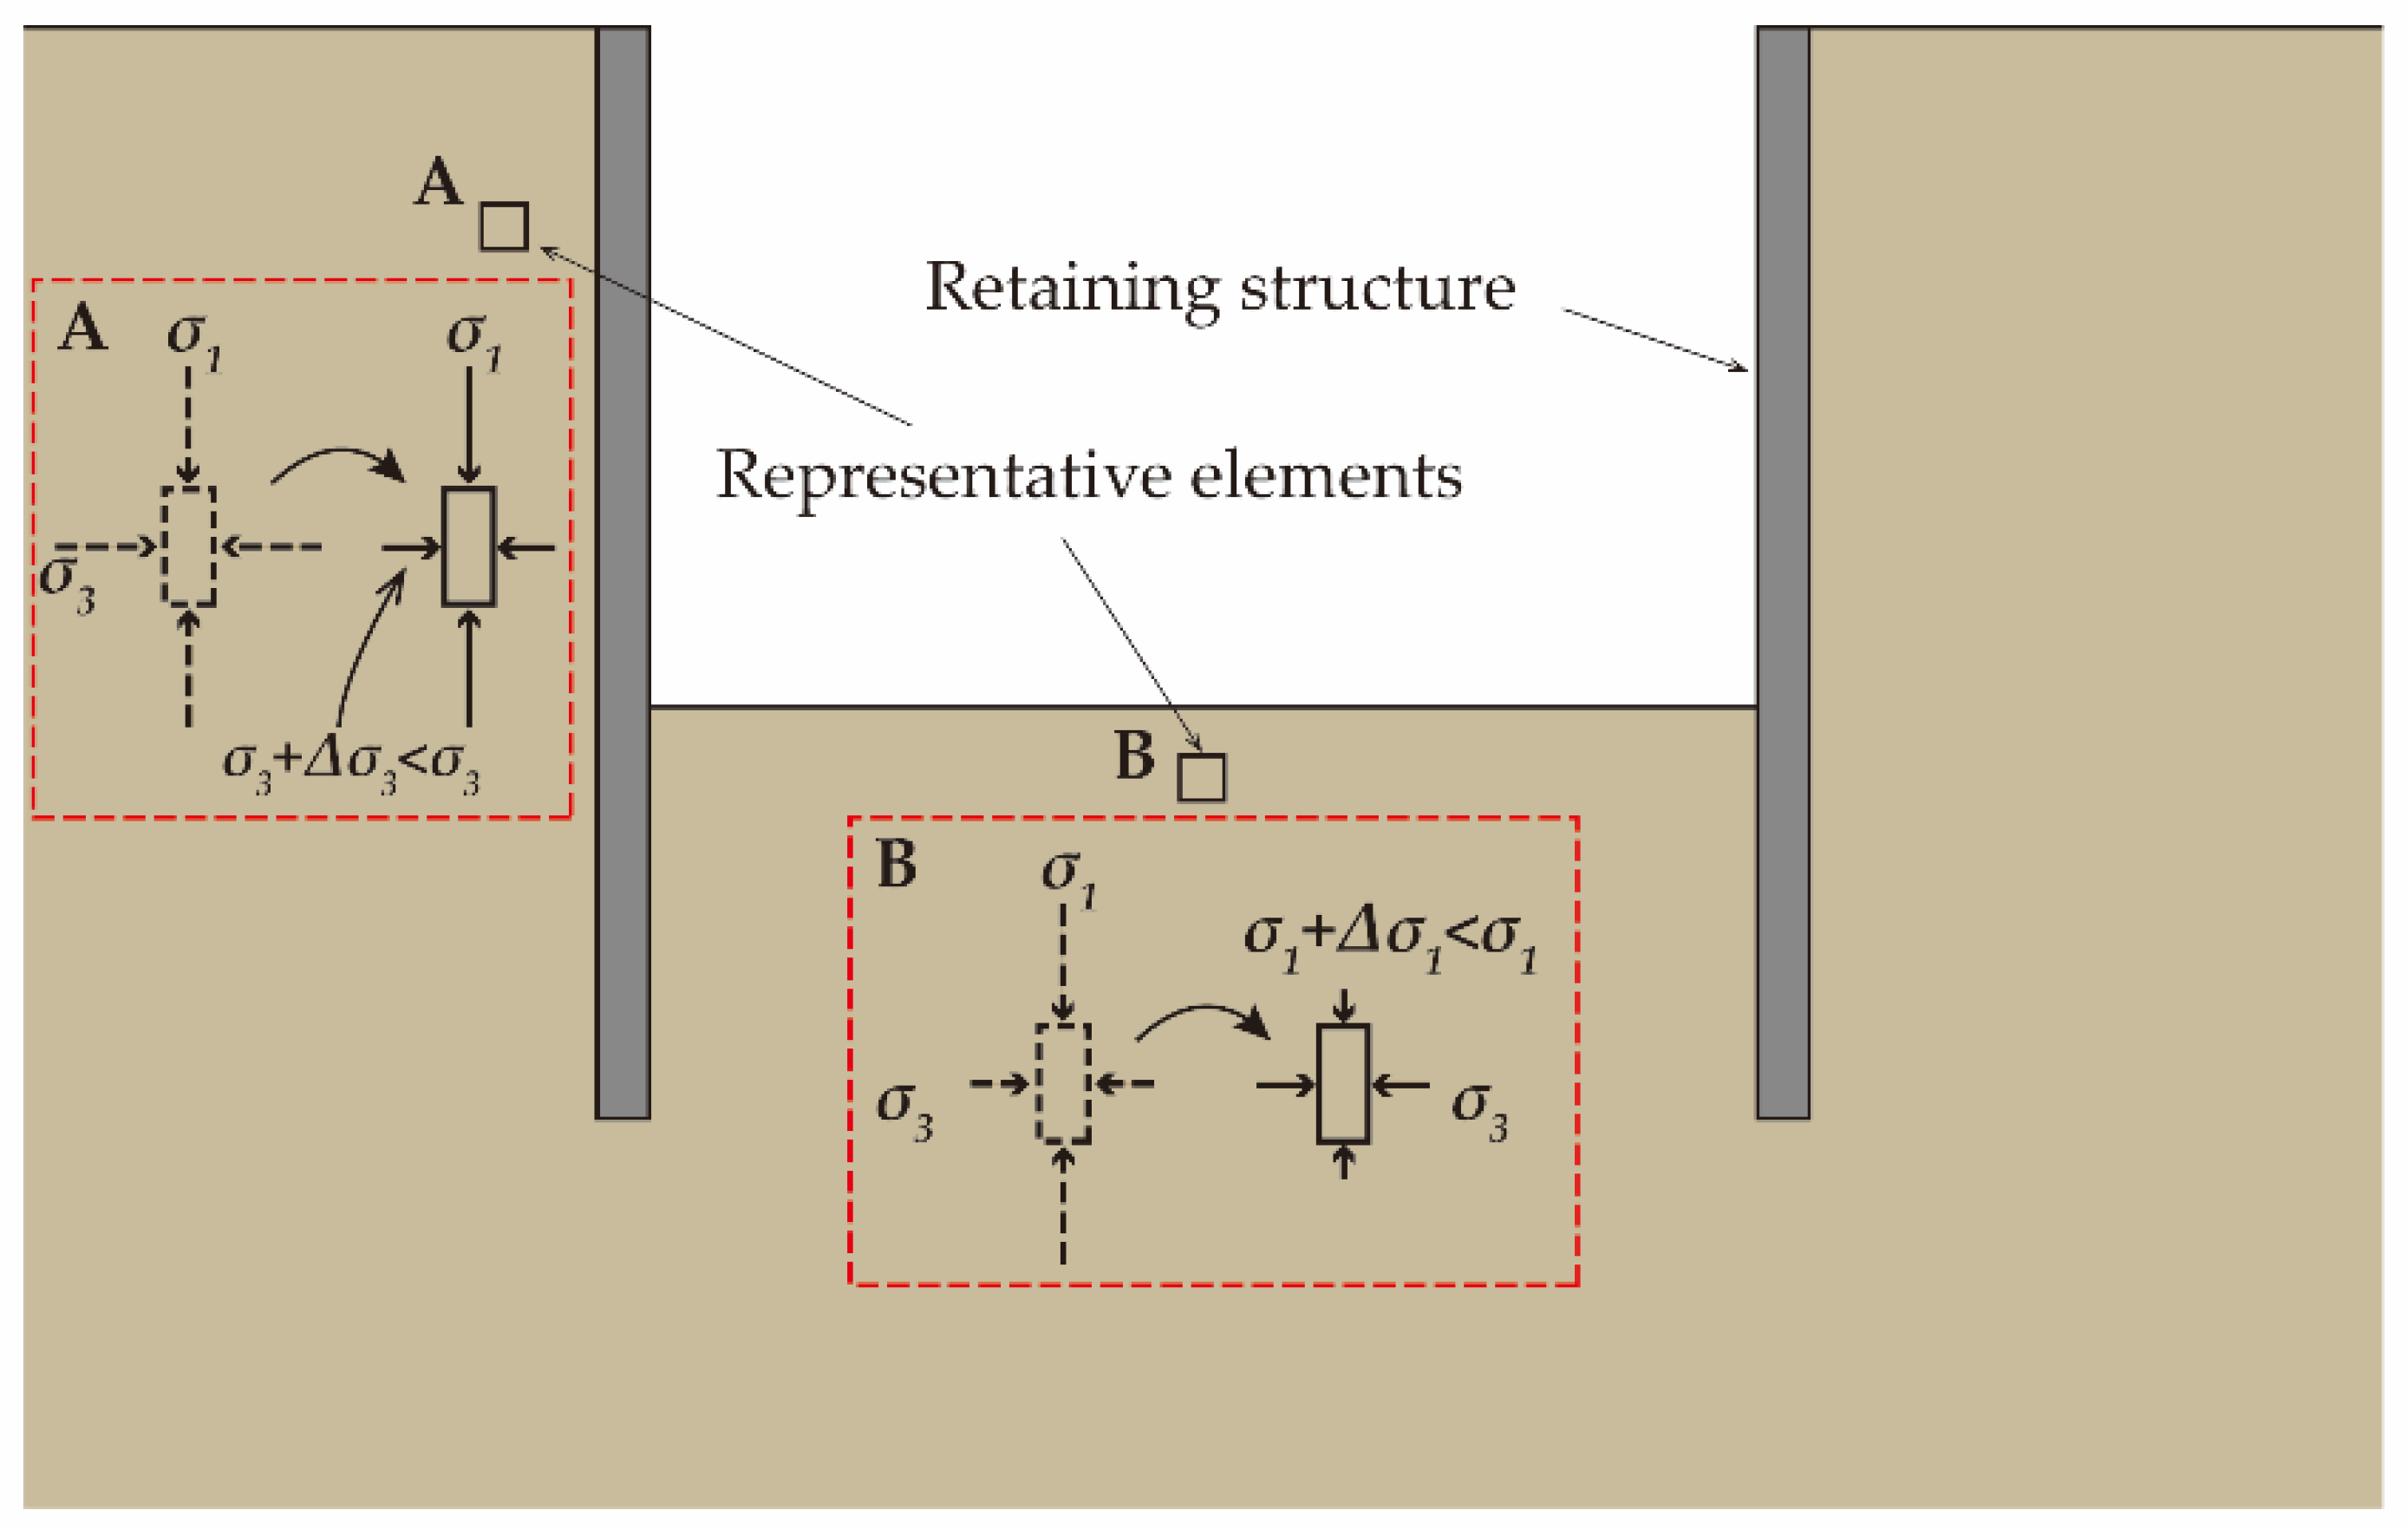
4. Discussion: Effect of Pattern of Variation of Mean Effective Stress and Their Implications

It is worth noting that soil properties such as the Mohr–Coulomb strength parameters obtained from conventional triaxial tests are used directly in many geotechnical engineering projects, despite the practical stress paths involved. Therefore, we chose the stress path of conventional triaxial test (α = 71.6°) as a benchmark, to investigate the influence of patterns of variation of mean effective stress on shearing strength, ductility and shearing stiffness of the UGRS.
Compared to the Mohr–Coulomb strength parameters under α = 71.6°, cohesions under α = 123.7° and 251.6° decreased by 58.1% and 85.7%, respectively, while friction angles under α = 123.7° and 251.6° increased by 17.3% and 55.0% respectively. It is shown that under decreasing-p’ stress paths, cohesion of the soil is severely weakened while friction angle is strengthened considerably. The findings above signify that patterns of variation of mean effective stress have non-negligible influence on the shearing strength properties of UGRS. Therefore, more attention should be paid to the applicability of the strength parameters used for design to achieve a balance between safety and economy.
As for ductility, a summary of (εs)50 and (εs)90 under decreasing-p’ stress paths is presented in Table 5. Note that the rate of change of ductility, which is the percentage change in ductility, is also calculated, by choosing the corresponding value under α = 71.6° as a benchmark. As can be seen in Table 5, both (εs)50 and (εs)90 experienced significant decreases under decreasing-p’ stress paths, compared to those under α = 71.6°. In particular, there was a marked decrease of 62.4%~72.6% in (εs)50 under α = 123.7°, while under α = 251.6° (εs)50 decreased by 54.8%~65.6%. Certainly, the UGRS showed more brittle responses under decreasing-p’ stress paths, which indicates that the soil may reach failure state when shear strain is still small. It follows that more efforts must be made in monitoring deformation during excavation in granite residual soils. Monitoring frequency should be raised, and if necessary, real-time monitoring systems need to be established to prevent possible soil failure at small strains, especially in the side of foundation pits.
There was a significant difference between initial secant shear moduli under α = 123.7° and 251.6°, although both of them belonged to decreasing-p’ stress paths. The initial secant shear moduli under α = 123.7° were about 70%~104% of those under α = 71.6°, while the initial secant shear moduli under α = 251.6° were 2~2.52-fold greater than those under α = 71.6°. This indicates that the UGRS exhibits quite different shearing stiffness in compression and extension tests. Due to the fact that vertical stresses σ1c are greater than horizontal stresses σ3c after consolidation, soil specimens sheared under α = 251.6° (i.e., extension tests) gradually approach a hydrostatic stress state at first. This may explain why soil specimens in extension tests show extraordinarily stiff responses at small strain. Stiffness parameters of soil are essential for numerical simulations of excavation, which are aimed at evaluating deformation near foundation pits. The results above imply that stiffness parameters of granite residual soils should be decided carefully. Specifically, appropriate parameters are assigned to soil elements according to their positions.

5. Conclusions

In the present study, the isotropic consolidation conventional triaxial tests and anisotropic consolidation stress path triaxial tests were conducted on a typical undisturbed granite residual soil. Based on the test results, the influence of stress path, which was quantified by loading angle, on the stress–strain strength behavior of the soil was investigated. Many aspects including the Mohr–Coulomb strength parameters, failure strain, volume change behavior, ductility, as well as shearing stiffness were involved. The main conclusions are summarized as follows.
(1)
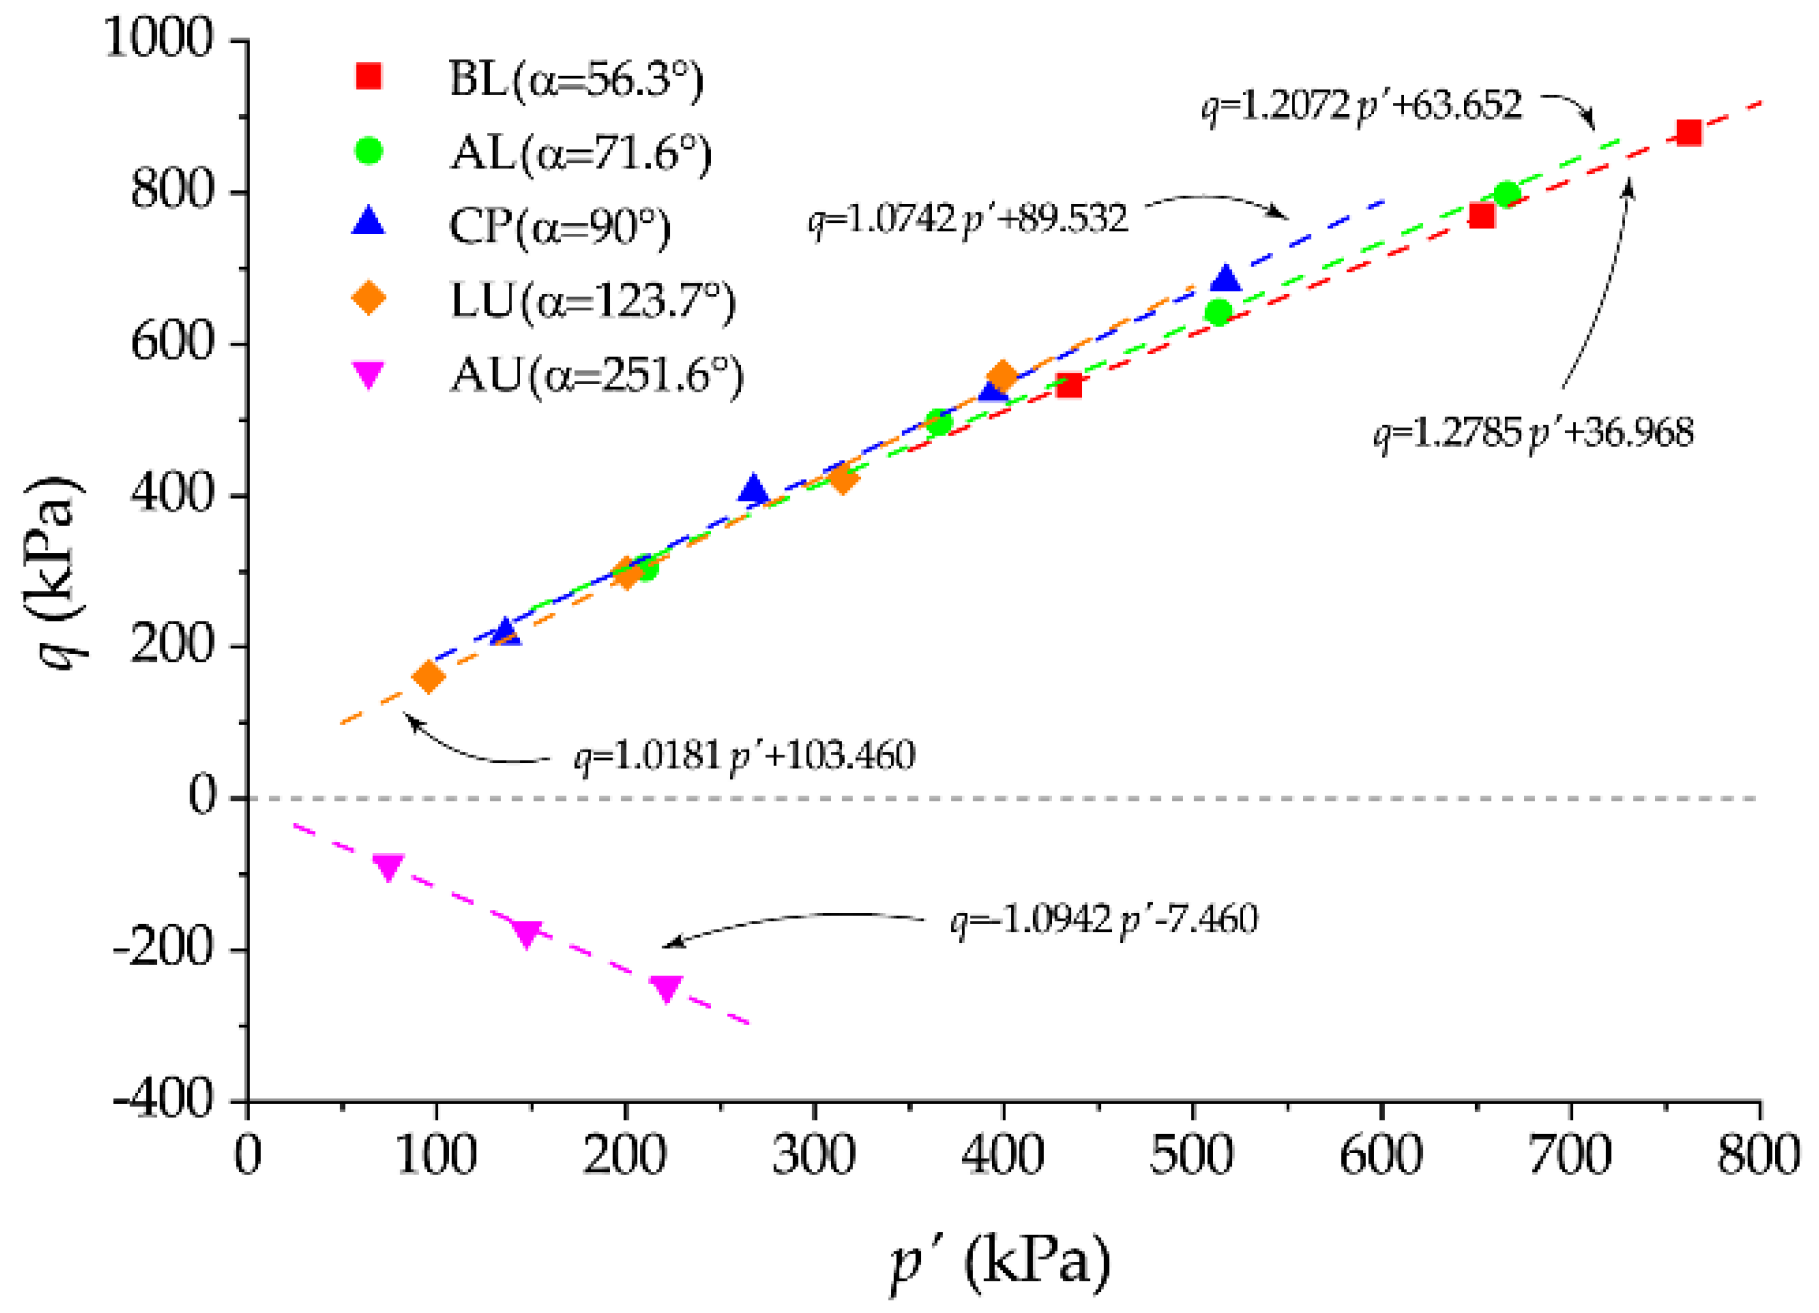
For compression tests, friction angle of the UGRS continues to increase while cohesion decreases monotonically as the loading angle increases. Compared with compression tests, soil specimens in extension tests show a lower cohesion but a higher friction angle. Both cohesion and friction angles of the soil in AL tests are slightly smaller than those in ICD tests, indicating the influence of consolidation stress states on the strength properties of the UGRS.
(2)
Both consolidation pressure and loading angle impose impacts on the deformation behavior of the soil. The failure strain increases gradually as consolidation pressure increases or loading angle decreases. The increase in consolidation pressure leads to more volume contraction, while the increase in loading angle diminishes the contractive behavior of the soil.
(3)
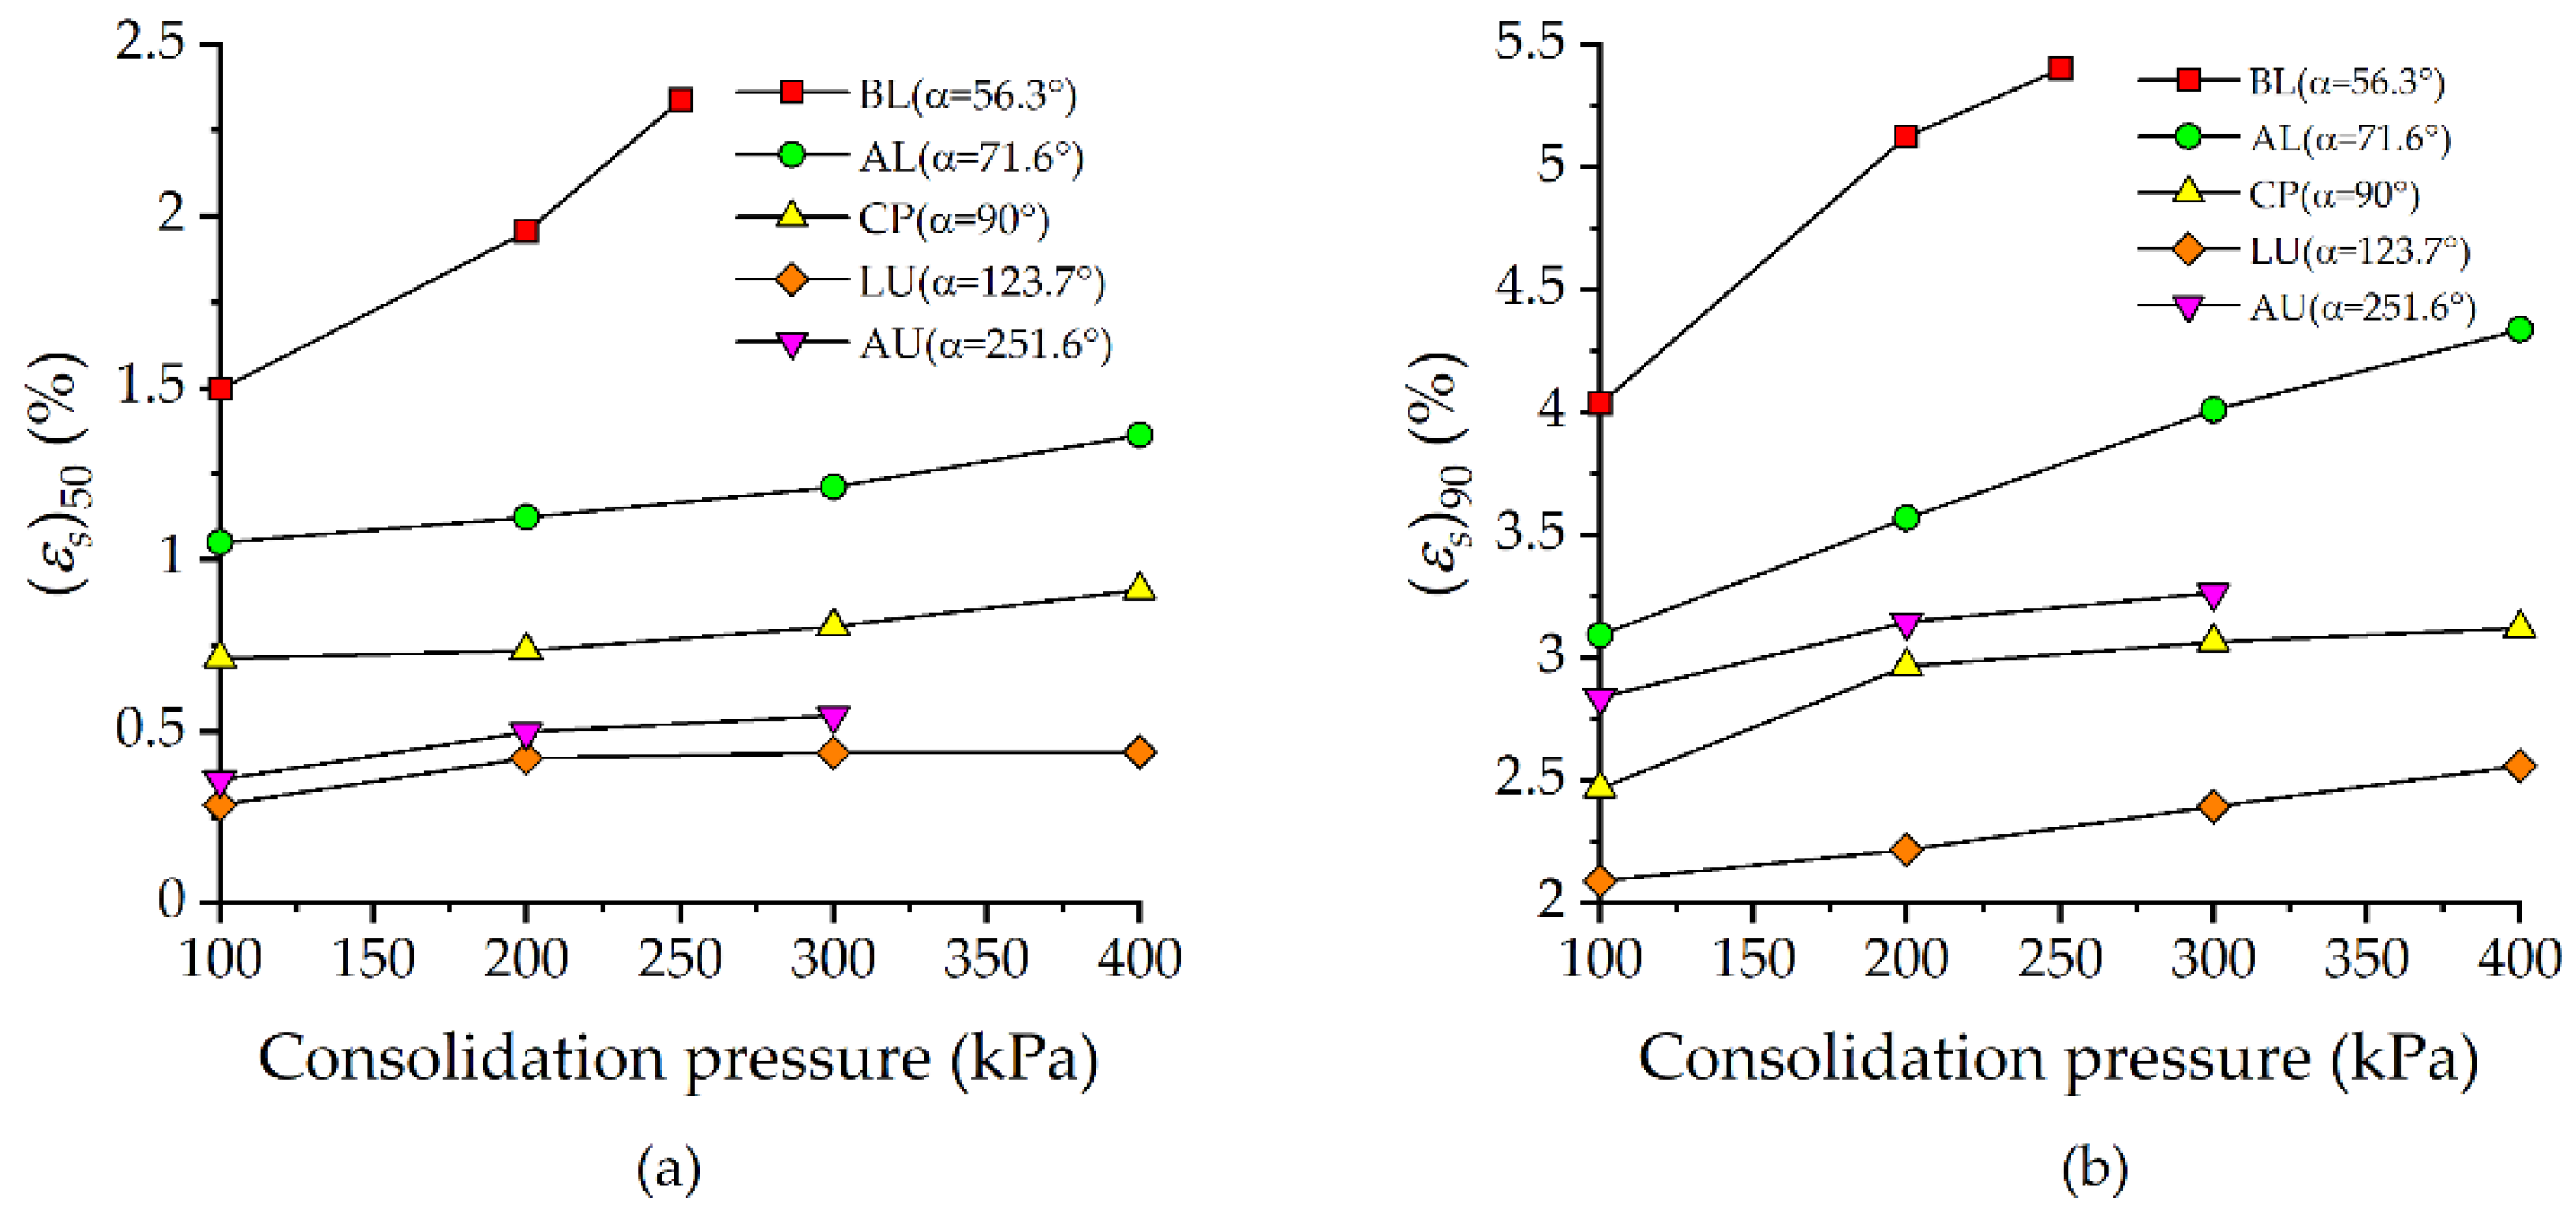
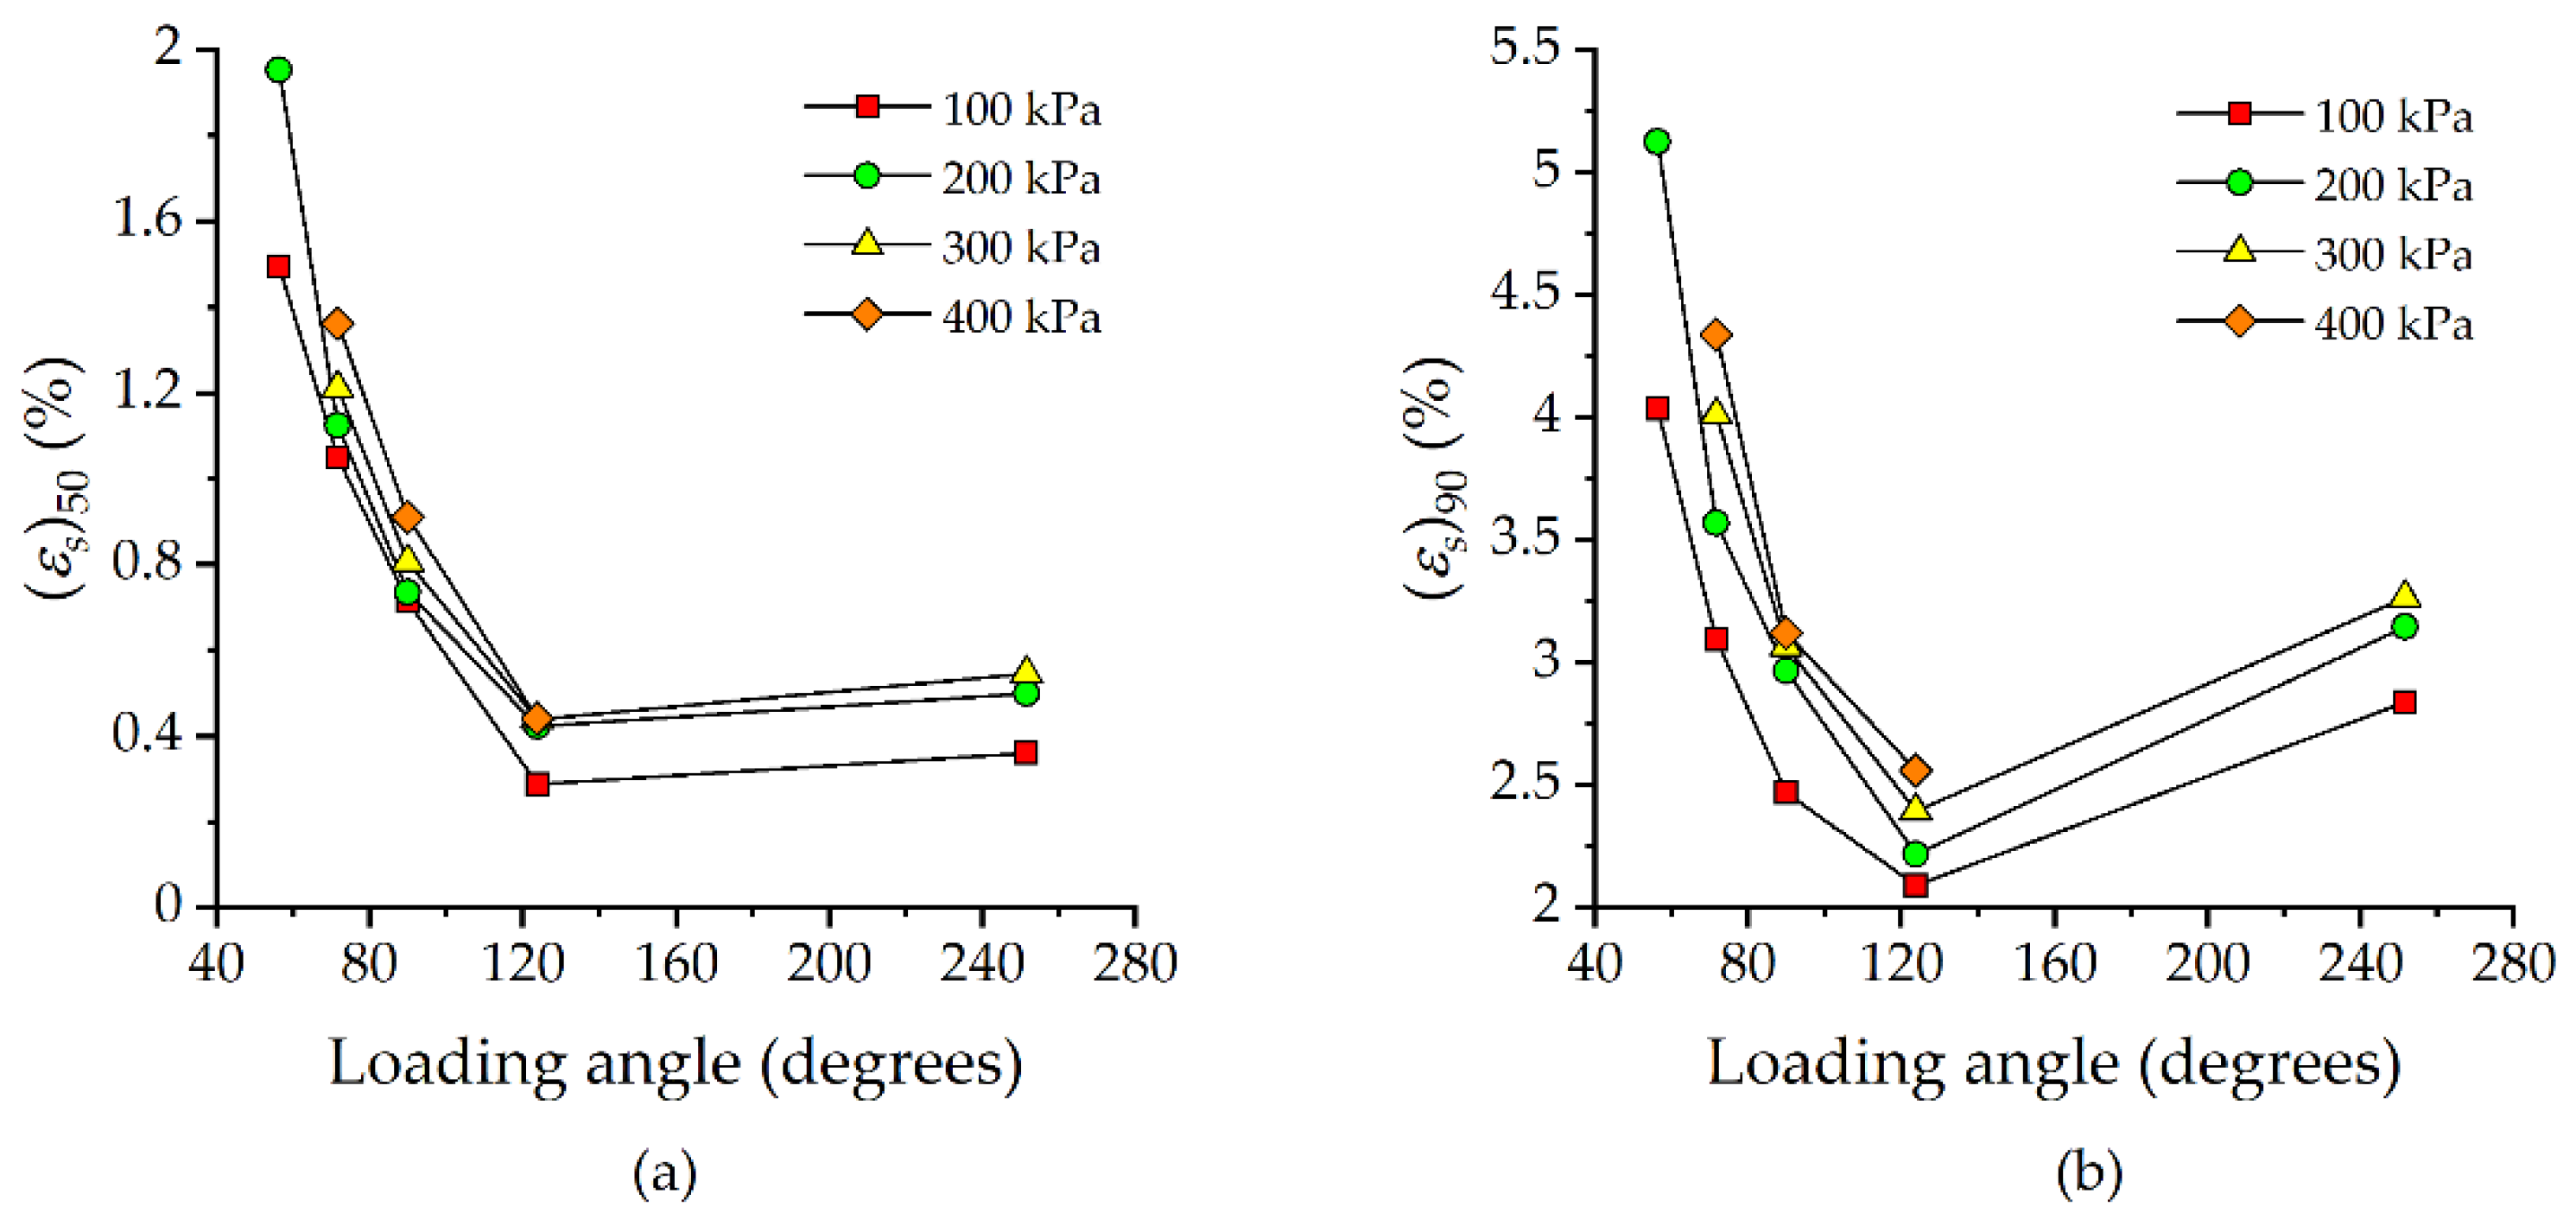
In this paper, (εs)50 and (εs)90 were employed to formulate the ductility of soil. The UGRS shows larger (εs)50 and (εs)90 (i.e., more ductile) under higher consolidation pressure, and the effect of consolidation pressure is enhanced as loading angle decreases. Due to the stronger confining effect imposed by stress path with smaller loading angle, the UGRS shows a less brittle response during shearing.
(4)
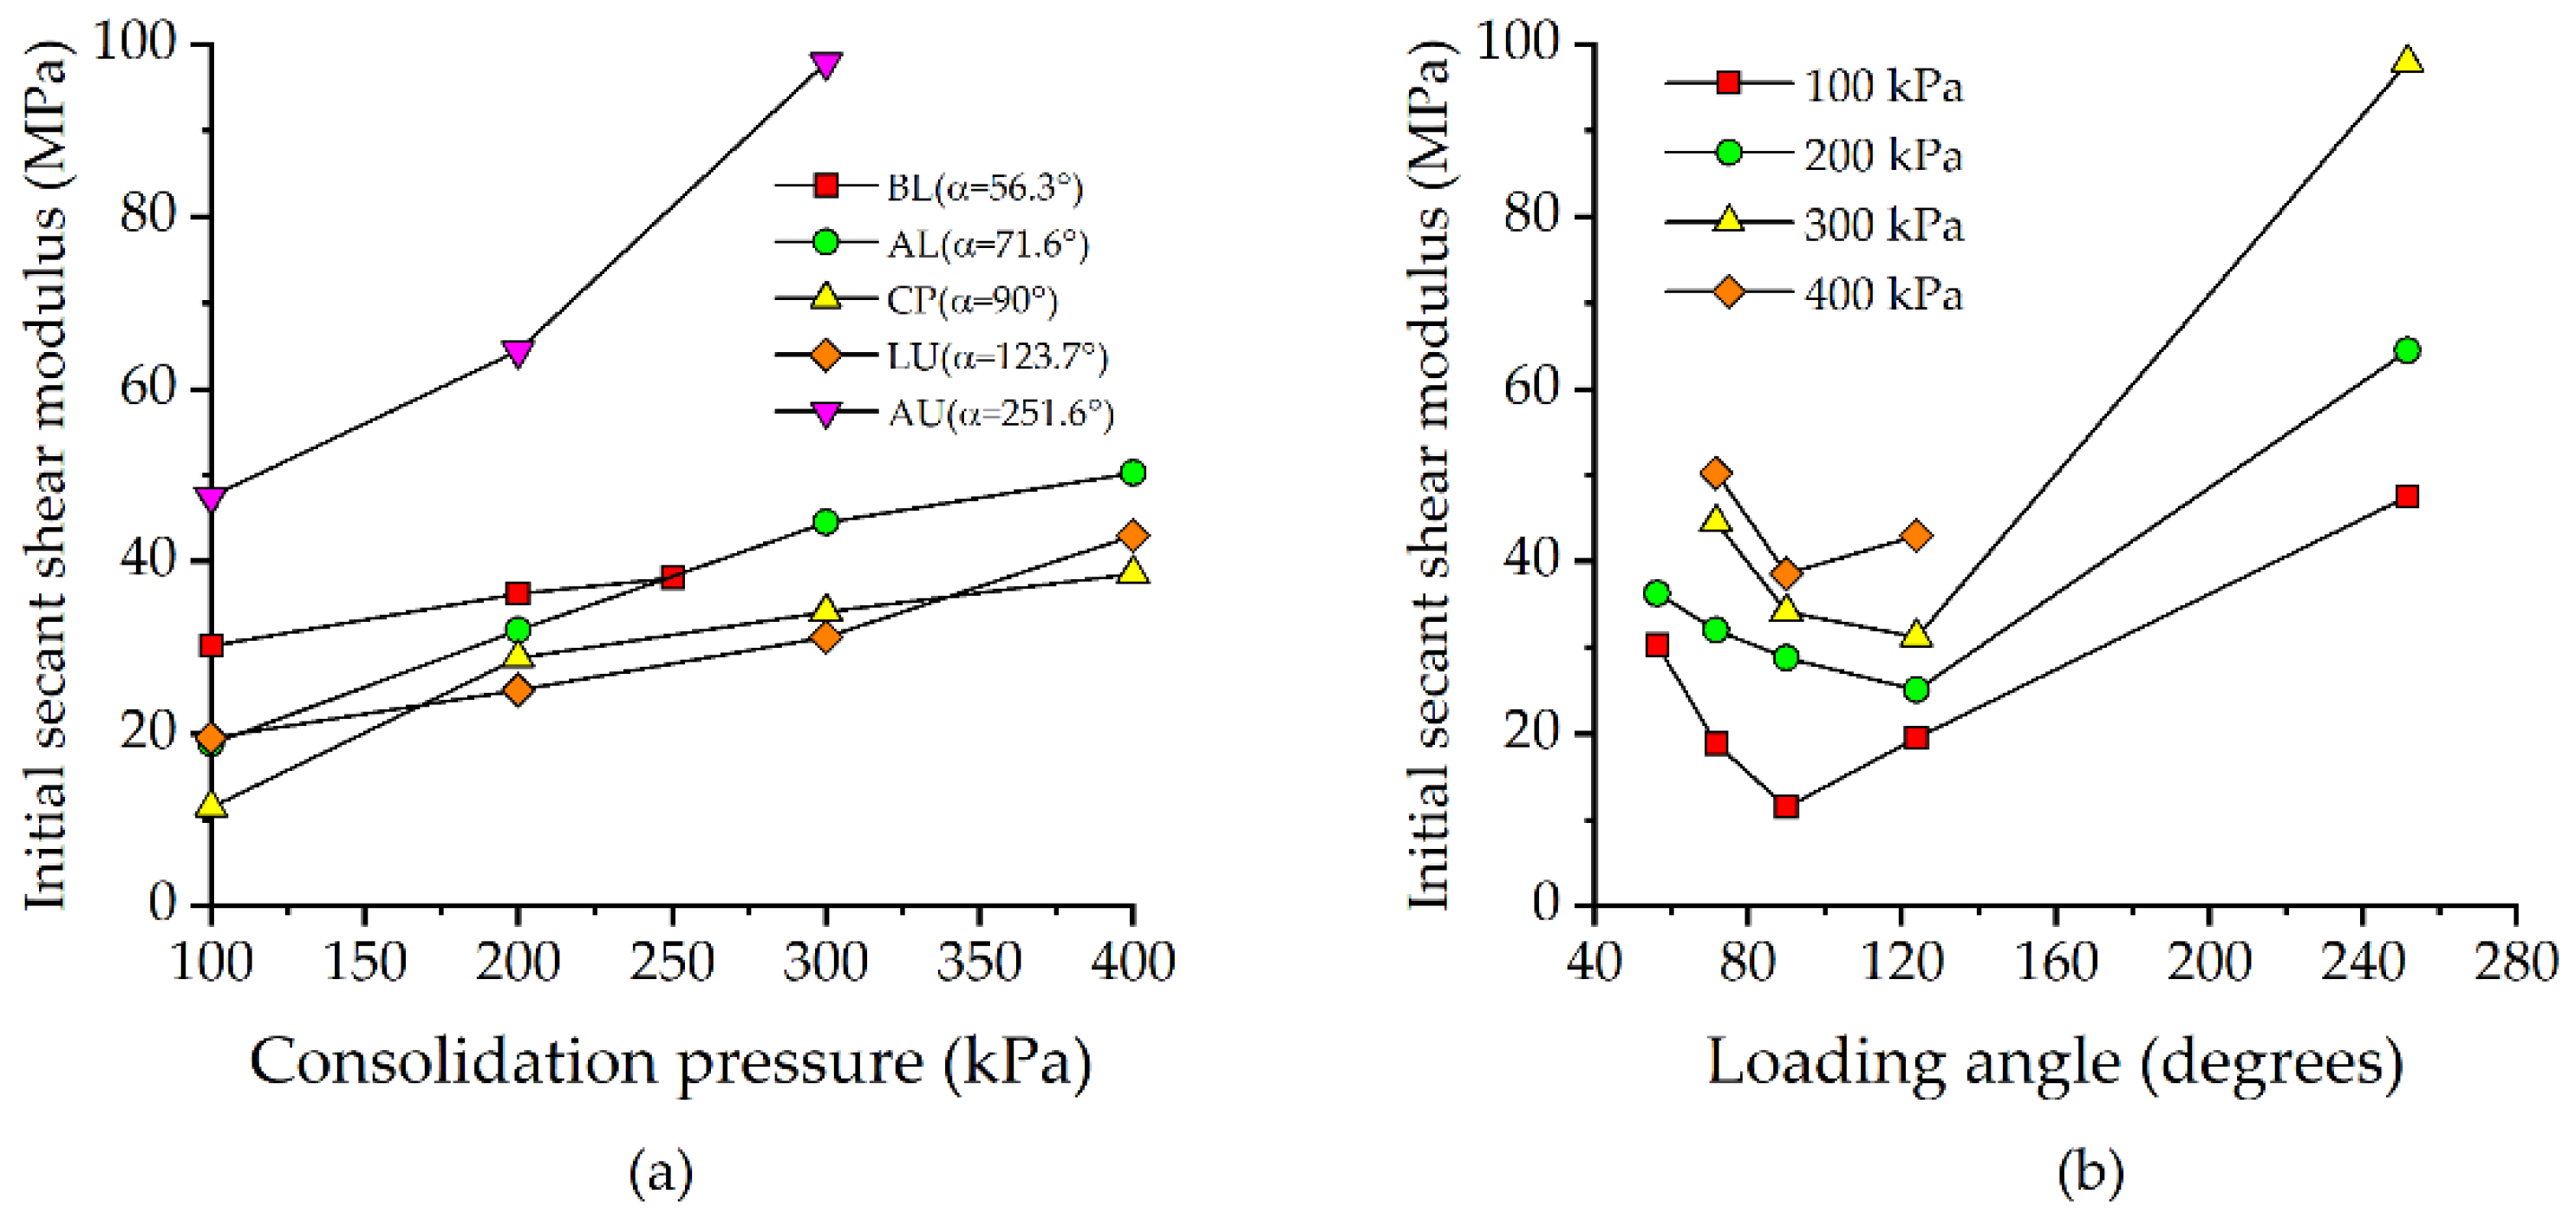
The initial secant shear modulus E0 was defined to evaluate the shearing stiffness of the soil. It is found that the shearing stiffness of the UGRS is path-dependent. E0 first decreases and then increases as loading angle increases. There is a certain value of loading angle lying between 90° and 123.7°, under which the lowest E0 occurs.

Author Contributions

R.S. and L.K. proposed the research method and designed the test plan; R.S., B.L. and J.W. performed the laboratory tests; R.S. analyzed the data and wrote the paper under the guidance of L.K. All authors have read and agreed to the published version of the manuscript.

Funding

This research was funded by the National Natural Science Foundation of China (Grant No. 11672320).

Data Availability Statement

The data presented in this study are available on request from the corresponding author.

Conflicts of Interest

The authors declare no conflict of interest.

References

  1. An, R.; Kong, L.W.; Li, C.S. Pore distribution characteristics of thawed residual soils in artificial frozen-wall using NMRI and MIP measurements. Appl. Sci. 2020, 10, 544. [Google Scholar] [CrossRef] [Green Version]
  2. Rahardjo, H.; Aung, K.K.; Leong, E.C.; Rezaur, R.B. Characteristics of residual soils in Singapore as formed by weathering. Eng. Geol. 2004, 73, 157–169. [Google Scholar] [CrossRef]
  3. Yan, W.M.; Li, X.S. Mechanical response of a medium-fine-grained decomposed granite in Hong Kong. Eng. Geol. 2012, 129–130, 1–8. [Google Scholar] [CrossRef]
  4. Meng, F.Y.; Chen, R.P.; Wu, H.N.; Xie, S.W.; Liu, Y. Observed behaviors of a long and deep excavation and collinear underlying tunnels in Shenzhen granite residual soil. Tunn. Undergr. Space Technol. 2020, 103, 103504. [Google Scholar] [CrossRef]
  5. Zhao, Y.R.; Yang, H.Q.; Huang, L.P.; Chen, R.; Chen, X.S.; Liu, S.Y. Mechanical behavior of intact completely decomposed granite soils along multi-stage loading–unloading path. Eng. Geol. 2019, 260, 105242. [Google Scholar] [CrossRef]
  6. Yoo, C.; Lee, D. Deep excavation-induced ground surface movement characteristics—A numerical investigation. Comput. Geotech. 2008, 35, 231–252. [Google Scholar] [CrossRef]
  7. Goh, A.T.C.; Zhang, R.H.; Wang, W.; Wang, L.; Liu, H.L.; Zhang, W.G. Numerical study of the effects of groundwater drawdown on ground settlement for excavation in residual soils. Acta Geotech. 2020, 15, 1259–1272. [Google Scholar] [CrossRef]
  8. Ng, C.W.W.; Fung, W.T.; Cheuk, C.Y.; Zhang, L. Influence of stress ratio and stress path on behavior of loose decomposed granite. J. Geotech. Geoenviron. Eng. 2004, 130, 36–44. [Google Scholar] [CrossRef]
  9. West, G.; Dumbleton, M.J. The mineralogy of tropical weathering illustrated by some west Malaysian soils. Q. J. Eng. Geol. Hydrogeol. 1970, 3, 25–40. [Google Scholar] [CrossRef]
  10. Agus, S.S.; Leong, E.C.; Rahardjo, H. Estimating permeability functions of Singapore residual soils. Eng. Geol. 2005, 78, 119–133. [Google Scholar] [CrossRef]
  11. Chiu, C.F.; Ng, C.W.W. Relationships between chemical weathering indices and physical and mechanical properties of decomposed granite. Eng. Geol. 2014, 179, 76–89. [Google Scholar] [CrossRef]
  12. Wang, Y.H.; Yan, R.W.M. Laboratory studies of two common saprolitic soils in Hong Kong. J. Geotech. Geoenviron. Eng. 2006, 132. [Google Scholar] [CrossRef]
  13. Junaideen, S.M.; Tham, L.G.; Law, K.T.; Dai, F.C.; Lee, C.F. Behaviour of recompacted residual soils in a constant shear stress path. Can. Geotech. J. 2010, 47, 648–661. [Google Scholar] [CrossRef]
  14. Lee, I.K.; Coop, M.R. The intrinsic behaviour of a decomposed granite soil. Géotechnique 1995, 45, 117–130. [Google Scholar] [CrossRef]
  15. Lumb, P. The residual soils of Hong Kong. Géotechnique 1965, 15, 180–194. [Google Scholar] [CrossRef]
  16. Wallace, K.B. Structural behaviour of residual soils of the continually wet Highlands of Papua New Guinea. Géotechnique 1973, 23, 203–218. [Google Scholar] [CrossRef]
  17. Rahardjo, H.; Satyanaga, A.; Leong, E.C.; Ng, Y.S.; Pang, H.T.C. Variability of residual soil properties. Eng. Geol. 2012, 141–142, 124–140. [Google Scholar] [CrossRef]
  18. Zhai, Q.; Rahardjo, H.; Satyanaga, A. Variability in unsaturated hydraulic properties of residual soil in Singapore. Eng. Geol. 2016, 209, 21–29. [Google Scholar] [CrossRef]
  19. Wang, Y.; Ng, C.W.W. Effects of stress paths on the small-strain stiffness of completely decomposed granite. Can. Geotech. J. 2005, 42, 1200–1211. [Google Scholar] [CrossRef]
  20. Yin, S.; Kong, L.W.; Zhang, X.W. Experimental study on stiffness characteristics of residual soil at small strain under hot and rainy climate. Chin. J. Geotech. Eng. 2017, 39, 743–751. [Google Scholar] [CrossRef]
  21. Agus, S.S.; Leong, E.C.; Rahardjo, H. Soil–water characteristic curves of Singapore residual soils. Geotech. Geol. Eng. 2001, 19, 285–309. [Google Scholar] [CrossRef]
  22. Ng, C.W.W.; Chiu, A.C.F. Laboratory study of loose saturated and unsaturated decomposed granitic soil. J. Geotech. Geoenviron. Eng. 2003, 129, 550–559. [Google Scholar] [CrossRef]
  23. Kim, C.K.; Kim, T.H. Behavior of unsaturated weathered residual granite soil with initial water contents. Eng. Geol. 2010, 113, 1–10. [Google Scholar] [CrossRef]
  24. Hossain, M.A.; Yin, J.H. Behavior of a compacted completely decomposed granite soil from suction controlled direct shear tests. J. Geotech. Geoenviron. Eng. 2010, 136, 189–198. [Google Scholar] [CrossRef]
  25. Hossain, M.A.; Yin, J.H. Shear strength and dilative characteristics of an unsaturated compacted completely decomposed granite soil. Can. Geotech. J. 2010, 47, 1112–1126. [Google Scholar] [CrossRef]
  26. Fonseca, A.V.D.; Fernandes, M.M.; Cardoso, A.S. Interpretation of a footing load test on a saprolitic soil from granite. Géotechnique 1997, 47, 633–651. [Google Scholar] [CrossRef] [Green Version]
  27. Ng, C.W.W.; Pun, W.K.; Pang, R.P.L. Small strain stiffness of natural granitic saprolite in Hong Kong. J. Geotech. Geoenviron. Eng. 2000, 126, 819–833. [Google Scholar] [CrossRef]
  28. Chang, M.F. In-situ testing of residual soils in Singapore. In Proceedings of the 2nd International Conference on Geomechanics in Tropical Soils, Singapore, 12–14 December 1988. [Google Scholar]
  29. Ng, C.W.W.; Wang, Y. Field and laboratory measurements of small strain stiffness of decomposed granites. Soils Found. 2001, 41, 57–71. [Google Scholar] [CrossRef] [Green Version]
  30. Fukumoto, T. A grading equation for decomposed granite soil. Soils Found. 1990, 30, 27–34. [Google Scholar] [CrossRef] [Green Version]
  31. Gutierrez, N.H.M.; de Nóbrega, M.T.; Vilar, O.M. Influence of the microstructure in the collapse of a residual clayey tropical soil. Bull. Eng. Geol. Environ. 2009, 68, 107–116. [Google Scholar] [CrossRef]
  32. Wesley, L. Influence of structure and composition on residual soils. J. Geotech. Eng. 1990, 116. [Google Scholar] [CrossRef]
  33. Coutinho, R.Q.; Silva, M.M.; Santos, A.N.d.; Lacerda, W.A. Geotechnical characterization and failure mechanism of landslide in granite residual soil. J. Geotech. Geoenviron. Eng. 2019, 145, 05019004. [Google Scholar] [CrossRef]
  34. Liu, P.; Chen, R.P.; Wu, K.; Kang, X. Effects of drying-wetting cycles on the mechanical behavior of reconstituted granite-residual soils. J. Mater. Civ. Eng. 2020, 32, 04020199. [Google Scholar] [CrossRef]
  35. Lambe, T.W. Stress path method. J. Soil Mech. Found. Div. 1967, 93, 309–331. [Google Scholar] [CrossRef]
  36. Yang, A.W.; Yang, S.K.; Zhang, Z.D. Experimental study of mechanical properties of dredger fill under different unloading rates and stress paths. Rock Soil Mech. 2020, 41, 2891–2900. [Google Scholar] [CrossRef]
  37. Ng, C.W.W. Stress paths in relation to deep excavations. J. Geotech. Geoenviron. Eng. 1999, 125, 357–363. [Google Scholar] [CrossRef]
  38. Rahardjo, H.; Lim, T.T.; Chang, M.F.; Fredlund, D.G. Shear-strength characteristics of a residual soil. Can. Geotech. J. 1995, 32, 60–77. [Google Scholar] [CrossRef]
  39. Rahardjo, H.; Heng, O.B.; Choon, L.E. Shear strength of a compacted residual soil from consolidated drained and constant water content triaxial tests. Can. Geotech. J. 2004, 41, 421–436. [Google Scholar] [CrossRef]
  40. Tang, L.S.; Sang, H.T.; Song, J.; LIU, F.T.; Yan, B.; Zhang, P.C. Research on soil particle joint function and brittle-elastoplastic cement damage model of unsaturated granite residual soil. Rock Soil Mech. 2013, 34, 2877–2888. [Google Scholar] [CrossRef]
  41. Kong, L.W.; Sayem, H.M.; Tian, H.H. Influence of drying–wetting cycles on soil-water characteristic curve of undisturbed granite residual soils and microstructure mechanism by nuclear magnetic resonance (NMR) spin-spin relaxation time (T2) relaxometry. Can. Geotech. J. 2018, 55, 208–216. [Google Scholar] [CrossRef] [Green Version]
  42. Dafalias, Y.F. An anisotropic critical state soil plasticity model. Mech. Res. Commun. 1986, 13, 341–347. [Google Scholar] [CrossRef]
  43. Amorosi, A.; Rollo, F.; Houlsby, G.T. A nonlinear anisotropic hyperelastic formulation for granular materials: Comparison with existing models and validation. Acta Geotech. 2020, 15, 179–196. [Google Scholar] [CrossRef]
  44. Dafalias, Y.F.; Taiebat, M. Anatomy of rotational hardening in clay plasticity. Géotechnique 2013, 63, 1406–1418. [Google Scholar] [CrossRef]
  45. Kavvadas, M.; Amorosi, A. A constitutive model for structured soils. Géotechnique 2000, 50, 263–273. [Google Scholar] [CrossRef]
  46. Wheeler, S.J.; Näätänen, A.; Karstunen, M.; Lojander, M. An anisotropic elastoplastic model for soft clays. Can. Geotech. J. 2003, 40, 403–418. [Google Scholar] [CrossRef]
  47. Anandarajah, A.; Dafalias, Y.F. Bounding surface plasticity. III: Application to anisotropic cohesive soils. J. Eng. Mech. 1986, 112, 1292–1318. [Google Scholar] [CrossRef]
  48. Banerjee, P.K.; Yousif, N.B. A plasticity model for the mechanical behaviour of anisotropically consolidated clay. Int. J. Numer. Anal. Methods Geomech. 1986, 10, 521–541. [Google Scholar] [CrossRef]
  49. Amorosi, A.; Rollo, F.; Dafalias, Y.F. Relating elastic and plastic fabric anisotropy of clays. Géotechnique 2020, 1–11. [Google Scholar] [CrossRef]
  50. Mofiz, S.A.; Taha, M.R.; Bari, M.N. Triaxial tests and model performance of stress-strain for decomposed granite. In Geotechnical Engineering for Transportation Projects; American Society of Civil Engineers: Reston, VA, USA, 2004; pp. 1795–1804. [Google Scholar]
  51. Madhusudhan, B.N.; Baudet, B.A. Influence of reconstitution method on the behaviour of completely decomposed granite. Géotechnique 2014, 64, 540–550. [Google Scholar] [CrossRef]
  52. Zhang, X.W.; Liu, X.Y.; Chen, C.; Kong, L.W.; Wang, G. Engineering geology of residual soil derived from mudstone in Zimbabwe. Eng. Geol. 2020, 277, 105785. [Google Scholar] [CrossRef]
  53. ASTM D422-63(2007). Standard Test Method for Particle-Size Analysis of Soils; ASTM International: West Conshohocken, PA, USA, 2007. [Google Scholar]
  54. Jaky, J. The coefficient of earth pressure at rest. J. Soc. Hung. Eng. Arch. 1944, 355–358. [Google Scholar]
  55. Wood, D.M. Soil Behaviour and Critical State Soil Mechanics; Cambridge University Press: New York, NY, USA, 1990. [Google Scholar]
  56. Atkinson, J.H. Non-linear soil stiffness in routine design. Géotechnique 2000, 50, 487–508. [Google Scholar] [CrossRef]
Figure 1. Stress paths involved during excavation of a foundation pit.
Applsci 11 01874 g001
Figure 2. Particle size distribution curve of the granite residual soil.
Applsci 11 01874 g002
Figure 3. Position of the granite residual soil in the Casagrande plasticity chart.
Applsci 11 01874 g003
Figure 4. Various stress paths for triaxial tests conducted on the granite residual soil.
Applsci 11 01874 g004
Figure 5. Results of ICD and ICU tests: (a) q−εs curves of ICD tests; (b) q−εs curves of ICU tests; (c) effective stress paths of ICD tests; (d) effective stress paths of ICU tests; (e) εv−εs curves of ICD tests; (f) εv−εs curves of ICU tests.
Applsci 11 01874 g005
Figure 6. Stress−strain curves and volumetric strain−shear strain curves of the soil in: (a) BL tests; (b) AL tests; (c) CP tests; (d) LU tests; (e) AU tests.
Applsci 11 01874 g006aApplsci 11 01874 g006b
Figure 7. Stress−strain curves and volumetric strain−shear strain curves of the soil under: (a) σ3c = 100 kPa; (b) σ3c = 200 kPa; (c) σ3c = 300 kPa; (d) σ3c = 400 kPa.
Applsci 11 01874 g007aApplsci 11 01874 g007b
Figure 8. Variations of: (a) (εs)50; (b) (εs)90 with consolidation pressure.
Applsci 11 01874 g008
Figure 9. Variations of: (a) (εs)50; (b) (εs)90 with loading angle.
Applsci 11 01874 g009
Figure 10. Variations of initial secant shear modulus with: (a) consolidation pressure; and (b) loading angle.
Applsci 11 01874 g010
Figure 11. Failure lines of the soil under different stress paths.
Applsci 11 01874 g011
Figure 12. Variations of cohesion and friction angle with loading angle.
Applsci 11 01874 g012
Table 1. Physical parameters of the granite residual soil.
Density
ρ (g/cm3)
Water Content w (%)Void Ratio eSpecific Gravity GsHydraulic Conductivity K (cm/s)Atterberg Limits (%)
WLWPIP
1.9826.70.742.721.79 × 10−458.927.331.6
Table 2. Mineral composition of the granite residual soil.
Mineral Composition (%)
QuartzKaoliniteIllite
70.427.12.5
Table 3. Summary of triaxial tests.
Test TypeSeriesK 1σ'3c (kPa)η 2Loading angle (°)Loading Rate
ICTT 3ICU 51100, 200, 300, 400371.60.05%/min
ICD 60.005%/min
SPTT 4increasing-p’BL 70.53100, 200, 300, 4001.556.3dq/dt = 8kPa/h
AL 8371.6
constant-p’CP 990
decreasing-p’LU 10−1.5123.7
AU 113251.6
1K denotes the consolidation stress ratio, σ'3c/σ'1c; 2 η denotes the shearing stress ratio, dq/dp; 3 ICTT (isotropic consolidation triaxial tests); 4 SPTT (stress path tests); 5 ICU (isotropic consolidation undrained tests); 6 ICD (isotropic consolidation drained tests); 7 BL (loading in both axial and lateral directions); 8 AL (axial-loading); 9 CP (constant p’); 10 LU (lateral-unloading); 11 AU (axial-unloading).
Table 4. Strength parameters of the isotropically consolidated UGRS.
Test TypeStrength Parameters
c (kPa)φ’ (degrees)
ICU14.928.2
ICD47.828.6
Table 5. Summary of (εs)50 and (εs)90 under decreasing-p’ stress paths.
σ'3c
(kPa)
α = 71.6° (Benchmark)α = 123.7°α = 251.6°
s)50 (%)(εs)90 (%)(εs)50 (%)RC1(εs)90 (%)RC(εs)50 (%)RC(εs)90 (%)RC
1001.0503.0950.28872.6%2.09232.4%0.36165.6%2.8408.2%
2001.1253.5690.42362.4%2.21937.8%0.49955.6%3.14511.9%
3001.2114.0100.44063.7%2.39340.3%0.54754.8%3.26618.5%
4001.3624.3380.44267.6%2.56141.0%////
1RC denotes the rate of change.
Publisher’s Note: MDPI stays neutral with regard to jurisdictional claims in published maps and institutional affiliations.

