Article

Effect of the Incoherent Encapsulation Layer and Oblique Sunlight Incidence on the Optical and Current-Voltage Characteristics of Surface-Textured Cu(In,Ga)Se2 Solar Cells Based on the Angle-Dependent Equispaced Thickness Averaging Method

1
Department of Information Display, Kyung Hee University, Seoul 02447, Korea
2
Department of Information and Communications Engineering, Myongji University, Yongin-si 17058, Korea
*
Author to whom correspondence should be addressed.
Appl. Sci. 2021, 11(5), 2121; https://doi.org/10.3390/app11052121
Submission received: 22 January 2021 / Revised: 20 February 2021 / Accepted: 23 February 2021 / Published: 27 February 2021
(This article belongs to the Section Optics and Lasers)

Abstract

:
In general, the optical and electrical characteristics of Cu(In,Ga)Se2 (CIGS) solar cells have been studied under the condition that sunlight is normally incident from the air to the CIGS solar cell having no thick front encapsulation layers. To obtain the calculation results in a realistic module application, we calculate the optical and current–voltage (J–V) characteristics of surface-textured CIGS solar cells by simultaneously considering the thick front encapsulation layers and oblique sunlight incidence. Using the proposed angle-dependent equispaced thickness averaging method (ADETAM), we incoherently model two successive front encapsulation layers of a cover glass layer and an ethylene vinyl acetate (EVA) layer, whose respective thicknesses are greater than the coherence length of sunlight (~0.6 μm). The angular dependences of reflectance spectrum and J–V curves are calculated and compared in a surface-textured CIGS solar cell with and without the inclusion of the two front encapsulation layers. We show that the optical absorption improvement of the surface-textured CIGS solar cell over the planar CIGS solar cell can be over-predicted when the thick front encapsulation layers are not considered in the optical modeling.

1. Introduction

Thin-film solar cells have been greatly studied as one of the promising alternatives to traditional silicon-based solar cells due to their potential to low cost and high efficiency [1]. Thin-film solar cells have been fabricated in various absorption materials such as amorphous silicon, organic compound, and Cu(In, Ga)Se2 (CIGS) [2,3,4]. Among them, the CIGS solar cell has reached a power conversion efficiency of beyond 20% owing to high optical absorption coefficient, wide absorption spectrum, and long material stability [5]. Furthermore, it has reached a power conversion efficiency of 23.35% with double buffer layers [6]. Generally, thin-film solar cells, including the CIGS solar cell, comprise thin multilayer on the order of sub-micrometer and a thick substrate on the order of one millimeter. Because of the optical interference effect, the absorption efficiency of the thin-film solar cell is greatly affected by the nano-meter-order thickness of the multilayer structure. Thus, optimizing the thickness of each thin layer based on accurate optical modeling is crucial to maximize the optical absorption in the active region and to improve the power conversion efficiency.
In the optical modeling of the thin-film solar cell, the coherence length of sunlight (~0.6 μm) [7], within which the phase information of sunlight is preserved, should be carefully considered. The sub-micrometer multilayer, covering an absorptive active region, a carrier transport layer, and a transparent electrode, can be modeled as optically coherent layers, where their reflectance and absorbance are affected by optical interference effect [3]. In contrast, the millimeter-order thick substrate has to be treated as an optically incoherent layer, within which the phase of light is randomly changed at each coherence length and optical interference effect disappears due to the averaging of optical responses over the random phase changes [8,9].
To calculate the reflectance or absorbance of this mixed coherent-incoherent thin-film solar cells, various analytical methods have been used for planar structures. In the generalized transfer matrix method (GTMM), the propagation behavior of the electric field intensity in planar incoherent layers was separately described by matrix formalism similar to the transfer matrix method (TMM) used in coherent planar multilayers [10,11]. In the case of the random phase method (RPM), coherent calculation results obtained by the TMM were averaged over thousands of random phase shifts added to a selected incoherent layer [12]. To reduce the computation time, coherent simulation results with respect to a set of equidistant phase shifts added to an incoherent layer were averaged in the equidistant phase method (EPM) [13]. Using the GTMM, our group successfully calculated and analyzed the optical absorption characteristics of a planar thin-film organic solar cell having an incoherent thick glass substrate in both normal and oblique incidence of sunlight [14,15].
Light absorption efficiency of planar thin-film solar cells can be improved by use of surface-textured structures, of which absorption characteristics cannot be calculated based on the above-mentioned analytical methods applied to planar structures. In this case, the numerical methods of the rigorous coupled wave analysis (RCWA) [16], the finite-difference time-domain (FDTD) [17,18], and the finite element method (FEM) [19,20,21] should be used, where wave equations are directly solved in a small mesh or grid for optical modeling. Because these numerical methods provide only coherent simulation results, an additional averaging procedure such as the so-called “spectral averaging method” (SAM) [9], the first-principle calculation [22], and “one-pass coherent calculation” [23] is required to include the incoherent characteristics of light propagation. However, these methods have very complicated mathematical and computational procedures, which result in a long computation time and implementation complexity [21]. Recently, we proposed a so-called “equispaced thickness averaging method” (ETAM) as a simple and efficient optical modeling method to calculate the incoherent characteristic of surface-textured thin-film solar cell [20]. In the numerical simulation of the ETAM, a millimeter-order incoherent layer could be converted into a micrometer-order coherent layer with a set of equispaced phase thicknesses and corresponding coherent simulation results were averaged. Using the ETAM, we successfully calculated the effect of the three successive incoherent layers on the absorption characteristics of a surface-textured CIGS solar cell in only normal incidence of sunlight [21].
The above-mentioned numerical modeling methods to consider the mixed coherent-incoherent characteristics of surface-textured thin-film solar cells have been performed under the condition that sunlight is normally incident from the air, which did not reflect a realistic deployment situation of thin-film solar cells. In a general deployment situation such as a rooftop application, the incidence angle of sunlight gradually varies during the daytime such that an optimized device structure of the surface-textured solar cell has to be determined in the consideration of the variation in the incidence angle and polarization of sunlight [15]. Moreover, in a realistic module configuration, millimeter thick front encapsulant and cover glass layers, which can provide a higher mechanical durability and operational stability, are deposited on the top contact layer. These front optically-incoherent encapsulation layers will affect the light absorption and power conversion efficiencies of surface-textured thin-film solar cell, which also has to be considered to obtain the accurate optical modeling results. However, the effects of both incoherent encapsulation layers and oblique sunlight incidence have not yet been simultaneously considered on the optical modeling of surface-textured CIGS solar cells.
In this paper, we calculate the optical and current–voltage (J–V) characteristics of surface-textured CIGS solar cells by simultaneously considering the front incoherent encapsulation layers and oblique sunlight incidence. We propose an angle-dependent equispaced thickness averaging method (ADETAM) that can calculate the incident-angle-dependent optical characteristics of the mixed coherent-incoherent solar cell by modifying the currently-used ETAM only applicable to the normal sunlight incidence. The layer structure of the CIGS solar cell includes two successive front encapsulation layers of a cover glass and an ethylene vinyl acetate (EVA), whose respective thicknesses are greater than the coherence length of sunlight (~0.6 μm). We verify the calculation accuracy of the ADETAM in a planar CIGS solar cell through a comparison with exact analytical results obtained by the GTMM. In a surface-textured CIGS solar cell, the reflectance spectra and J–V characteristics depending on the incidence angle and polarization of sunlight are calculated and compared when two successive encapsulation layers are included or not in the simulation. According to the calculation results, the output performance enhancement of the surface-textured CIGS solar cell over the planar CIGS solar cell can be over-predicted when the thick encapsulation layers are not considered in the optical modeling.

2. Theory of ADETAM

The theoretical formulation of the ADETAM, which is an averaging procedure for coherent simulation results to consider the incoherent characteristics in a mixed coherent-incoherent multiplayer, can be applied to both planar and non-planar structures. For convenience, we derive the theoretical formulation of the ADETAM in a planar mixed coherent-incoherent thin-film multilayer structure shown in Figure 1.
We assume that multiple incoherent layers, representing millimeter-order front encapsulation layers, lie in front of the coherent multilayer structure, which can range from a transparent conducting oxide (TCO) top contact to a metal back contact. The mixed coherent-incoherent multilayer is assumed to be sandwiched between a semi-infinite transparent ambient medium on the left (j = 0) and the right (j = n + 1). The multiple incoherent layers (j = 1, ···, m) are assumed to be transparent and the remaining coherent layers (j = m + 1, ···, n) can be either transparent and absorptive. All the layers are assumed to be isotropic and homogeneous with planar and parallel interfaces. When the thickness of each layer is dj, the corresponding complex refractive index is denoted by n ˜ j = n j + i κ j , where nj indicates the refractive index and κj represents the extinction coefficient, respectively. To optically model random phase variations in the incoherent layers, each incoherent layer (v = 1, ···, m) is divided into an initial layer of the original thickness dv and an additional phase-shift layer of the equispaced phase thickness bv [21].
We assume that a plane wave, which has the optical intensity of I0 at the wavelength of λ, is obliquely incident from the semi-infinite transparent ambient on the left (j = 0) with the incidence angle θ0. According to the Snell’s law, the refraction angle of each layer is determined by sin θ j = ( n 0 / n ˜ j ) sin θ 0 and k 0 = 2 π / λ is the magnitude of the wave number in the ambient (j = 0). When the light propagating from the left to the right denotes a positive direction, the light propagation in the positive and negative directions are expressed as + and − superscripts. The directions of the s- and p-polarized light are orthogonal to or parallel to the plane of incidence.
According to the TMM, the s(p)-polarized electric field amplitudes on the interface between the right boundary of the layer j and the left boundary of the layer k (j < k) are described by an interface matrix that is given by
[ E j R + , s ( p ) E j R , s ( p ) ] = I j k s ( p ) [ E k L + , s ( p ) E k L , s ( p ) ] = 1 t j k s ( p ) [ 1 r j k s ( p ) r j k s ( p ) 1 ] [ E k L + , s ( p ) E k L , s ( p ) ]
where r j k s ( p ) and t j k s ( p ) are the s(p)-polarized complex Fresnel reflection and transmission coefficients at the interface from the layer j to the layer k [15]. In the layer j, the electric field amplitudes at the left and right boundaries are related by a layer matrix, which is written as
[ E j L + , s ( p ) E j L , s ( p ) ] = L j s ( p ) [ E j R + , s ( p ) E j R , s ( p ) ] = [ e i β j d j 0 0 e i β j d j ] [ E j R + , s ( p ) E j R , s ( p ) ]
where β j = k 0 n ˜ j cos θ j is the propagation constant at the layer j. For the multiple incoherent layers (v = 1, ⋯, m), light propagation in each additional phase-shift layer can be expressed as
P v = [ e i θ v 0 0 e i θ v ] = [ e i k 0 n v cos θ v b v 0 0 e i k 0 n v cos θ v b v ] , a = 1 ,
where θ v = k 0 n v cos θ v b v ( 0 θ v π ) represents a random phase shift that light experience in the incoherent layer v. If the number of equispaced phase shifts for each incoherent layer is set to be X, the equispaced phase thickness bv can be determined by
b v q = λ 2 n v cos θ v q 1 X , q = 1 ,   2 ,   , X .   a = 1 ,
Because of the assumption that the incoherent layers are transparent, the values of the refractive index nv and refraction angle θv are real, which results in a real-valued equispaced phase thickness bv. In addition, the equispaced phase thickness bv are the same for both polarizations.
In Figure 1, the light propagation through the incoherent layers are written as
[ E 0 R + . s ( p ) E 0 R , s ( p ) ] = I 01 s ( p ) L 1 s ( p ) P 1 ( θ 1 ) I 12 s ( p ) I ( m 1 ) m s ( p ) L m s ( p ) P m ( θ m ) [ E m R + , s ( p ) E m R , s ( p ) ] = S i n c s ( p ) ( θ 1 q 1 , θ 2 q 2 , , θ m q m ) [ E m R + , s ( p ) E m R , s ( p ) ]
where S i n c s ( p ) ( θ 1 q 1 , θ 2 q 2 , , θ m q m ) indicates the system transfer matrix for the whole incoherent multilayer, of which the matrix elements depend on a combination of the equispaced phase shifts of θ 1 q 1 ( q 1 = 1 , , X ) , ···, and θ m q m ( q m = 1 , , X ) . In the remaining coherent multiple layers (j = m + 1, ···, n), the electric field amplitude propagating from the right-hand boundary of the rightmost incoherent layer (j = m) to the left-hand boundary of the layer j is described by
[ E m R + , s ( p ) E m R , s ( p ) ] = I m ( m + 1 ) s ( p ) L m + 1 s ( p ) I ( m + 1 ) ( m + 2 ) s ( p ) L j 1 s ( p ) I ( j 1 ) j s ( p ) [ E j L + , s ( p ) E j L , s ( p ) ] , = S m j s ( p ) [ E j L + , s ( p ) E j L , s ( p ) ] .
Then, the total system transfer matrix from the left ambient (j = 0) to the layer j is written as
[ E 0 R + . s ( p ) E 0 R , s ( p ) ] = S i n c s ( p ) ( θ 1 q 1 , θ 2 q 2 , , θ m q m ) S m j s ( p ) [ E j L + , s ( p ) E j L , s ( p ) ] , = S 0 j s ( p ) ( θ 1 q 1 , θ 2 q 2 , , θ m q m ) [ E j L + , s ( p ) E j L , s ( p ) ] , = [ S 0 j 11 , s ( p ) ( θ 1 q 1 , θ 2 q 2 , , θ m q m ) S 0 j 12 , s ( p ) ( θ 1 q 1 , θ 2 q 2 , , θ m q m ) S 0 j 21 , s ( p ) ( θ 1 q 1 , θ 2 q 2 , , θ m q m ) S 0 j 22 , s ( p ) ( θ 1 q 1 , θ 2 q 2 , , θ m q m ) ] [ E j L + , s ( p ) E j L , s ( p ) ] .
Based on the matrix elements in Equation (7), the front transmission coefficient propagating from the layer 0 to the layer j is determined by
t 0 j s ( p ) ( θ 1 q 1 , θ 2 q 2 , , θ m q m ) = E j L + , s ( p ) E 0 R + , s ( p ) = 1 S 0 j 11 , s ( p ) ( θ 1 q 1 , θ 2 q 2 , , θ m q m ) .
Similarly, the back reflection coefficient propagating from the layer j to the layer 0 is given by
r j 0 s ( p ) ( θ 1 q 1 , θ 2 q 2 , , θ m q m ) = E j L + , s ( p ) E j L , s ( p ) = S 0 j 12 , s ( p ) ( θ 1 q 1 , θ 2 q 2 , , θ m q m ) S 0 j 11 , s ( p ) ( θ 1 q 1 , θ 2 q 2 , , θ m q m ) .
When we focus on the absorption characteristics in the layer j within the coherent multilayer, the electric field intensity at the position z ( 0 z d j ) can expressed as [4]
| E j s ( p ) ( z ; θ 1 q 1 , θ 2 q 2 , , θ m q m ) | 2 = | t 0 j s ( p ) ( θ 1 q 1 , θ 2 q 2 , , θ m q m ) 1 + r j 0 s ( p ) ( θ 1 q 1 , θ 2 q 2 , , θ m q m ) e 2 i β j d j | 2 | e i β j z + r j ( n + 1 ) s ( p ) e i β j z | 2 | E 0 R + , s ( p ) | 2 .
Here, r j ( n + 1 ) s ( p ) is the reflection coefficient propagating from the coherent layer j to the right-hand ambient layer n + 1, which can be determined similarly to Equation (9) except the absence of the equispaced phase shifts. Correspondingly, the spatial distribution of light absorption within the layer j is calculated as [4,15]
Q j s ( p ) ( z ; θ 1 q 1 , θ 2 q 2 , , θ m q m ) = 1 2 c ε 0 n j α j | E j s ( p ) ( z ; θ 1 q 1 , θ 2 q 2 , , θ m q m ) | 2 ,
where c is the speed of light in free space, ε0 is the electric permittivity in free space, and αj = 4πκj is the absorption coefficient of the layer j.
In the ADETAM, the incoherent characteristics of light propagation within the incoherent multilayer (v = 1, ···, m) can be considered by averaging coherent calculation results over a set of equispaced phase thicknesses. The ADETAM-applied electric field intensity is given by
| E ¯ j s ( p ) ( z ) | 2 = 1 X m v = 1 m q v = 1 X | E j ( z ; θ 1 q 1 , , θ v q v , , θ m q m ) | 2 ,
where X m is the number of total coherent calculations required to include the incoherent effect of m multiple incoherent layers. Hence, the ADETAM-applied spatial distribution of light absorption within the layer j is expressed as
Q ¯ j s ( p ) ( z ) = 1 2 c ε 0 n j α j | E ¯ j s ( p ) ( z ) | 2 .
Then, the ADETAM-applied spectral absorbance at the layer j is
A ¯ j s ( p ) = 1 I 0 s ( p ) 0 d j Q ¯ j s ( p ) ( z ) d z ,
where I 0 s ( p ) is the optical power of the s(p)-polarized incident light at the wavelength of λ. Finally, the ADETAM-applied total reflectance in Figure 1 can be calculated as
R ¯ t o t s ( p ) = 1 A ¯ t o t s ( p ) = 1 j = m + 1 n A ¯ j s ( p ) ,
where we assume that the incident sunlight is totally absorbed in the active region or metal electrode without transmitting to the ambient medium on the right (j = n + 1), which is valid if the metal back contact layer is sufficiently thick

3. Optical Modeling Results

3.1. Planar CIGS Solar Cells

Figure 2a shows a schematic diagram of the planar CIGS solar cell used in this calculation [24]. The sunlight with the incidence angle of θ0 is incident from the air to the CIGS solar cell, which can be considered as a mixed incoherent–coherent system. The spectral irradiance of sunlight is assumed to follow the air mass (AM) 1.5 sunlight with a total power of S0 = 100 mW/cm2, which is shown in inset of Figure 2a. Because sunlight is unpolarized, the incidence optical powers of s- and p-polarized light are equally distributed at each incidence angle of θ0. The CIGS solar cell is composed of a 3 mm cover glass at the top, a 0.5 mm EVA layer as a surface flattening layer, 50 nm aluminum-doped zinc oxide (AZO) as a TCO, 10-nm zinc sulfide (ZnS) as an n-doped layer, 2 μm CIGS as a p-doped active layer, and 400 nm molybdenum (Mo) as a bottom contact layer [24]. The bottom glass substrate and EVA layer are not included in this calculation because they have no effect on the optical and electrical characteristics of the CIGS solar cell. Figure 2b shows the complex refractive index spectra of the materials used in the CIGS solar cell, which are taken from the literature (CIGS, ZnS, AZO, and Mo) [25,26,27]. It is well known that the complex refractive index of semiconductor materials depends on doping concentration. In particular, the variation of Al dopant concentration significantly changes the complex refractive index of AZO thin films [28,29]. In this study, the donor concentration of the ZnS and acceptor concentration of the CIGS are set to be 5 × 1016 cm−3 and 3 × 1016 cm−3, respectively [24]. According to the complex refractive index spectra of the AZO shown in Figure 2b, the Al concentration of the AZO is speculated to be 2 wt% in reference to the measured complex refractive index spectra of the AZO in [28].
In this calculation, the front encapsulation layers of the cover glass and EVA are assumed to be transparent at the wavelength range between 300 and 1100 nm. In general, the cover glass and EVA has high absorption at the wavelength range between 300 and 350 nm [30,31]. However, our assumption that the cover glass and EVA are transparent between 300 and 350 nm will not significantly change the calculation results of optical absorption at the ZnS/CIGS active layers, where the generated electron-hole pairs contribute to the short-circuit current density (JSC). The first reason is that the AZO, of which complex refractive index spectrum is shown in Figure 2, also has very high extinction coefficient at the wavelength range between 300 and 350 nm. Hence, most of incident sunlight within these wavelength ranges is absorbed at the AZO TCO, which results in very low external quantum efficiency at the wavelength range between 300 and 350 nm [24]. Secondly, the amount of the AM1.5 sunlight irradiance at the wavelength range between 300 and 350 nm, shown in the inset of Figure 2a, is relatively lower than that of the AM1.5 sunlight irradiance at the other wavelengths, which indicates that the contribution of JSC generated at the wavelength range between 300 and 350 nm is relatively small.
Both the 3 mm cover glass and 0.5 mm EVA layers, the thicknesses of which are greater than the coherence length of sunlight (~0.6 μm), are treated as incoherent. Because the cover glass and the EVA flattening layers are assumed to be transparent, both layers are modeled as the 1 μm thick initial layer plus the respective phase-shift layer whose thicknesses b 1 q 1 and b 2 q 2 are determined based on Equation (4) when the ADETAM is applied to calculate the effect of the incoherent front glass and EVA layers in the simulation. The remaining layers from the AZO TCO to the Mo bottom contact are considered as coherent. As will be shown in Figure 3, most of light are absorbed near the ZnS/CIGS interface and a part of light reflected from the Mo bottom contact layer is negligible. Although the 2 μm thickness of the CIGS layer is greater than the coherence length of sunlight (~0.6 μm), it can be treated as a coherent layer because no optical interference effect is observed in the light absorption profiles of the CIGS layer.The optical modeling of the planar CIGS solar cell is numerically performed based on the two-dimensional (2D) FEM, where the RF module of COMSOL Multiphysics is used as a simulation platform [32]. The wave equation is numerically solved at very tiny meshes of the simulation domains with appropriate boundary conditions. We use the port boundary condition at the uppermost boundary of the air domain, where a plane wave having the wavelength of λ and the incidence angle of θ0, is generated for either s and p polarization. The wavelength-dependent input power of the incident plane wave for each polarization is determined by (1/2)S(λ)dλ, where S(λ) indicates the spectral irradiance of the AM 1.5 sunlight shown in Figure 2a. Because the AM 1.5 sunlight is unpolarized, a factor of 1/2 is included to represent the incident optical power for each polarization. In this simulation, the spectral irradiance of the AM 1.5 sunlight between 300 and 1100 nm is divided with the wavelength spacing of dλ = 10 nm. The port boundary condition applied to the lowermost boundary suppresses the artificial reflection at the bottom boundary. In addition, the Floquet periodic boundary conditions are used at the leftmost and rightmost boundaries of the simulation domain.
To show how the light absorption takes place within the planar CIGS solar cell, two FEM simulation results, calculated at the single wavelength of 400 nm, are represented in Figure 3. Here, spectral 2D coherent calculation results of the electric field amplitude and optical absorption are obtained at the wavelength of 400 nm when the equispaced phase thicknesses in the phase-shift layers are zero ( b 1 1 = b 2 1 = 0 ). The 400 nm input plane wave with the surface power density of 5.57 W/m2 has the incidence angle of 45° for both polarizations. The 2D spatial profiles of the electric field amplitude have a tilted wavy pattern, which is ascribed to the interference between the obliquely incident and reflected lights. On the other hand, the spatial profiles of optical absorption depend only on the longitudinal z-direction and have no spatial dependence in the transverse x-direction, which results from the fact that optical power only flows into the longitudinal z direction.
When the ADETAM is applied to the incoherent modeling of a mixed coherent-incoherent multilayer, the accuracy of the calculation results converges if the number of the equispaced phase thicknesses is greater than five [20,21]. In this calculation, we set the number of equispaced phase thicknesses in the phase-shift layer to be ten. According to Equation (4), the equispaced phase thickness of the phase-shift layer at the wavelength of λ can be
b 1 1 = 0 ,   b 1 1 = λ 20 n g cos θ 1 ,   ,   b 1 9 = 8 λ 20 n g cos θ 1 ,   b 1 10 = 9 λ 20 n g cos θ 1 ,
b 2 1 = 0 ,   b 2 1 = λ 20 n E V A cos θ 2 ,   ,   b 2 9 = 8 λ 20 n E V A cos θ 2 ,   b 2 10 = 9 λ 20 n E V A cos θ 2 .
Here, ng and θ1 are the refractive index and refraction angle of the cover glass while nEVA and θ2 are those of the EVA layer. At each combination of equispaced phase thicknesses in the two incoherent layers, FEM-based numerical solutions of the optical absorption profiles such as those in Figure 4 are obtained at every mesh point. Then, the ADETAM-applied optical absorption in Equation (13) is obtained by averaging a total of 102 = 100 different coherently calculated electric field intensities at each mesh point.
To verify the validity of the calculation results based on the proposed ADETAM, the ADETAM-applied calculation results are compared with those obtained by the GTMM. Figure 4 shows the calculated spectral spatial distributions of light absorption obtained by the ADETAM and the GTMM when the input plane wave with the wavelength of λ = 400 nm and the surface power density of 5.57 W/m2 has the incidence angle of θ0 = 0°, 30°, 45°, and 60° for both polarizations. The calculated spectral spatial absorption profiles obtained by the ADETAM are well matched with the exact analytical results calculated by the GTMM, which includes the optically incoherent characteristics of the cover glass and EVA layers. Figure 5 shows a comparison of the calculated reflectance spectra of the planar CIGS solar cell between the ADETAM and the GTMM at various incidence angles for s- and p-polarized light. The reflectance spectra calculated by the ADETAM are well matched with those obtained by GTMM for all the incidence angles and polarizations of sunlight.

3.2. Surface-Textured CIGS Solar Cells

Figure 6a shows a schematic diagram of the surface-textured CIGS solar cell including the front incoherent encapsulation of the cover glass/EVA layers. The interfaces of the EVA/AZO/ZnS/CIGS multilayer are assumed to be randomly textured with the root-mean-square (RMS) surface roughness of σRMS, which enhances light absorption caused by the scattering effect. The thickness of each layer, along with its complex refractive index, is the same as that of the planar CIGS solar cell in Figure 2. Figure 6b shows incoherent multiple optical reflections inside the planar cover glass layer. A 2D FEM simulation is performed in the surface-textured CIGS solar cell with the same boundary conditions used for the planar CIGS solar cell. To investigate how the degree of the surface roughness affects the absorption characteristics of the surface-textured CIGIS solar cell, calculation results are obtained at four values of σRMS = 25, 50, 75, and 100 nm.
Because the 3 mm cover glass and the 0.5 mm EVA flattening layers are transparent, these incoherent layers are modelled as the 1 μm thick initial layer plus the respective phase-shift layer whose thicknesses b1 and b2 are determined based on Equation (4) in the ADETAM-based calculation. To show how the light absorption takes place within the surface-textured CIGS solar cell, two FEM simulation results, calculated at the single wavelength of 400 nm, are represented in Figure 7. Here, spectral 2D coherent calculation results of the optical absorption in the surface-textured CIGIS solar cell are obtained at the wavelength of 400 nm when the equispaced phase thicknesses in the phase-shift layers are zero. The RMS surface roughness is set to be σRMS = 100 nm. The 400 nm input plane wave with the surface power density of 5.57 W/m2 has the incidence angle of 45° for both s and p polarizations. To clarify the spectral optical absorption profile near the ZnS/CIGS interface, all the calculation results are shown near the ZnS/CIGS interface. The absorption distributions of the surface-textured CIGS solar cell are not uniform due to the optical scattering, which is different from those of the planar CIGS solar cell in Figure 4. At each combination of equispaced phase thicknesses, FEM-based coherent numerical results of the optical absorption profiles such as those in Figure 7 are calculated at each combination of the wavelength, polarization, and RMS surface roughness. In the ADETAM-based calculation, a total of 102 = 100 optical absorption profiles are averaged at each mesh point. In addition, at each RMS surface roughness, ADETAM-based calculation results are averaged over three different arbitrarily-textured surfaces with the same RMS roughness to simulate CIGS solar cells with random surface-texture.
Figure 8 shows the calculated ADETAM-applied reflectance spectra of the surface-textured CIGS solar cell at various incidence angles of sunlight when the RMS surface roughness is σRMS = 25, 50, 75, and 100 nm. Because we assume that unpolarized sunlight has the equal contribution of s and p polarizations, the total reflectance spectrum at each incidence angle are obtained by the average over the reflectance spectrum of s-polarized light and that of p-polarized light. For comparison, the reflectance spectra of the planar CIGS solar cell are also plotted at each incidence angle of sunlight. In Figure 8, the spectral responses of the reflectance in the surface-textured CIGS solar cell are lower than those in the planar CIGS solar cell for all the incidence angles, which verifies the enhancement of light absorption in the surface-textured CIGS solar cell. As the RMS surface roughness increases, the total reflectance becomes lower, which agrees with the experimental results in the literature [33].
In Figure 8, as the RMS surface roughness of the surface-textured CIGS solar cell increases, the reflectance of the surface-textured CIGS solar cell decreases and converges to a certain value, which results from the incoherent multiple optical reflections inside the planar cover glass layer, as shown in Figure 6b. The scattering effect of the surface-textured structure cannot affect the incoherent multiple reflection caused by the front encapsulation layers, which will limit the absorption enhancement of the surface-textured CIGS solar cell. Because we assume two front encapsulation layers to be transparent, the reflectance caused by the incoherent multiple optical reflections can be calculated by [34]
R i n c = R g a + R g E V A 2 R g a R g E V A 1 R g a R g E V A .
Here, Rg-a is the reflectance from the cover glass to the air and Rg-EVA is the reflectance from the cover glass to the EVA. The values of Rg-a and Rg-EVA are determined by the Fresnel equation, which depends on the refraction angle and light polarization [15]. The black dotted lines in Figure 8 show the calculated values of the incidence-angle-dependent reflectance of the incoherent multiple optical reflections, which are well matched with the minimum reflectance values of the surface-textured CIGS solar cell with σRMS = 100 nm.

4. Electrical Modeling Results

4.1. Electrical Modeling Procedure

The J–V characteristics of the CIGS solar cell are calculated based on the 2D numerical solution of the drift-diffusion model, which is expressed as [24]
J n ( r ) = q μ n n ( r ) V ( r ) + q D n n ( r ) ,
J p ( r ) = q μ p p ( r ) V ( r ) q D p p ( r ) ,
ε 0 [ ε r V ( r ) ] = q [ n ( r ) p ( r ) + N A ( r ) N D + ( r ) ] ,
( 1 / q ) J n ( r ) = [ G ( r ) R ( r ) ] ,
( 1 / q ) J p ( r ) = [ G ( r ) R ( r ) ] ,
where q is the basic electric charge. In the current equation of Equations (19) and (20), J n ( r ) and J p ( r ) are electron and hole current densities when μ n ( p ) and D n ( p ) represent electron (hole) mobility and diffusion coefficient, respectively. The terms n ( r ) , p ( r ) , and V ( r ) indicate the electron concentration, hole concentration, and electric potential, which are related through the Poisson equation of Equation (21) when ε r , N A ( r ) , and N D + ( r ) are the dielectric constant, acceptor concentration, and donor concentration. In the continuity equation of Equations (22) and (23), G ( r ) represents the generation rate of the electron-hole pair and can be obtained by
G ( r ) = S ( λ ) ( Q ¯ s ( λ , r ) + Q ¯ p ( λ , r ) ) / 2 h c / λ d λ ,
where h is the Plank constant, and c is the speed of light in a free space. The ADETAM-applied spatial distribution of light absorption for s(p)-polarized light is Q ¯ s ( p ) ( λ , r ) , whose values are averaged to represent unpolarized light. Finally, R ( r ) represents the recombination rate of the electron-hole pair and is given by
R ( r ) = R S R H ( r ) + R r a d ( r ) ,
where R S R H ( r ) and R r a d ( r ) are the non-radiative Shockley–Read–Hall (SRH) recombination and radiative recombination rates [33].
The 2D drift-diffusion model, shown in Equations (19)–(25), are numerically solved through the semiconductor module of the COMSOL Multiphysics [32]. In the 2D simulation domains of the planar CIGS solar cell in Figure 2a and surface-textured CIGS solar cell in Figure 6a, both the top anode terminal of the AZO/ZnS interface and the bottom cathode terminal of the Mo/CIGS interface are assumed to be ideal Schottky contacts. The J–V characteristics are calculated at only the regions containing the ZnS and CIGS layer. To minimize the error of a mismatch, the electrical modeling is performed under the same mesh configuration as the optical modeling. The periodic conditions are applied at the leftmost and rightmost boundaries of the simulation domain. The simulation parameters used in the electrical modeling are obtained in [33].

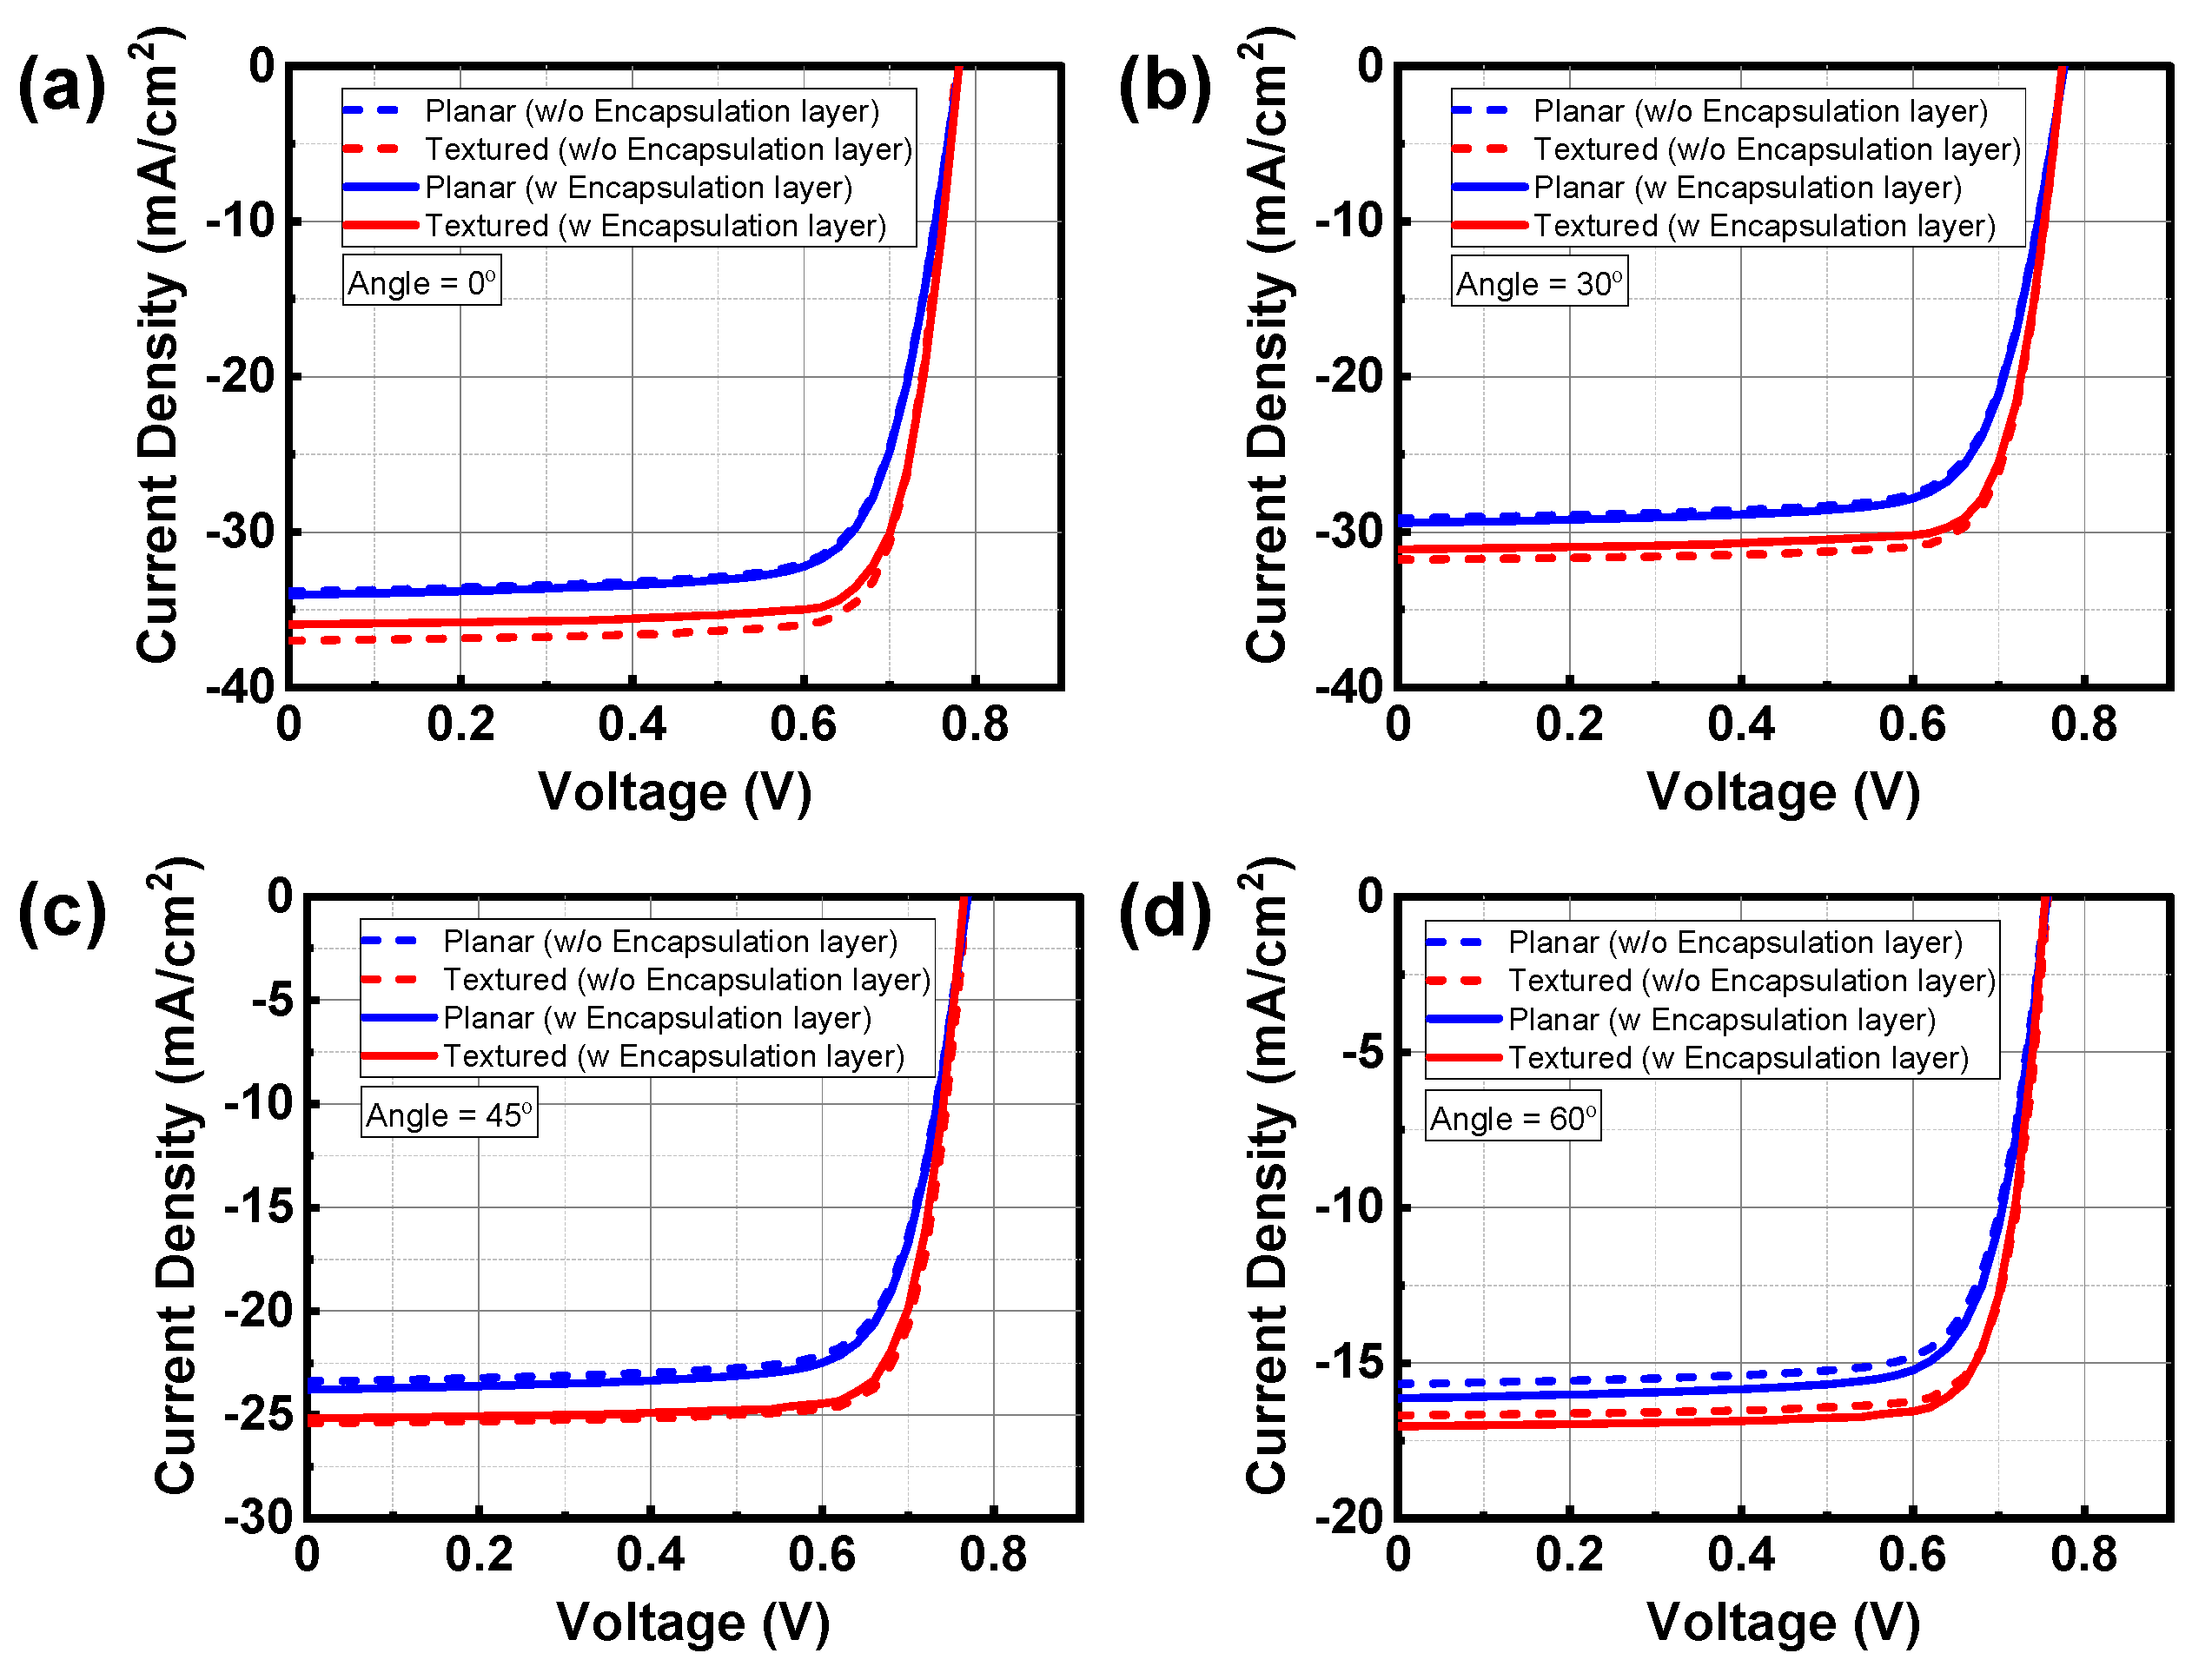
4.2. Comparison of the J–V Characteristics without and with the Inclusion of the Incoherent Front Encapsulation Layers

To investigate the effect of the front incoherent encapsulation layers on output performance of the surface-textured CIGS solar cell, the angular dependences of reflectance spectrum and J–V curves are calculated and compared between the planar and the surface-textured CIGS solar cells without and with the inclusion of the two front encapsulation layers, as shown in Figure 9. In Figure 9a,c, the multilayer structures of the planar and surface-textured CIGS solar cells are the same as those in Figure 2a and Figure 6a except the incoherent front encapsulation layers. In this case, sunlight is assumed to be directly incident from the air to the AZO/ZnS/CIGS/Mo layer, all of which is treated coherently. The device structures of the planar and surface-textured CIGS solar cell with two front encapsulation layers are the same as those in Figure 2a and Figure 6a. The RMS surface roughness of the surface-textured structure is set to be σRMS = 100 nm, which show the minimum reflectance in Figure 8. Here, we will focus on how the absorption and short-circuit current enhancement of the surface-textured CIGS solar cell over the planar CIGS solar cell can be changed whether the front incoherent encapsulation layers are included or not in the optical modeling.
Figure 10 shows the calculated reflectance spectra of the surface-textured CIGS solar cell without and with the inclusion of the front incoherent layers when the incidence angle of the AM 1.5 sunlight is 0°, 30°, 45°, and 60°. For reference, the reflectance spectra of the planar CIGS solar cell are also calculated. According to the Fresnel equation, the reflectance of the planar interface between two media is proportional to the refractive-index difference of the two media [35]. In reference to the complex refractive index spectra of the materials in Figure 2b, the refractive index of the cover glass, which is very close to that of the EVA, is smaller than that of the AZO, ZnS, or CIGS. Because of the optical interference effect in the AZO/ZnS/CIGS/Mo multilayer, the reflectance of the planar CIGS solar cell without the front encapsulation layers can be lower than that of the CIGS solar cell with the front encapsulation layers in a relatively narrow spectral range around 500 nm. However, overall reflectance of the planar CIGS solar cell with the front encapsulation layers is lower than that of the CIGS solar cell without the front encapsulation layers. This is ascribed to the fact that the refractive-index difference between the air and the cover glass is less than the refractive-index difference between the air and the AZO TCO.
When the AM 1.5 sunlight is normally incident (θ0 = 0°) in Figure 10a, the reflectance of the surface-textured CIGS solar cell without the front encapsulation layers has a very small value of less than 5% in nearly all the wavelength ranges. This results from the significant reduction of reflectance caused by light scattering effect at the surface-textured interface between the air and the AZO TCO. On the other hand, the reflectance of the surface-textured CIGS solar cell with the front encapsulation layers, which is determined by the incoherent multiple optical reflections as shown in Figure 8, is greater than that of the surface-textured CIGS solar cell without the front encapsulation layers. As the incidence angle of sunlight increases from θ0 = 0°, the degree of increase in reflectance of the surface-textured CIGS solar cell without the front encapsulation layers is relatively higher than that of the surface-textured CIGS solar cell with the front encapsulation layers. Thus, when the incidence angle of the AM 1.5 sunlight is θ0 = 60° in Figure 10d, the reflectance of the surface-textured CIGS solar cell without the front encapsulation layers is either lower than or higher than that of the surface-textured CIGS solar cell with the front encapsulation layers in reference to the wavelength of 690 nm.
Figure 11 shows the calculated J–V curves of four different device structures when the incidence angles of the AM 1.5 sunlight are 0°, 30°, 45°, and 60°. The corresponding values of JSC are summarized in Table 1. In the case of surface-textured CIGS solar cells, optical calculation results are averaged over three different arbitrarily-textured surfaces at each RMS roughness to simulate CIGS solar cells with random surface-texture. This averaging procedure for the surface-textured CIGS solar cells can cause the deviation of the calculation results of JSC in Table 1. The calculated standard deviations of JSC for the surface-textured CIGS solar cell without the front encapsulation layer are 0.18, 0.23, 0.22, and 0.34 at the incidence angles of 0°, 30°, 45°, and 60°, respectively. In the case of the surface-textured CIGS solar cell with the front encapsulation layer, the calculated standard deviations of JSC are 0.04, 0.08, 0.08, and 0.06 at the incidence angles of 0°, 30°, 45°, and 60°, respectively. Because of the larger refractive-index difference between the air and the TCO, the standard deviation of JSC is speculated to be greater for the surface-textured CIGS solar cell without front encapsulation layer. According to the calculated standard deviations for the surface-textured CIGS solar cells, all the calculation results of JSC are speculated to be within the error range. The surface-textured CIGS solar cells have a larger value of JSC than the planar CIGS solar cells due to the reflectance reduction and absorption enhancement caused by the scattering effect of the surface-textured structure. It is noticeable that the improvement percentage of JSC in the surface-textured CIGS solar cell over the planar CIGS solar cell is different whether the front incoherent encapsulation layers are included or not. According to the calculation results in Table 1, the improvement percentages of JSC in the surface-textured CIGS solar cell without the front encapsulation layers are 9.31%, 9.17%, 8.55%, and 6.38% at the AM 1.5 sunlight incidence angle of 0°, 30°, 45°, and 60°, respectively. On the other hand, the improvement percentages of JSC in the surface-textured CIGS solar cell with the front encapsulation layers are 5.58%, 5.74%, 5.76%, and 5.51% at the same incidence angle. Thus, the absorption enhancement of the surface-textured CIGS solar cell over the planar CIGS solar cell can be over-predicted when the thick encapsulation layers are not considered in the numerical calculation.

5. Conclusions

We numerically investigated the effect of the incoherent encapsulation layer and oblique sunlight incidence on the reflectance spectra and J–V curves of surface-textured CIGS solar cells. The optical modeling of the two incoherent encapsulation layers was performed based on the proposed ADETAM, which provided the incident-angle-dependent reflectance spectra of the mixed coherent-incoherent planar and surface-textured CIGS solar cells. The calculation accuracy of the ADETAM was verified in a planar CIGS solar cell through a very good agreement with exact analytical results obtained by the GTMM. In addition, The J–V curve of the CIGS solar cell was calculated based on the 2D FEM-based numerical solution of the drift-diffusion model.
To investigate the effect of the front incoherent encapsulation layers on output performance of the CIGS solar cell, the angular dependences of reflectance spectrum and J–V curves were calculated and compared in both planar and surface-textured CIGS solar cells with and without the inclusion of the two front encapsulation layers. The calculated reflectance of the planar CIGS solar cell with the front encapsulation layers was greater than that of the planar CIGS solar cell without the front encapsulation layers because the refractive-index difference between the air and the cover glass was less than the refractive-index difference between the air and the AZO TCO. In contrast, the calculated reflectance of the surface-textured CIGS solar cell with the front encapsulation layers was lower than that of the surface-textured CIGS solar cell without the front encapsulation layers. This was ascribed to the fact that the reflectance of the surface-textured CIGS solar cell with the front encapsulation layers, which was determined by the incoherent multiple optical reflections, was greater than that of the surface-textured CIGS solar cell without the front encapsulation layers, where the significant reflectance reduction caused by light scattering effect occurred at the surface-textured interface between the air and the AZO TCO. Correspondingly, the improvement percentages of JSC in the surface-textured CIGS solar cell over the planar CIGS solar cell with the front encapsulation layers are lower than that in the surface-textured CIGS solar cell over the planar CIGS solar cell without the front encapsulation layers. Thus, the output performance of the surface-textured CIGS solar cell over the planar CIGS solar cell can be over-predicted when the thick encapsulation layers are not considered in the optoelectronic modeling. We expect that the proposed ADETAM, together with comprehensive numerical modeling and analysis, will give a deeper understanding on the simultaneous effect of the thick front encapsulation layers and oblique sunlight incidence on output performance of the CIGS solar cells and help to provide a more efficient optical design of thin-film CIGS solar cells in the consideration of realistic deployment situations.

Author Contributions

Conceptualization, J.K. (Jungho Kim); methodology, G.L. and J.K. (Jungho Kim); software, G.L., J.K. (Jiyong Kim) and S.K.; validation, G.L., J.K. (Jiyong Kim), S.K. and J.K. (Jungho Kim); formal analysis, G.L., S.K. and J.K. (Jungho Kim); investigation, G.L and J.K. (Jungho Kim); writing—original draft preparation, J.K. (Jungho Kim); writing—review and editing, G.L., J.K. (Jiyong Kim), S.K. and J.K. (Jungho Kim); visualization, G.L. and J.K. (Jungho Kim); supervision, S.K. and J.K. (Jungho Kim); project administration, S.K. and J.K. (Jungho Kim); funding acquisition, S.K. and J.K. (Jungho Kim). All authors have read and agreed to the published version of the manuscript.

Funding

This research was supported by the Korea Electric Power Corporation (grant number: R17XA05-14) and by the Basic Science Research Program through the National Research Foundation of Korea (NRF) funded by the Ministry of Education (grant number: NRF-2018R1D1A1B07047249).

Institutional Review Board Statement

Not applicable.

Data Availability Statement

Not applicable.

Conflicts of Interest

The authors declare no conflict of interest.

References

  1. Green, M.A.; Emery, K.; Hishikawa, Y.; Warta, W.; Dunlop, D.E. Solar cell efficiency tables (version 39). Prog. Photovolt. Res. 2012, 20, 12–20. [Google Scholar] [CrossRef]
  2. Green, M.A. Silicon photovoltaic modules: A brief history of the first 50 years. Prog. Photovolts. Res. App. 2005, 13, 447–455. [Google Scholar] [CrossRef]
  3. Pettersson, L.A.A.; Roman, L.S.; Inganäs, O. Modeling photocurrent action spectra of photovoltaic devices based on organic thin films. J. Appl. Phys. 1999, 86, 487–496. [Google Scholar] [CrossRef]
  4. Repins, I.; Contreras, M.A.; Egaas, B.; DeHart, C.; Scharf, J.; Perkins, C.L.; To, B.; Noufi, R. 19.9%-efficient ZnO/CdS/CuInGaSe2 solar cell with 81.2% fill factor. Prog. Photovoltaics Res. Appl. 2008, 16, 235–239. [Google Scholar] [CrossRef] [Green Version]
  5. Jackson, P.; Wuerz, R.; Hariskos, D.; Lotter, E.; Witte, W.; Powalla, M. Effects of heavy alkali elements in Cu(In,Ga)Se2 solar cells with efficiencies up to 22.6%. Phys. Status Solidi Rapid Res. Lett. 2016, 10, 583–586. [Google Scholar] [CrossRef] [Green Version]
  6. Nakamura, M.; Yamaguchi, K.; Kimoto, Y.; Yasaki, Y.; Kato, T.; Sugimoto, H. Cd-free Cu(In,Ga)(Se,S)2 thin-film solar cell with record efficiency of 23.35%. IEEE J. Photovolt. 2019, 9, 1863–1867. [Google Scholar] [CrossRef]
  7. Donges, A. The coherence length of black-body radiation. Eur. J. Phys. 1998, 19, 245–249. [Google Scholar] [CrossRef]
  8. Mitsas, C.L.; Siapkas, D.I. Generalized matrix method for analysis of coherent and incoherent reflectance and transmittance of multilayer structures with rough surfaces, interfaces, and finite substrates. Appl. Opt. 1995, 34, 1678–1683. [Google Scholar] [CrossRef] [PubMed]
  9. Lee, W.; Lee, S.-Y.; Kim, J.; Kim, S.C.; Lee, B. A numerical analysis of the effect of partially-coherent light in photovoltaic devices considering coherence length. Opt. Express. 2012, 20, A941–A953. [Google Scholar] [CrossRef]
  10. Katsidis, C.C.; Siapkas, D.I. General transfer-matrix method for optical multilayer systems with coherent, partially coherent, and incoherent interference. Appl. Opt. 2002, 41, 3978–3987. [Google Scholar] [CrossRef]
  11. Centurioni, E. Generalized matrix method for calculation of internal light energy flux in mixed coherent and incoherent multilayers. Appl. Opt. 2005, 44, 7532–7539. [Google Scholar] [CrossRef]
  12. Troparevsky, M.C.; Sabau, A.S.; Lupini, A.R.; Zhang, Z. Transfer-matrix formalism for the calculation of optical response in multilayer systems: From coherent to incoherent interference. Opt. Express. 2020, 18, 24715–24721. [Google Scholar] [CrossRef]
  13. Santbergen, R.; Smets, A.H.M.; Zeman, M. Optical model for multilayer structures with coherent, partly coherent and incoherent layers. Opt. Express. 2013, 21, A262–A267. [Google Scholar] [CrossRef] [Green Version]
  14. Jung, S.; Kim, K.Y.; Il Lee, Y.; Youn, J.H.; Moon, H.T.; Jang, J.; Kim, J. Optical modeling and analysis of organic solar cells with coherent multilayers and incoherent glass substrate using generalized transfer matrix method. Jpn. J. Appl. Phys. 2011, 50, 122301. [Google Scholar] [CrossRef]
  15. Lee, S.; Jeong, I.; Kim, H.P.; Hwang, S.Y.; Kim, T.J.; Kim, Y.D.; Jang, J.; Kim, J. Effect of incidence angle and polarization on the optimized layer structure of organic solar cells. Sol. Energy Mater. Sol. Cells 2013, 118, 9–17. [Google Scholar] [CrossRef]
  16. Kim, S.C. Simulation of rough surface of CIGS (CuInGaSe) solar cell by RCWA (rigorous coupled wave analysis) considering the incoherency of light. J. Opt. Soc. Korea 2014, 18, 180–183. [Google Scholar] [CrossRef] [Green Version]
  17. Ganapati, V.; Miller, O.D.; Yablonovitch, E. Light trapping textures designed by electromagnetic optimization for subwavelength thick solar cells. IEEE J. Photovolt. 2014, 4, 175–182. [Google Scholar] [CrossRef] [Green Version]
  18. Parsons, R.; Tamang, A.; Jovanov, V.; Wagner, V.; Knipp, D. Comparison of light trapping in silicon nanowire and surface textured thin-film solar cells. Appl. Sci. 2017, 7, 427. [Google Scholar] [CrossRef] [Green Version]
  19. Bednar, N.; Severino, N.; Adamovic, N. Optical simulation of light management in CIGS thin-film solar cells using finite element method. Appl. Sci. 2015, 5, 1735–1744. [Google Scholar] [CrossRef]
  20. Kang, K.; Lee, S.; Kim, J.; Kim, S.; Han, Y.; Baek, S. A simple numerical modeling of the effect of the incoherent thick substrate in thin-film solar cells based on the equispaced thickness method. IEEE Photonics J. 2016, 8, 8400312. [Google Scholar] [CrossRef]
  21. Kang, K.; Kim, S.; Kim, J. Numerical modeling of the effect of multiple incoherent layers in Cu(In,Ga)Se2 solar cells based on the equispaced thickness averaging method. Appl. Opt. 2018, 57, 2758–2765. [Google Scholar] [CrossRef]
  22. Sarrazin, M.; Herman, A.; Deparis, O. First-principle calculation of solar cell efficiency under incoherent illumination. Opt. Express. 2014, 21, A616–A630. [Google Scholar] [CrossRef] [Green Version]
  23. Abass, A.; Trompoukis, C.; Leyre, S.; Burgelman, M.; Maes, B. Modeling combined coherent and incoherent scattering structures for light trapping in solar cells. J. Appl. Phys. 2013, 114, 033101. [Google Scholar] [CrossRef] [Green Version]
  24. Baik, J.; Park, J.; Lee, G.; Kim, S.; Kim, J. Effects of incoherent front cover glass on current-voltage characteristics of Cu(In,Ga)Se2 solar cells: Investigation into calculation accuracy for cover glass modeled as optically coherent or incoherent. Appl. Sci. 2020, 10, 3312. [Google Scholar] [CrossRef]
  25. Paulson, P.D.; Birkmire, R.W.; Shafarman, W.N. Optical characterization of CuIn1−xGaxSe2 alloy thin films by spectroscopic ellipsometry. J. Appl. Phys. 2003, 94, 879–888. [Google Scholar] [CrossRef]
  26. Seiler, D.G.; Zollner, S.; Diebold, A.C.; Amirtharaj, P.M. Optical properties of semiconductors. In Handbook of Optics, 3rd ed.; Bass, M., Li, G., Stryland, E.V., Eds.; McGraw-Hill: New York, NY, USA, 2009; Volume 4. [Google Scholar]
  27. Richter, M.; Schubbert, C.; Eraerds, P.; Riedel, I.; Keller, J.; Parisi, J.; Dalibor, T.; Avellán-Hampe, A. Optical characterization and modeling of Cu(In,Ga)(Se,S)2 solar cells with spectroscopic ellipsometry and coherent numerical simulation. Thin Solid Films. 2013, 535, 331–335. [Google Scholar] [CrossRef]
  28. Li, Q.H.; Zhu, D.; Liu, W.; Liu, Y.; Ma, X.C. Optical properties of Al-doped ZnO thin films by ellipsometry. Appl. Surf. Sci. 2008, 254, 2922–2926. [Google Scholar] [CrossRef]
  29. Mkawi, E.M.; Ibrahim, K.; Ali, M.K.M.; Farrukh, M.A.; Mohamed, A.S. The effect of dopant concentration on properties of transparent conducting Al-doped ZnO films for efficient Cu2ZnSnS4 thin-film solar cells prepared by electrodeposition method. Appl. Nanosci. 2015, 5, 993–1001. [Google Scholar] [CrossRef] [Green Version]
  30. Allsopp, B.L.; Orman, R.; Johnson, S.R.; Baistow, I.; Sanderson, G.; Sundberg, P.; Stålhandske, C.; Grund, L.; Andersson, A.; Booth, J.; et al. Towards improved cover glasses for photovoltaic devices. Prog. Photovoltaics. 2020, 28, 1187–1206. [Google Scholar] [CrossRef]
  31. Vogt, M.R.; Holst, H.; Schulte-Huxel, H.; Blankemeyer, S.; Witteck, R.; Hinken, D.; Winter, M.; Min, B.; Schinke, C.; Ahrens, I.; et al. Optical constants of UV transparent EVA and the impact on the PV module output power under realistic irradiation. Energy Procedia. 2016, 92, 523–530. [Google Scholar] [CrossRef] [Green Version]
  32. Comsol Inc. COMSOL Multiphysics; Version 5.2; Comsol Inc.: Burlington, MA, USA, 2016; Available online: http://www.comsol.com (accessed on 22 December 2020).
  33. Jehl, Z.; Bouttemy, M.; Lincot, D.; Guillemoles, J.F.; Gerard, I.; Etcheberry, A.; Voorwinden, G.; Powalla, M.; Naghavi, N. Insights on the influence of surface roughness on photovoltaic properties of state of the art copper indium gallium diselenide thin films solar cells. J. Appl. Phys. 2012, 111, 114509. [Google Scholar] [CrossRef]
  34. Kang, K.; Lee, S.; Kim, J. Effects of an incoherent glass substrate on the absorption efficiency of organic solar cells at oblique incidence analyzed by the transfer matrix method with a glass factor. Jpn. J. Appl. Phys. 2013, 52, 052301. [Google Scholar] [CrossRef]
  35. Saleh, B.E.A.; Teich, M.C. Fundamentals of Photonics, 2nd ed.; Wiley: Hoboken, NJ, USA, 2007; pp. 209–214. [Google Scholar]
Figure 1. Schematic diagram of a planar mixed coherent-incoherent thin-film multilayer structure. The multiple incoherent layers (j = 1, ···, m) are assumed to be transparent and the remaining coherent layers (j = m + 1, ···, n) can be either transparent or absorptive. To optically model random phase variations in the incoherent layers, each incoherent layer (v = 1, ···, m) is divided into an initial layer of the original thickness dv and an additional phase-shift layer of the equispaced phase thickness bv. A plane wave is obliquely incident from the semi-infinite transparent ambient on the left (j = 0) with the incidence angle θ0. The directions of the s- and p-polarized light are orthogonal to or parallel to the plane of incidence.
Applsci 11 02121 g001
Figure 2. (a) Schematic diagram of the planar CIGS solar cell together with the spectral irradiance of the AM 1.5 sunlight ranging between 300 and 1100 nm. Both the 3 mm cover glass and 0.5 mm EVA layers, the thicknesses of which are greater than the coherence length of sunlight (~0.6 μm), are treated as incoherent. The remaining layers are considered as coherent. Because the glass cover and the EVA flattening layers are assumed to be transparent, both layers are modeled as the 1 μm thick initial layer plus the respective phase-shift layer whose thicknesses b1 and b2 are determined based on Equation (4) when the ADETAM is applied to calculate the effect of the incoherent front glass and EVA layers in the simulation. (b) Complex refractive index spectra of the materials used in the CIGS solar cell.
Applsci 11 02121 g002
Figure 3. Spectral 2D coherent calculation results of the electric field amplitude and optical absorption at the wavelength of 400 nm when the equispaced phase thicknesses in the phase-shift layers are zero (b1 = b2 = 0). The 400 nm input plane wave with the surface power density of 5.57 W/m2 has the incidence angle of 45° for both (a) s and (b) polarization.
Applsci 11 02121 g003
Figure 4. Calculated spectral spatial distributions of light absorption obtained by the ADETAM and the GTMM when (a) s- and (b) p-polarized input plane wave with the wavelength of λ = 400 nm and the surface power density of 5.57 W/m2 has the incidence angle of θ0 =0°, 30°, 45°, and 60°. The calculated spatial absorption profiles obtained by the ADETAM are well matched with the exact analytical results calculated by the GTMM.
Applsci 11 02121 g004
Figure 5. Comparison of the calculated reflectance spectra of the planar CIGS solar cell between the ADETAM and the GTMM at various incidence angles for (a) s- and (b) p-polarized light. The calculated reflectance spectra obtained by the ADETAM are well matched with the exact analytical results calculated by the GTMM.
Applsci 11 02121 g005
Figure 6. (a) Schematic diagram of the surface-textured CIGS solar cell. Because the 3 mm cover glass and the 0.5 mm EVA flattening layers are transparent, they are modelled as the 1 μm thick initial layer plus the respective phase-shift layer whose thicknesses b1 and b2 are determined based on Equation (4) in the ADETAM-based calculation. The interfaces of the EVA/AZO/ZnS/CIGS multilayer are assumed to be randomly textured with the RMS surface roughness, which varies as σRMS = 25, 50, 75, and 100 nm. (b) Incoherent multiple optical reflections inside the planar incoherent cover glass layer to determine the minimum reflectance of the surface-textured CIGS solar cell. The reflectance from the cover glass to the air is Rg-a and the reflectance from the cover glass to the EVA is Rg-EVA. The refraction angle at the cover glass is θ1 when the incidence angle of sunlight is θ0 in the air.
Applsci 11 02121 g006
Figure 7. Spectral 2D coherent calculation results of the optical absorption in the surface-textured CIGS solar cell at the wavelength of 400 nm when the equispaced phase thicknesses in the phase-shift layers are zero (b1 = b2 = 0). The RMS surface roughness is set to be σRMS = 100 nm. The 400 nm input plane wave with the surface power density of 5.57 W/m2 has the incidence angle of 45° for both (a) s and (b) polarizations. To clarify the spectral optical absorption profile near the ZnS/CIGS interface, all the calculation results are shown near the ZnS/CIGS interface.
Applsci 11 02121 g007
Figure 8. Calculated ADETAM-applied reflectance spectra of the surface-textured CIGS solar cell at different degrees of the RMS surface roughness when the incidence angle of the AM 1.5 sunlight is θ0 = (a) 0°, (b) 30°, (c) 45°, and (d) 60°. The incidence-angle-dependent reflectance of the incoherent multiple optical reflections calculated by Equation (18) is well matched with the minimum reflectance values of the surface-textured CIGS solar cell with σRMS = 100 nm.
Applsci 11 02121 g008
Figure 9. Four different device structures to investigate the effect of the front incoherent encapsulation layers on output performance of the planar and surface-textured CIGS solar cells. The RMS surface roughness of the surface-textured structure is σRMS = 100 nm. The angular dependences of reflectance spectrum and J–V curves are calculated and compared in the surface-textured CIGS solar cell (c) without and (d) with the inclusion of the two front encapsulation layers. For reference, reflectance spectrum and J–V curves are also calculated in the planar CIGS solar cell (a) without and (b) with the inclusion of the two front encapsulation layers.
Applsci 11 02121 g009
Figure 10. Calculated reflectance spectra of the surface-textured CIGS solar cell without and with the inclusion of the front incoherent layers. The RMS surface roughness of the surface-textured structure is set to be σRMS = 100 nm. For reference, the reflectance spectra of the planar CIGS solar cell are also calculated. The incidence angle of the AM 1.5 sunlight is θ0 = (a) 0°, (b) 30°, (c) 45°, and (d) 60°, respectively.
Applsci 11 02121 g010
Figure 11. Calculated J–V characteristics of the surface-textured CIGS solar cell without and with the inclusion of the front incoherent layers. For reference, the J–V characteristics of the planar CIGS solar cell are also calculated. The incidence angle of the AM 1.5 sunlight is θ0 = (a) 0°, (b) 30°, (c) 45°, and (d) 60°, respectively.
Applsci 11 02121 g011
Table 1. Calculated short-circuit current density (JSC) of the planar and surface-textured CIGS solar cells without and with the inclusion of the front encapsulation layers, which are taken from Figure 11. The unit of JSC is mA/cm2. The improvement percentage of JSC in the surface-textured CIGS solar cell over the planar CIGS solar cell is denoted in the parenthesis whether the front incoherent encapsulation layers are included or not.
Incidence AnglePlanar CIGS Solar Cell without the Front Encapsulation LayerSurface-Textured CIGS Solar Cell without the Front Encapsulation LayerPlanar CIGS Solar Cell with the Front Encapsulation LayerSurface-Textured CIGS Solar Cell with the Front Encapsulation Layer
−33.83−36.98 (9.31%)−34.05−35.95 (5.58%)
30°−29.11−31.78 (9.17%)−29.42−31.11 (5.74%)
45°−23.40−25.40 (8.55%)−23.79−25.16 (5.76%)
60°−15.68−16.68 (6.38%)−16.14−17.03 (5.51%)
Publisher’s Note: MDPI stays neutral with regard to jurisdictional claims in published maps and institutional affiliations.

