Improvement of Boeing Bump Method Considering Aircraft Vibration Superposition Effect


Abstract
:1. Introduction
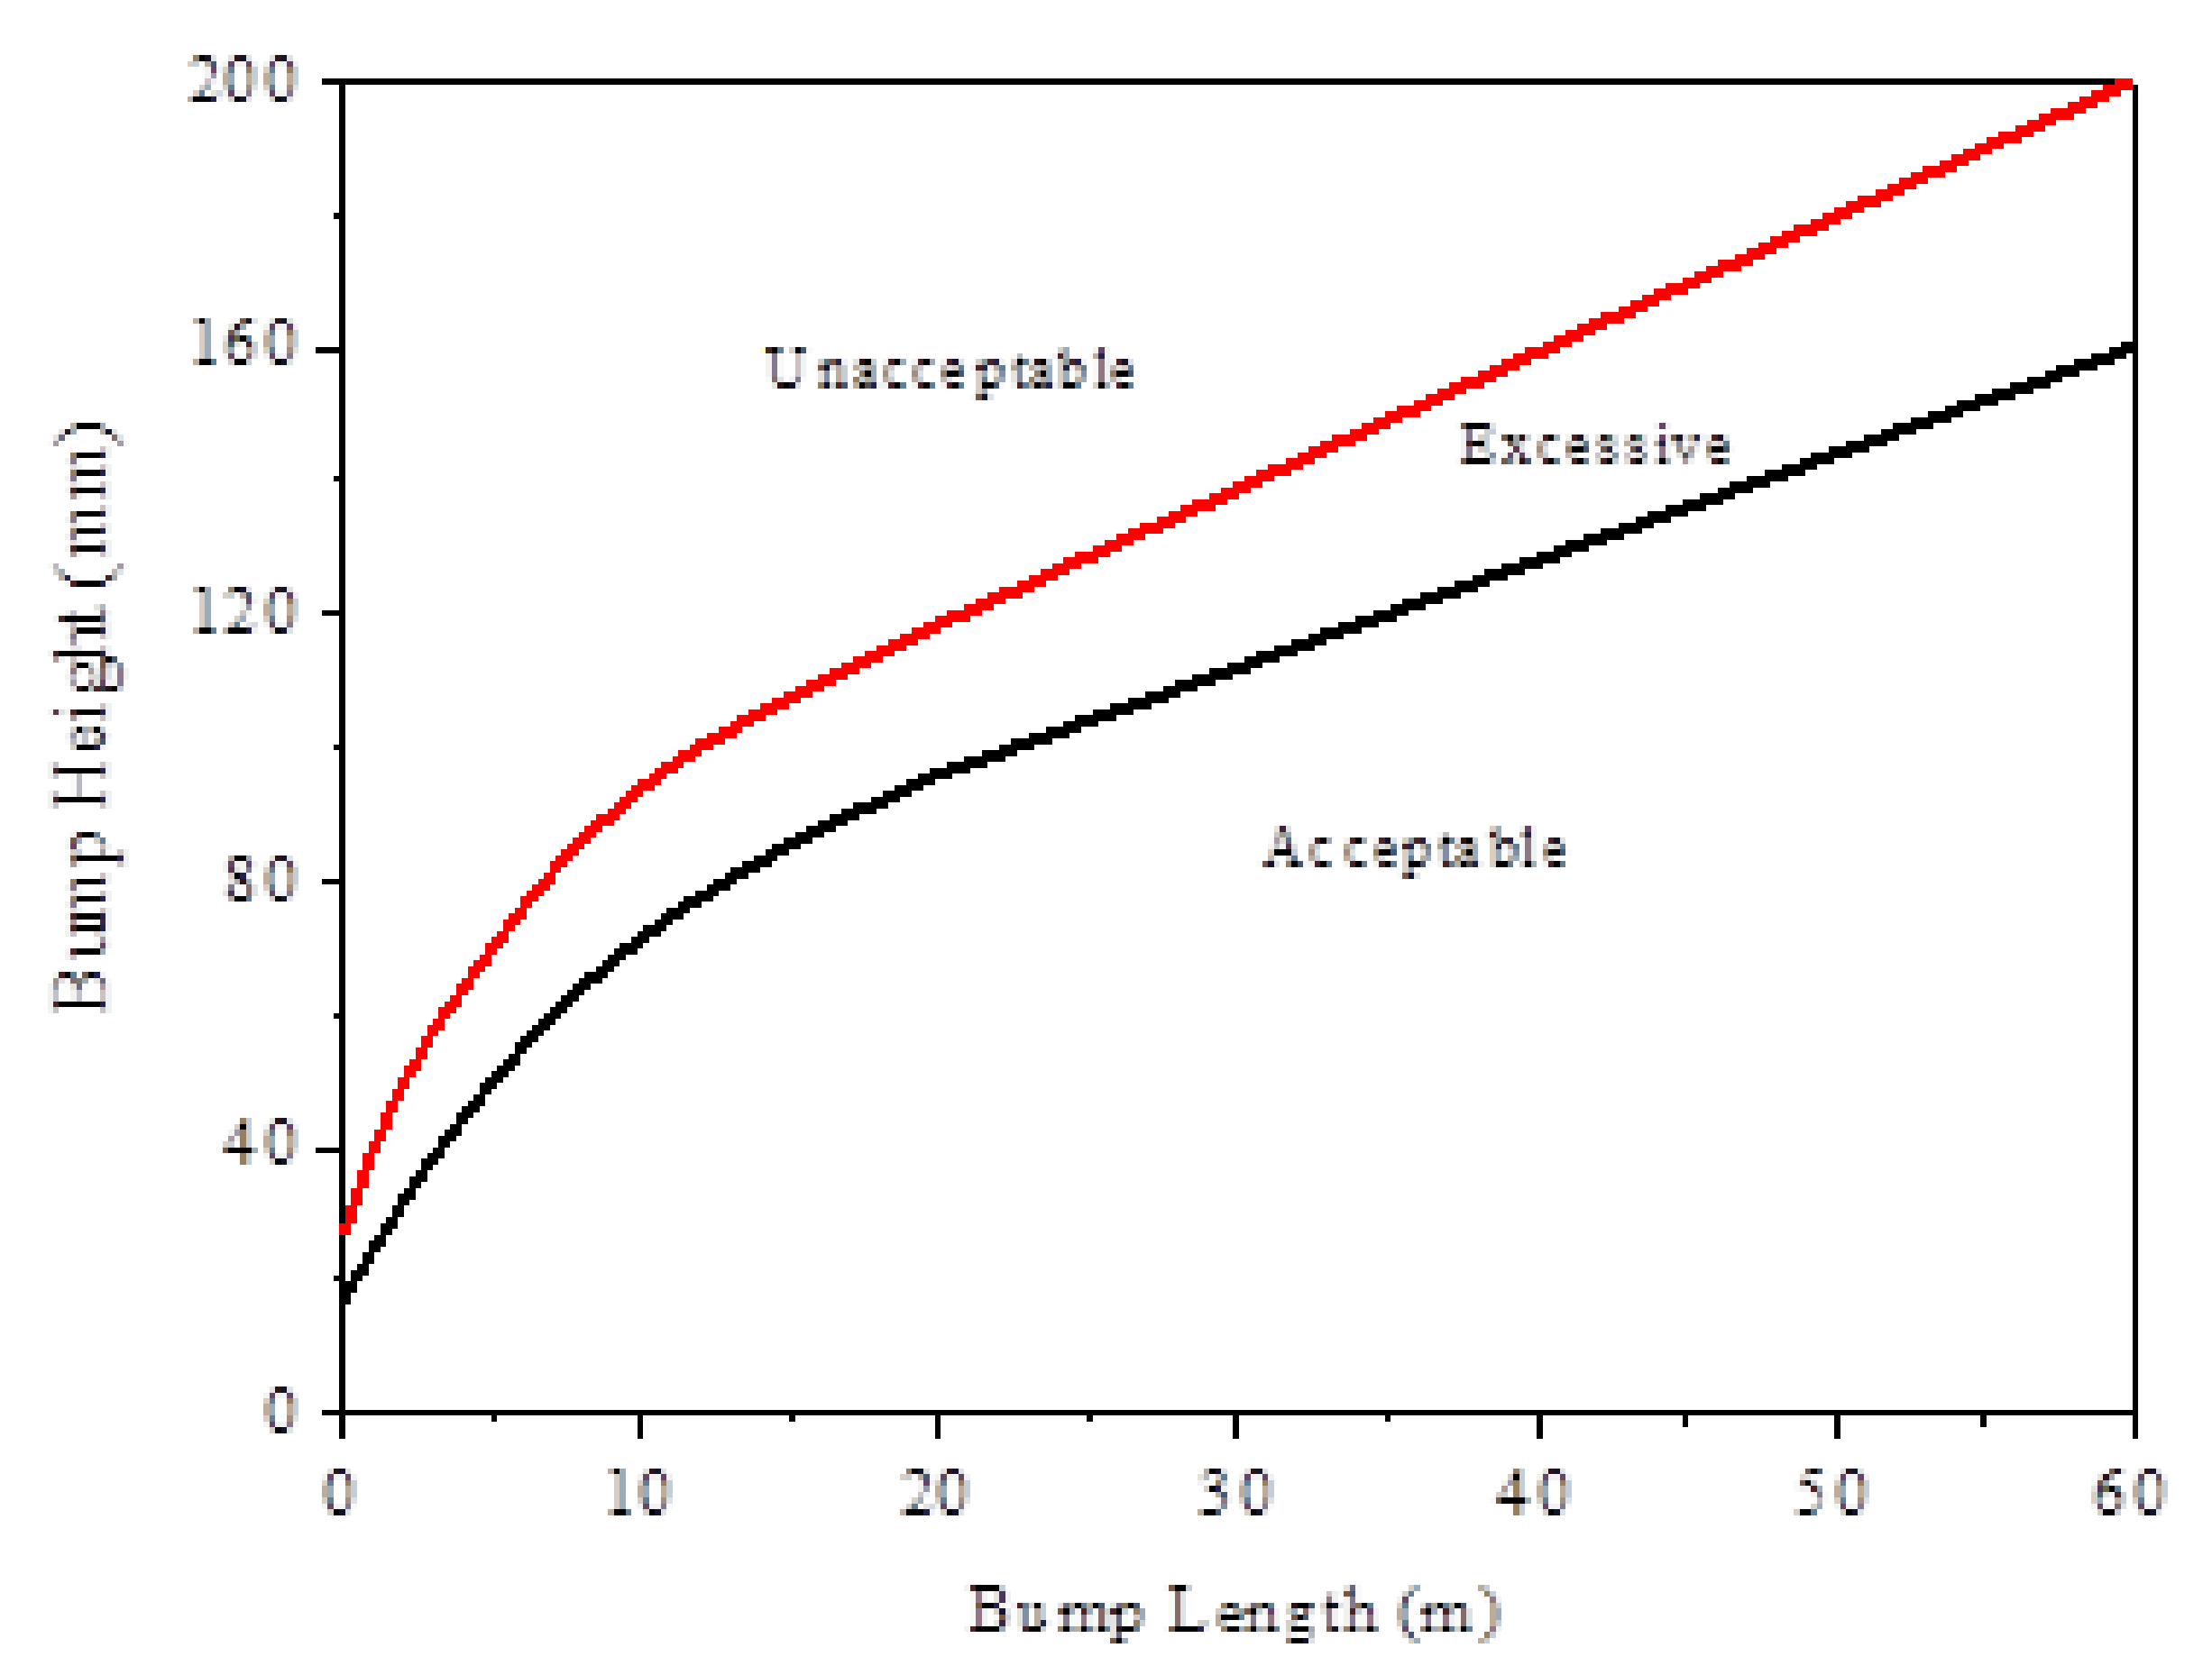
2. Boeing Bump Method
3. Simulation of Aircraft Dynamic Response
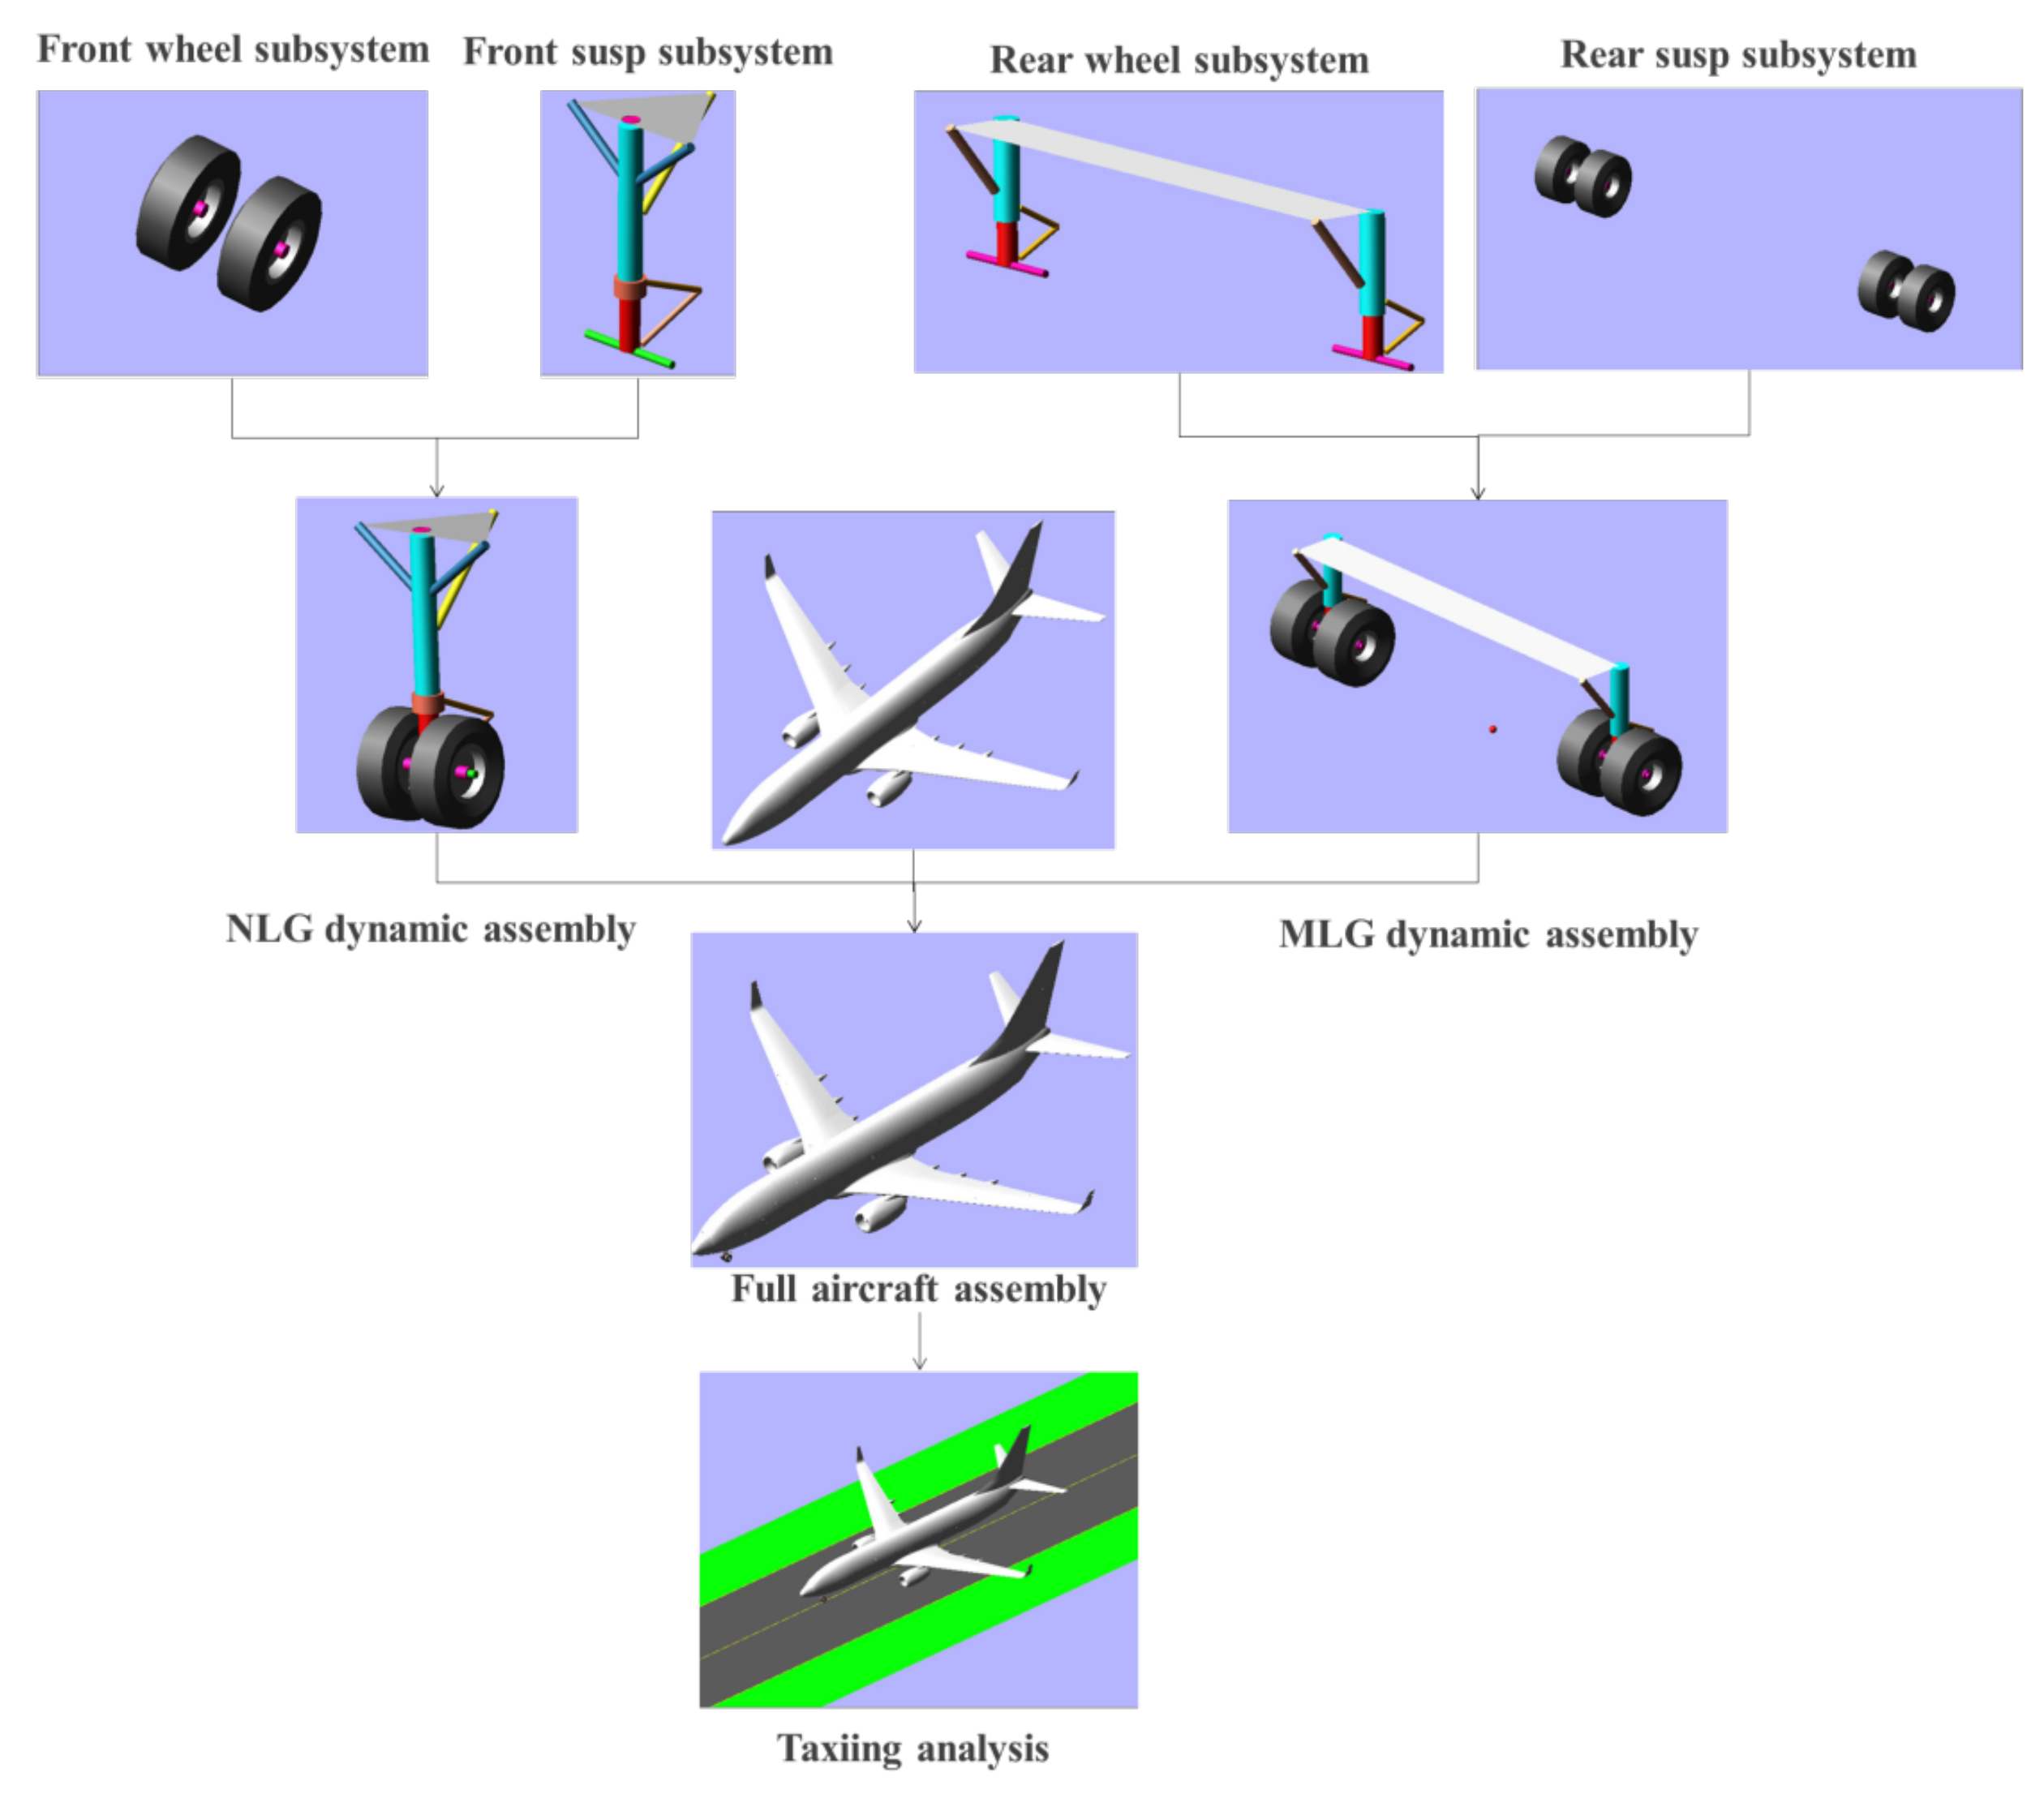
3.1. ADAMS/Aircraft Virtual Propotype
- Part: A part is the smallest unit and is built by referring to the Hardpoint (for spatial positioning) and the Construction Frame (for spatial positioning and orientation). The geometric type (Link or Arm), size, material, mass, and moment of inertia of the component can be set using the dialog box in ADAMS/Aircraft.
- Template: The separate parts are assembled into a template by setting Attachments or Forces. The template defines the topological structure of the aircraft model, which is the underlying structure of the prototype model and cannot be used directly for simulation analysis.
- Subsystem: The subsystem is a higher level of the model that is based on the creation of the template. Users can invoke the template to generate the subsystem in Standard mode and then modify the parameters of the subsystem, such as the coordinates of the Hardpoint, the position and direction of the Construction Frame, and the parameters of the property file. However, the subsystem is not used directly for simulation analysis.
- Communicator: The Communicator is used mainly to exchange information between subsystems and includes an Input Communicator or Output Communicator. For example, the Output Communicator that is responsible for the tire installation position and rolling direction in the landing gear subsystem must correspond to the Input Communicator in the Tire subsystem. During assembly, the software will automatically pair the appropriate Communicators.
- Test Rig: The Test Rig is an equipment that is used to store a simulation controller and test the structure of the model. It includes the whole machine simulation test rig, landing gear dynamic simulation test rig, landing gear structure simulation test rig, and wheel simulation test rig. The Test Rig controls the simulation parameters and calculation process during simulation analysis.
- Assembly: The Assembly is the only component that can be used directly for simulation analysis in ADAMS/Aircraft. The Assembly consists of the Test Rig and one or more subsystems and is divided into the following components. The wheel assembly consists only of a single wheel subsystem. The landing gear structure assembly includes the landing gear suspension subsystem and the structure test rig. The landing gear dynamic assembly includes the landing gear suspension subsystem, wheel subsystem, and dynamic simulation test rig. The assembly of the whole machine includes five basic subsystems, i.e., the fuselage subsystem, the nose landing gear suspension subsystem, the front wheel system, the main landing gear suspension subsystem, and the main wheel system, as well as the whole machine simulation test rig.
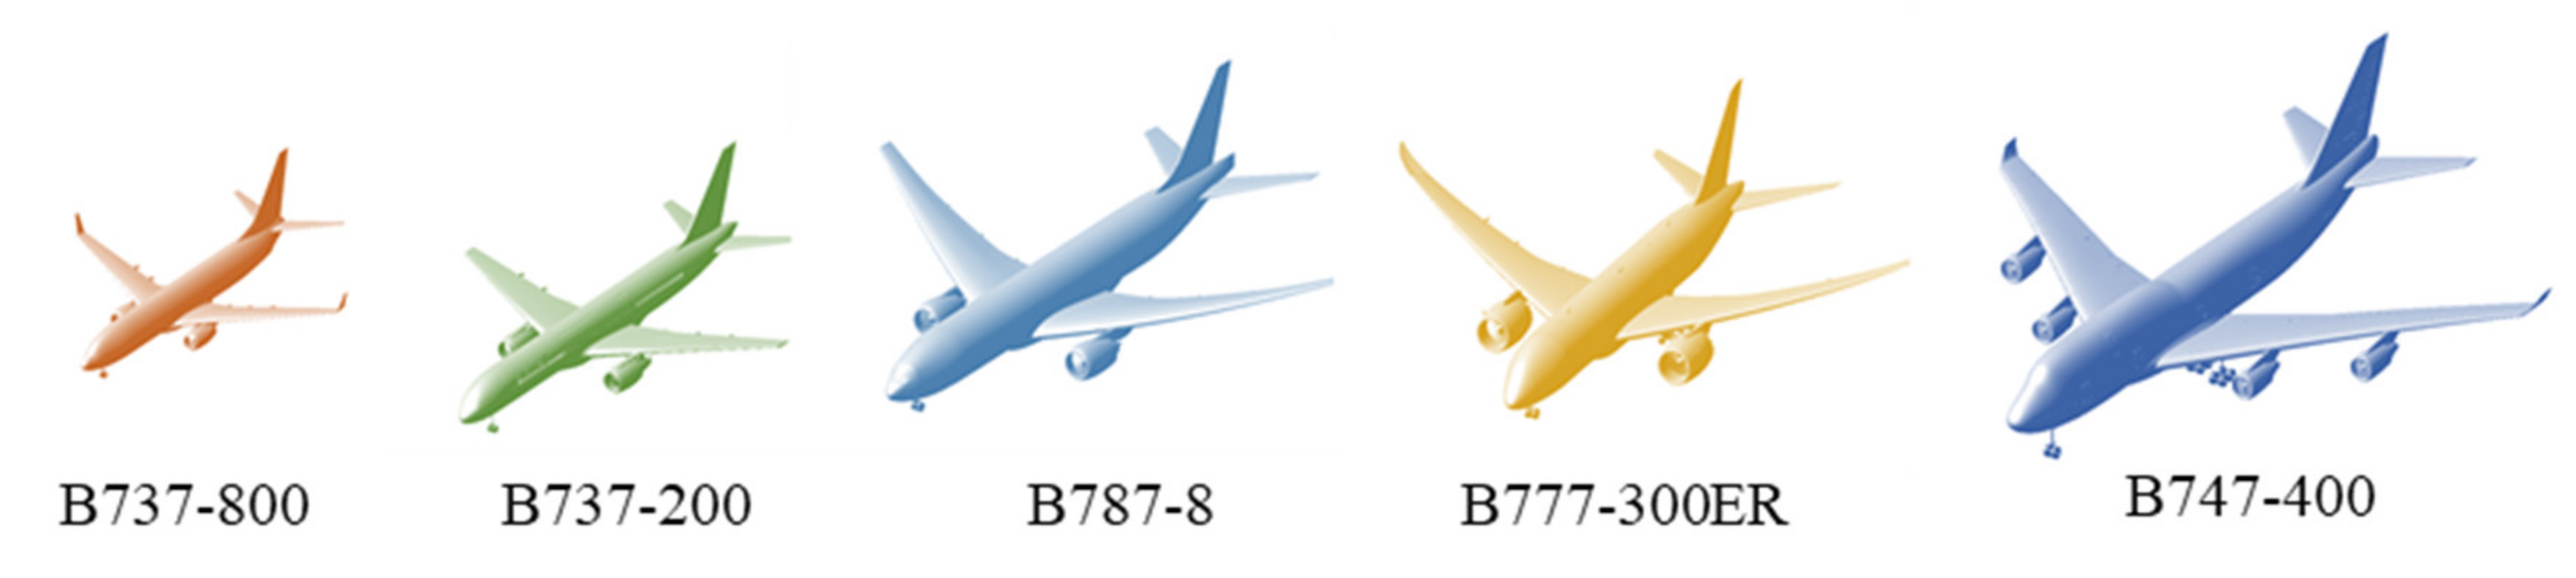
3.2. Typical Aircraft Virtual Prototype Models
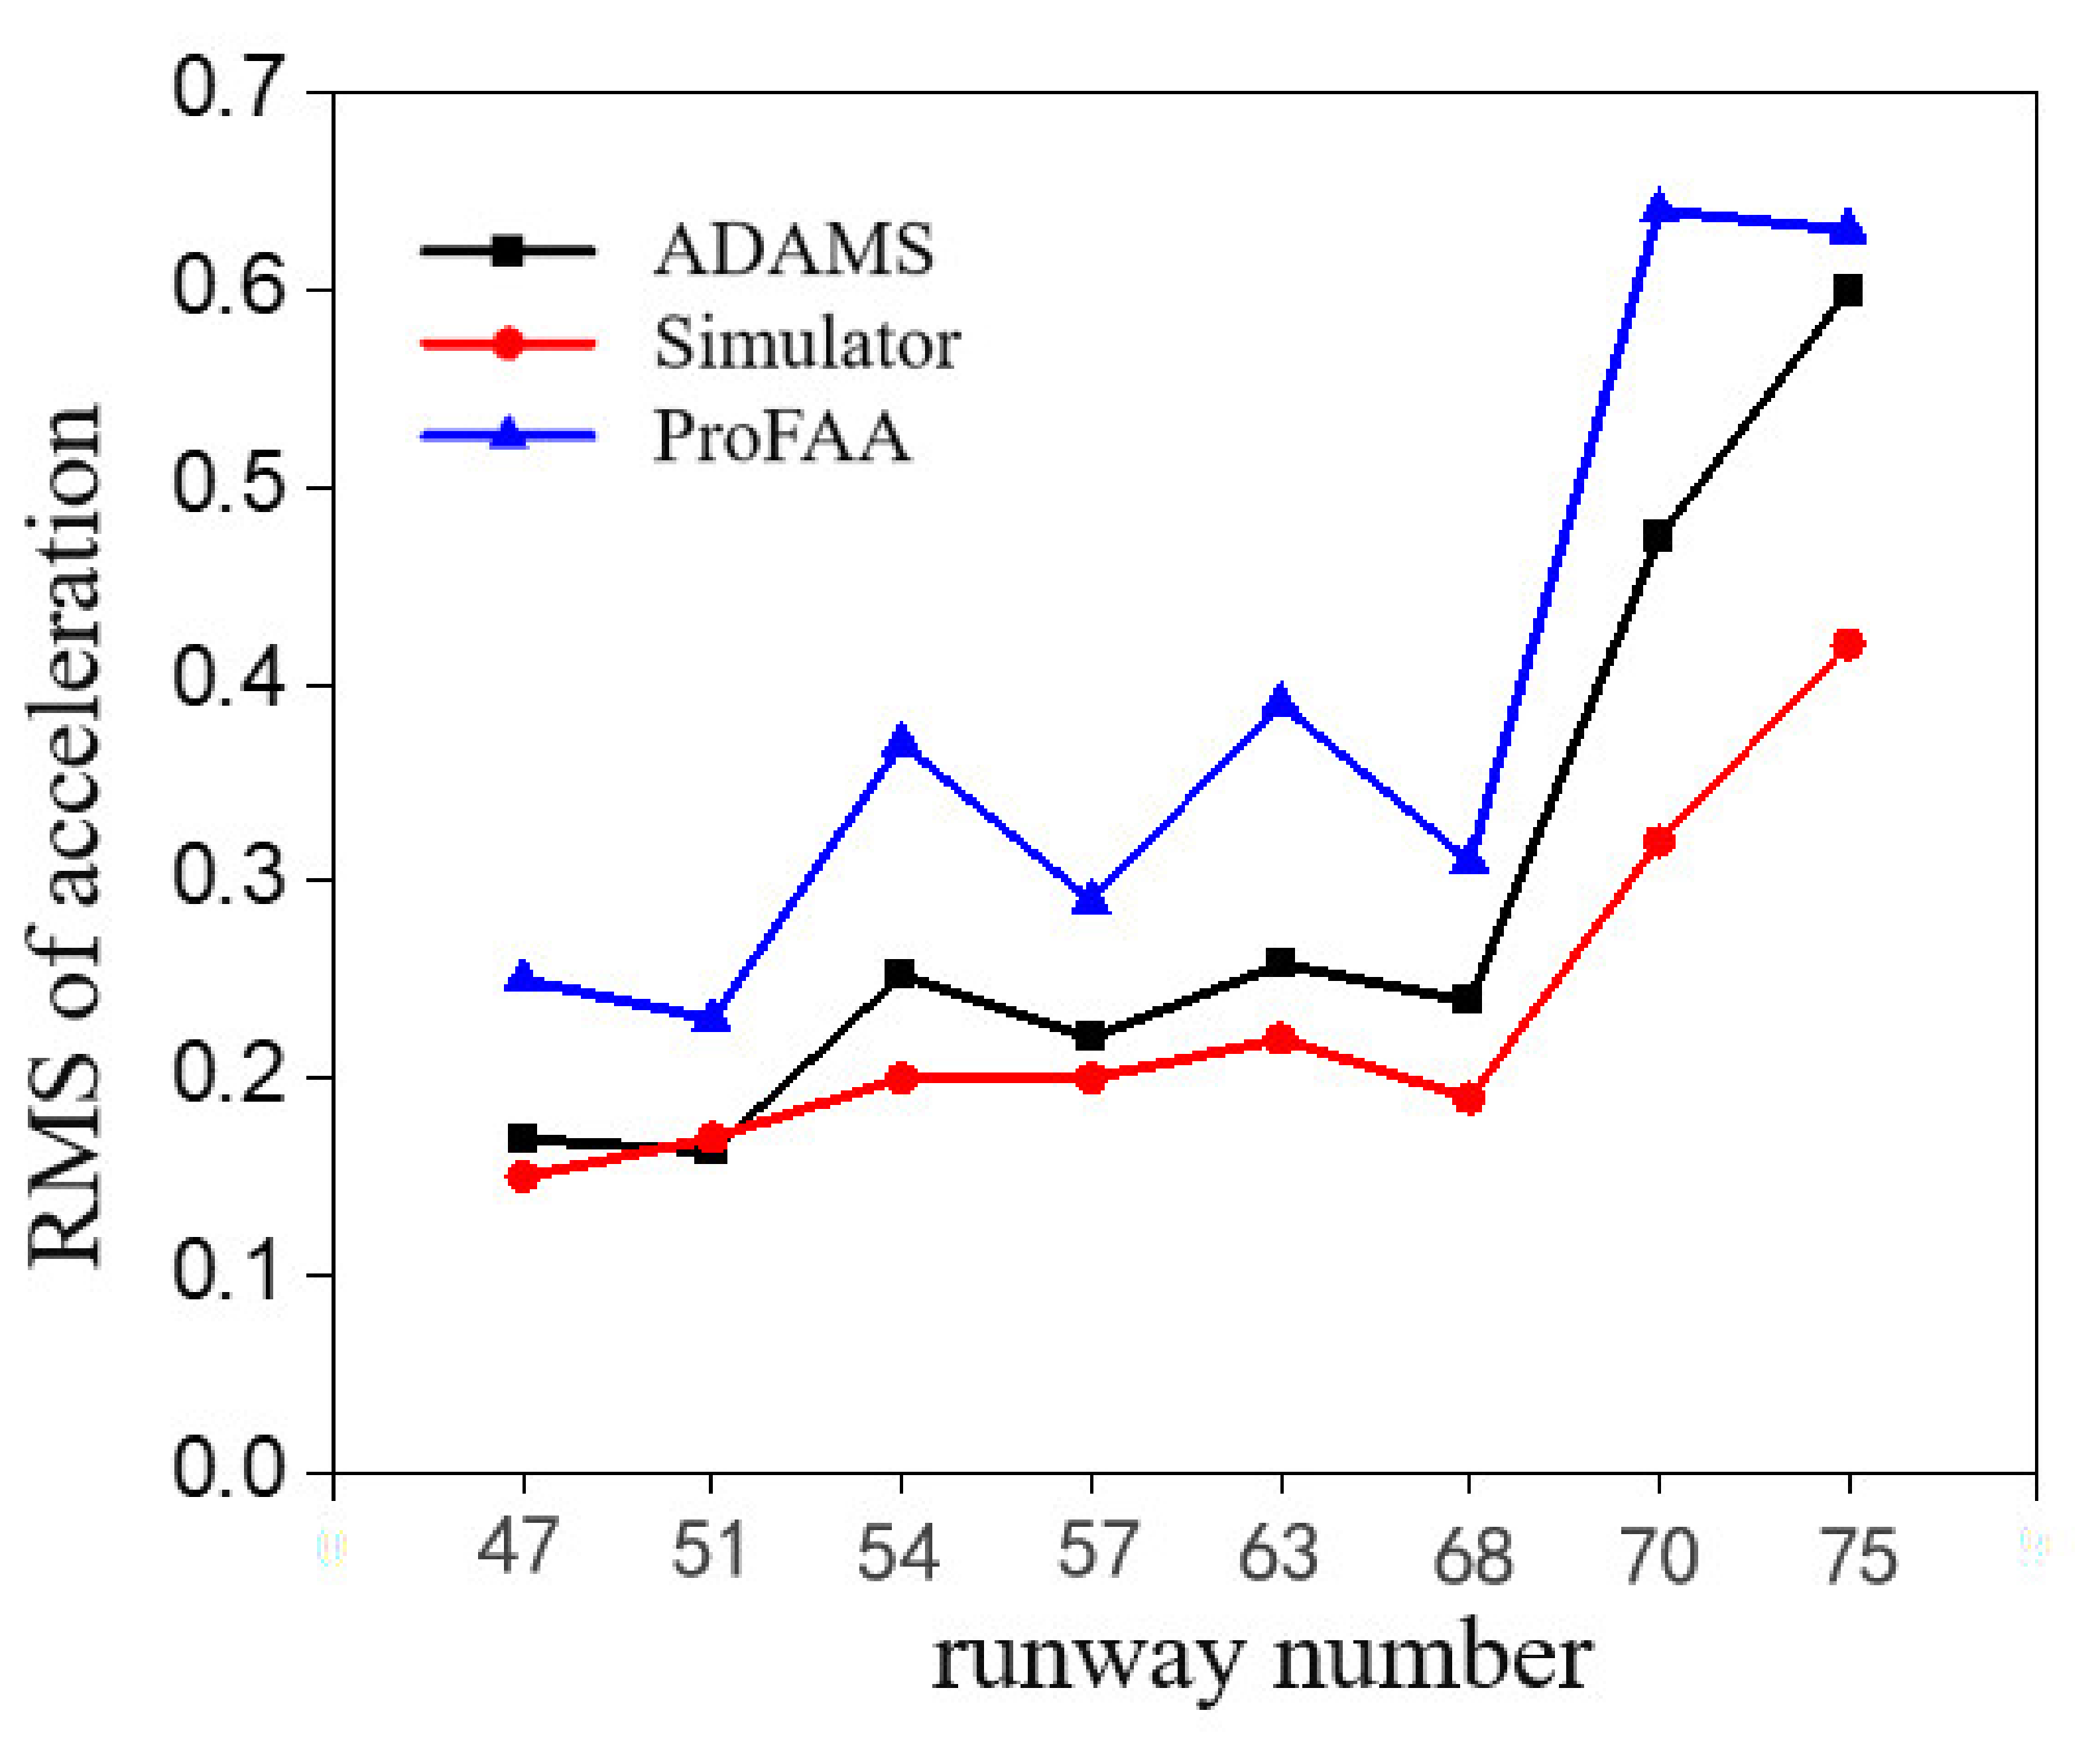
3.3. Verification of Virtual Prototype Models
3.4. Takeoff Speed
4. Testing Scenarios
4.1. Criteria for Four Vibration Index Values
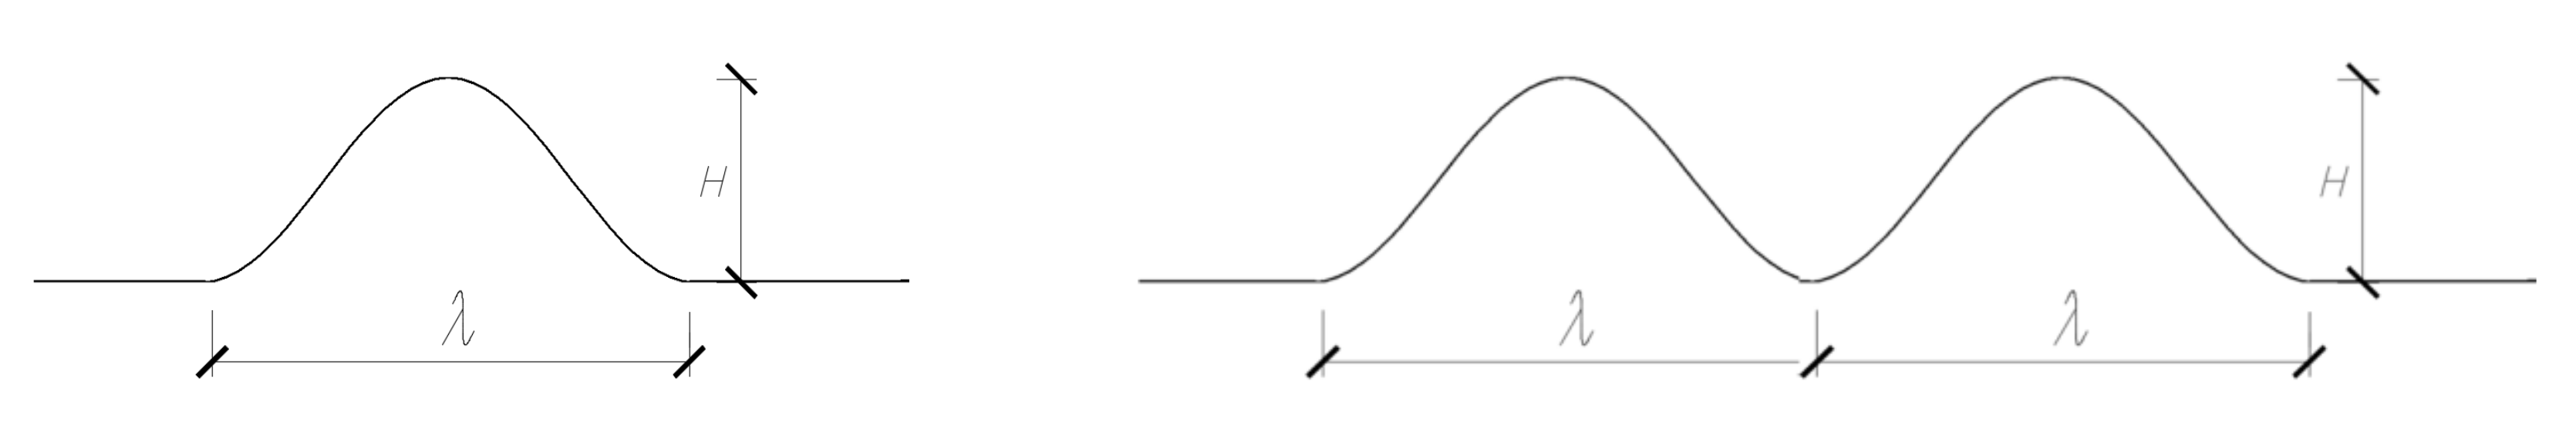
4.2. Form of Roughness Excitation
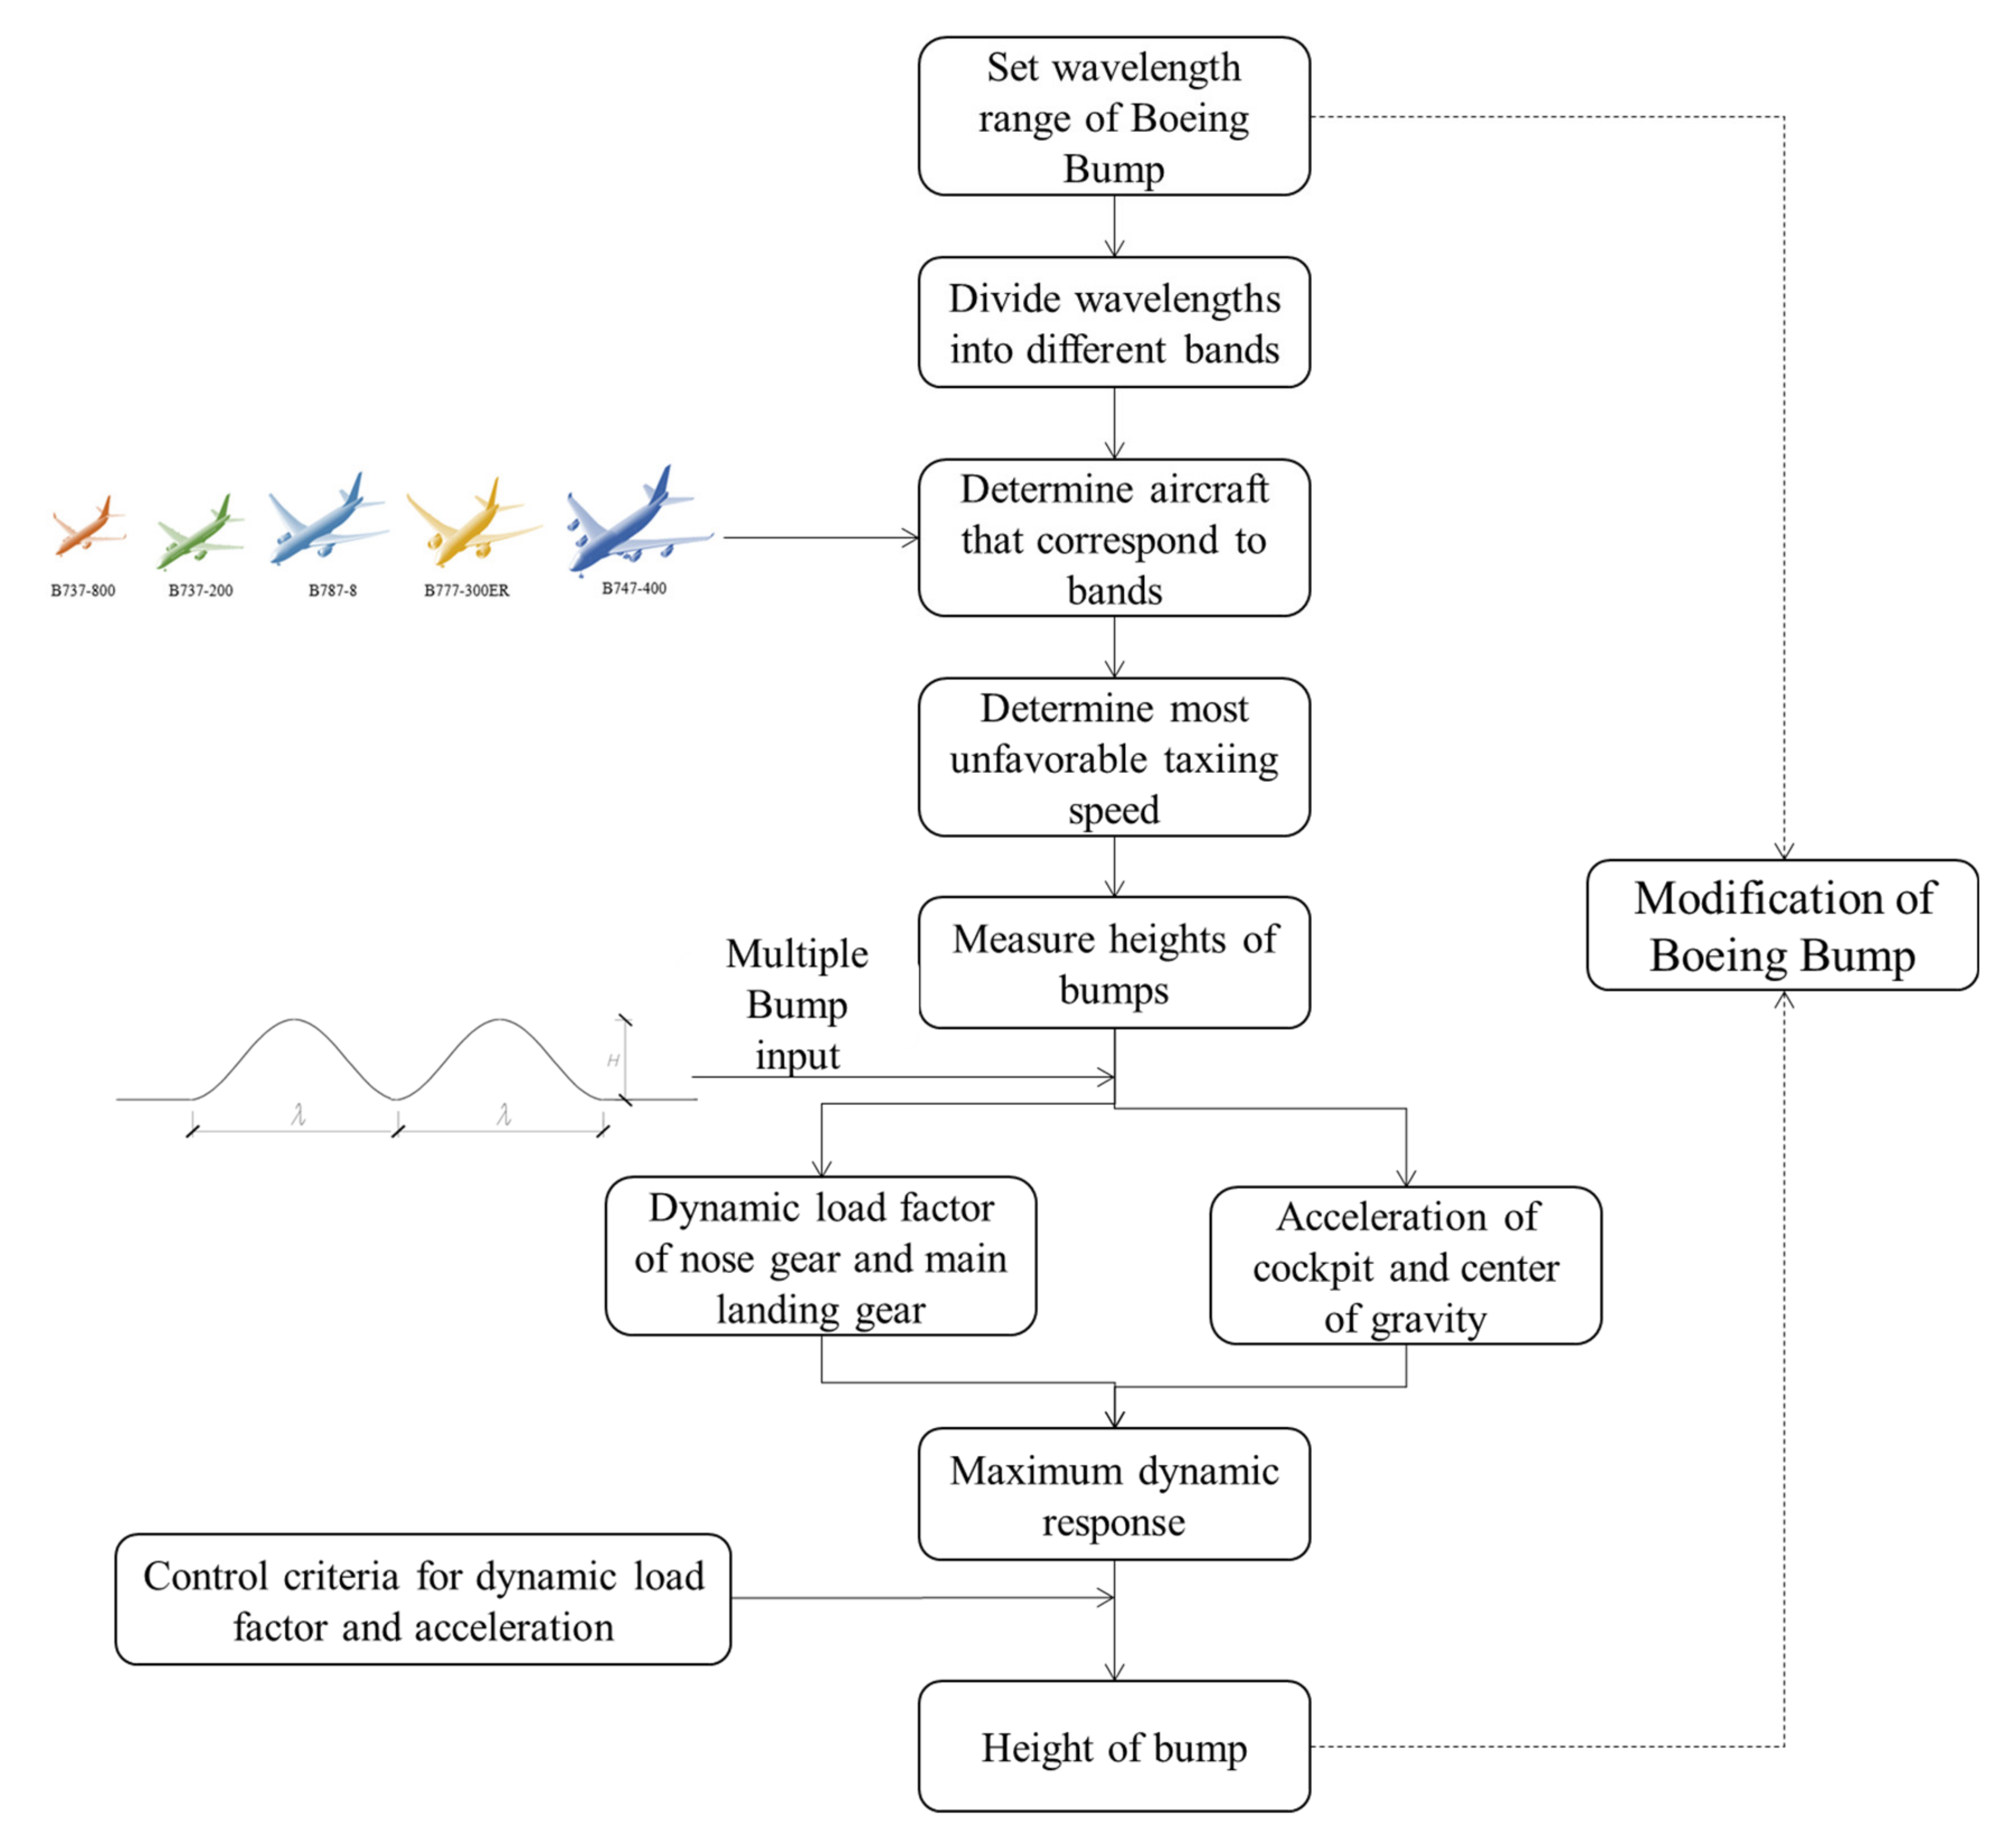
4.3. Modifying Process
- We set the wavelength range for the Boeing Bump to be 0 m to 120 m, with the step size of 1 m.
- We divided the wavelengths of 1 m~120 m into different bands.
- According to the vibration response characteristics of the different aircraft types, we determined the corresponding wavebands.
- We determined the taxiing speed of the aircraft.
- We determined the bump height that corresponded to each wavelength and input the multiple bumps into ADAMS/Aircraft.
- We simulated five types of aircrafts and found four vibration index values.
- According to the set thresholds of the vibration responses, we determined the height of the bump that corresponded to each wavelength and used that height as the standard for the final modified model.
5. Results and Discussion
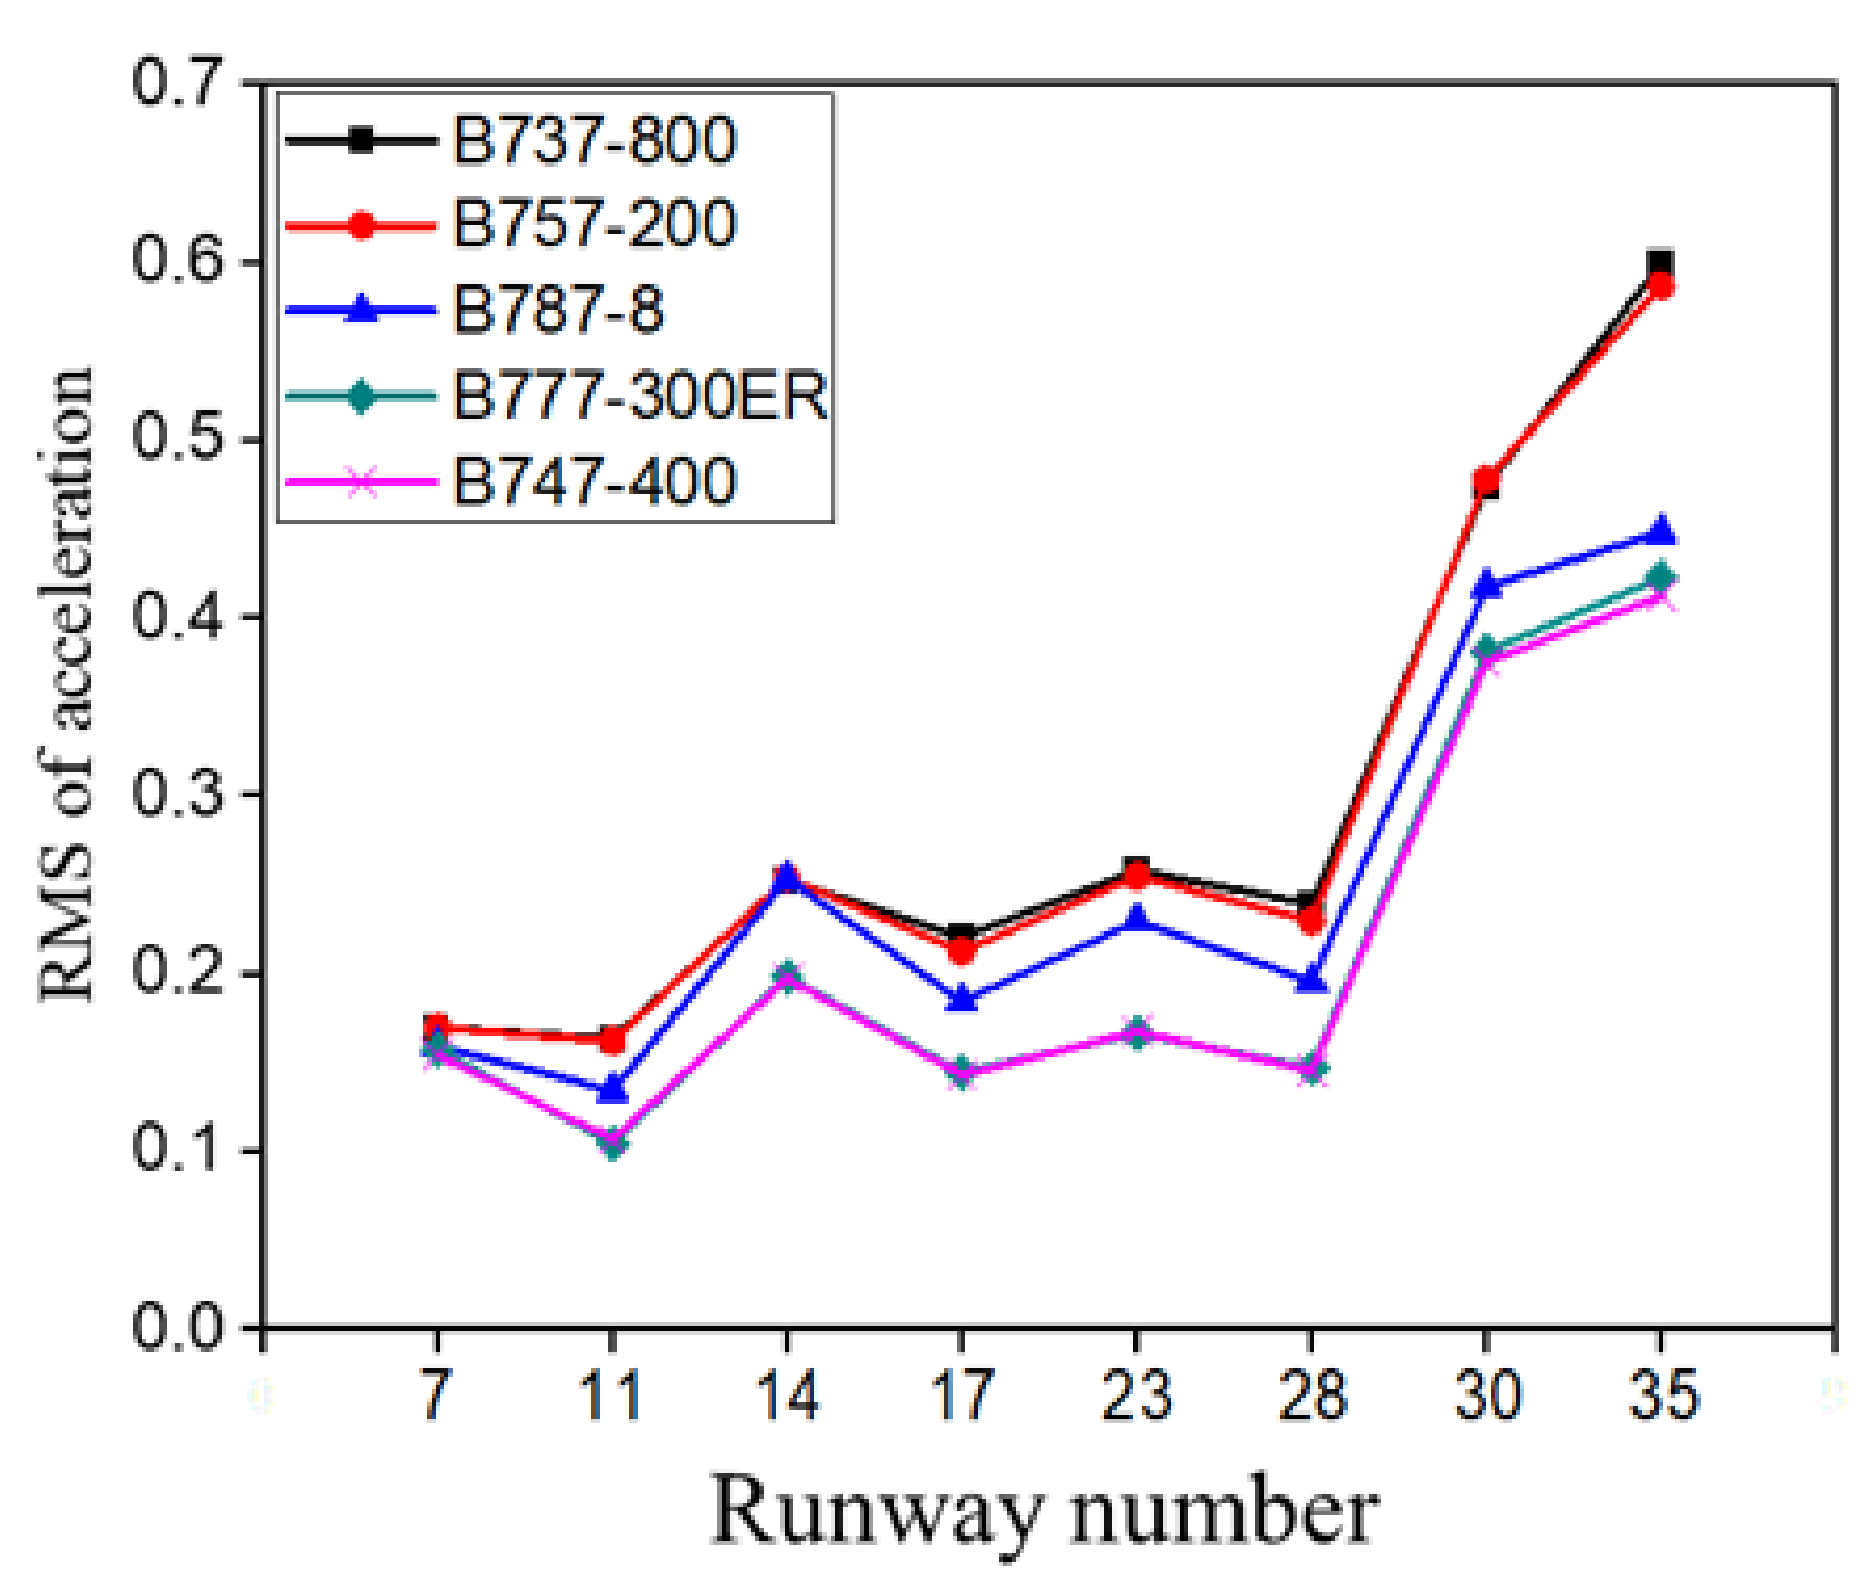
5.1. The Most Unfavorable Speed
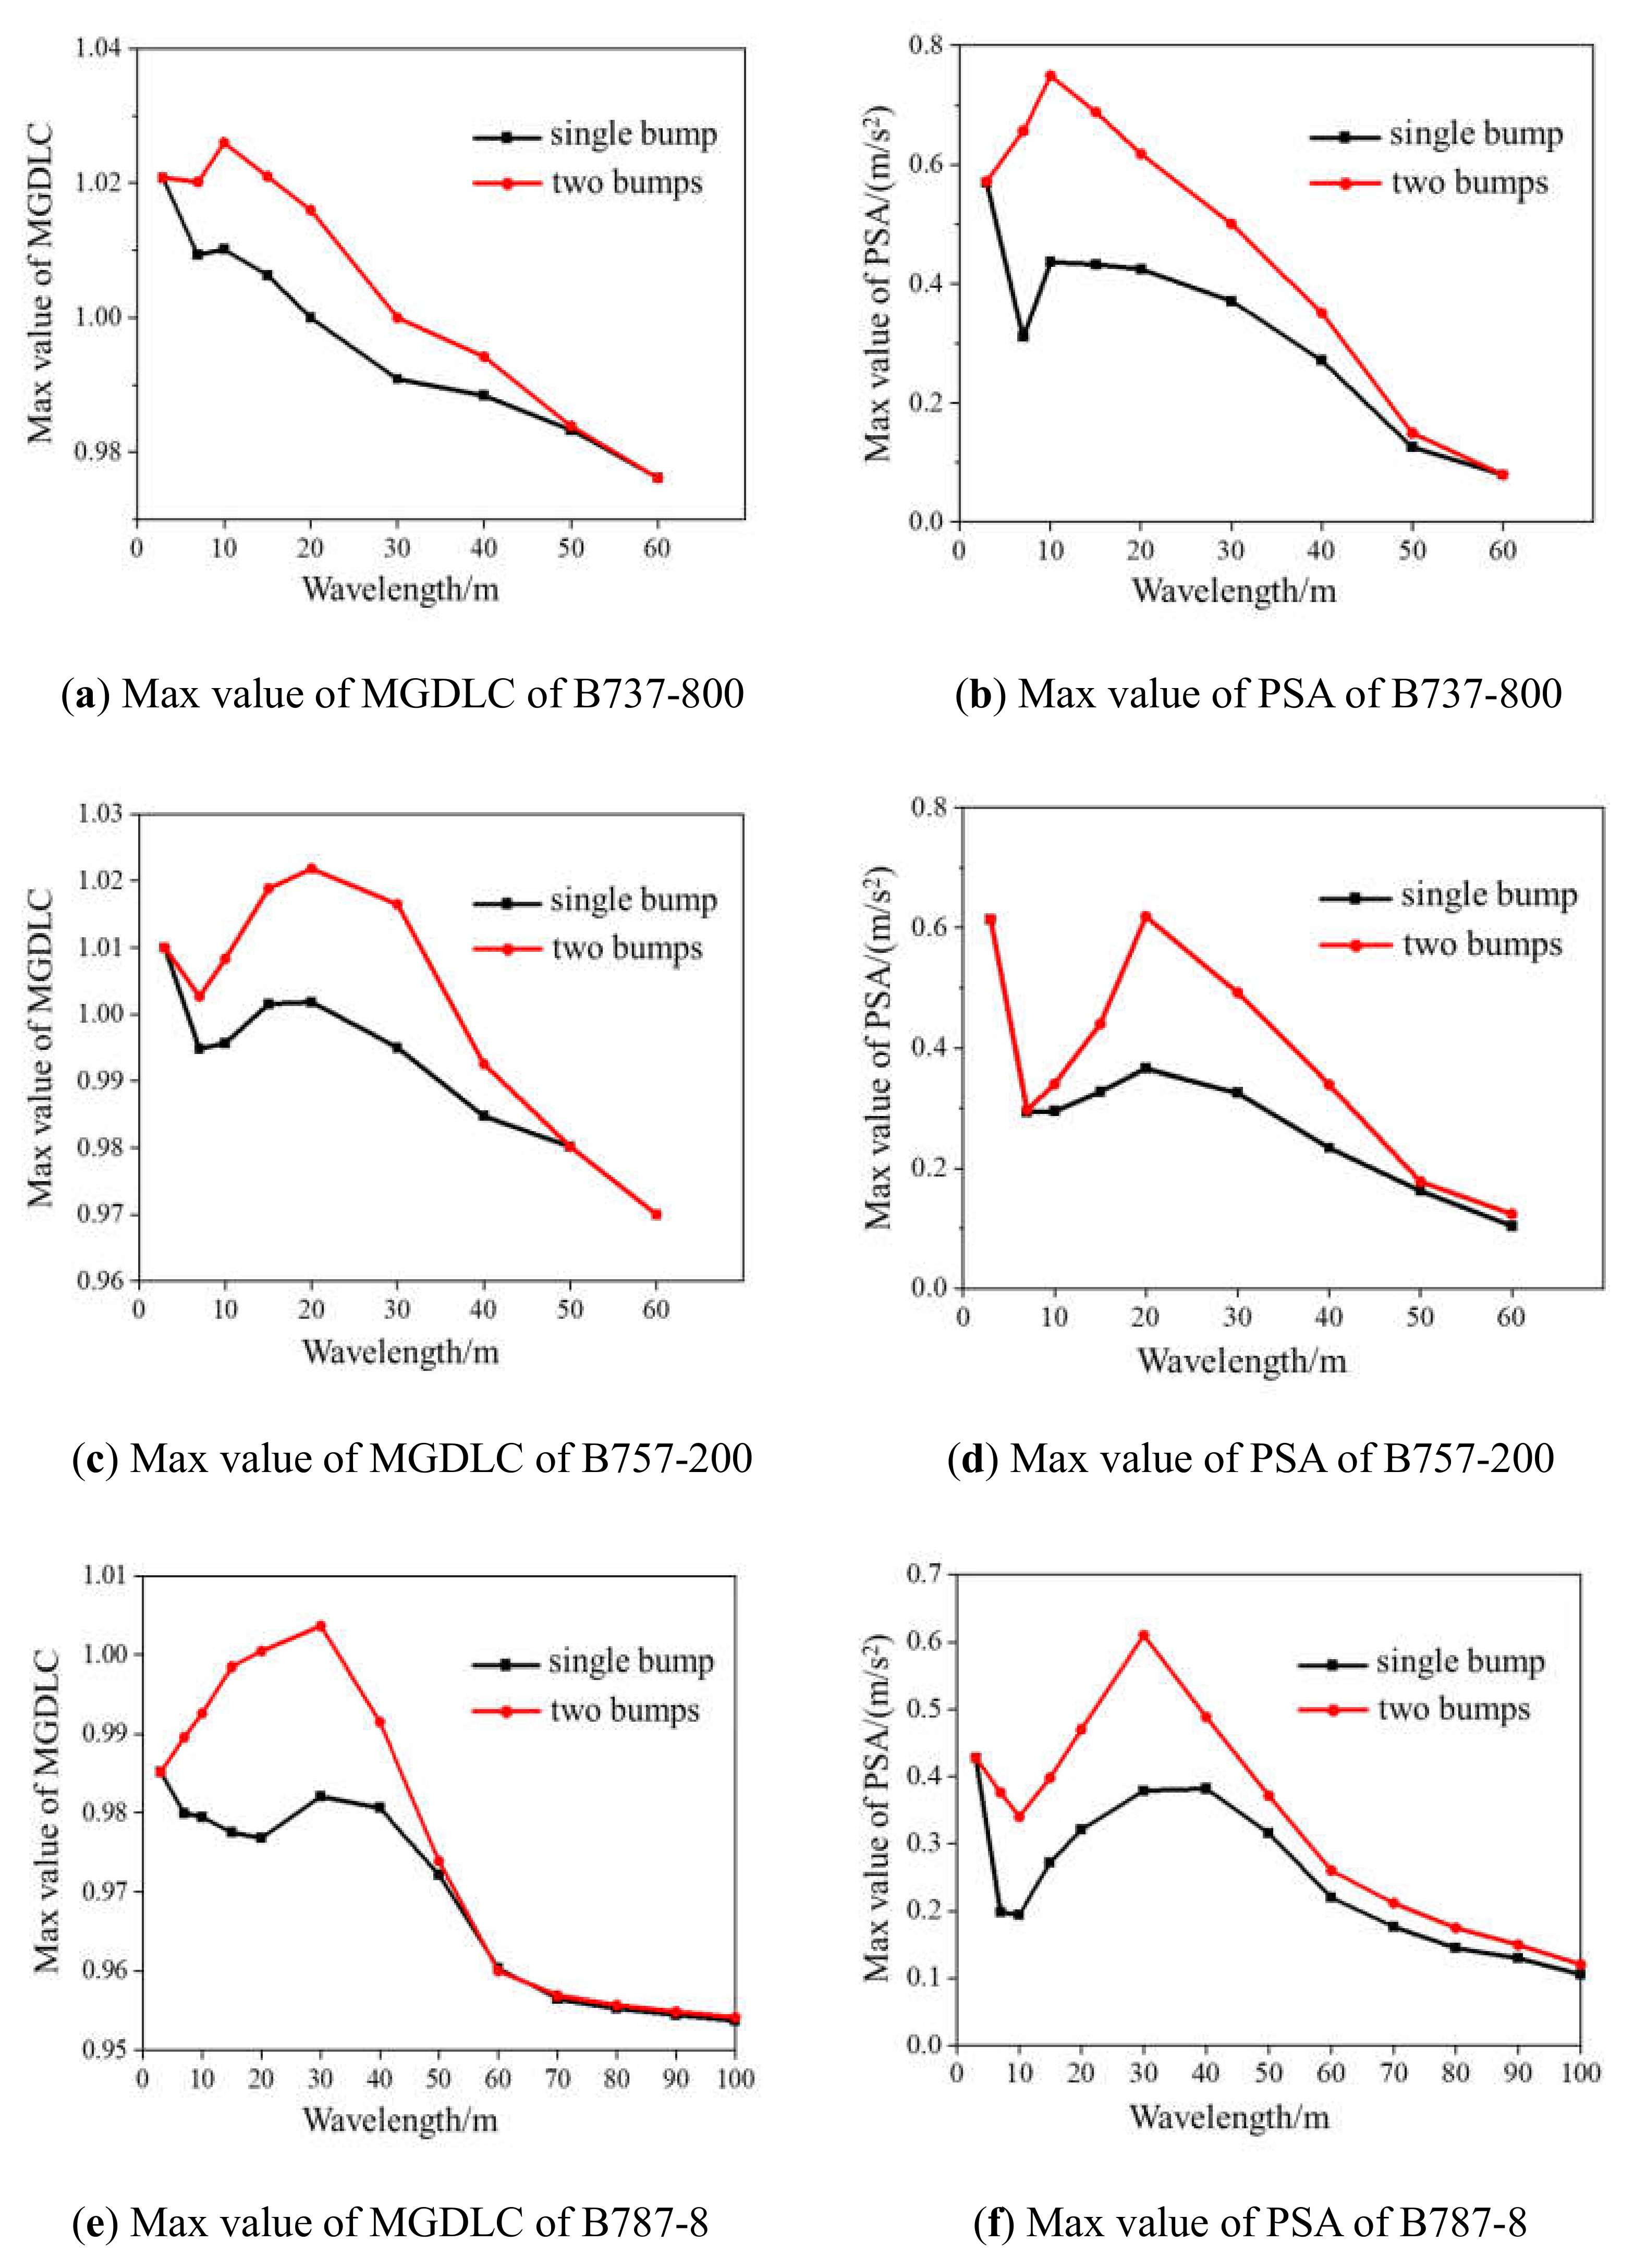
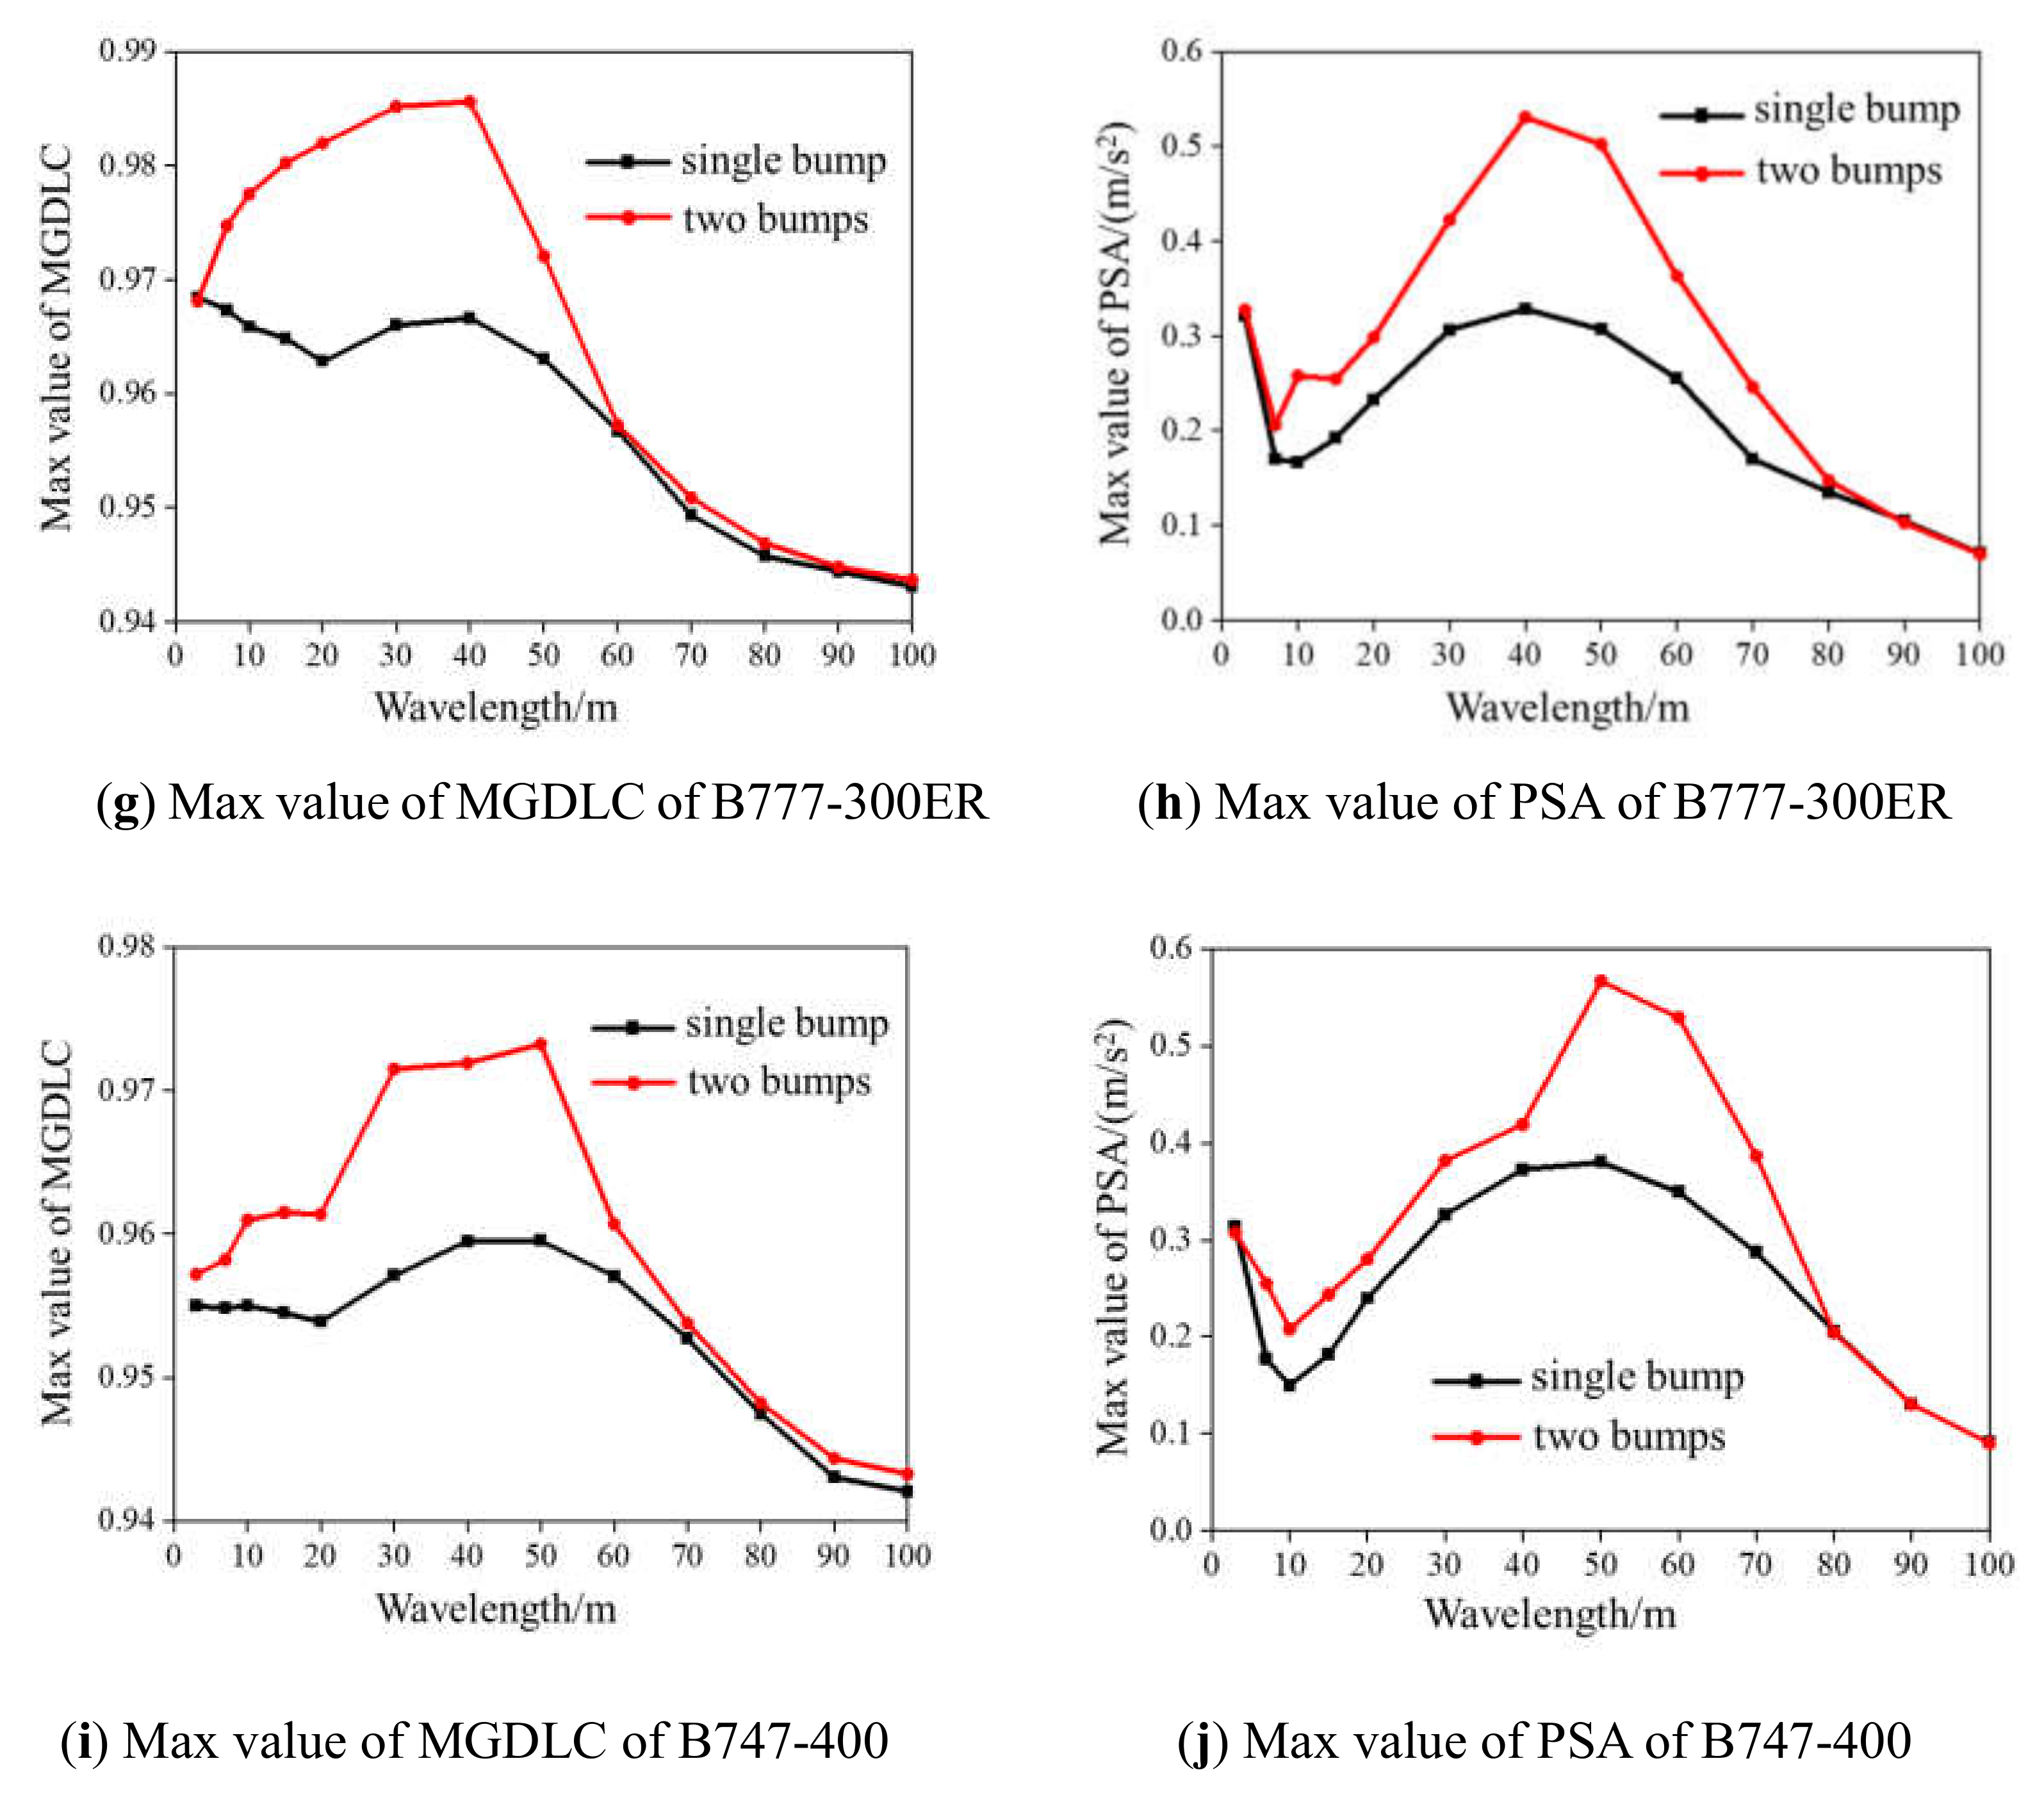
5.2. Analysis of Superposition Effect
5.3. Modification of Boeing Bump Index
6. Conclusions
- We developed and verified the reliability of the B737-800, B757-200, B777-300ER, B787-800, and B747-400 virtual prototype models in this study.
- The most unfavorable speed (in terms of vibration response) of the different aircraft models differs greatly. Basically, the larger the aircraft, the higher the most unfavorable speed.
- The aircraft’s dynamic response might increase by 50% for two bumps on a rough runway compared to a single bump. Therefore, the original Boeing Bumpmethod should be improved in terms of dealing with multiple bumps.
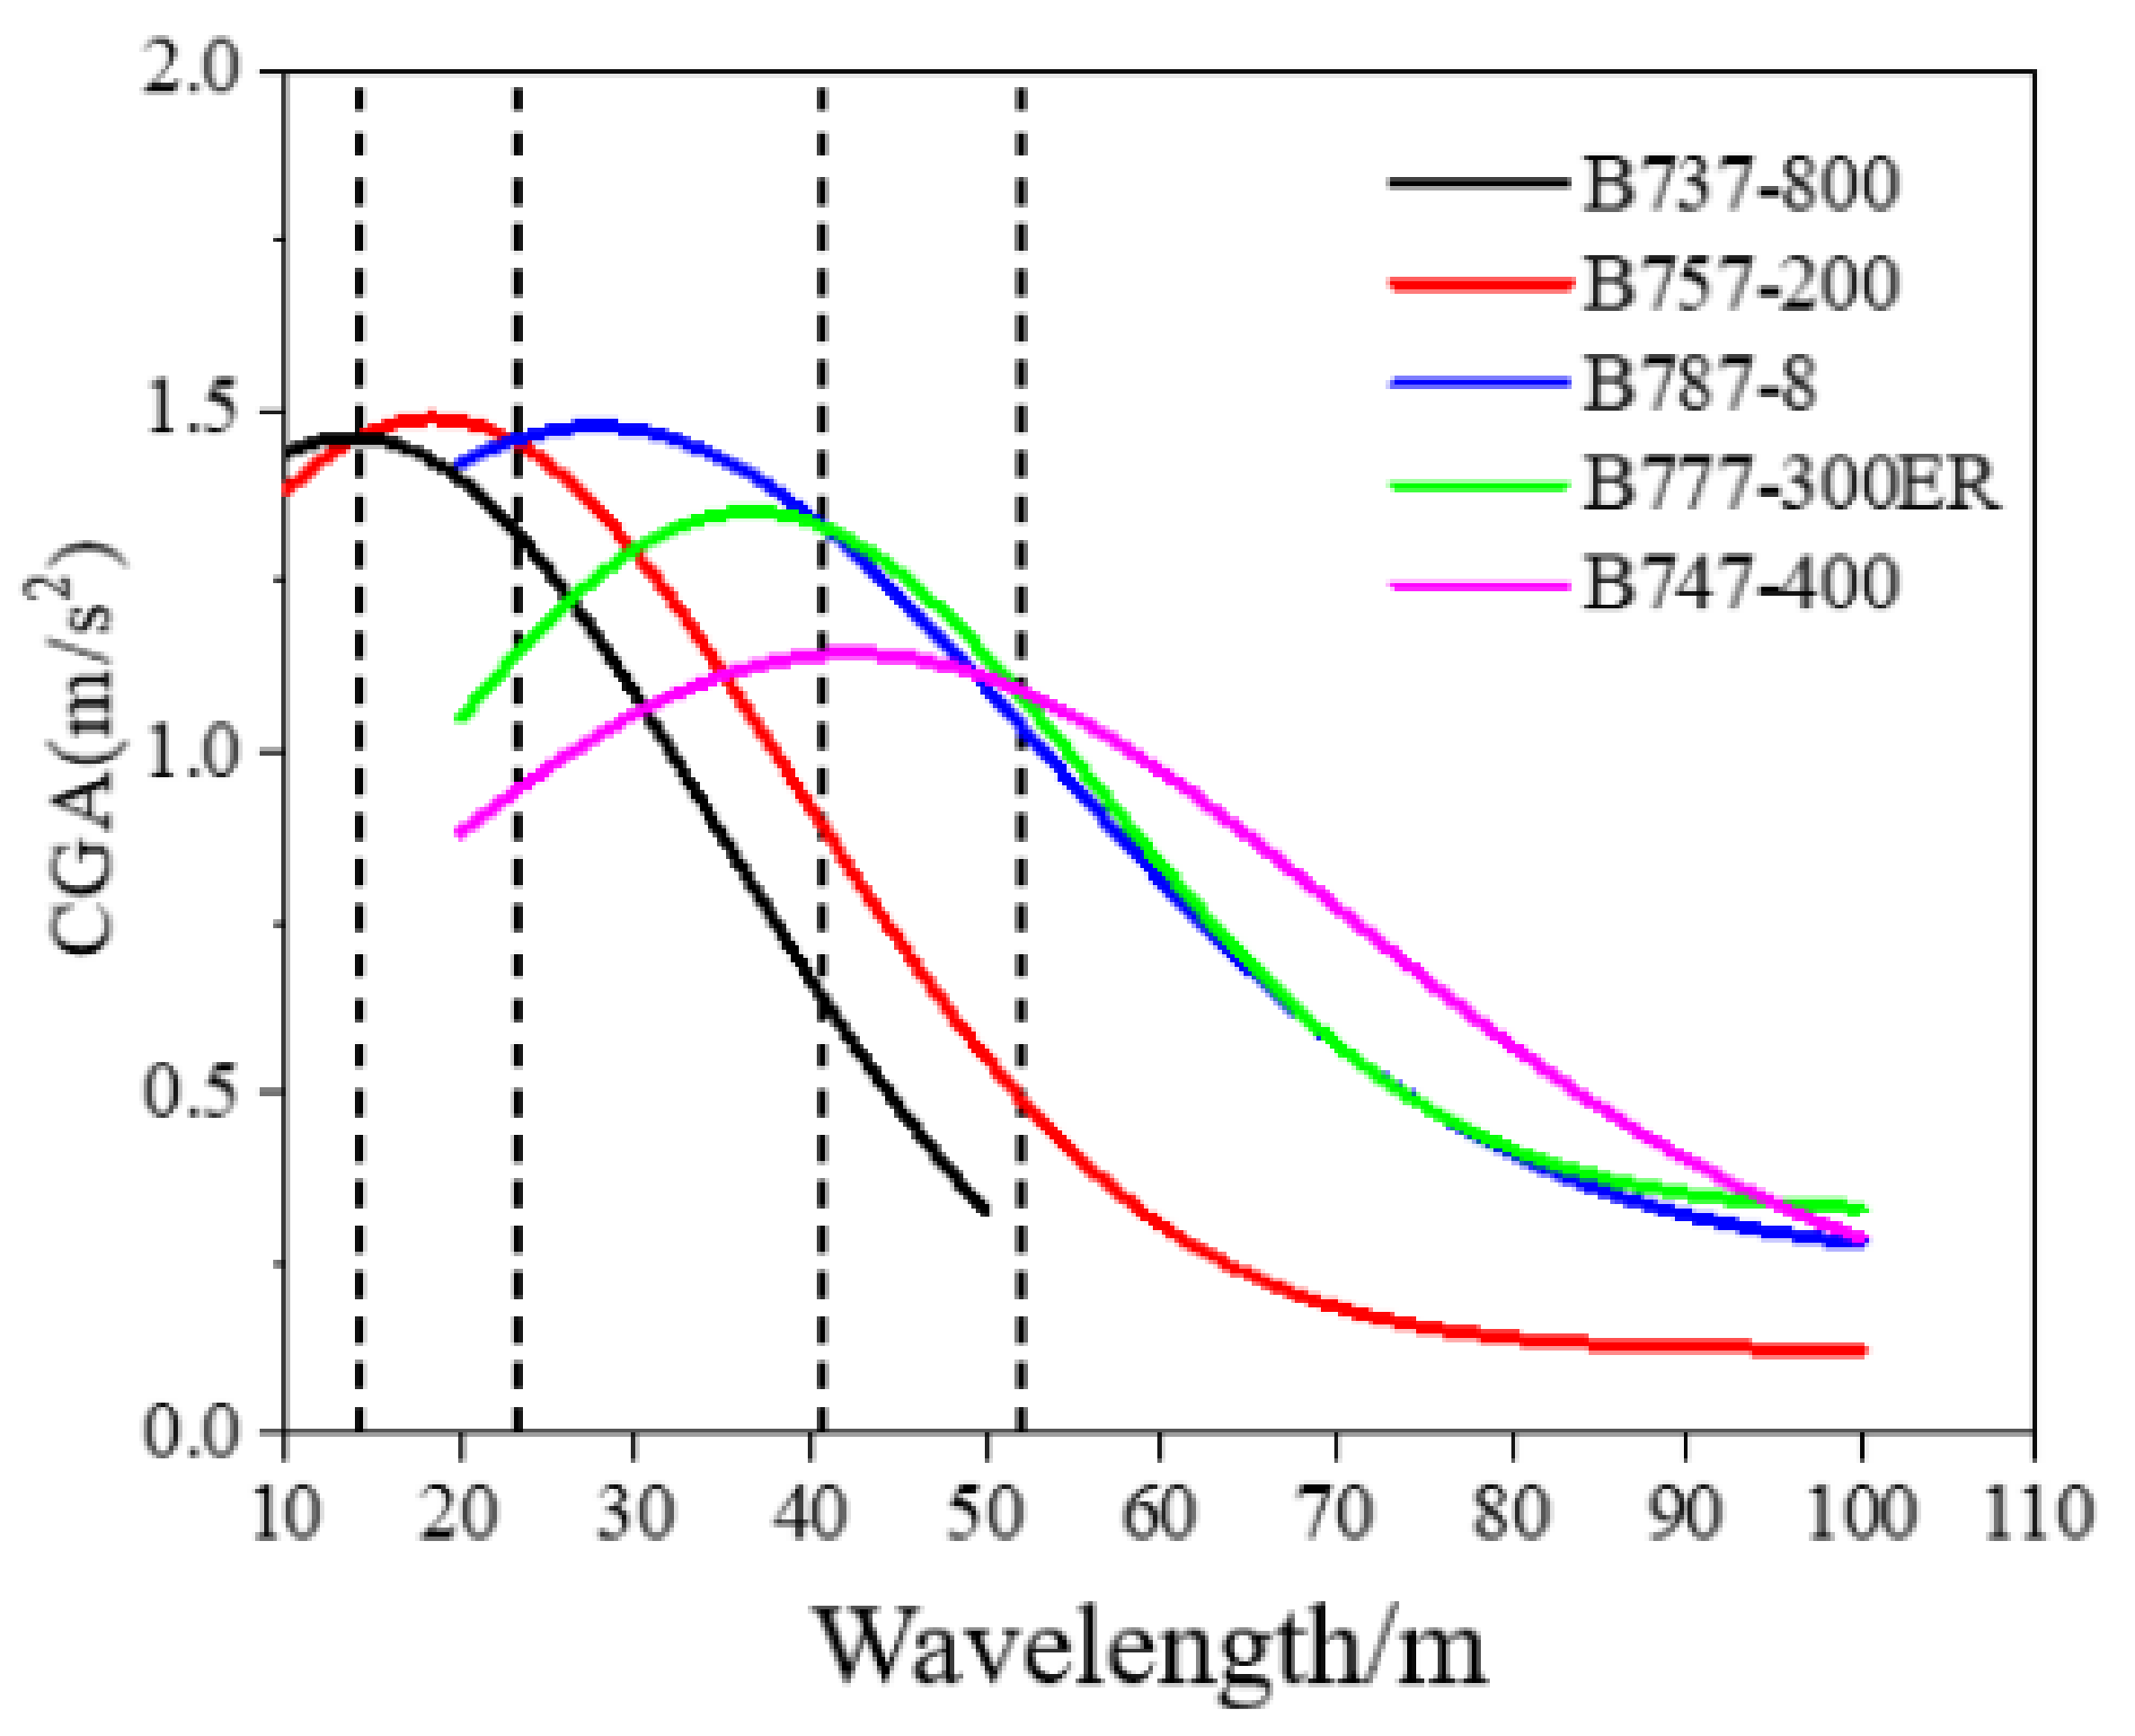
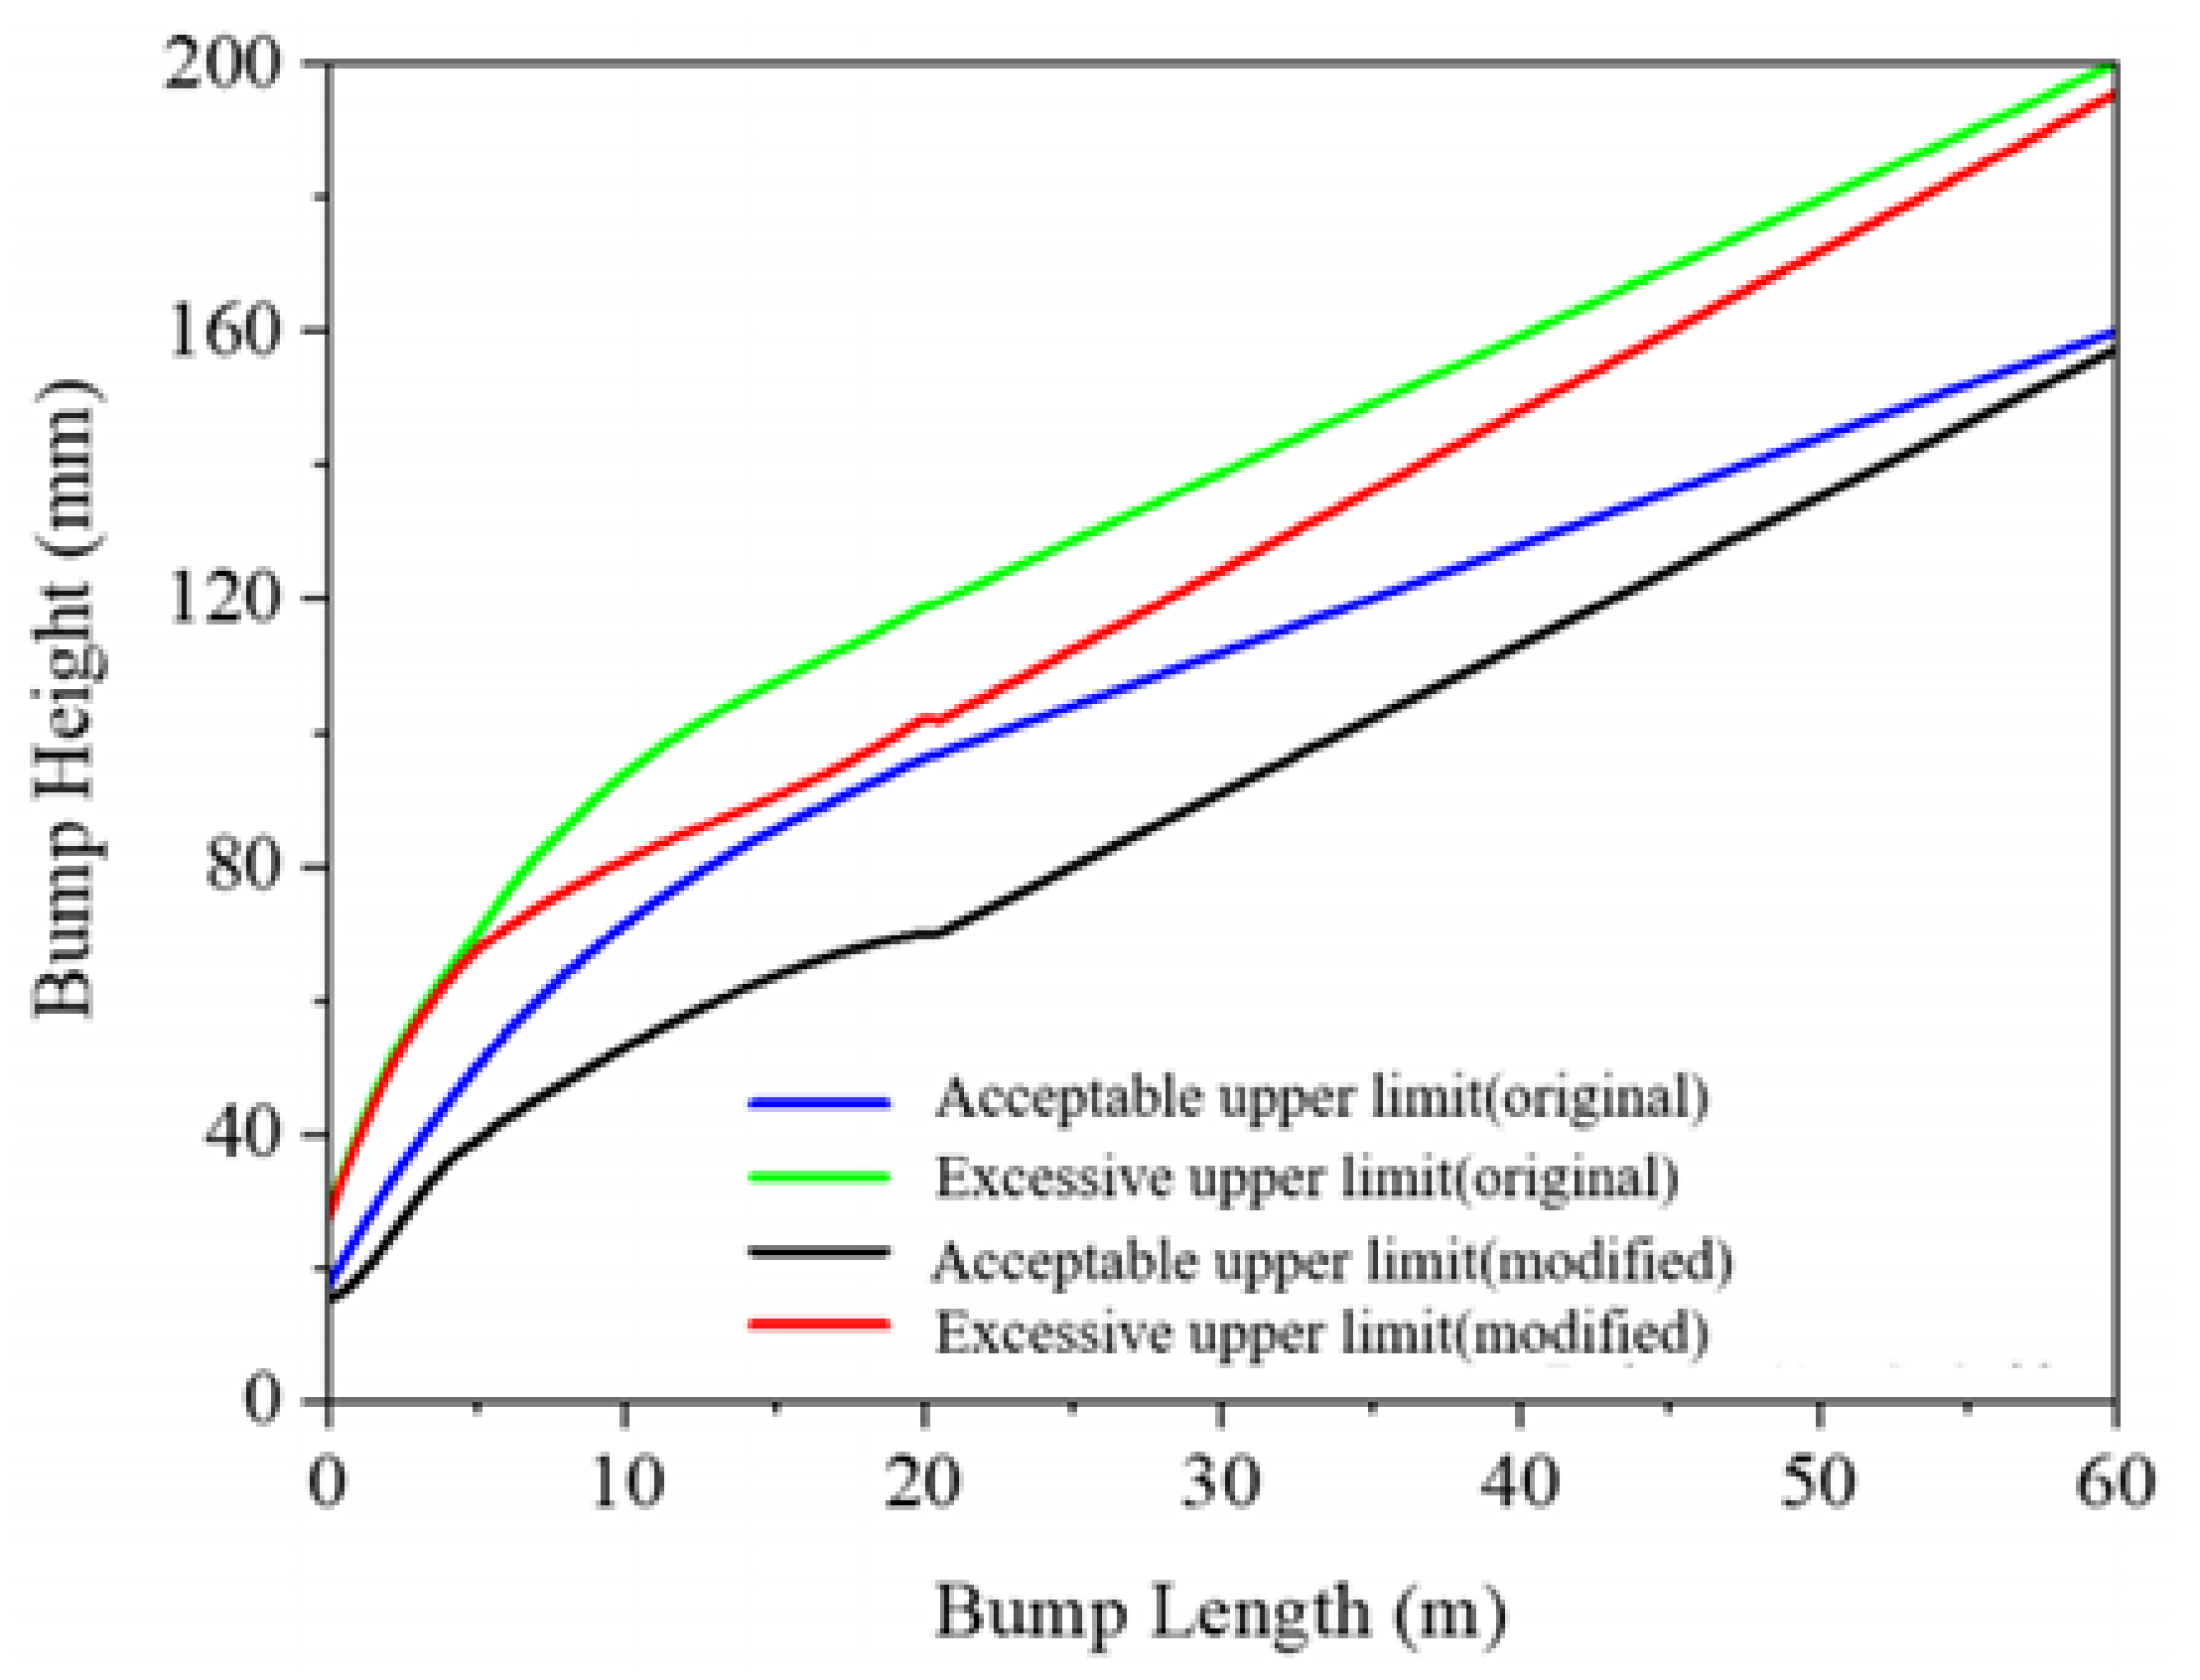
- Different wavelengths are associated with different aircraft types. Furthermore, the modification evaluation criteria are stricter than the criteria for the original Boeing Bump, especially for middle and long waves on the runway.
Author Contributions
Funding
Institutional Review Board Statement
Informed Consent Statement
Data Availability Statement
Conflicts of Interest
References
- Gerardi, A.G. Dynamic Response of Aircraft to Pavement Unevenness. In Proceedings of the Name of the Conference on Research in Airport Pavements, Atlanta, GA, USA, 30 April–3 May 2006; pp. 91–96, Number: 175. ISBN 0360-859X. [Google Scholar]
- Gerardi, A.; Kreuger, D. The Effects of Runway Roughness on Aircraft Fatigue Life. In Aircraft/Pavement Interaction: An Integrated System; ASCE: New York, NY, USA, 1991; pp. 77–95. [Google Scholar]
- Kirk, C.L. Analysis of Taxiing Induced Vibrations in Aircraft by the Power Spectral Density Method; Technical Report; Cranfield Institute of Technology: Bedford, UK, 1973. [Google Scholar]
- Chen, R.P. Generalized Power Spectral Density Analysis with Application to Aircraft Taxiing Problems. Ph.D. Thesis, Georgia Institute of Technology, Atlanta, GA, USA, 1969. [Google Scholar]
- Civil Aviation Administration of China. MH/T 5024-2009, Technical Specifications of Aerodrome Pavement Evaluation and Management. 2009. Available online: https://www.docin.com/p-119165177.html (accessed on 27 February 2021).
- Transport Canada. Measurement and Evaluation of Runway Roughness; Civil Aviation, Standards; Advisory Circular AC 302-023; Transport Canada: Ottawa, ON, Canada, 2015. [Google Scholar]
- Hayhoe, G.F. Airport pavement rideability rating for maintenance evaluation. In Proceedings of the 2016 Airports Conference, Hershey, PA, USA, 21–23 March 2016; Volume 22. [Google Scholar]
- Endo, K.; Himeno, K.; Kawamura, A.; Hachiya, Y.; Matsui, K. Evaluation of Longitudinal Runway Profile and Ride Quality Using Wavelet Analysis and Brain Waves. In Proceedings of the TRB 82nd Annual Meeting, Washington, DC, USA, 12–16 January 2003. [Google Scholar]
- Gervais, E.L. Runway roughness measurement, quantification and application: The Boeing approach. In Aircraft/Pavement Interaction: An Integrated System; ASCE: New York, NY, USA, 1991; pp. 121–131. [Google Scholar]
- Liu, S.; Ling, J.; Yuan, J.; Li, P.; Chen, J. Landing gear cumulative stroke-based runway roughness evaluation. In Proceedings of the 97th Annual Meeting of Transportation Research Board, Washington, DC, USA, 7–1 January 2018. [Google Scholar]
- Loprencipe, G.; Zoccali, P. Comparison of methods for evaluating airport pavement roughness. Int. J. Pavement Eng. 2019, 20, 782–791. [Google Scholar] [CrossRef]
- Woods, J.E. A Study of Airport Pavement-Aircraft Interaction Using Wavelet Analysis; The University of Texas: San Antonio, TX, USA, 2008. [Google Scholar]
- Ling, J.; Liu, S.; Li, M.; Yuan, J. Application limitation of Boeing Bump to evaluation of runway roughness. J. Tongji Univ. Nat. Sci. 2018, 46, 1035–1041. [Google Scholar]
- Gerardi, M. The Boeing Bump Index—Additional Methodologies Recommended. 2015. Available online: http://www.aprconsultants.com/wp-content/uploads/2016/01/Boeing-Bump-Article_Additional-Methodologies-Recommended.pdf (accessed on 27 February 2021).
- Zhu, L.; Chen, J.; Yuan, J.; Du, H. Taxiing load analysis of aircrafts based on virtual prototype. J. Tongji Univ. Nat. Sci. 2016, 44, 1873–1879. [Google Scholar]
- Civil Aviation Administration of China, Aerodrome Technical Standards MH5001-2013. 2013. Available online: https://wenku.baidu.com/view/685b6c6341323968011ca300a6c30c225801f051.html (accessed on 27 February 2021).
- The Boeing Company. 787 Airplane Characteristics for Airport Planning [R]. 2018. Available online: https://www.boeing.com/resources/boeingdotcom/commercial/airports/acaps/787.pdf (accessed on 27 February 2021).
- Federal Aviation Administration. Surface Roughness Study Final Data Report Boeing 737-800[M]; Federal Aviation Administration: Washington, DC, USA, 2015. [Google Scholar]
- Federal Aviation Administration. ProFAA: The Federal Aviation Administration Computer Program for Roughness Index Analyses: User’s Manual (Draft); Federal Aviation Administration: Washington, DC, USA, 2004. [Google Scholar]
- United States Military, Airplane Strength and Rigidity Reliability Requirements, Repeated Loads, Fatigue and Damage Tolerance. Military Specification. MIL-A-8866. 1987. Available online: http://everyspec.com/MIL-SPECS/MIL-SPECS-MIL-A/download.php?spec=MIL-A-8866C.019123.PDF (accessed on 27 February 2021).
- APR Consultants, Inc. APR’s BBI Plus Analysis, version 1.2.4; APR Consultants, Incorporated: Diamond Bar, CA, USA, 2002. [Google Scholar]


| Type | Models | Wingspan/m | Main Landing Gear Outer Wheel Spacing /m |
|---|---|---|---|
| C | B737, A320 series | 24–36 | 6–9 |
| D | B757, B767 series | 36–52 | 9–14 |
| E | B777, B787, B747, A330, A340 series | 52–65 | 9–14 |
| F | B747, A380 series | 65–80 | 14–16 |
| fuselage | geometric parameters | length of fuselage /m | 55.91 | engine bottom height above ground /m | 0.74 |
| wingspan/m | 60.12 | distance between engine and fuselage axis/m | 9.72 | ||
| nose height from ground/m | 3.5 | distance between engine and nose/m | 17.78 | ||
| weight parameters | maximum takeoff weight/kg | 227,930 | maximum landing weight/kg | 172,365 | |
| distribution coefficient of main landing gear weight | 91.2% | distance between center of gravity and nose landing gear/m | 20.8 | ||
| moment of inertia | 9,329,171 | 16,966,788 | |||
| 25,475,812 | |||||
| lift parameter | wing reference area / | 325 | pneumatic chord length /m | 7.52 | |
| aspect ratio | 8 | ||||
| landing gear | geometric parameters | nose main landing gear spacing/m | 22.78 | main landing gear wheel pitch/m | 1.3 |
| main landing gear spacing/m | 9.8 | nose landing gear total length/m | 1.24 | ||
| nose gear wheel pitch/m | 0.73 | main landing gear total length /m | 1.12 | ||
| fluid damping | nose landing gear compression damping parameter | 12 | main landing gear compression damping parameter | 60 | |
| nose landing gear extension damping parameter | 18 | main landing gear extension damping parameter | 90 | ||
| wheel | front wheel | 40 × 16 − 16.26 | tire radius /inch | 40 | |
| mass/kg | 255 | tire width /inch | 16 | ||
| Ixx, Iyy/kg·m2 | 44,998 | aspect ratio | 0.75 | ||
| Izz/kg·m2 | 77,416 | tire pressure /MPa | 1.29 | ||
| main wheel | 50 ×2 0 − 22 34PR | tire radius /inch | 20 | ||
| mass/kg | 392 | tire width /inch | 22 | ||
| , /kg·m2 | 45,757 | aspect ratio | 0.7 | ||
| /kg·m2 | 78,721 | tire pressure /MPa | 1.57 | ||
| Runway No. | Airport | Weighted Root Mean Square of Vertical Acceleration of Cockpit () | ||
|---|---|---|---|---|
| ProFAA | B737-800 Simulator | ADAMS/Aircraft | ||
| 47 | MSY | 0.25 | 0.15 | 0.15 |
| 51 | ORD | 0.23 | 0.17 | 0.12 |
| 54 | EWR | 0.37 | 0.2 | 0.21 |
| 57 | ACY | 0.29 | 0.2 | 0.17 |
| 63 | MDT | 0.39 | 0.22 | 0.19 |
| 68 | ACY | 0.31 | 0.19 | 0.18 |
| 70 | Trinidad | 0.64 | 0.32 | 0.4 |
| 75 | RUS | 0.63 | 0.42 | 0.5 |
| Average difference from simulator | 64% | 0% | 14% | |
| Aircraft Type | B737-800 | B757-200 | B787-8 | B777-300ER | B747-400 |
|---|---|---|---|---|---|
| Takeoff speed | 260 | 328 | 330 | 348 | 350 |
| 0.05 | 0.15 | 0.25 | 0.35 | 0.45 | 0.55 | 0.65 | 0.75 | |
| Number of Times | 300,000 | 165,000 | 27,000 | 2000 | 90 | 4 | 0.15 | 0.005 |
| Runway Roughness Classification | Peak Value of MGDLC | Peak Value of NGDLC | Peak Value of CGA and PSA () |
|---|---|---|---|
| Acceptable zone | <1.15 | <1.30 | ≤3.92 |
| Excessive zone | 1.15–1.35 | 1.30–1.70 | |
| Unacceptable zone | >1.35 | >1.70 | >3.92 |
| Aircraft Type | B737-800 | B757-200 | B787-8 | B777-300ER | B747-400 |
|---|---|---|---|---|---|
| For dynamic load coefficient | 80 | 100 | 120 | 120 | 120 |
| For vertical acceleration | 260 | 328 | 330 | 348 | 350 |
| aircraft types | MGDLC | NGDLC | ||
| peak responses after superposition | increased percentage compared to under single bump | peak responses after superposition | increased percentage compared to under single bump | |
| B737-800 | 1.031 | 3.1% | 1.080 | 6.1% |
| B757-200 | 1.017 | 2.2% | 1.046 | 4.4% |
| B787-8 | 1.004 | 2.2% | 1.023 | 4.1% |
| B777-300ER | 0.986 | 2.0% | 0.998 | 3.3% |
| B747-400 | 0.973 | 1.4% | 0.984 | 2.5% |
| aircraft types | CGA | PSA | ||
| peak responses after superposition (m/) | increased percentage compared to under single bump | peak responses after superposition (m/ | increased percentage compared to under single bump | |
| B737-800 | 0.55 | 25.9% | 0.65 | 48.5% |
| B757-200 | 0.45 | 22.4% | 0.62 | 45.5% |
| B787-8 | 0.44 | 16.7% | 0.51 | 41.6% |
| B777-300ER | 0.38 | 14.3% | 0.44 | 36.2% |
| Wavelength (m) | 0–15 | 15–25 | 25–40 | 40–50 | 50–120 |
|---|---|---|---|---|---|
| Aircraft type | B737-800 | B757-200 | B787-8 | B777-300ER | B747-400 |
| Wavelength (m) | Aircraft Type | Bump Height | Upper Limit of Bump Height in Acceptable Zone (mm) | Upper Limit of Bump Height in Unacceptable Zone (mm) |
|---|---|---|---|---|
| 3 | B737-800 | 1.5 | 21 | 44 |
| 5 | B737-800 | 2.5 | 27 | 53 |
| 7 | B737-800 | 3.5 | 33 | 60 |
| 10 | B737-800 | 5 | 39 | 68 |
| 15 | B757-200 | 7.5 | 48 | 75 |
| 20 | B757-200 | 10 | 51 | 81 |
| 25 | B757-200 | 12.5 | 60 | 86 |
| 30 | B787-8 | 15 | 63 | 90 |
| 35 | B787-8 | 17.5 | 68 | 96 |
| 40 | B777-300ER | 20 | 70 | 102 |
| 45 | B777-300ER | 22.5 | 73 | 107 |
| 50 | B747-400 | 25 | 75 | 110 |
| 55 | B747-400 | 27.5 | 85 | 119 |
| 60 | B747-400 | 30 | 90 | 125 |
| 70 | B747-400 | 35 | 100 | 137 |
| 80 | B747-400 | 40 | 110 | 148 |
| 90 | B747-400 | 45 | 125 | 160 |
| 100 | B747-400 | 50 | 136 | 172 |
| 110 | B747-400 | 55 | 145 | 184 |
| 120 | B747-400 | 60 | 155 | 195 |
Publisher’s Note: MDPI stays neutral with regard to jurisdictional claims in published maps and institutional affiliations. |
© 2021 by the authors. Licensee MDPI, Basel, Switzerland. This article is an open access article distributed under the terms and conditions of the Creative Commons Attribution (CC BY) license (http://creativecommons.org/licenses/by/4.0/).
Share and Cite
Liu, S.; Tian, Y.; Liu, L.; Xiang, P.; Zhang, Z. Improvement of Boeing Bump Method Considering Aircraft Vibration Superposition Effect. Appl. Sci. 2021, 11, 2147. https://doi.org/10.3390/app11052147
Liu S, Tian Y, Liu L, Xiang P, Zhang Z. Improvement of Boeing Bump Method Considering Aircraft Vibration Superposition Effect. Applied Sciences. 2021; 11(5):2147. https://doi.org/10.3390/app11052147
Chicago/Turabian StyleLiu, Shifu, Yu Tian, Le Liu, Peng Xiang, and Zhekai Zhang. 2021. "Improvement of Boeing Bump Method Considering Aircraft Vibration Superposition Effect" Applied Sciences 11, no. 5: 2147. https://doi.org/10.3390/app11052147
APA StyleLiu, S., Tian, Y., Liu, L., Xiang, P., & Zhang, Z. (2021). Improvement of Boeing Bump Method Considering Aircraft Vibration Superposition Effect. Applied Sciences, 11(5), 2147. https://doi.org/10.3390/app11052147