Article

A Mobility Prediction-Based Relay Cluster Strategy for Content Delivery in Urban Vehicular Networks

1
Jiangsu Key Laboratory of Wireless Communications, Nanjing University of Posts and Telecommunications, Nanjing 210003, China
2
Engineering Research Center of Health Service System Based on Ubiquitous Wireless Networks, Nanjing University of Posts and Telecommunications, Nanjing 210003, China
*
Author to whom correspondence should be addressed.
Appl. Sci. 2021, 11(5), 2157; https://doi.org/10.3390/app11052157
Submission received: 31 January 2021 / Revised: 23 February 2021 / Accepted: 25 February 2021 / Published: 28 February 2021

Abstract

:
In recent years, cache-enabled vehicles have been introduced to improve the efficiency of content delivery in vehicular networks. However, because of the high dynamic of network topology, it is a big challenge to increase the success probability of content delivery. In this paper, we propose a relay strategy based on cluster’s prediction trajectory for the situation of no cache near the request vehicles. In our strategy, the roadside unit (RSU) divides vehicles into clusters by their prediction trajectory, and then proactively caches contents at a cluster that will be about to meet the request vehicle. In order to decrease the probability of unsuccessful content delivery caused by communication duration that is too short between the request vehicle and content source vehicle, RSU caches content chunks at multiple vehicles in a cluster. By letting the request vehicle communicate with vehicle-caching content chunks one by one, our strategy enlarges the communication duration and increases the success probability. Our strategy also maximizes the success probability by optimizing the number of vehicles selected to cache content chunks. Besides, based on statistical characteristics of vehicles’ speed, we derive the formula of success probability of content delivery. The simulation results show that our strategy can increase the success probability of content delivery, as well as decrease time delay, for example. For example, we increase the success probability by about 20%. Since the trajectory prediction-based cluster-dividing mechanism can improve clusters’ stability at intersections, this method is well suited for urban road scenarios.

1. Introduction

With the dramatic development of intelligent transportation systems (ITS), various vehicular applications, including road safety, intelligent transportation, in-vehicle entertainment, and self-driving [1], occur in our daily lives. The smart road can supply vehicles with autonomous drive, but it needs a large quantity of data transmitted between road facilities and vehicles [2,3], which will absolutely increase the traffic of vehicular network. The increasing number of vehicles on the road sharply increases the traffic burden of vehicular networks, and the highly dynamic vehicular network makes vehicular communication links unstable. Consequently, the quality-of-experience of vehicle users is poor. In order to solve these problems, researchers and scholars have introduced in-network caching into the vehicular network.
In-network caching is a mechanism to cache contents in every node of the vehicular network, and vehicle members can obtain desired contents from neighbor nodes. However, caching increases the redundancy of contents cached in networks, which can shorten the communication links between content source nodes and request vehicles and decrease traffic burden of content servers and network. The authors of [4] introduced the Leave Copy Everywhere (LCE) mechanism, which lets nodes cache every passing content by itself. The authors of [5] introduce the probability mechanism, which lets nodes cache contents passing by itself with fixed value of probability. Non-Cooperative caching mechanisms, characterized by their relatively high redundancy of contents, waste the caching space of the network. Meanwhile, for cooperative caching mechanisms, nodes in the network can cooperate with each other, which can effectively reduce content redundancy. The Leave Copy Down (LCD) mechanism, described by the authors of [6], caches content in the next node after the source node along the transmission path. The authors of [7] demonstrated the Probcache mechanism, which caches content with probability values derived from some characteristics of content and the caching node. However, the mechanisms from researches discussed above fail to consider the factor of vehicular trajectory and ignore the frequent communication interruption problem caused by rapid vehicle movement.
Aiming at weakening the influence of vehicle movement characteristics, some researchers and scholars have chosen to predict future trajectory of vehicles and cache contents at suitable nodes to improve the system’s performance. The strategy described by the authors of [8] comprehensively considers the characteristics of the request vehicle, request content, and roadside units (RSUs), and caches the specific content chunks at suitable RSUs. The authors of [9] analyzed the request information and movement characteristics, constructed an optimization to minimize the time delay as well as the caching cost, and finally determined which contents the RSU should cache. The strategy described by the authors of [10] makes use of the neural network to predict the vehicles’ future trajectory, and caches the request content at the RSUs on the future trajectory of the vehicle. By analyzing vehicle’s historical trajectory, the authors of [11] used a prediction based on the Partial Matching (PPM) method to predict the vehicle’s probability of reaching different hotspot regions and to obtain the future trajectory of vehicles. Then, the prediction was used to determine whether to cache content at the vehicle. Using a dynamic Markov chain model to predict vehicle’s mobility, the authors of [12] cached corresponding contents before the vehicle generated its request and optimized the content retrieval latency. By modeling the movement of mobility clients as a second-order Markov chain, the authors of [13] established a network transition probability table to predict mobility clients’ trajectories and caches desired content at an access point (AP) on the prediction trajectories to increase the caching hit ratio of the network. Using deep learning to learn vehicles’ behavior, the authors of [14] introduced an effective proactive caching strategy to minimize the time delay. However, scholars from abovementioned research have only considered the movement characteristics of request nodes and have failed to take into account the relationship between request nodes and caching nodes, such as relative motion.
Vehicular network is characterized by high dynamic topology, which can be effectively reduced by dividing vehicles into clusters because vehicles staying at the same cluster have similar attributes, such as speed, position, and so on, and communication links among vehicles are more stable. The Lowest-ID (Identity) mechanism, depicted by the authors of [15], allocate sole IDs to every vehicle in the network and select the vehicle with the minimum ID value as the cluster head (CH). All vehicles in the coverage area of the CH are then considered cluster members (CM) of the CH. The authors of [16] demonstrated the Mobility Based on Clustering (MOBIC) mechanism, which selects the vehicle with minimum value of motion discrepancy between vehicles in the coverage area of itself as the CH, and all vehicles in the coverage area of the CH are CMs of the CH. The authors of [17] introduced the weighted clustering algorithm (WCA), which analyzes influences from motion, density, and energy, and calculates a weighted result as the metric to select the CH. Besides, cooperation between clusters and RSUs can lower the amount of redundant content, as well as increase the utilization ratio of caching space. The mechanisms described by the authors of [18,19] let RSUs cache contents with high popularity at CHs to fit vehicles from the present cluster or surrounding clusters. With the mechanism described by the authors of [20], vehicles determine whether to cache some specific contents by considering contents cached in themselves and clusters in which they stayed, which decreases the amount of redundant content. The authors of [21] let leaving vehicles transfer contents to vehicles entering the fixed region, whereby contents with high popularity can be cached at the area. Although the mechanisms from the abovementioned research can weaken the influence of high dynamic topology, the researchers have only focused on past or current positions and have failed to take into account the vehicles’ future trajectory, so the clusters have poor stability.
To sum up, the existing cluster-dividing mechanisms fail to well accommodate the high dynamic topology, especially in situations of urban areas, and vehicle clusters can easily disintegrate at intersections. So, we take into account vehicles’ future trajectories to enlarge the stability of clusters. In order to increase the success probability of content delivery, this paper proactively caches request contents at clusters which will meet the request vehicle on its future trajectory. This paper also adopts the multiuser multichannel transmission mode in the communication process.
The main contributions of our paper are summarized as follows:
  • We propose a proactive caching strategy based on the cluster’s prediction trajectory, which divides vehicles into clusters according to the vehicles’ prediction trajectory. RSUs proactively cache content chunks at a cluster that will meet the request vehicle on the prediction trajectory. By letting vehicles receive content chunks from vehicles on the opposite road one by one, we enlarge the communication duration between the request vehicle and content source vehicle and increase the success probability of content delivery. Besides, in order to increase the success probability of content delivery between the request cluster and content source cluster, we introduce the multiuser multichannel transmission mode into the communication process between clusters.
  • Aiming at increasing stability of clusters, we treat vehicles’ prediction trajectory as one of considerations of cluster division. By giving CMs the same prediction trajectory, we can obtain the cluster’s prediction trajectory, which is the same as that of the vehicles’ in the cluster.
  • Based on the prediction trajectory of the request vehicle and clusters, as well as the vehicle’s speed, the RSU proactively caches content chunks at multiple vehicles in the corresponding cluster. During the process, the RSU formulates the optimal number of content chunks to maximize the success probability of content delivery.
  • Based on the statistical characteristics of vehicle’s speed, vehicle flow, and the number of request arrivals in RSU, we theoretically derive the success probability of content delivery. The simulation results verify the validity of the process of derivation and demonstrate that this paper improve the system’s performance in terms of time delay, as well as the success probability of content delivery. In comparison with the results achieved by the authors of [19], we increase success probability by about 20%.
The rest of this paper is organized as follows. The system model is presented in Section 2. In Section 3, we depict the content request and delivery process, introduce the cluster dividing algorithm, optimize the caching strategy, and derive a formula for the success probability of content delivery. Section 4 shows the simulation results and illustrates the performance of our proposed strategy. Section 5 summarizes the paper.

2. System Model

In this section, as shown in Figure 1, we consider a bidirectional two-lane urban area which has 2 I lanes that have the same size with length E and width D . i and i + I , i [ 1 , I ] denote the two lanes of the dual carriageway, respectively. The traffic flow is different in different lanes, and we assume the vehicle number of an area of lane i follows a Poisson Point Process, with a rate of λ i per unit area [22]. For example, K denotes the vehicle number of lane i and the probability distribution function of K :
P i { K = k } = ( λ i D E ) k k ! e λ i D E
Especially, the two lanes of a dual carriageway have the same distribution parameter, and there holds λ i = λ i + I , i [ 1 , I ] .
Assuming that the speed of vehicles on different streets is different, and the speed of vehicles in the same lanes follows the same Truncated Normal Distribution [23], the probability density function of speed, defined by s i of vehicles on lane i , is given as follows:
f ( s i ) = { c i 2 π σ i e ( s i μ i ) 2 2 σ i 2 ,     s min s i s max 0                        ,     e l s e
where μ i and σ i denote the mean and standard deviation of s i , and parameter c i ensures the accumulated probability of f ( s i ) equals 1 in the range [ s min , s max ] , which can be used to determine the value of c i , especially, s i and s i + I have the same probability density function.
Because the speed of any two vehicles is independent of each other, the joint probability density function of speed s i x and speed s i y of two vehicles in lane i is derived as follows:
f ( s i x , s i y ) = f ( s i x ) f ( s i y ) = { c i 2 2 π σ i 2 e ( s i x μ i ) 2 + ( s i y μ i ) 2 2 σ i 2 , s min s i x s max , s min s i y s max               0           ,                             e l s e                  
The distribution function of speed s i can be derived from Formula (2) as follows:
F ( s i ) = { 1 , s i > s max s min s i f ( t ) d t , s min s i s max 0 , s i < s min
Each intersection in our system has an RSU. RSUs connect with the internet, and RSUs are linked to their neighboring counterparts, whereby vehicles can obtain all desired content. Assuming that M RSUs exist in this area, RSU is denoted by R m , and the subscript m denotes the sequence number of R m , all RSUs have the same communication range with R r s u , as well as the same maximum transmission rate with R m a x , and the number of request arrival at R m , m [ 1 , M ] obeys the distribution of Poisson Process with parameter λ m r s u . Vehicles in our system are denoted by V x , where the subscript x denotes the sequence number of V x , and all vehicles have the same transmission range with r v .
The authors of [24] indicated that the request for content approximately follows a Zipf distribution. Accordingly, we assume that the amount of content in the content library is L , and every content has the same size of W . Vehicles’ requests for content in the library obeys the Zipf distribution, and content with higher popularity has a higher probability of being requested. The probability of requesting the content with popularity ranked at τ is given as follows:
f τ = τ γ j = 1 L j γ , τ [ 1 , L ]
where γ means the parameter of Zipf distribution. As the value of γ increases, the vehicles will more frequently request content with high popularity. τ denotes the popularity rank of content in the library.
Vehicles in our system have limited caching capacity, which is divided into two parts: Caching space and relay space. The former is used to cache the content which is of high popularity or is attractive to the vehicle user, and it can accommodate content with the maximum number of N ( N < L ) . The latter is used to temporarily cache content chunks that will be delivered to the request vehicle when the vehicle meets the request vehicle. The vehicles selected to temporarily cache content are called as the relay vehicles. Because the relay space only caches part of the content, the amount of content that the relay space can cache was set to 2. The common symbols are showed in Table 1.

3. Content Acquisition Process and Caching Algorithm Optimization

3.1. Content Acquisition Process

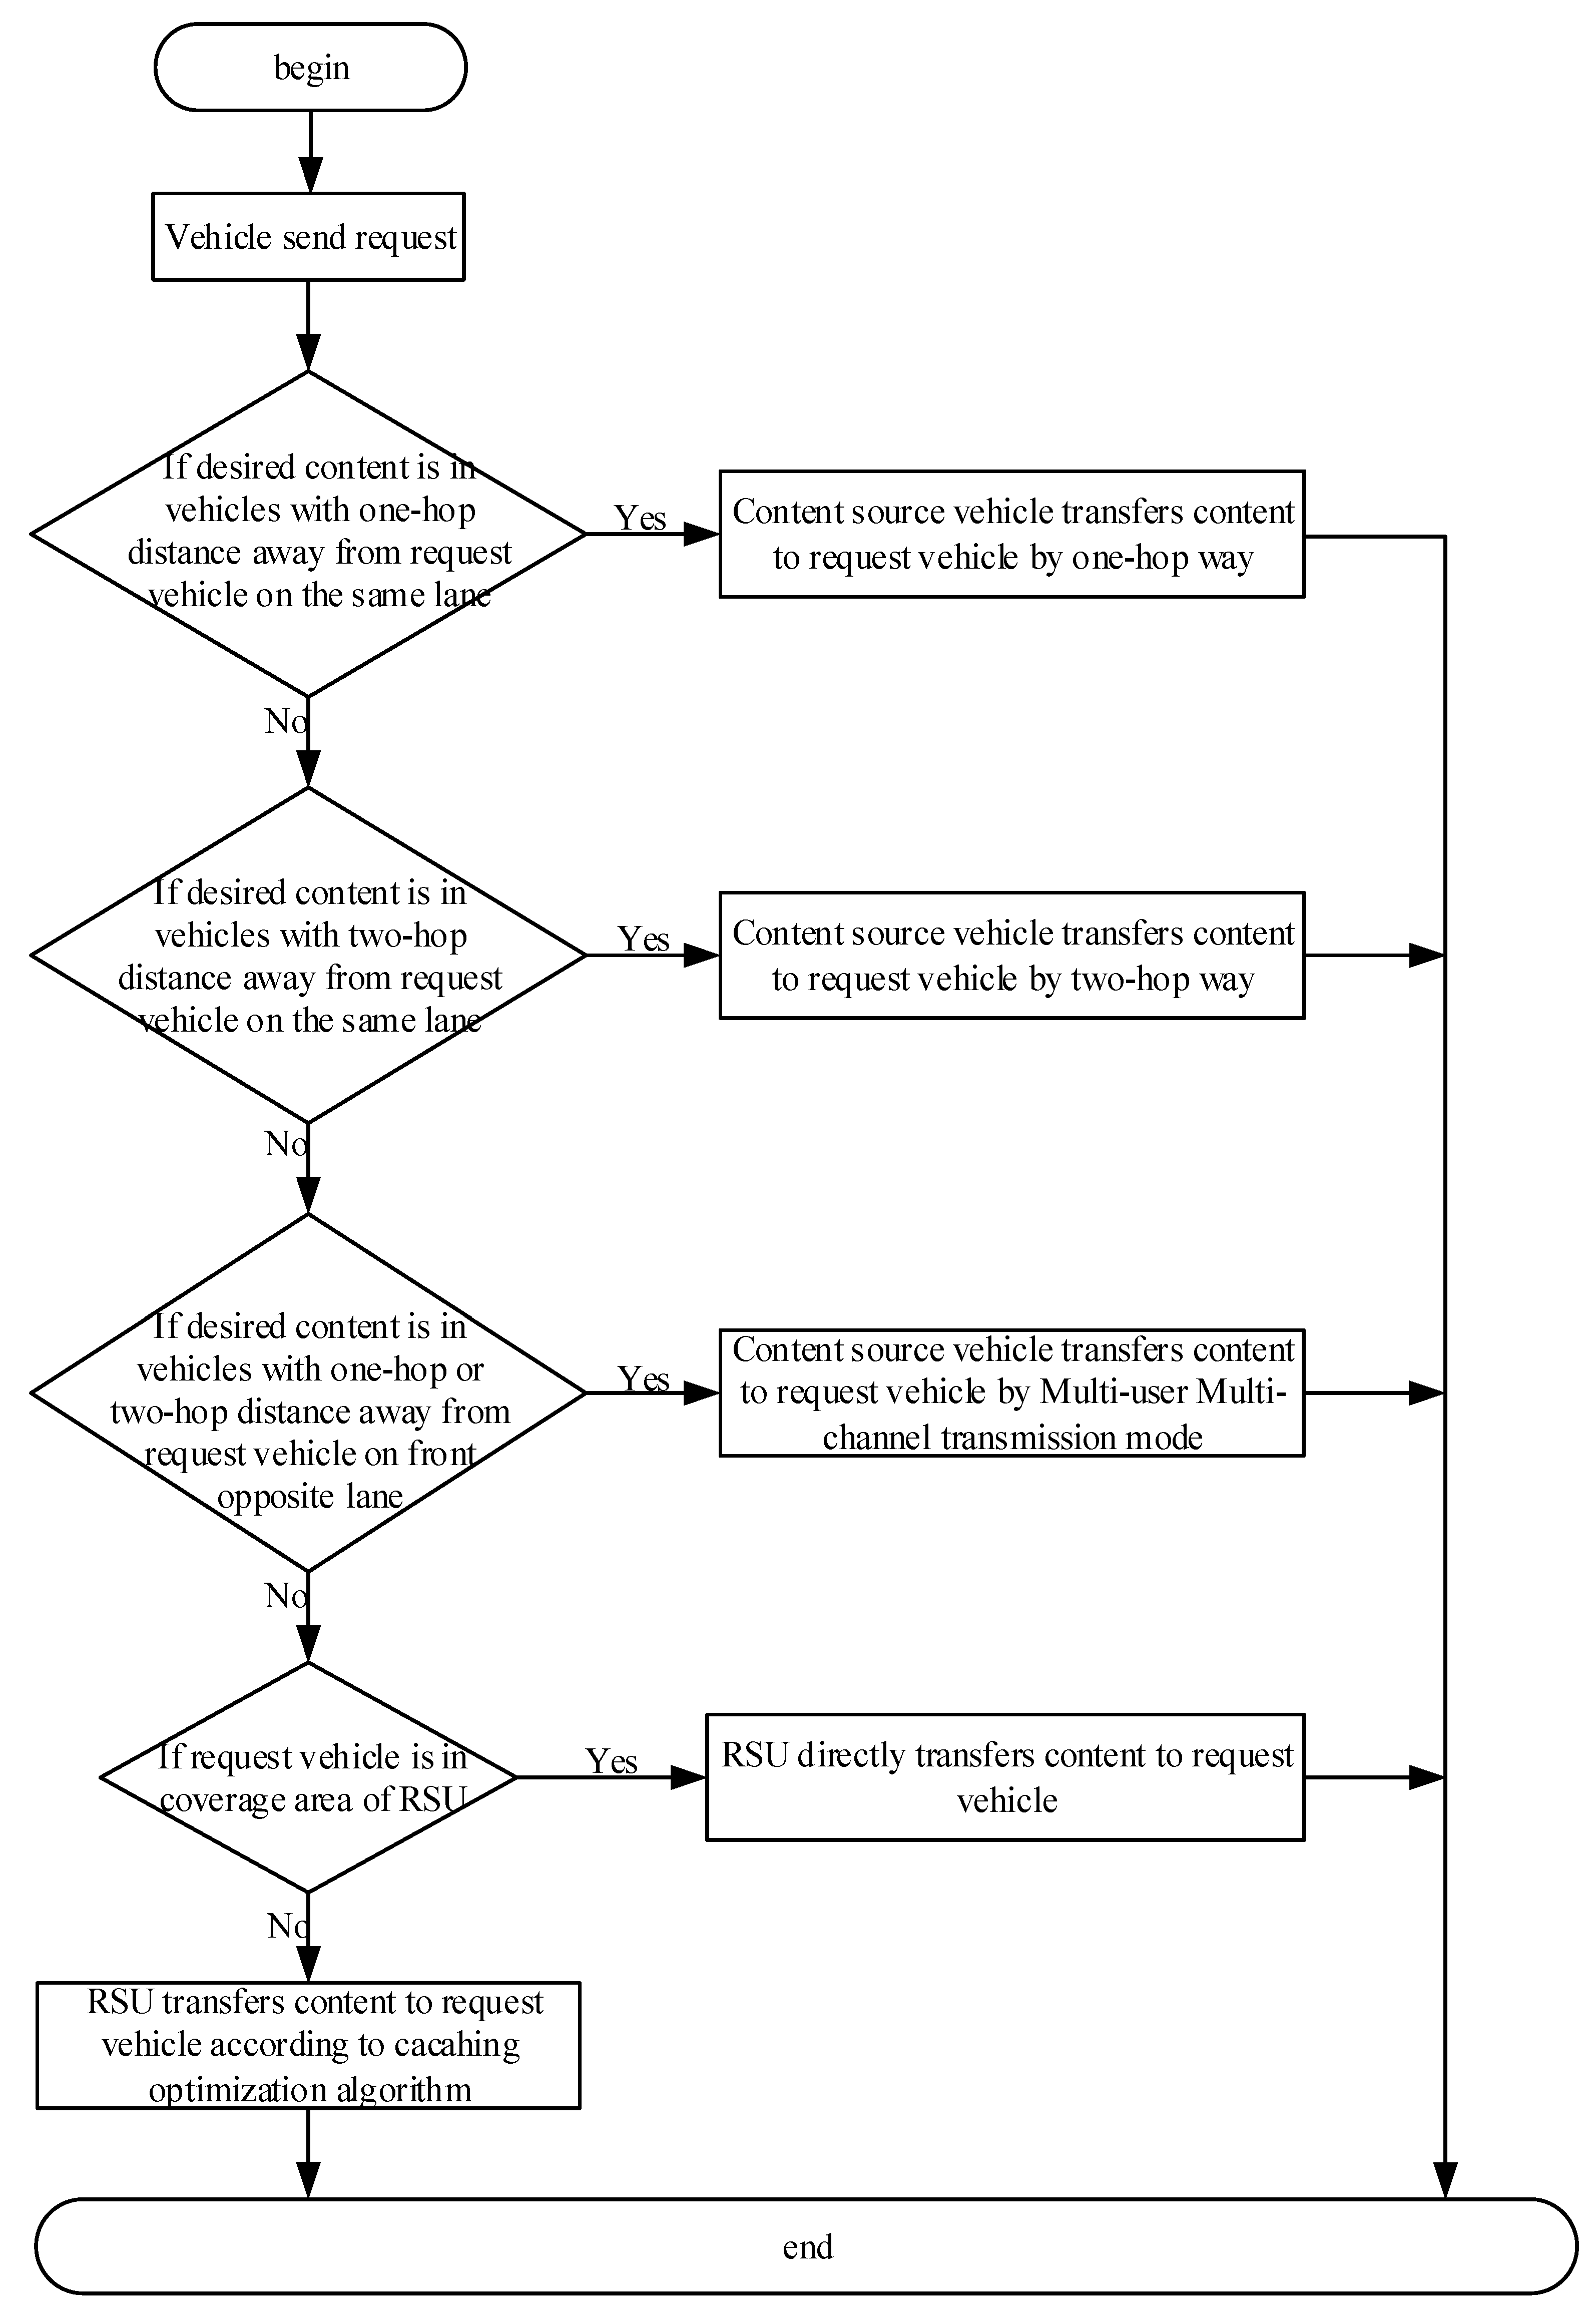
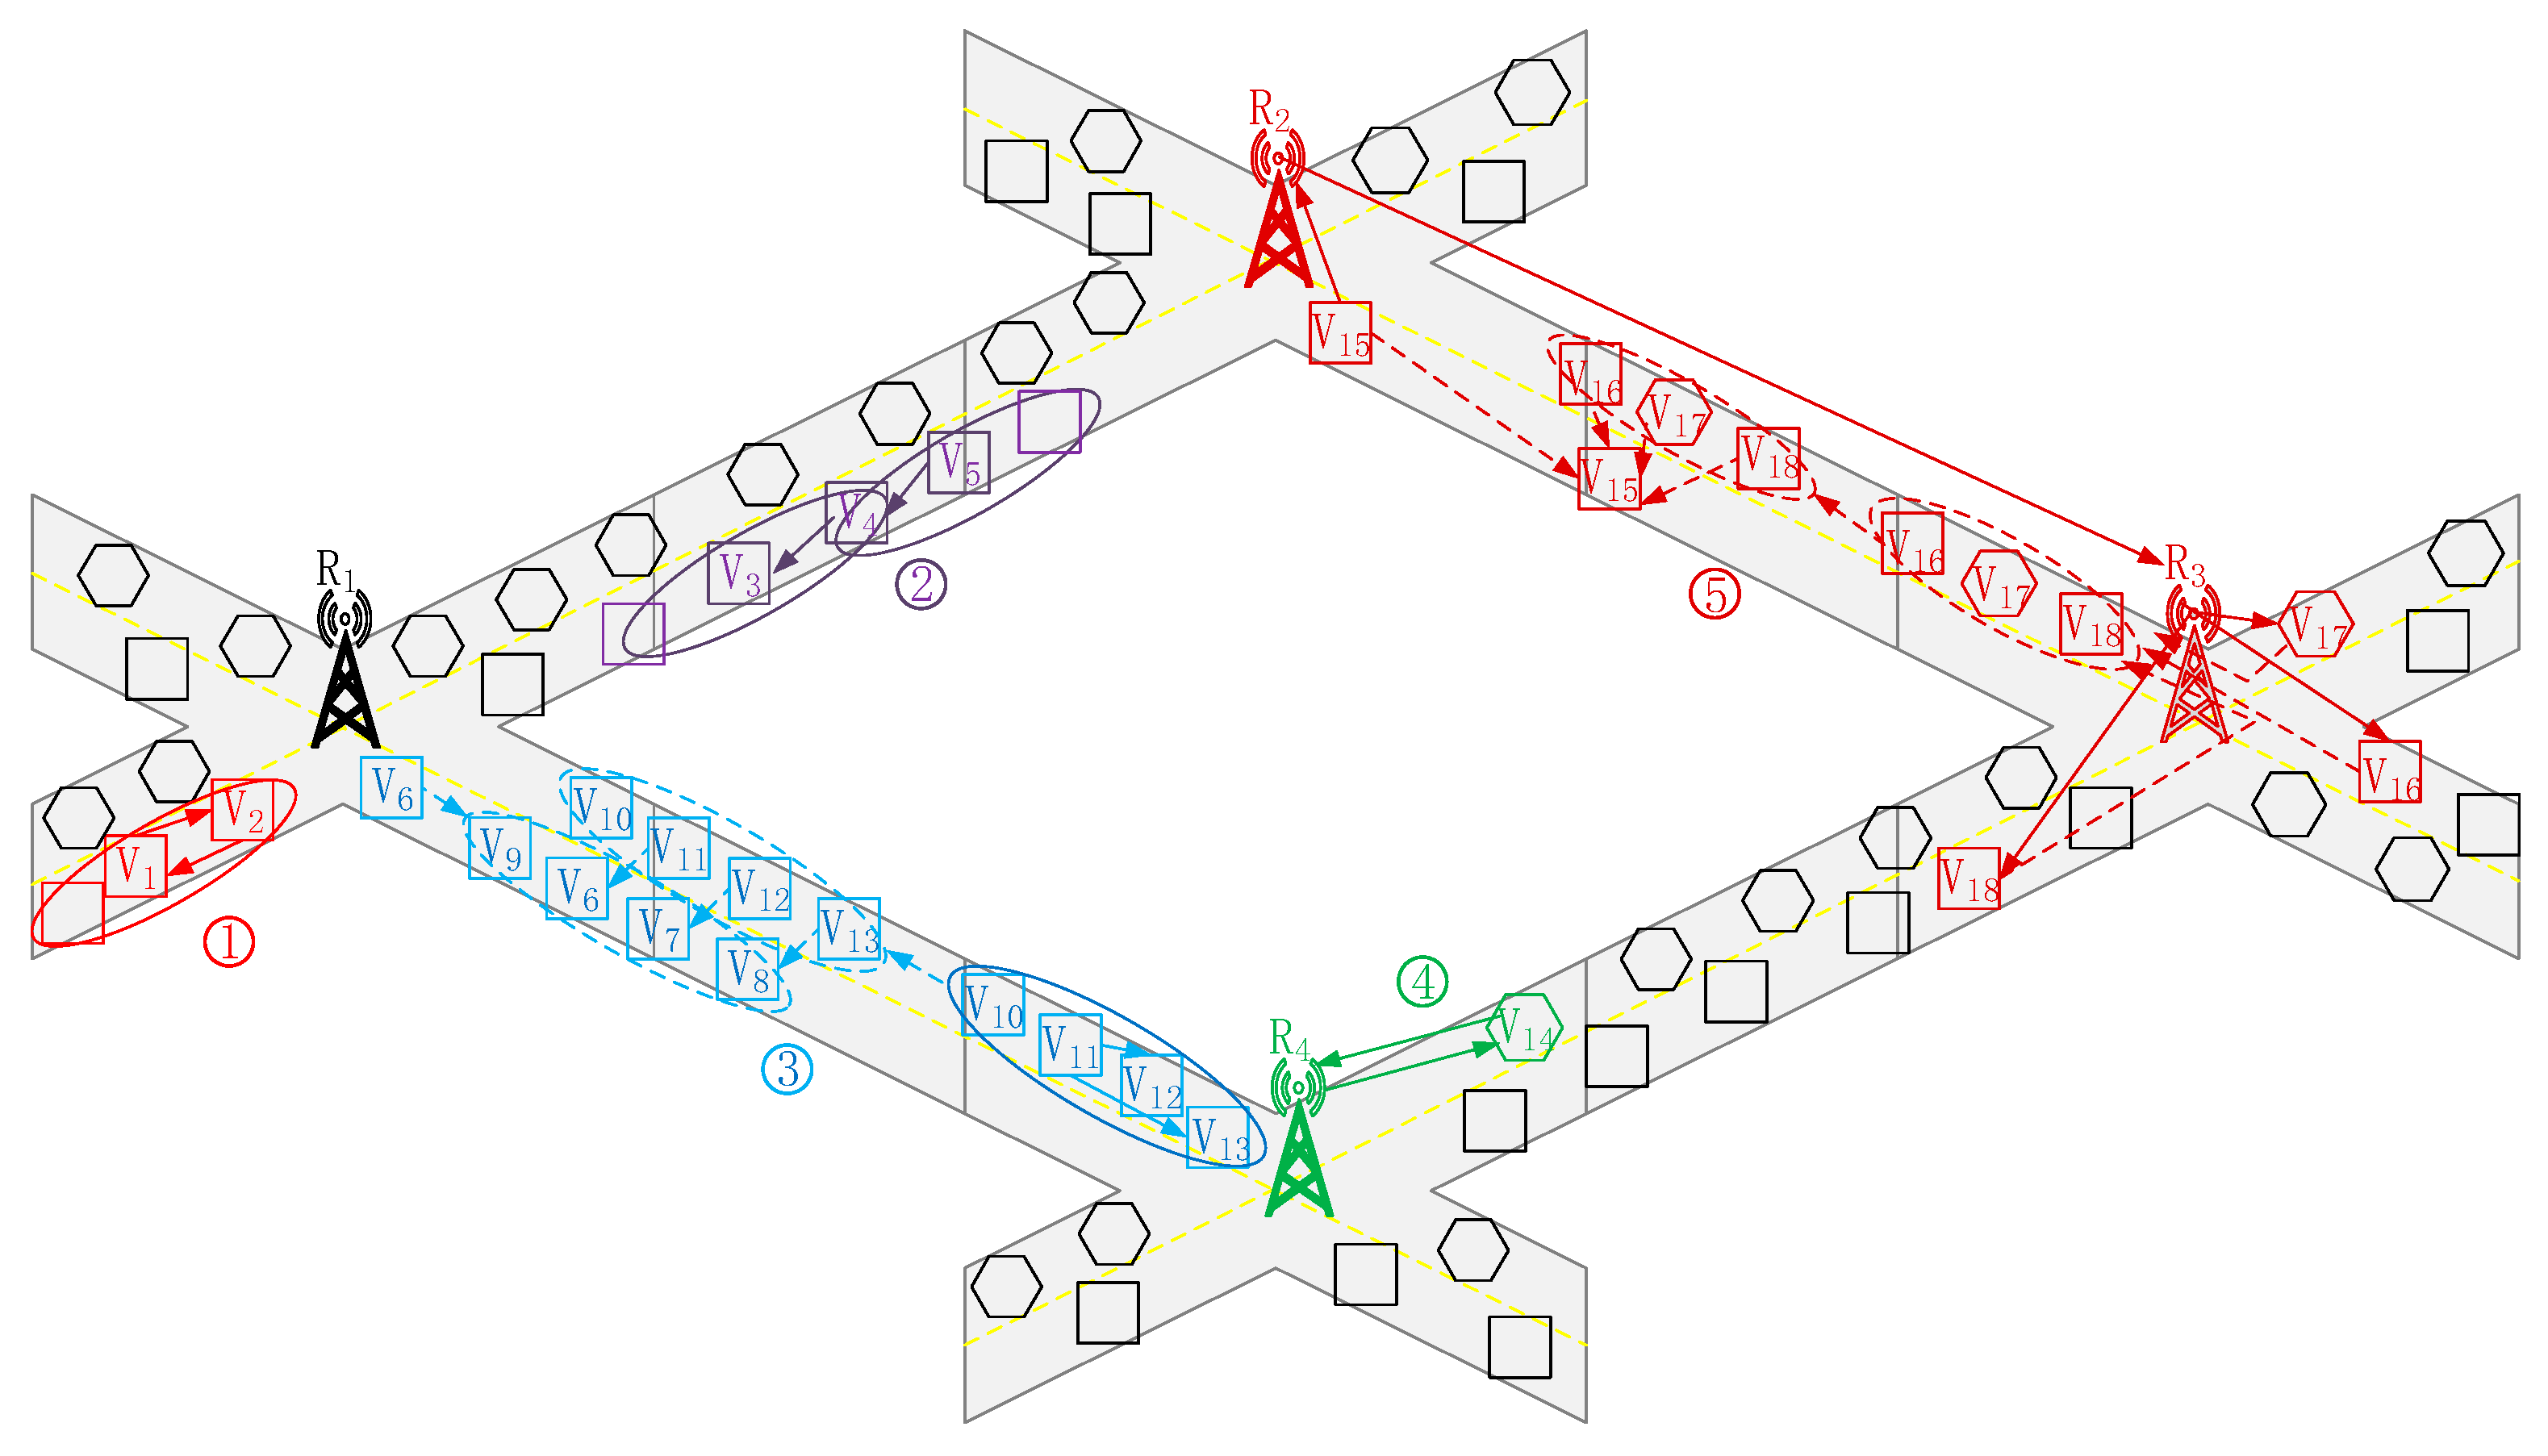
In vehicular networks, vehicles can obtain desired content from neighboring vehicles as well as RSUs, and the content acquisition process is illustrated in Figure 2. In our strategy, as shown in Figure 3, there are five cases of content acquisition. In case ➂ and case ➄, the request vehicles obtain desired content from other vehicles on opposite lanes. Request vehicles and content source vehicles drive in opposite directions, which can easily lead to unsuccessful content transmission due to communication duration times being too short. For example, assuming that the speed of vehicles is 50 km/h and the coverage range of vehicle is 50 m, the communication duration time will be around 7.2 s. If the transmission rate is 1 Mbit/s, then the transmission volume of content is no more than 7.2 Mbit. However, the volume of desired content of vehicle users always exceeds 7.2 Mbit, which means that the situation of unsuccessful transmission occurs easily. So, our strategy caches content chunks using multiple vehicles, which shortens the volume of content transferred from the content source vehicle to the request vehicle and increases the probability of successful content transmission. The process of content acquisition for vehicle users is as follows.
➀ The request vehicle will first searches for desired content among vehicles that are a one-hop distance from itself in the same lane. If the desired content exists, then the content source vehicle will directly transfer content to the request vehicle. As shown in Figure 3, V 2 caches the content that V 1 requests, and V 2 directly transfers the content as it receives the request from V 1 .
➁ If the request vehicle fails to find desired content among vehicles that are a one-hop distance from itself in the same lane, then the request will be delivered to vehicles that are a two-hop distance from the request vehicle in the same lane. If the desired content exists, then the content source vehicle will transfer the content to the request vehicle that is a two-hop distance away, meaning that the content source vehicle will first transfer the content to a relay vehicle, and then the relay vehicle will transfer the content to the request vehicle. As shown in Figure 3, V 5 , which is a two-hop distance from V 3 , caches the content V 3 desires. V 5 first transfers the content to the relay vehicle V 4 , and then V 4 transfers the content to V 3 .
➂ If the request vehicle fails to find desired content among vehicles that are a one-hop or two-hop distance from itself in the same lane, then the request will be forward-delivered to vehicles that are a one-hop or two-hop distance from the request vehicle in the opposite lane. If the desired content exists, then the request vehicle and content source vehicle will separately act as CHs and make vehicles that are a one-hop distance from themselves in the same lane become CMs to construct the request cluster and the content source cluster. On this basis, according to caching optimization algorithm depicted in Section 3.2, the content source vehicle will averagely divide content into multiple chunks and cache them at multiple relay vehicles in content source cluster, and those vehicles will transfer content chunks to vehicles in request cluster using the multiuser multichannel transmission mode. As shown in Figure 3, V 11 caches the content V 6 requests. Then, V 10 , V 11 , V 12 , and V 13 constitute the content source cluster, and V 6 , V 7 , V 8 , and V 9 constitute the request cluster after the request arrives at V 11 . According to caching optimization algorithm, V 11 divides the content into three chunks and separately caches them at V 11 , V 12 , and V 13 . During the transmission process, V 11 , V 12 , and V 13 separately transfer content chunks to V 6 , V 7 , and V 8 , and then V 6 receives the remaining content chunks from V 7 and V 8 .
➃ If the request vehicle fails to find the desired content among vehicles that are a one-hop or two-hop distance away from the request vehicle in the same lane or in the front opposite lane, then the request will be delivered to an RSU. When the request vehicle is situated in the coverage area of the RSU, the request vehicle directly obtains desired content from the RSU. As shown in Figure 3, the request of V 14 is delivered to R 4 , and then R 4 directly transfers content to V 14 .
➄ When the request vehicle is situated out of coverage area of the RSU, the RSU ahead of the request vehicle divides vehicles in its coverage area into clusters by their prediction trajectory. According to caching optimization algorithm depicted in Section 3.2, the RSU divides the content into multiple chunks averagely and caches them at multiple relay vehicles in a cluster that are about to meet request vehicle. As shown in Figure 3, R 2 delivers the request of V 15 to R 3 . Vehicles going to drive in the opposite lane of V 15 constitute the caching cluster, and R 3 chooses V 16 , V 17 , and V 18 from the cluster to cache content chunks. During communication process, V 15 receives content chunks from V 16 , V 17 , and V 18 one by one.

3.2. Caching Optimization Algorithm

3.2.1. Cluster-Dividing Mechanism

RSUs not only provide services for vehicles in the coverage area of themselves, but also proactively cache content at clusters going to meet request vehicles based on the requests forwarded by neighboring RSUs. Because the content transmission process between the clusters and request vehicles happens on the prediction trajectory of clusters, our mechanism makes use of neural network to predict the vehicles’ behavior among turning left, going straight, turning right, and turning around at intersections. According to the prediction results, vehicles in the coverage area of RSUs were divided into different clusters.
Our mechanism makes use of a three-layer neural network to predict the vehicles’ behavior, and the structure of the used neural network is shown in Figure 4. The neural network has a SoftMax layer behind the output layer, as well as a sigmoid activation function in the hidden layer. Some attribute information of the vehicle can affect the driver’s driving behavior, for example, departure places and destinations can be used by drivers to select the most convenient path, and the drivers will take different choices at different times and different positions. Therefore, the input parameters of the neural network are defined as x 1 , denoting departure place; x 2 , denoting the destination; x 3 , denoting the current position; and x 4 , denoting the current time. A four-length vector can be input into the input layer of the used neural network. The hidden layer has two implicit layers with node numbers of 17 and 21. The output layer also a four-length vector, in which y 1 , y 2 , y 3 , and y 4 denote the probability of turning left, going straight, turning right, and turning around. In the paper, 9149 sets of driving data were obtained from the urban road environment stimulated by SUMO (Simulation of Urban Mobility) [25], and the proportion of training data and test data was 8:2. In order to depict prediction results in terms of probability, we added a SoftMax layer behind the hidden layer to normalize the output of hidden layer. The SoftMax function [26] is expressed as follows:
s o f t m a x ( x a ) = e x a j e x j
The SoftMax function can map the output of hidden layer to the range of ( 0 , 1 ) , by which the neural network can predict the probability of turning left, going straight, turning right, and turning around. The neural network will then treat the result with the maximum probability as the behavior of vehicles.
The neural network considers the cross-entropy between the behavior distribution of the training output and the historical actual data as the objective function. By minimizing the value of objective function, our mechanism obtains network parameters and completes the training process. The objective function is formulated as follows:
J ( θ ) = - 1 N s [ g = 1 N s j = 1 4 Y g , j log ( s o f t m a x ( y g , j ( θ ) ) ) ]
where N s denotes the sample number of training, [ Y g , 1 , Y g , 2 , Y g , 3 , Y g , 4 ] denotes the actual result of the g-th sample, and [ y g , 1 ( θ ) , y g , 2 ( θ ) , y g , 3 ( θ ) , y g , 4 ( θ ) ] denotes the training output of the g-th sample.
The training process of the neural network uses the gradient descent to find the set θ to minimize J ( θ ) , and the performance of the neural network can be illustrated by the prediction accuracy, which can be derived by dividing the number of correct predictions to the volume of test data. Our paper compares the prediction accuracy when the activation function is the sigmoid function and tanh function. The relationship between the prediction accuracy and training times is shown in Figure 5, which shows that prediction accuracy increased with the increase of training times, and that the prediction accuracy reached nearly 1 after 30 rounds training. Figure 5 also shows that the effect of the sigmoid function was better than that of the tanh function, so we chose the sigmoid function as the activation function. The neural network can predict the behavior of vehicles with high accuracy after finishing training. The cluster-dividing algorithm based on the vehicles’ prediction trajectory is discussed next.
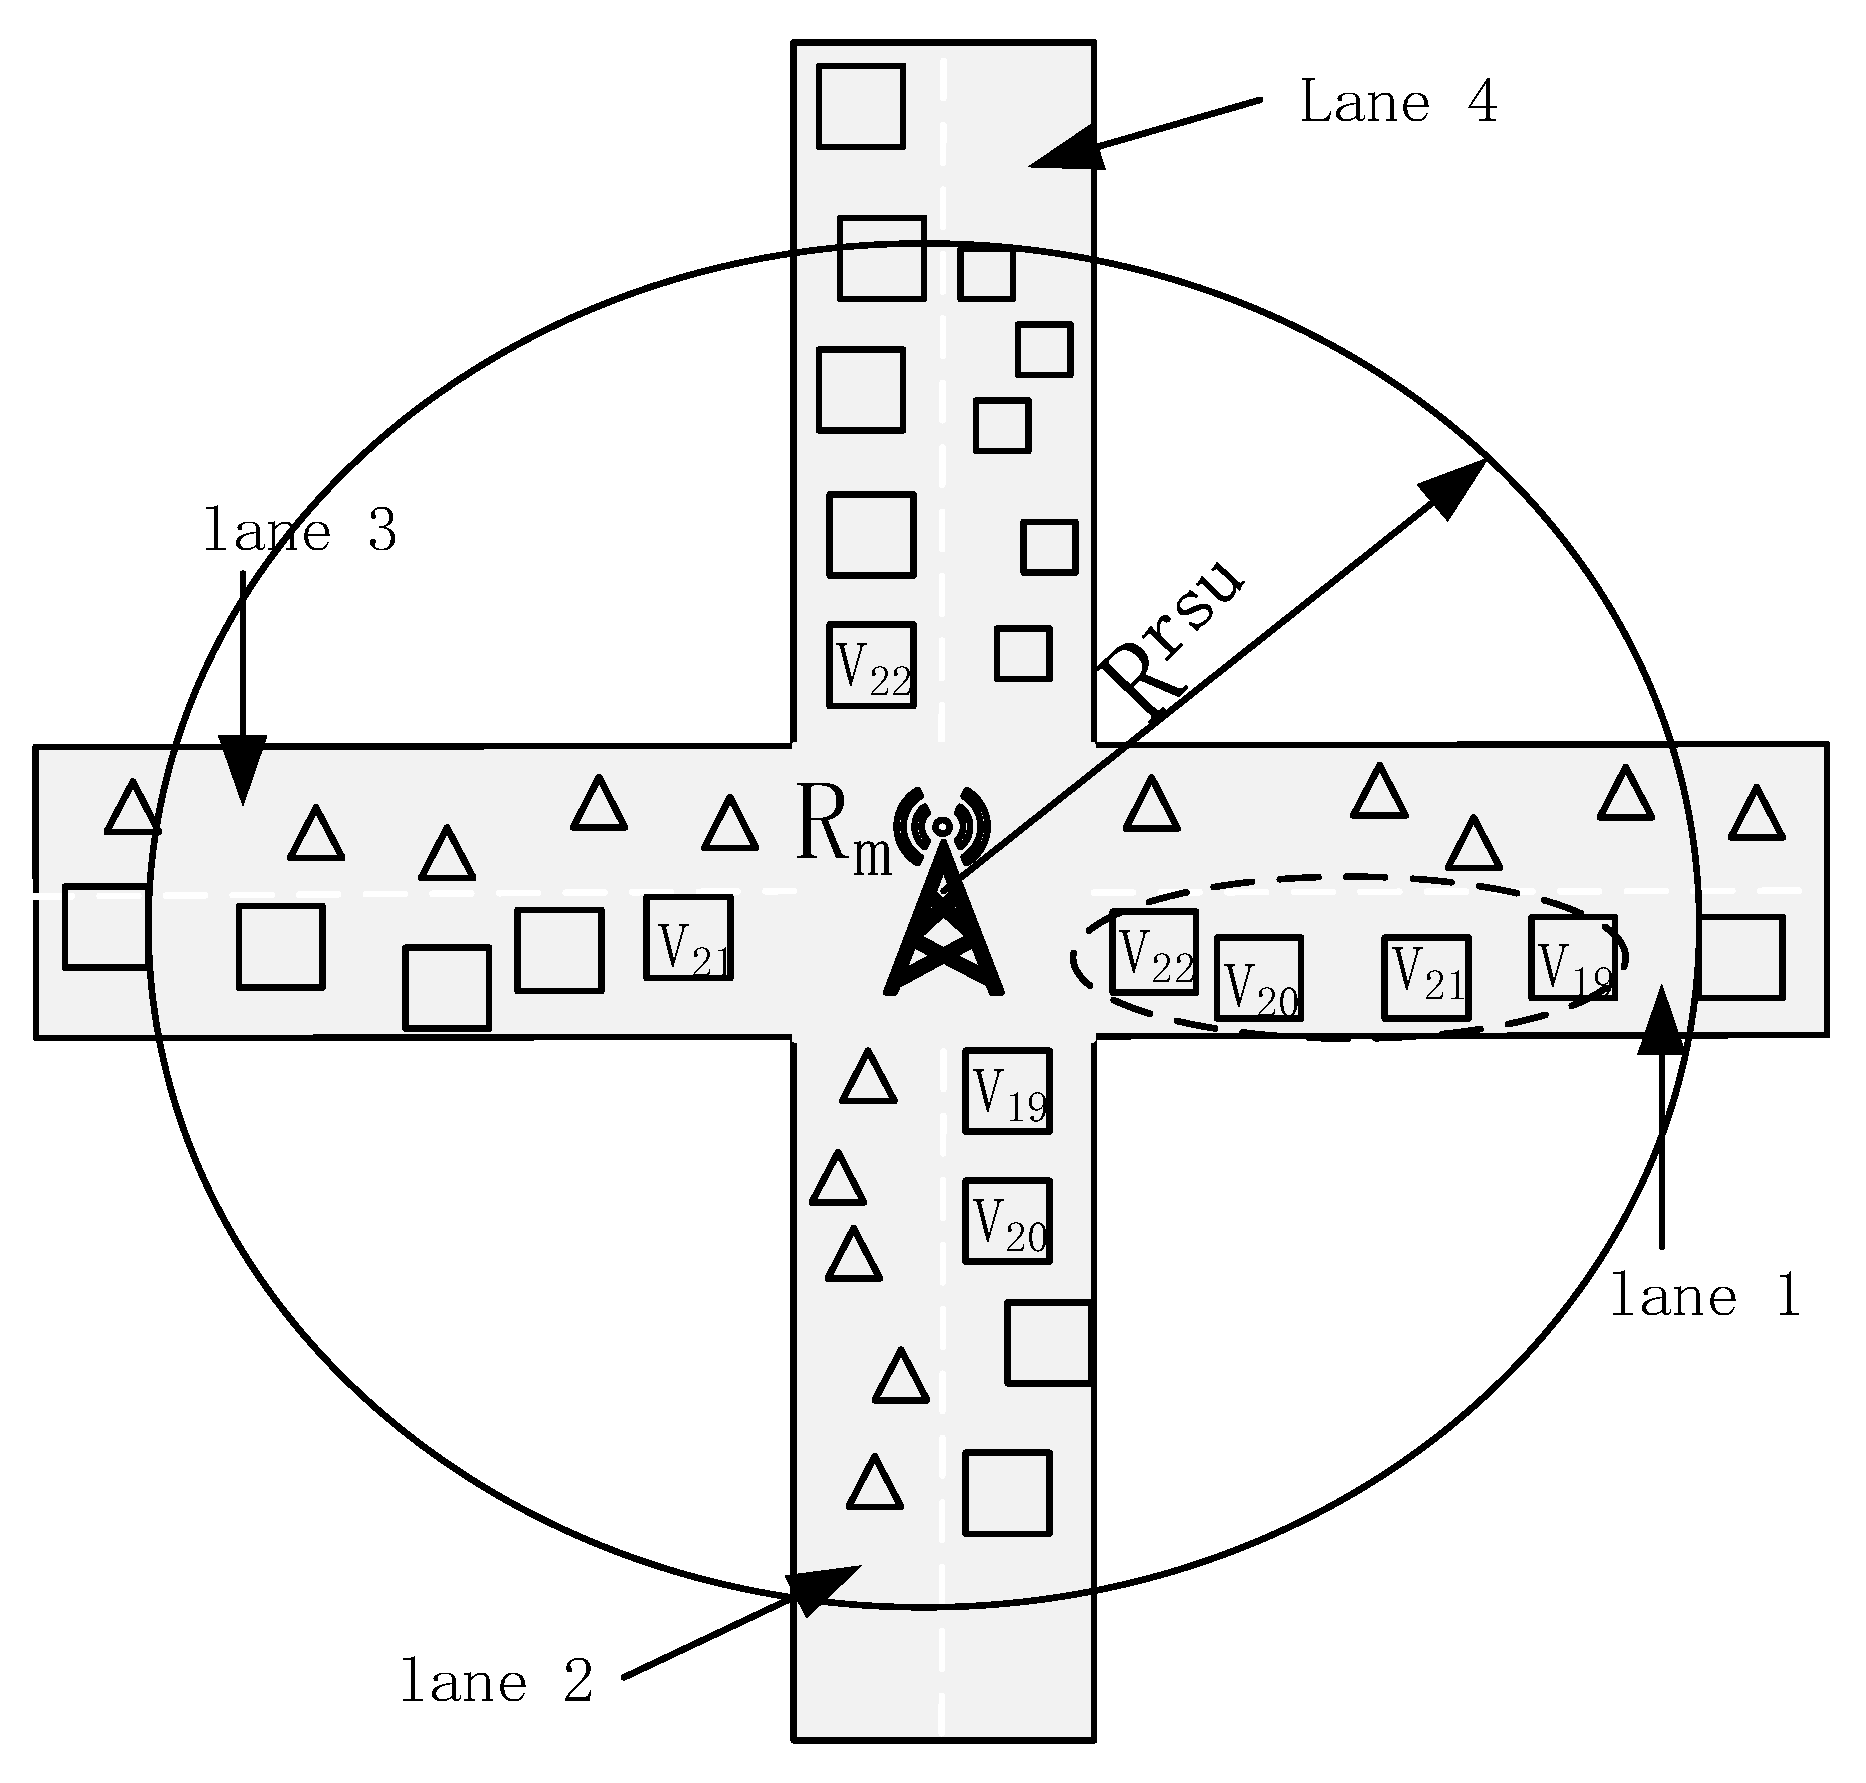
Based on prediction trajectory of vehicles in the coverage area of the RSUs, the RSUs divide vehicles into different clusters, and the CMs in a cluster must have the same next prediction lanes. For example, as shown in Figure 6, the next lanes of vehicles in the coverage area of R m may be lane 1, lane 2, lane 3, and lane 4, and the clusters can be denoted by C m , i ( i = 1 , 2 , 3 , 4 ) . C m . i n u m denotes the vehicle number in C m , i , and the next prediction lanes of V 19 , V 20 , V 21 , and V 22 are all lane 1. V 19 , V 20 , V 21 , and V 22 constitute C m , 1 , and C m , 1 n u m = 4 . The cluster dividing algorithm is shown as Algorithm 1.
Algorithm 1 Cluster Dividing Algorithm Based on Mobility Prediction
  • Initialization: all vehicles in coverage area of R m constitute the set S E T m , all vehicles with next prediction lane i constitute the cluster C m , i = ϕ
  • For any V x S E T m
  • input departure place x 1 , destination x 2 , current lane x 3 and current time x 4 of V x into
  • neural network, and obtain output [ s o f t m a x ( y 1 ) , s o f t m a x ( y 2 ) , s o f t m a x ( y 3 ) , s o f t m a x ( y 4 ) ]
  • and the next prediction lane of V x
  • if the next prediction lane of V x is lane i
  • make V x become a CM of C m , i
  • end if
  • End For

3.2.2. Caching optimization for number k of content chunks

In our strategy, case ➂ and case ➄ both cache content at relay vehicles. The probability that the relay vehicles can meet the request vehicle is 1 in case ➂, which can be regarded as the particular case of case ➄ with a prediction probability of 1. So, our paper only discusses the caching optimization of case ➄, whereby RSUs averagely divide content into k chunks and cache them at k vehicles. If the value of k increases, then the size of content chunks cached at a vehicle decreases, and the success probability of content chunks transmission increases. However, the probability of meeting between the request vehicle and all of those k vehicles decreases. On the contrary, if the value of k decreases, the probability of meeting between the request vehicle and all of those k vehicles increases, but the size of content chunks cached at a vehicle increases and the success probability of content chunks transmission decreases. So, our strategy optimizes the number k of content chunks to maximum the success probability of content transmission from k vehicles in a cluster to the request vehicle.
Assuming that R m needs to cache content chunks at multiple vehicles in cluster C m , i + I for vehicle V x on lane i , R m chooses vehicles with the top k prediction probability to cache k content chunks. Every content chunk has the same size of W k , and the prediction probability of those k vehicles constitutes the set { P i + I , 1 p r e , P i + I , 2 p r e , , P i + I , k p r e } . Assuming that the speed of two vehicles on the opposite lanes are s i x and s i + I y , and the average transmission rate is V a during the process of the two vehicles meeting, the condition of success content chunk transmission is 2 r v V a s i x + s i + I y W k and the feasible region is G 0 = { ( s i x , s i + I y ) | s i x + s i + I y 2 r v V a k W } . During the meeting between C m , i + I and the request vehicle, the probability that all of those k vehicles successfully transfer content chunks to the request vehicle is as follows:
P i + I t r a n s ( k ) = [ G 0 f ( s i x , s i + I y ) d σ ] k
The success probability of content transmission from cluster C m , i + I to request the vehicle is as follows:
P i + I s u c ( k ) = P i + I t r a n s ( k ) j = 1 k P i + I , j p r e
Our strategy maximizes the success probability of content transmission by optimizing the number of content chunks, and the optimization is formulated as follows:
max k      P i + I s u c ( k ) = P i + I t r a n s ( k ) j = 1 k P i + I , j p r e s . t .      1 k min      { N V , C i + I n u m }
where, in case ➂ N V = H x , H x denotes the number of vehicles that are a one-hop distance away from V x , and in case ➄, N V = C i + I n u m , C i + I n u m denotes the number of vehicles in C m , i + I .
By optimizing the number of content chunks, R m maximizes the success probability of content transmission from the cluster to the request vehicle. The process of R m proactively caches content chunks at multiple vehicles in a cluster, as shown in Algorithm 2.
Algorithm 2 Caching Algorithm for Optimizing the Number of Content Chunks
Initialization: All vehicles in coverage area of R m constitute the set S E T m , M a x = ϕ , P r e = ϕ , N V
  • predict behavior of all vehicles in set S E T m , make vehicles with prediction lane i + I become CMs of cluster C m , i + I , and put prediction probability into set P r e
  • for k = 1 to min { C m , i + I n u m , N V } do
  • use k to calculate P i + I t r a n s ( k ) in (8)
  • choose elements with top k values from P r e to constitute { P i + I , 1 p r e P i + I , 2 p r e , , P i + I , k p r e }
  • use { P i + I , 1 p r e P i + I , 2 p r e , , P i + I , k p r e } and P i + I t r a n s ( k ) to calculate   P i + I s u c ( k ) in (9), and put   P i + I s u c ( k ) into set M a x
  • end For
  • make k corresponding to maximum value in M a x become the number of content chunks

3.3. Analysis of Success Probability of Contnet Acquisition

In our strategy, vehicles cache content in their caching space based on content’s popularity, the caching space can accommodate content with maximum number of N , and the probability that a vehicle caches the content ranked τ t h is f τ ( N ) . Assume that a vehicle V x on lane i requests the content with a rank of τ in popularity, and V x is within or is going to enter the coverage area of R m . As described in Section 3.1, there are five cases for the request vehicle to obtain desired content: Obtaining content from vehicles that are a one-hop distance away from the request vehicle in the same lane, obtaining content from vehicles that are a two-hop distance away from request vehicle in the same lane, obtaining content from vehicles that are a one-hop or two-hop distance away from the request vehicle on the front opposite lane, obtaining content directly from an RSU, and obtaining content from the cluster with content cached by the RSU. The analysis of those five cases is shown as follows.
Obtaining content from vehicles that are a one-hop distance away from the request vehicle
Assuming that request vehicle V x drives after content source vehicle V y , the speed of eac vehicle is, respestively, s i x and s i y . The average transmission rate between vehicles is V a , and the distance between the request vehicle and content source vehicle is r v 2 . When s i x > s i y , the condition of content success transmission is r v + r v 2 s i x s i y V a W , and the feasible region is G 1 = { ( s i x , s i y ) | s i x s i y 3 r v V a 2 W } . When s i x < s i y , the condition of content success transmission is r v r v 2 s i y s i x V a W , and the feasible region is G 2 = { ( s i x , s i y ) | s i y s i x r v V a 2 W } . s i x and s i y are independent of each other and obey the same Truncated Normal Distribution [23], so p { s i x > s i y } = p { s i x < s i y } = 1 2 . According to Formula (3), the probability that a vehicle on lane i can obtain content from another vehicle that is a one-hop distance away from itself is derived as follows:
P i o n e = p { s i x > s i y } G 1 f ( s i x , s i y )   d σ + p { s i x < s i y } G 2 f ( s i x , s i y )   d σ = 1 2 G 1 + G 2 f ( s i x , s i y )   d σ
Let K 1 denotes the number of vehicles that are a one-hop distance away from the request vehicle in the same lane. The probability that a request vehicle on lane i can obtain desired content from a vehicle that is a one-hop distance away from itself is derived as follows:
P i , τ s e l f = k = 1 + P i { K 1 = k } { f τ ( N ) 1 + ( 1 f τ ( N ) ) [ 1 ( 1 f τ ( N ) ) k 1 ] P i o n e } = k = 1 + P i { K 1 = k } { f τ ( N ) + [ 1 f τ ( N ) ( 1 f τ ( N ) ) k ] P i o n e } = [ P i o n e + f τ ( N ) P i o n e f τ ( N ) ] k = 1 + P i { K 1 = k } P i o n e k = 1 + P i { K 1 = k } ( 1 f τ ( N ) ) k = [ P i o n e + f τ ( N ) P i o n e f τ ( N ) ] ( 1 e 2 λ i D r v ) P i o n e ( e 2 λ i D r v f τ ( N ) e 2 λ i D r v )
Obtaining content from vehicles that are a two-hop distance away from the request vehicle
Assumed that the distance from relay vehicle to request vehicle and content source vehicle is equal, it’s 3 r v 4 , and the probability of content success transmission from relay vehicle to request vehicle and content source vehicle is also equal. When s i x > s i y , the condition of content success transmission is r v + 3 r v 4 s i x s i y V a W and the feasible region is G 3 = { ( s i x , s i y ) | s i x s i y 7 r v V a 4 W } , When s i x < s i y , the condition of content success transmission is r v 3 r v 4 s i y s i x V a W and the feasible region is G 4 = { ( s i x , s i y ) | s i y s i x r v V a 4 W } . According to Formula (3), the probability that a vehicle on lane i can obtain content from another relay vehicle is derived as follows:
P i t w o = p { s i x > s i y } G 3 f ( s i x , s i y )   d σ + p { s i x < s i y } G 4 f ( s i x , s i y )   d σ = 1 2 G 3 + G 4 f ( s i x , s i y )   d σ
The probability that the desired content fails to be cached by vehicles that are a one-hop distance away from the request vehicle is as follows:
P i , τ n s = k = 1 + P i { K 1 = k }   ( 1 f τ ( N ) ) k = e 2 λ i D r v f τ ( N ) e 2 λ i D r v
Let K 2 denote the number of vehicles that are a two-hop distance away from the request vehicle. The probability that the desired content manages to be cached by vehicles that are a two-hop distance away from the request vehicle is as follows:
P i , τ e n = k = 1 + P i { K 2 = k } [ 1 ( 1 f τ ( N ) ) k ] = 1 e 2 λ i D r v f τ ( N )
The desired content will be transferred to the request vehicle by a vehicle that is a two-hop distance away. According to Formulas (13–15), the probability that a request vehicle on lane i can obtain desired content from the vehicle that is a two-hop distance away from itself is derived as the following:
P i , τ n e i = P i , τ n s P i , τ e n ( P i t w o ) 2
Obtaining content from vehicles that are a one-hop or two-hop distance away from the request vehicle on the front opposite lane
Let K 3 denote the number of vehicles that are a one-hop or two-hop distance away from the request vehicle in the same lane. The probability that the desired content fails to be cached by those K 3 vehicles is as follows:
P i , τ s a = k = 1 + P i { K 3 = k } ( 1 f τ ( N ) ) k =   e 4 λ i D r v f τ ( N ) e 4 λ i D r v
Let K 4 denote the number of vehicles with one-hop or two-hop distance away from request vehicle on front opposite lane, the probability that desired content manages to be cached at those K 4 vehicles is as following
P i , τ e o p = k = 1 + P i + I { K 4 = k } [ 1 ( 1 f τ ( N ) ) k ] =   1   e 2 λ i D r v f τ ( N )
Assuming that the request vehicle needs to obtain the desired content from content source vehicle V c on opposite lane i + I , V c chooses K s vehicles that are a one-hop distance away from V c to average cache content chunks. As depicted in Section 3.2, those K s vehicles selected to cache content chunks will meet the request vehicle with a probability of 1. Assuming that the speed of any two vehicles, respectively, in the same and opposite lane are s i x and s i + I y , the condition of content chunk success transmission between the two vehicles is 2 r v V a s i x + s i + I y W K s and the feasible region is G 5 = { ( s i x , s i + I y ) | s i x + s i + I y 2 r v V a K s W } . According to Formulas (3), (17), and (18), probability that a request vehicle on lane i can obtain desired content from a vehicle that is a one-hop or two-hop distance away from itself on front opposite lane is derived as the following:
P i , τ o p p = P i , τ s a P i , τ e o p [ G 5 f ( s i x , s i + I y ) d σ ] K s
where K s denotes the number of vehicles selected to cache content chunks, and V a denotes the average transmission rate between vehicles.
Based on what is discussed above, the probability that a vehicle on lane i can obtain desired content without the participation of an RSU is as follows:
P i , τ n o t _ r s u = P i , τ s e l f + P i , τ n e i + P i , τ o p p
Obtaining content directly from an RSU
The authors of [22] indicated that the number of vehicles on the lane obeys the Poisson Point Process. Thus, the average driving distance of a vehicle in the coverage area of RSU was assumed to be R r s u . Assuming that the RSU serve and the request vehicles within the coverage area of itself have an equal probability, the probability that RSU transfers desired content to a request vehicle is as follows:
P r = R m a x λ m r s u W
Assuming that the average rate that an RSU transfers content to a vehicle is V p e r , the condition of request vehicle successfully obtains the desire content from an RSU is s i R r s u V p e r W . According to Formulas (4) and (21), the probability that the request vehicle directly obtains the desired content from an RSU is derived as the following:
P i , τ d i r = P r F ( R r s u V p e r W ) = R m a x λ m r s u W F ( R r s u V p e r W )
Obtaining content from cluster with content cached by an RSU
Assuming that R m proactively caches content at cluster C m , i + I and chooses k vehicles from C m , i + I to respectively cache content chunks based on the caching optimization algorithm depicted in Section 3.2, the condition that RSU successfully transfers content chunks to a vehicle is s i R r s u V p e r k 2 W , and the prediction probability of those k vehicles constitute is set as { P i + I , 1 p r e , P i + I , 2 p r e , , P i + I , k p r e } . According to Formulas (3), (4), and (21), the probability that the request vehicle can successfully obtain the desired content from C m , i + I is derived as the following:
P i , τ i n d i r = [ P r F ( R r s u V p e r k 2 W ) ] k [ G 6 f ( s i x , s i + I y ) d σ ] k j = 1 k P i + I , j p r e
where G 6 = { ( s i x , s i + I y ) | s i x + s i + I y 2 r v V a k W } denotes the feasible region of s i x , and s i + I y , s i x , and s i + I y denote the speed of request vehicle and the vehicle from C m , i + I .
Because the number of vehicles on the lane obeys the Poisson Point Process [22], the probability that a vehicle is in the coverage area of an RSU is
P i n = 2 R r s u E
According to Formulas (22)–(24), the probability that a vehicle can obtain desired content with the participation of the RSU is derived as the following:
P i , τ r s u = P i n P i , τ d i r + ( 1 P i n ) P i , τ i n d i r
The average probability that a vehicle on lane i can successfully obtain desired content ranked τ - t h is derived as the following:
P i a v e = τ = 1 L f τ [ P i , τ n o t _ r s u + ( 1 P i , τ n o t _ r s u ) P i , τ r s u ]

4. Discussion

4.1. Parameter Settings

In order to evaluate the performance of proposed strategy, we used SUMO to simulate an urban road environment, and vehicles moved along the urban road like real scenes. The arrival rate of vehicle was 600 vehicles/h, and the maximum speed of vehicle was 80 km/h. An interface, named TraCI(Traffic Control Interface), was used to connect SUMO to Python. The 3-hour moving information of vehicles was collected by Python through the interface. Python used the moving information to perform the algorithm simulation and to compare the simulation results with those described by the authors of [19]. In our simulation, the channel model is expressed as β P t r α with a path loss exponent α of 4, channel fading gain β of 10 2 , channel bandwidth B of 1.5 MHz, and power of Gaussian noise P n of −110 dBm. The transmission rate of the network can be derived by the Shannon formula. The average rate between vehicles was set as 9 Mbps, and the average between vehicle and RSU was set as 20 Mbps. Other simulation parameters are shown in Table 2. The Average Delay was used to describe the average time duration between the vehicle send requests and when the vehicle obtains the desired content. The Request Success Ratio was used to describe the average ratio that can be derived by dividing the total number of requests by the number of successful requests.

4.2. Results and Analysys

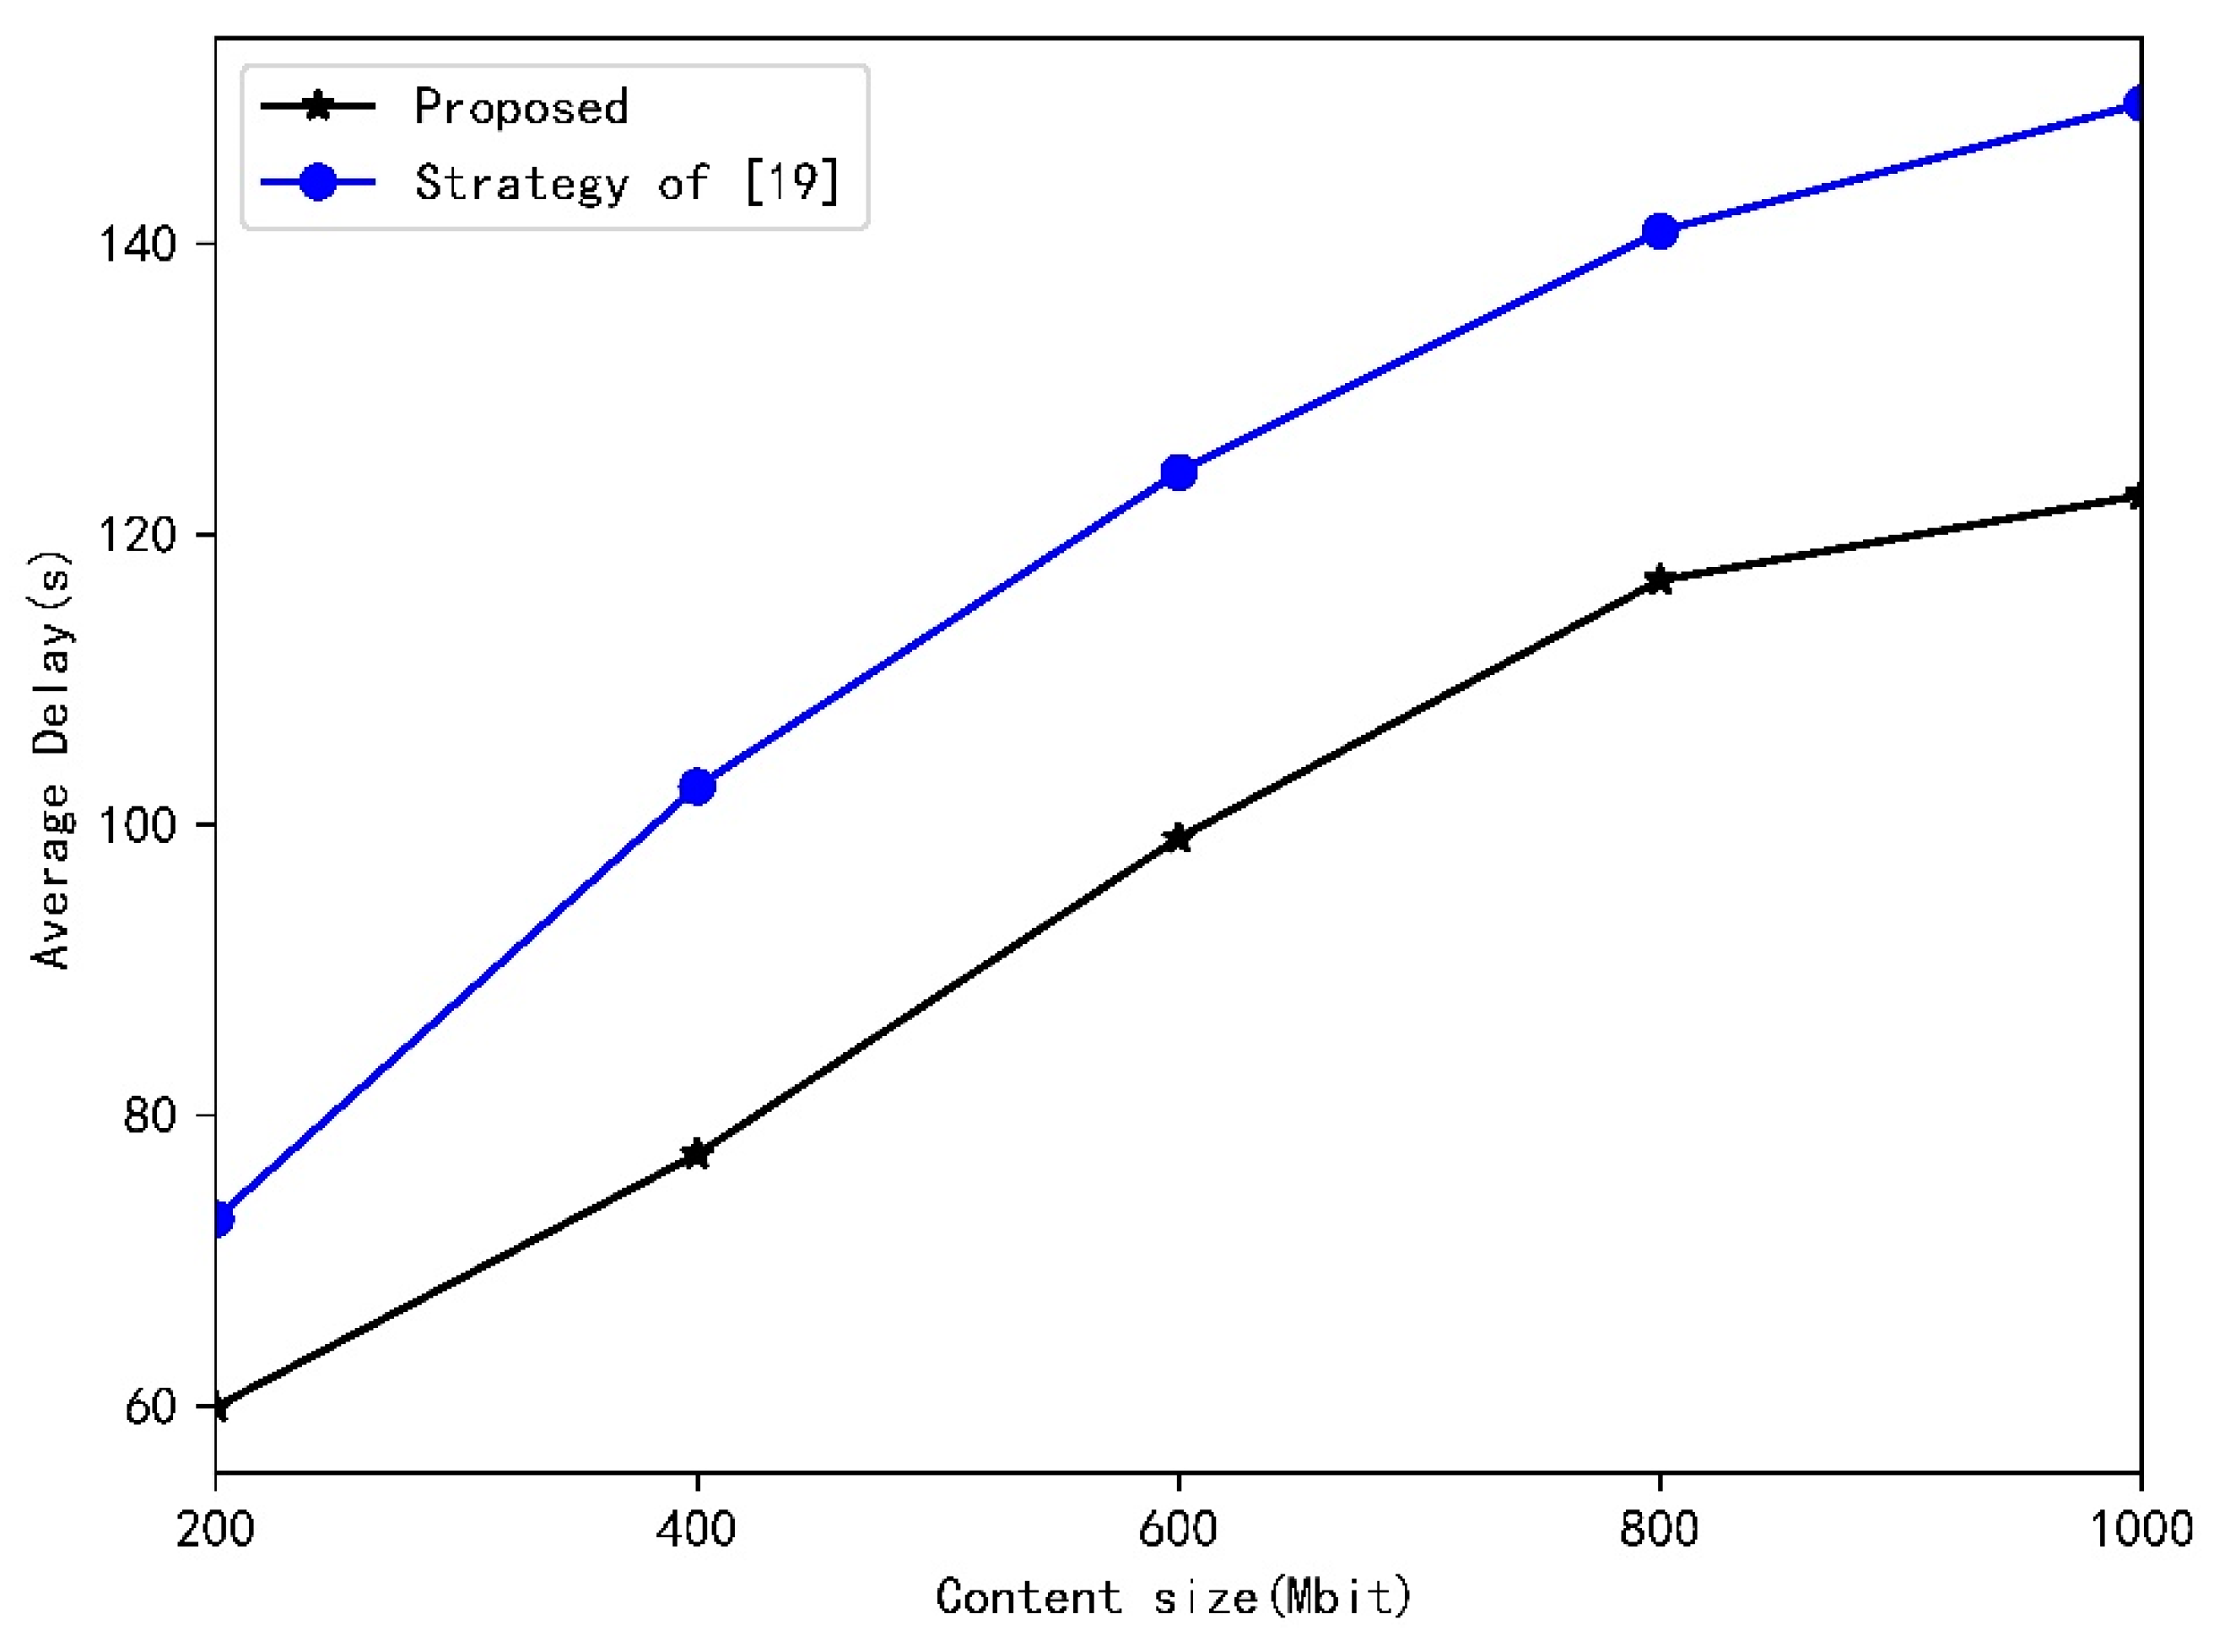
Figure 7 and Figure 8 show the variations of the Average Delay and the Request Success Ratio in the case of different content sizes. As illustrated in the graphs, the request delay of vehicles increased and the probability of content success transmission decreased as the content size increased. This is because larger content requires more time to be transferred by V2V or I2V, and the transmission process fails more easily. Compared with the strategy described by the authors of [19], our strategy has a lower request delay and higher probability of content success transmission, and the gap between the two strategies increases as content size increases. Because our strategy caches content chunks at multiple vehicles in a cluster, request vehicles can obtain content chunks from vehicles in the cluster one by one, which increases the transmission duration between vehicles. Our strategy also adopts the multiuser multichannel transmission mode in the communication process between clusters to solve the problem of the communication duration being too short to complete the content transmission. Figure 8 also demonstrates that the theory value and the simulation value of the Request Success Ratio were similar to each other. The former was slightly higher than the latter, and the gap increased as content size increased. This is because we assumed that the process of the request vehicle obtaining content chunks from different relay vehicles in the cluster was independent in case ➄ of our theory analysis. However, as the content size increases, the process between the request vehicle and relay vehicle may wait to begin until the last process is over, which make the theory value higher than the simulation value.
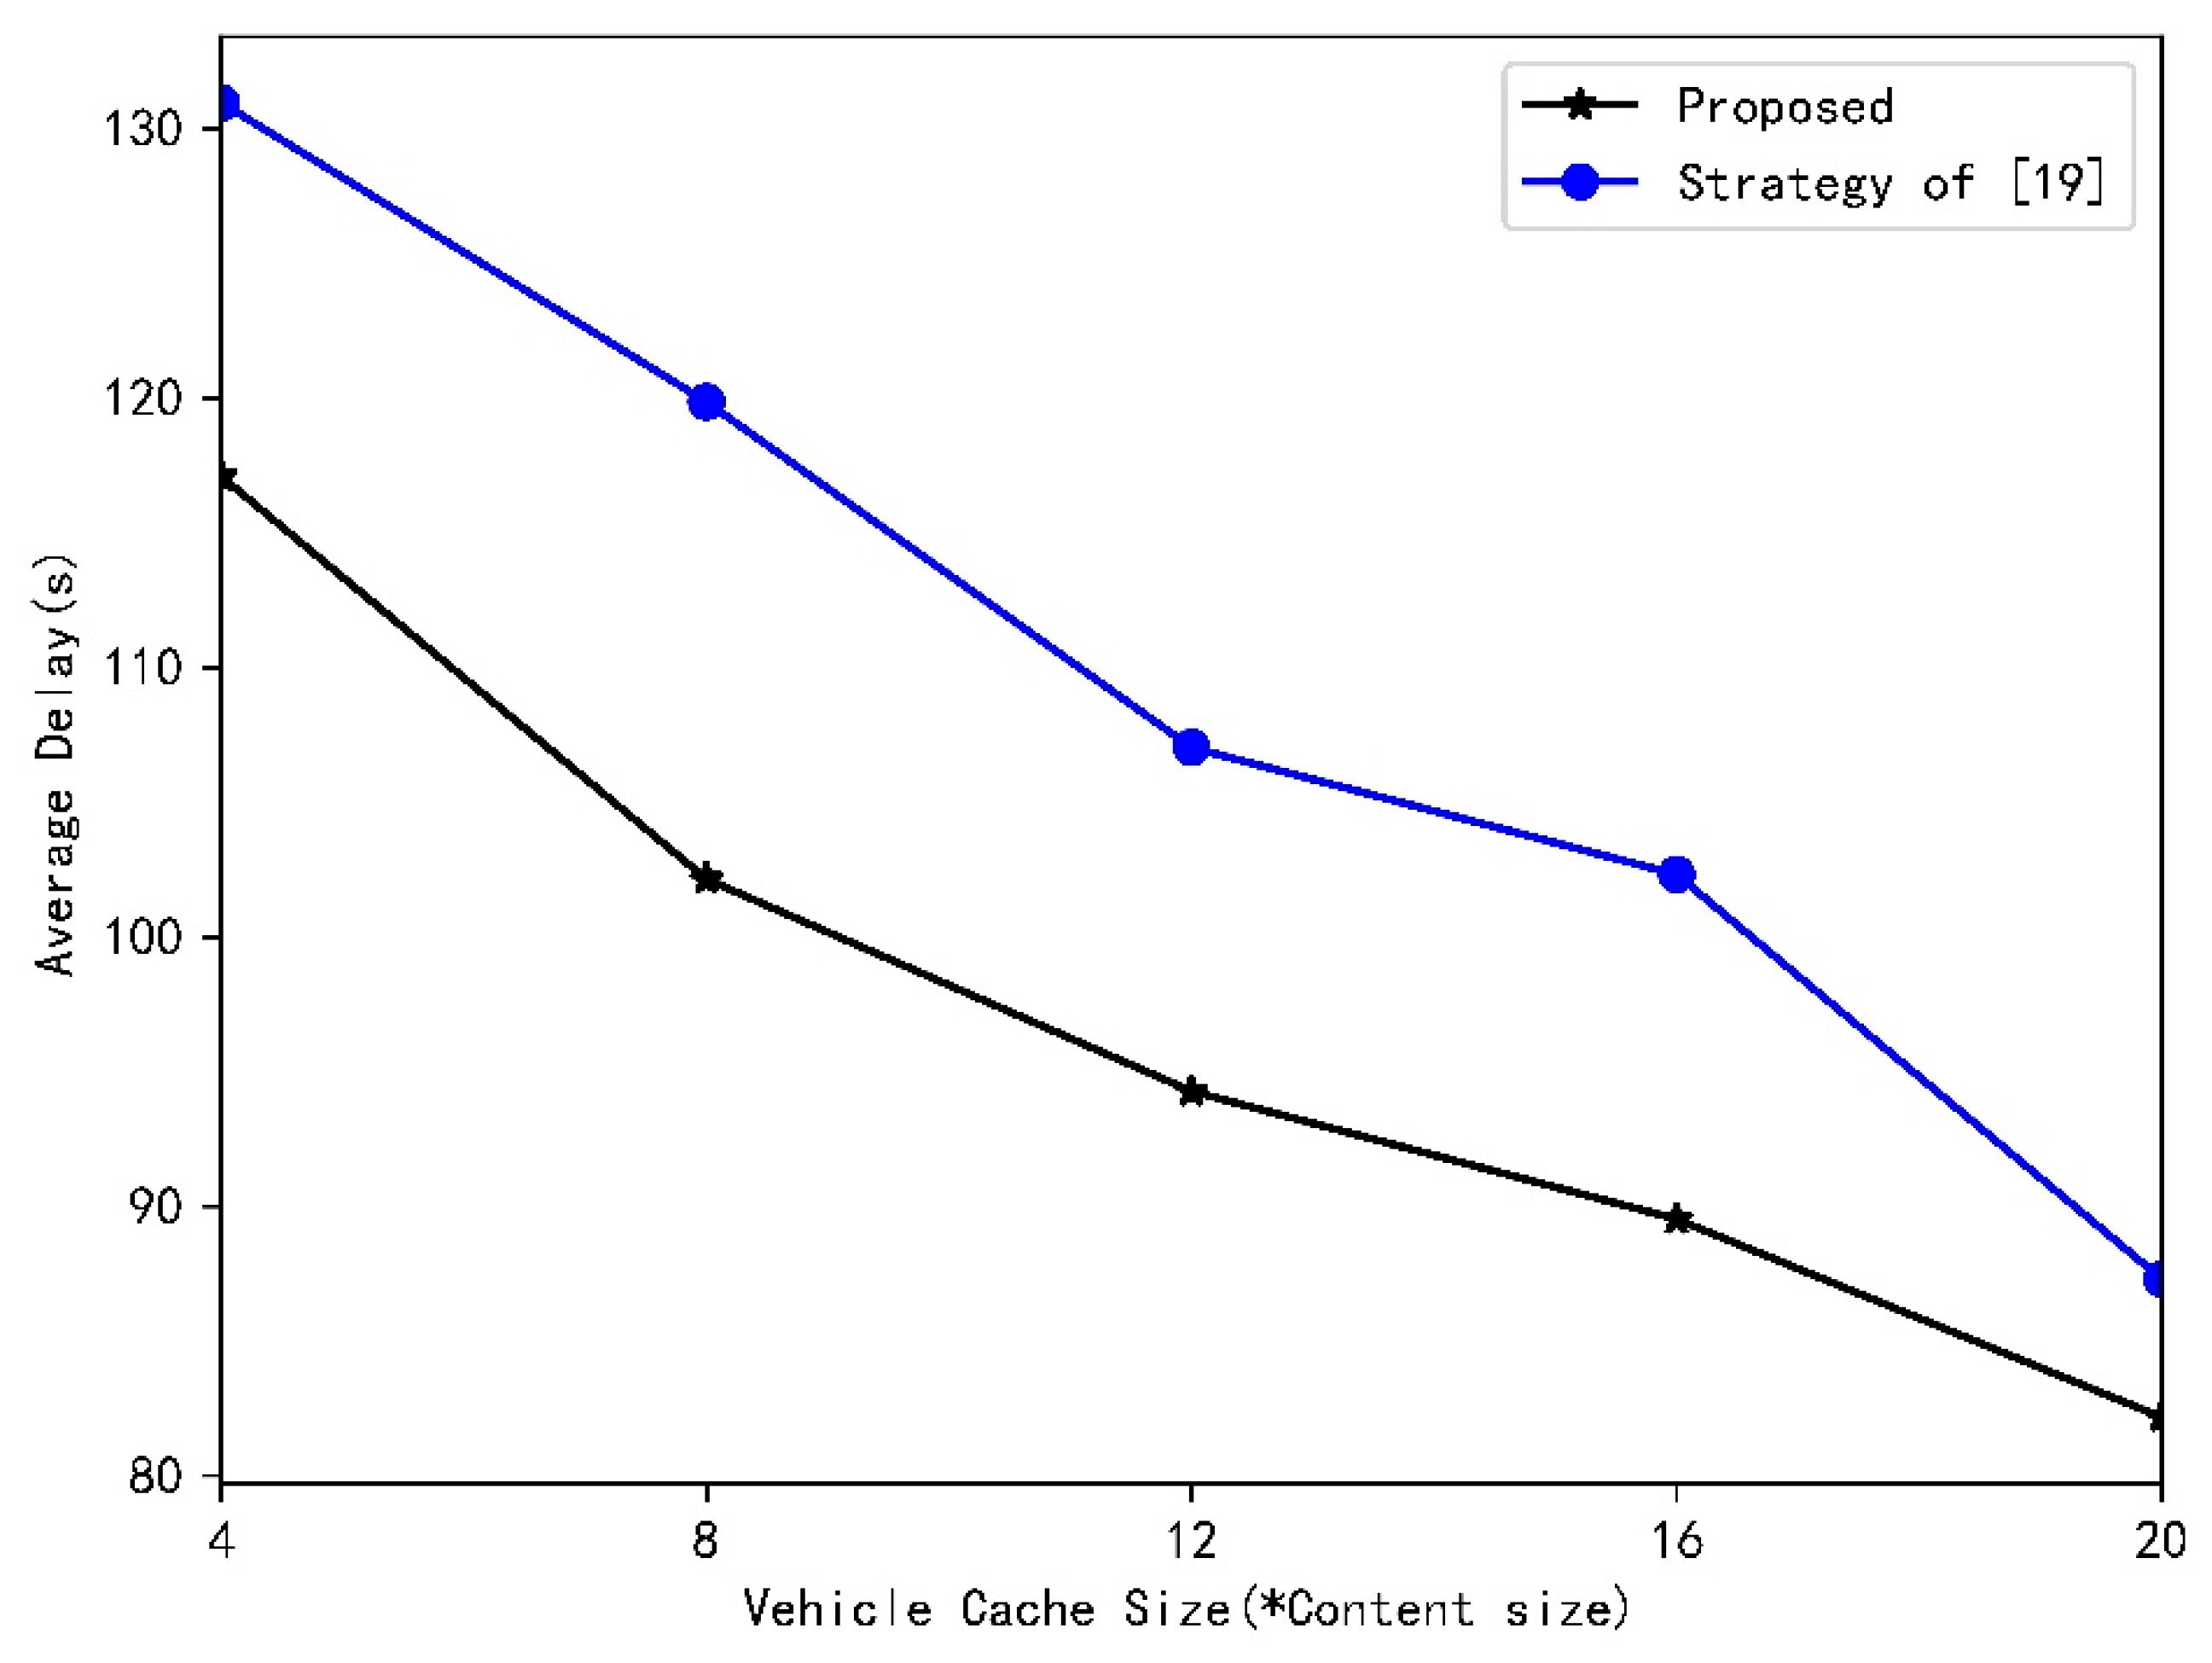
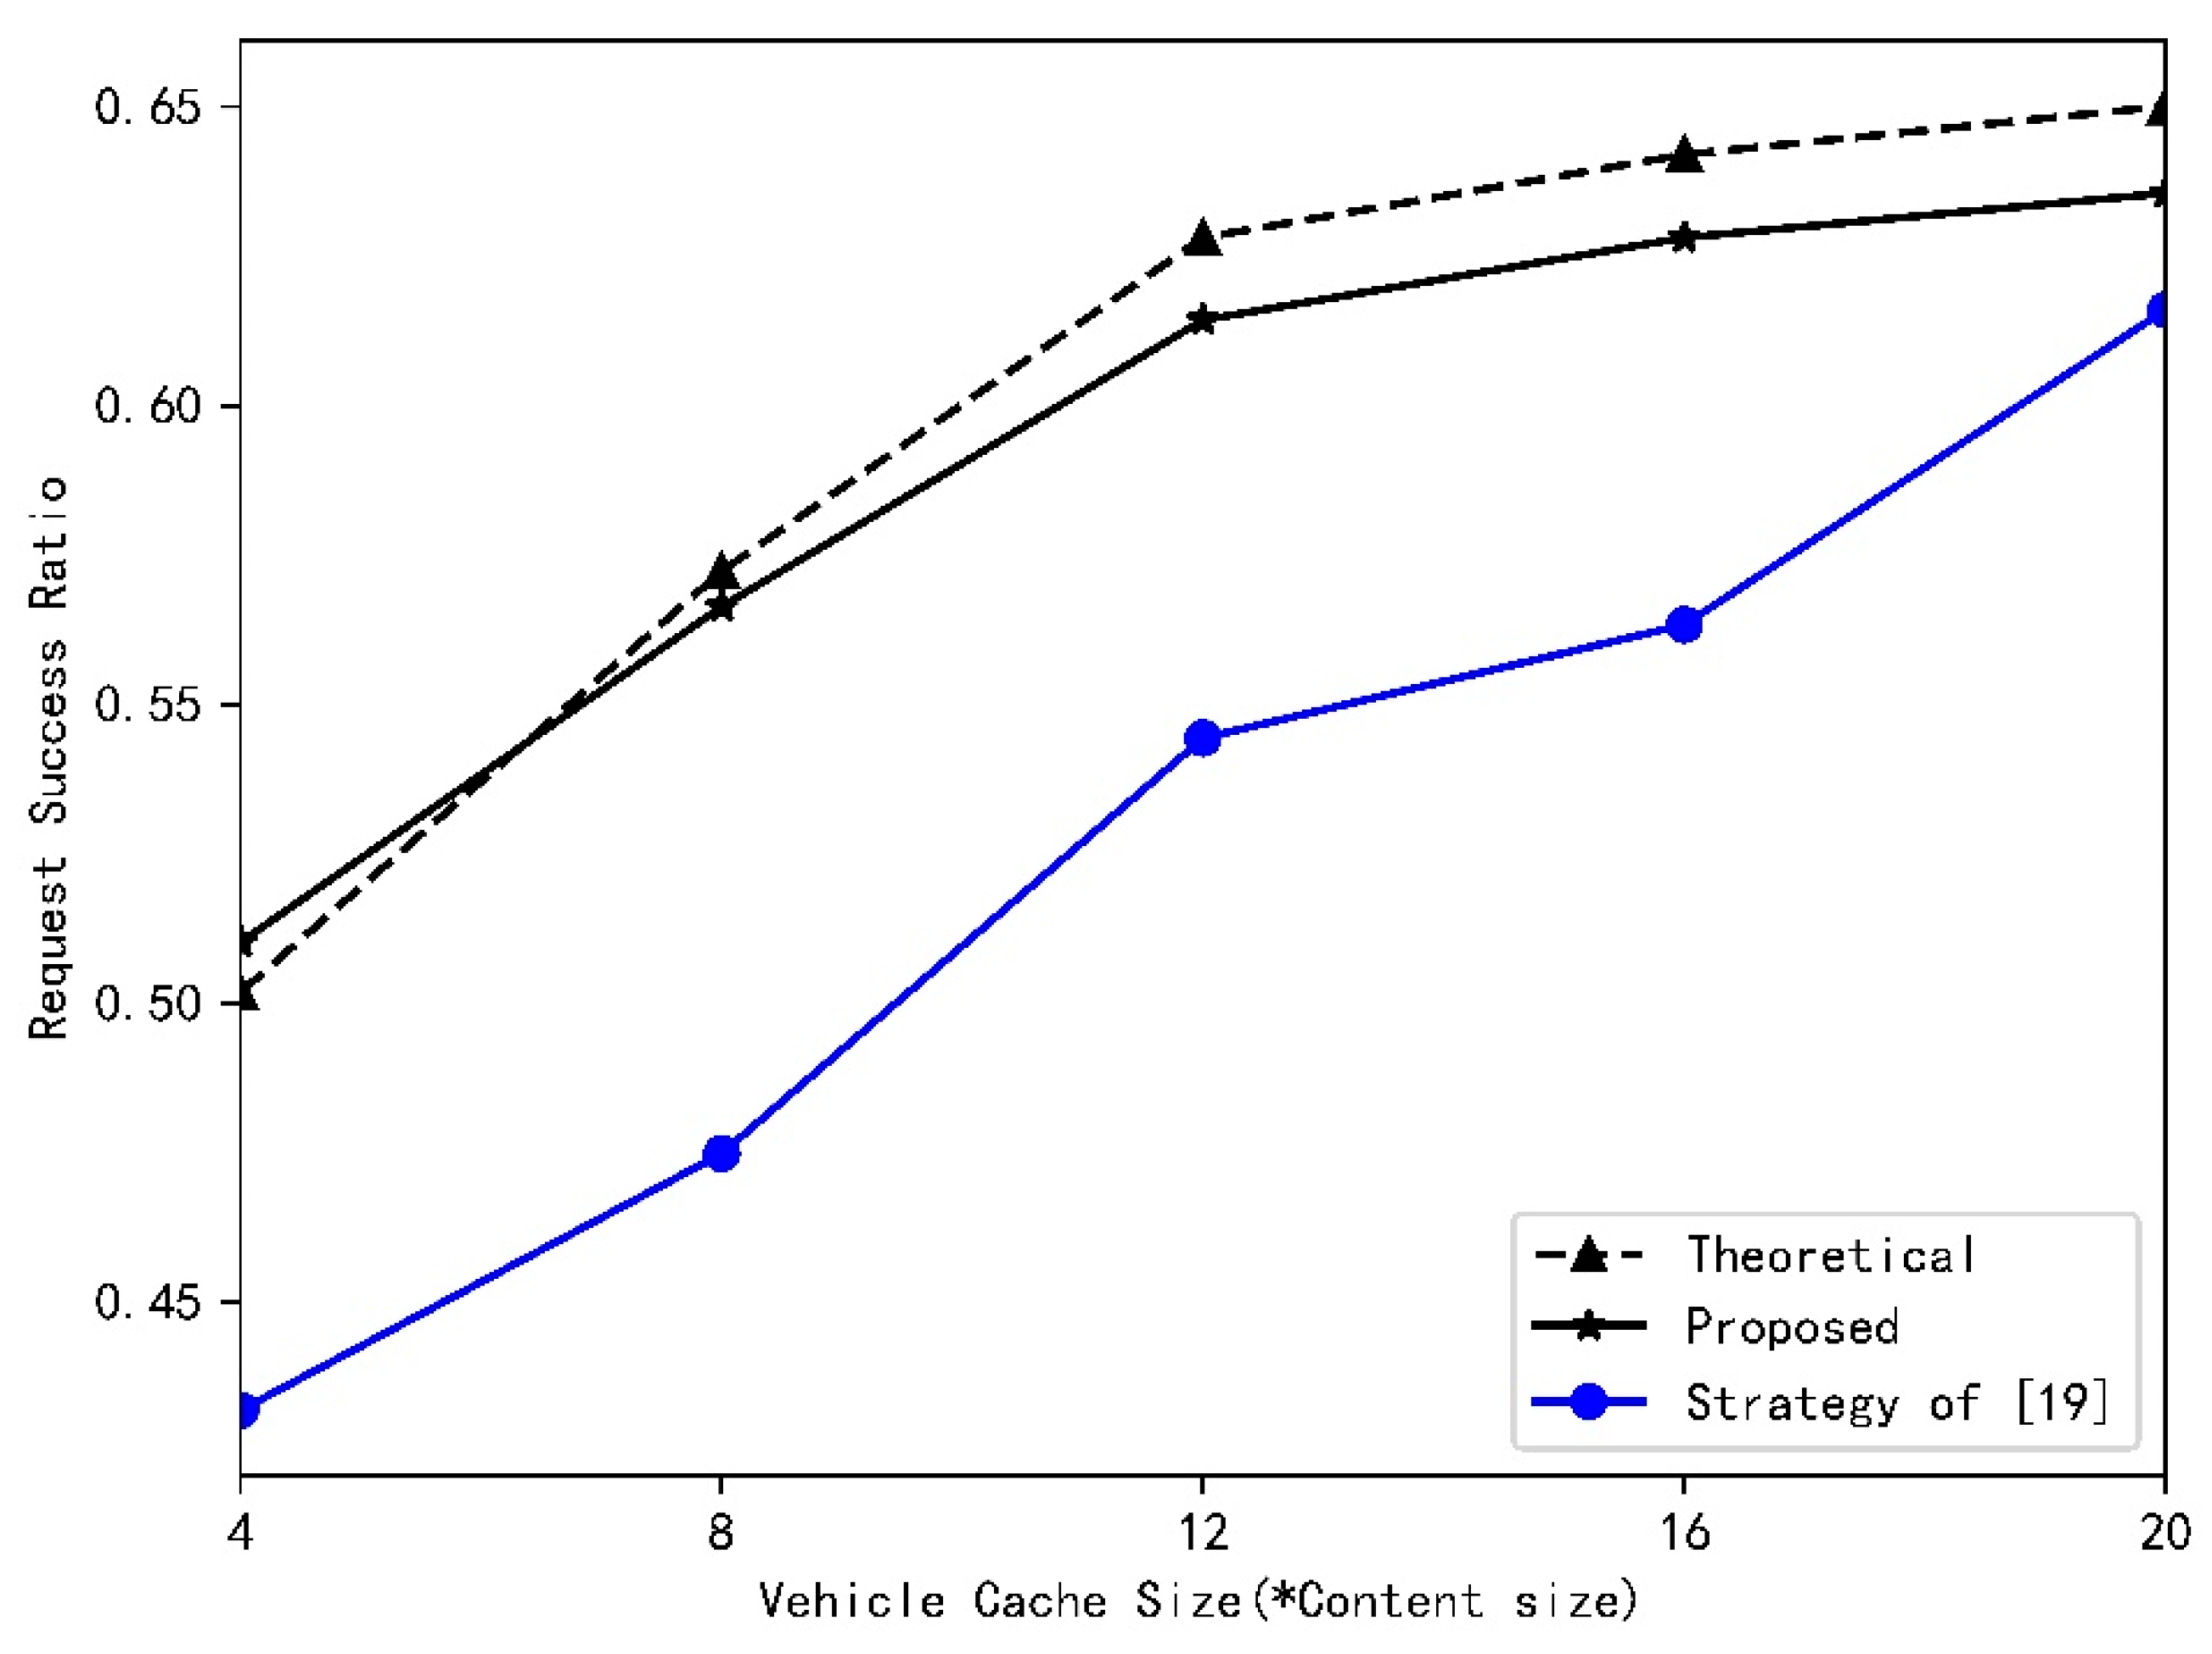
Figure 9 and Figure 10 show the variations of the Average Delay and the Request Success Ratio in the case of different vehicle caching sizes. Vehicle caching size is used to describe the maximum capability of the vehicle’s caching space. As depicted in the figures, the request delay of vehicles decreased and the probability of content success transmission increased as the caching size increased. This is because increasing the caching size enlarges the probability that a vehicle can find desired content in neighboring vehicles. Compared with the strategy described by the authors of [19], our strategy has a lower request delay and higher probability of content success transmission. Because our strategy caches content chunks at multiple vehicles in a cluster, request vehicles can obtain content chunks from vehicles in the cluster one by one, which increases the transmission duration between vehicles. Our strategy also adopts the multiuser multichannel transmission mode in the communication process between clusters to solve the problem of the communication duration being too short to complete the content transmission. The probability that a vehicle can obtain content with participation of RSU decreases as vehicle caching size increases, which weakens the advantages of our strategy, so the gap in performance between those two strategies decreases as caching size increases. Figure 10 also indicates that the theory value and the simulation value of the Request Success Ratio were similar to each other. The former was slightly higher than the latter, and the gap increased as the vehicle caching size increased. This is because the probability that a vehicle will obtain content from neighboring vehicles increases as vehicle caching size increases. We assumed that the relay vehicle situated in the middle position between the request vehicle and content source vehicle in case ➁ of our theory analysis, which makes the theory value higher than the simulation value.
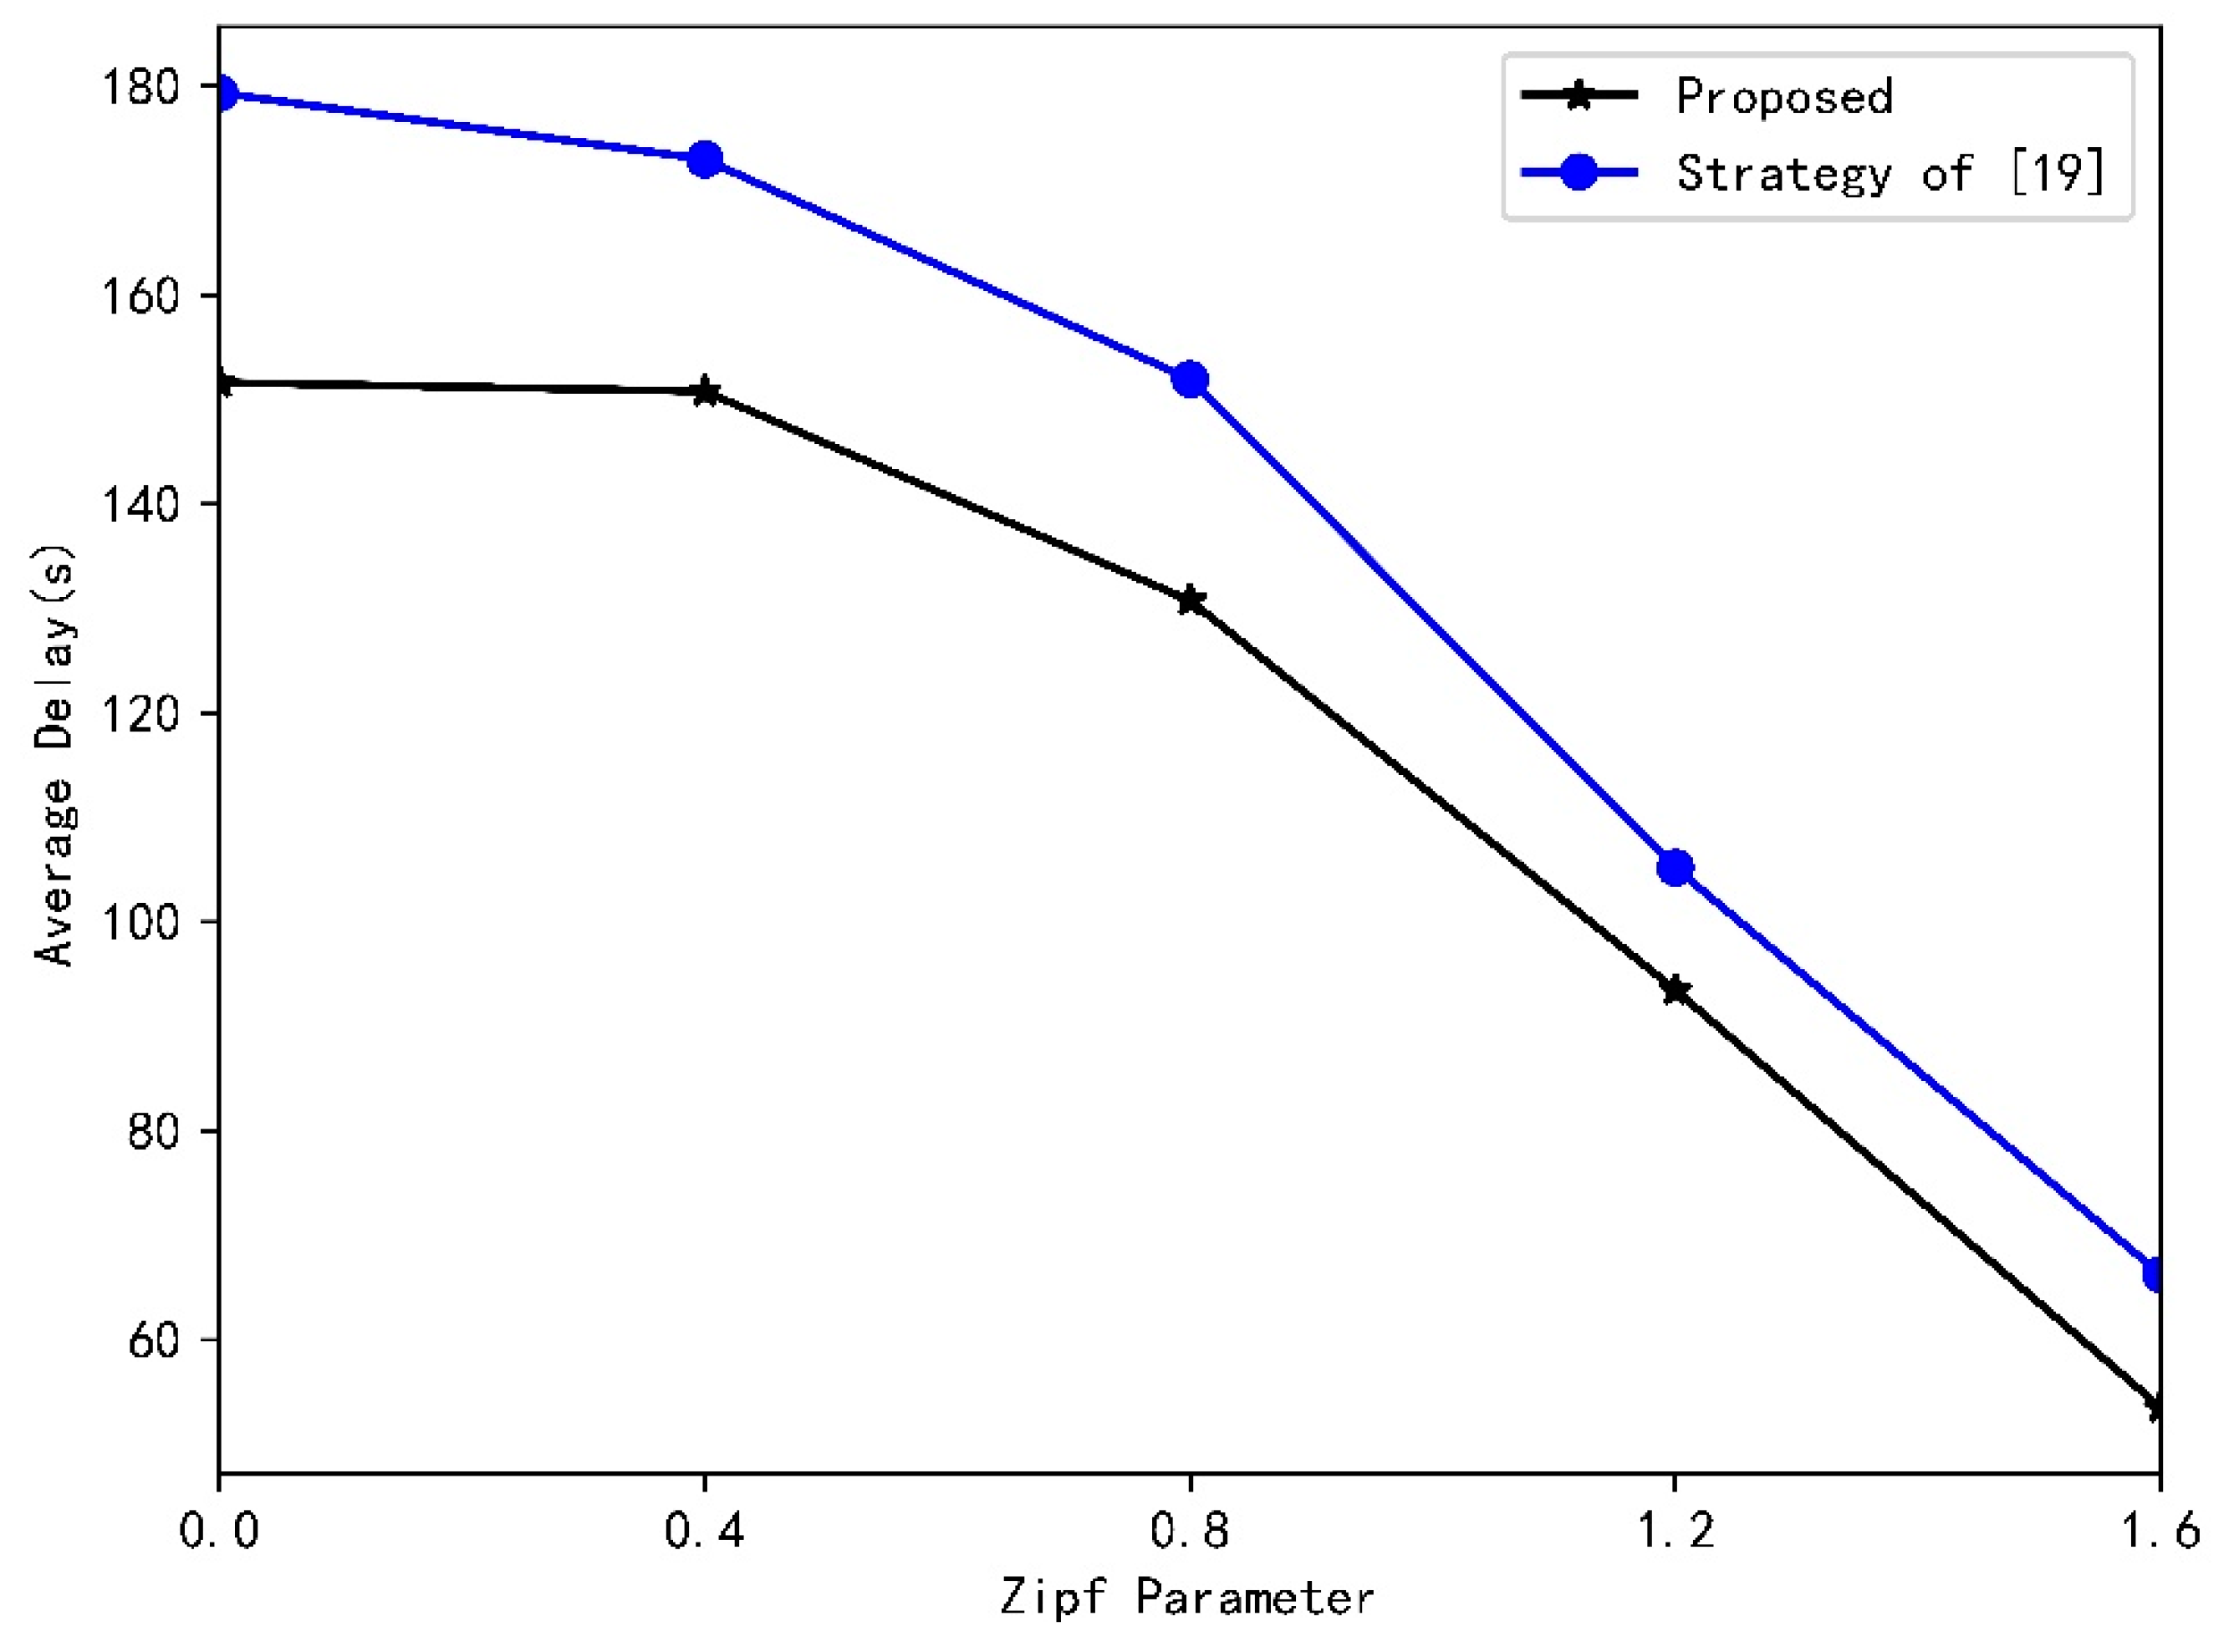
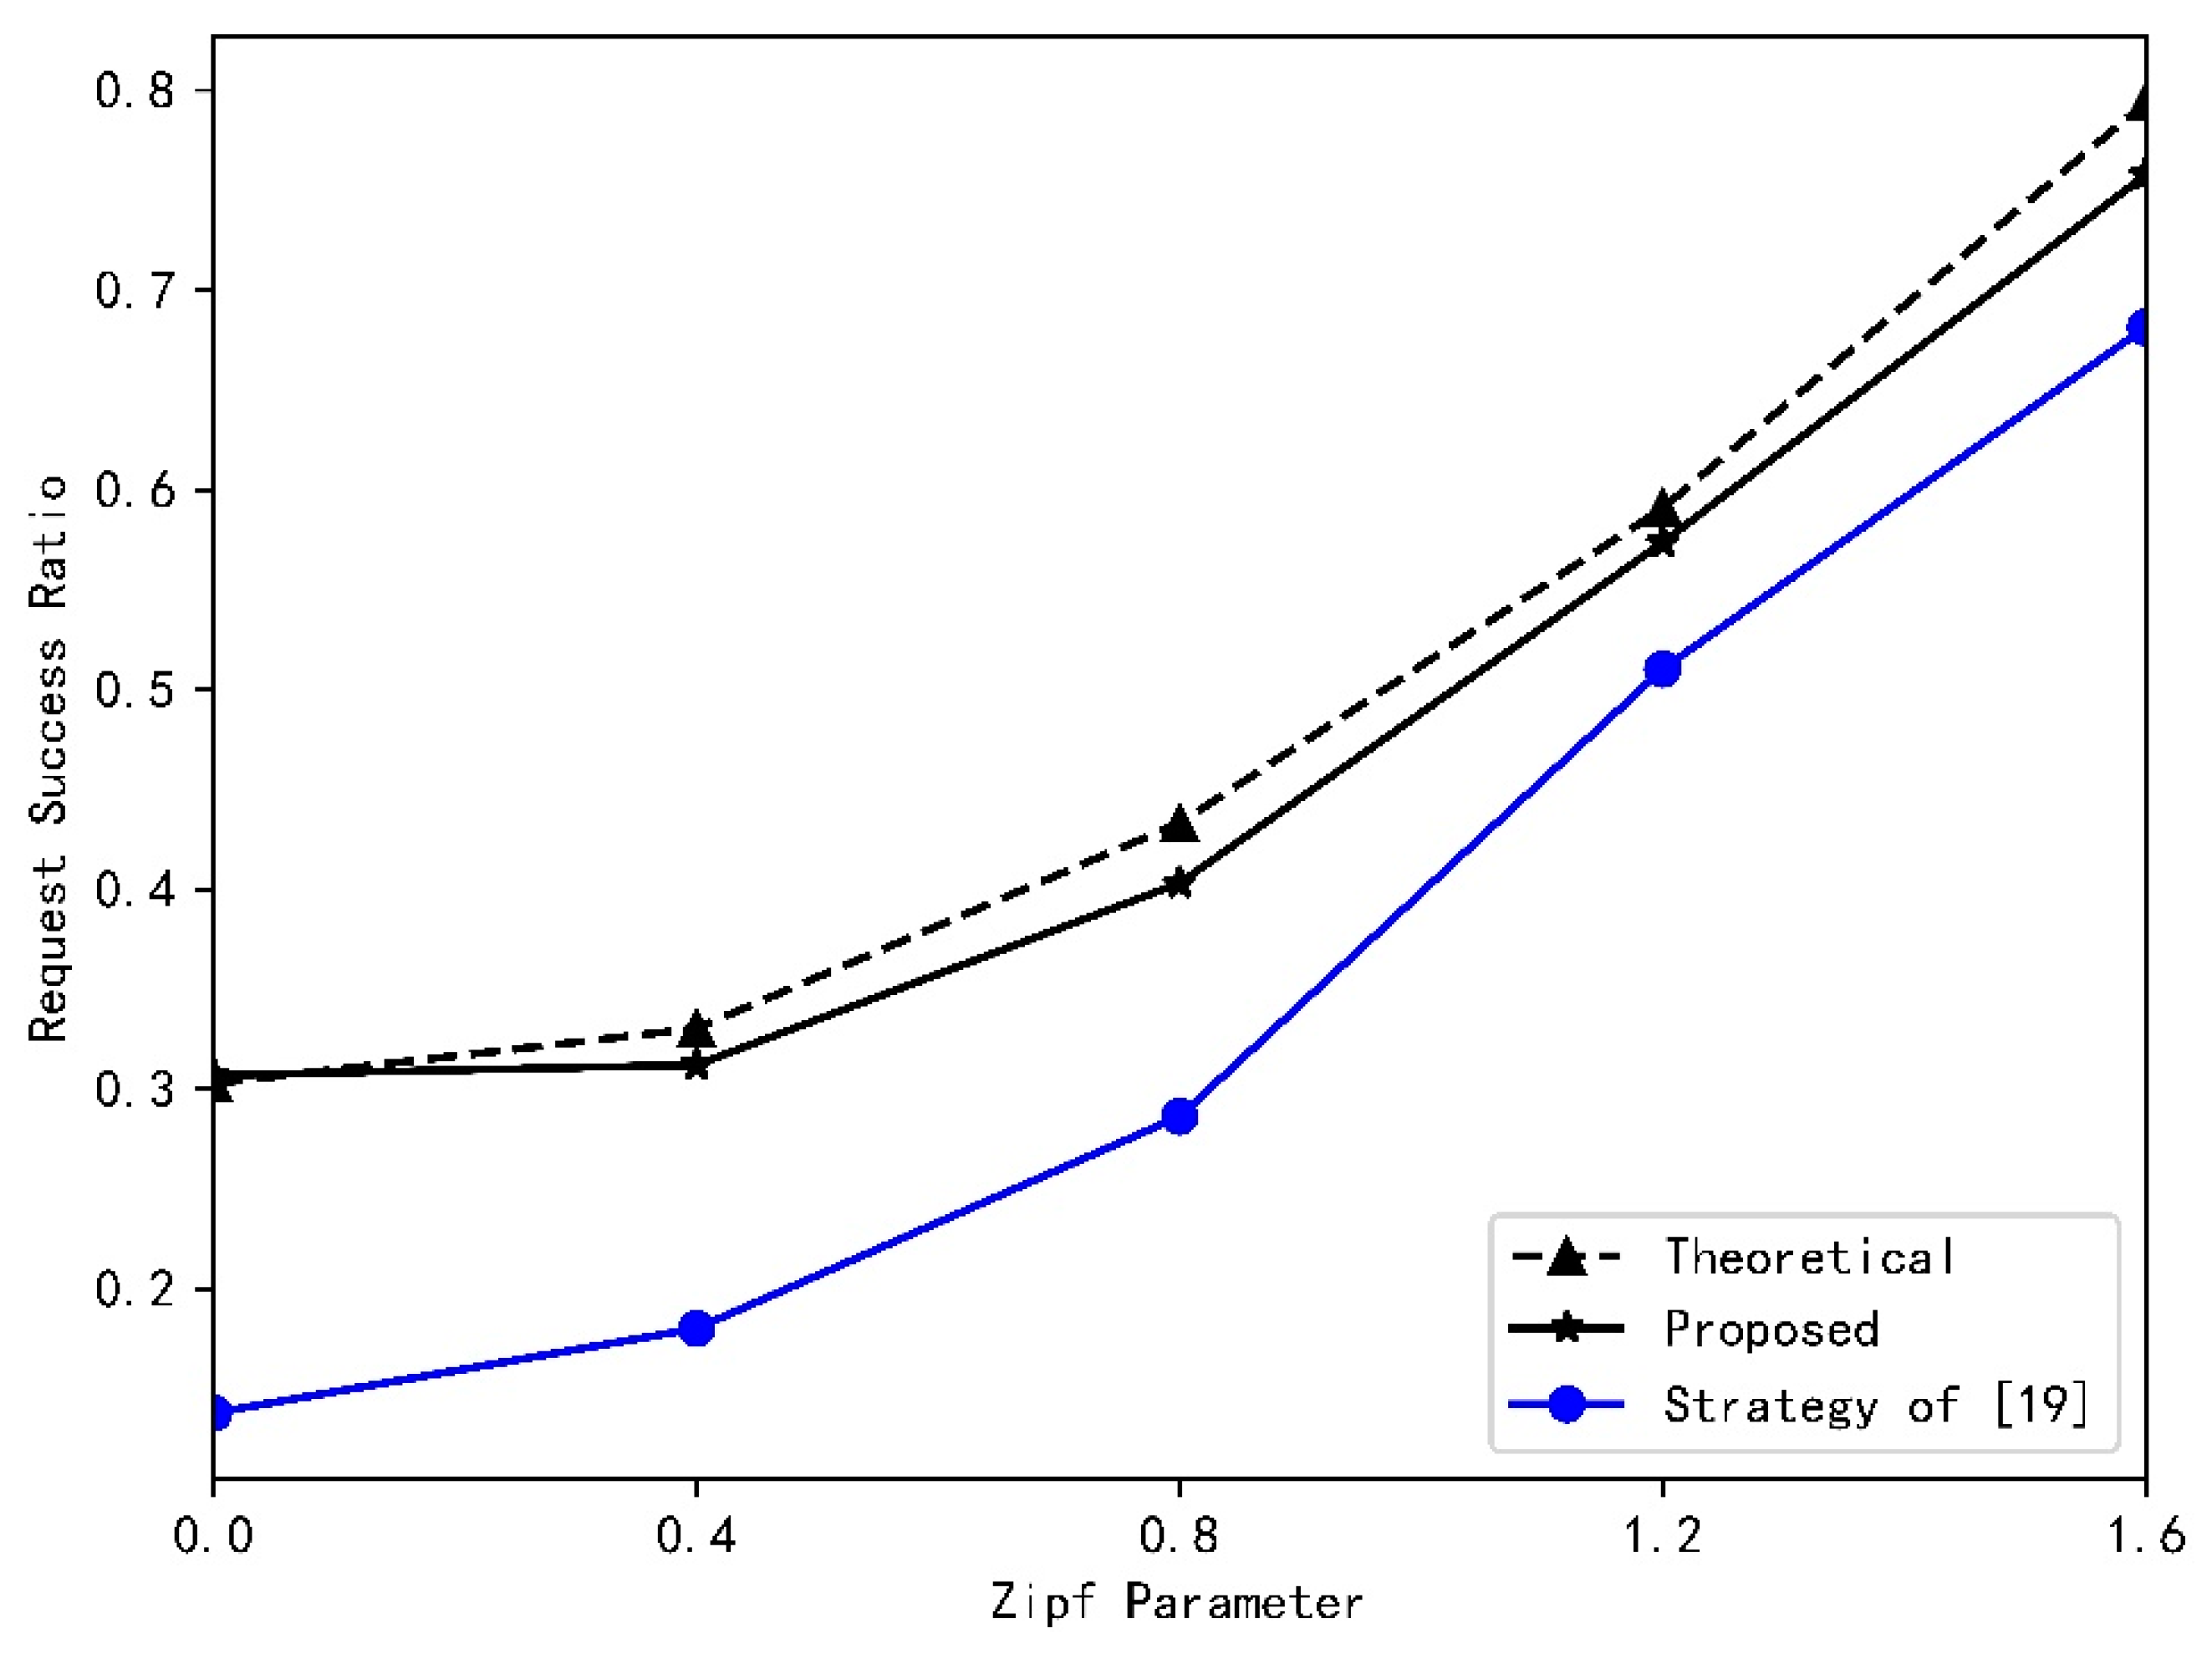
Figure 11 and Figure 12 show the variations of the Average Delay and the Request Success Ratio in the case of different Zipf distribution parameters. As depicted in the graphs, the request delay of vehicles decreased, and the probability of content success transmission increased as the parameter increased. This is because increasing the Zipf distribution parameter increases the probability that a vehicle can find desired content in neighboring vehicles. Compared with the strategy described by the authors of [19], our strategy possesses a lower request delay and higher probability of content success transmission. Because our strategy caches content chunks at multiple vehicles in a cluster, request vehicles can obtain content chunks from vehicles in the cluster one by one, which increases the transmission duration between vehicles, besides. Our strategy also adopts the multiuser multichannel transmission mode in the communication process between clusters to solve the problem of the communication duration being too short to complete content transmission. The probability that a vehicle can obtain content with the participation of RSU decreased as the Zipf distribution parameter increased, which weakened the advantages of our strategy, so the gap in performance between those two strategies decreased as the parameter increased. Figure 12 also illustrates that the theory value and the simulation value of the Request Success Ratio were similar to each other. The former was slightly higher than the latter, and the gap increased as the Zipf distribution parameter increased. This is because the probability that a vehicle will obtain content from neighboring vehicles increases as the Zipf distribution parameter increases. We assumed that the relay vehicle situated in the middle position between the request vehicle and the content source vehicle in case ➁ of our theory analysis, which makes theory value higher than the simulation value.

5. Conclusions

In this paper, we proposed the idea of predicting the moving trajectory of a cluster based on the vehicle behavior prediction in intersection, whereby the driving behavior of vehicles in a cluster determines the moving behavior of the cluster. On this basis, RSU divides the content into multiple chunks and proactively caches those chunks at multiple relay vehicles in a cluster that is about to meet the request vehicle. By letting the request vehicle obtain content chunks from relay vehicles one by one, our strategy enlarges the communication duration. Our paper also optimizes the number of chunks to maximize the probability that the request vehicle will successfully obtain content from the cluster. Besides, our paper adopts the multiuser multichannel transmission mode in the communication process between clusters. Our simulation results demonstrate that the proposed strategy can improve the performance of vehicular network.
Our paper uses vehicle cluster in a trajectory-predicted approach to deliver content. However, there are still several issues, for example, the caching optimization algorithm fails to consider the factor of distance. Future works should explore this issue.

Author Contributions

Conceptualization: S.Y. and Q.Z.; methodology: S.Y.; software: S.Y.; validation: S.Y. and Q.Z.; formal analysis: S.Y.; investigation: S.Y.; resources: Q.Z.; data curation: S.Y.; writing: S.Y.; visualization: S.Y.; supervision: Q.Z.; project administration: Q.Z.; funding acquisition: Q.Z. Both authors have read and agreed to the published version of the manuscript.

Funding

This research was funded by National Natural Science Foundation of China (61971239), (92067201), (61631020) and Postgraduate Research & Practice Innovation Program of Jiangsu Province (KYCX20_0810).

Institutional Review Board Statement

Not applicable.

Informed Consent Statement

Not applicable.

Data Availability Statement

The data and codes presented in this study are available from the corresponding author by request.

Conflicts of Interest

The authors declare no conflict of interest.

References

  1. Cheng, X.; Yang, L.; Shen, X. D2D for Intelligent Transportation Systems: A Feasibility Study. IEEE Trans. Intell. Transp. Syst. 2015, 16, 1784–1793. [Google Scholar] [CrossRef]
  2. Campanile, L.; Iacono, M.; Levis, A.H.; Marulli, F.; Mastroianni, M. Privacy Regulations, Smart Roads, Blockchain, and Liability Insurance: Putting Technologies to Work. IEEE Secur. Priv. 2021, 19, 34–43. [Google Scholar] [CrossRef]
  3. Campanile, L.; Iacono, M.; Marulli, F.; Mastroianni, M. Designing a GDPR compliant blockchain-based IoV distributed information tracking system. Inf. Process. Manag. 2021, 58, 1–23. [Google Scholar] [CrossRef]
  4. Jacobson, V.; Smetters, D.K.; Thornton, J.D.; Plass, M.F.; Briggs, N.H.; Braynard, R.L. Networking named content. Commun. ACM. 2009, 55, 117–124. [Google Scholar] [CrossRef]
  5. Laoutaris, N.; Che, H.; Stavrakakis, I. The LCD interconnection of LRU caches and its analysis. Perform. Eval. 2006, 63, 609–634. [Google Scholar] [CrossRef]
  6. Laoutaris, N.; Syntila, S.; Stavrakakis, I. Meta Algorithms for Hierarchical Web Caches. In Proceedings of the IEEE International Conference on Performance, Computing, and Communications, Phoenix, AZ, USA, 15–17 April 2004; IEEE: Piscataway, NJ, USA, 2004; pp. 445–452. [Google Scholar]
  7. Psaras, I.; Chai, W.K.; Pavlou, G. Probabilistic in-Network Caching for Information-Centric Networks. In Proceedings of the 2nd edition of the ICN Workshop on Information-Centric Networking, Helsinki, Finland, 17 August 2012; Association for Computing Machinery (ACM): New York, NY, USA, 2012; pp. 55–60. [Google Scholar]
  8. Grewe, D.; Wagner, M.; Frey, H. PeRCeIVE: Proactive Caching in ICN-Based VANETs. In Proceedings of the IEEE Vehicular Networking Conference, Columbus, OH, USA, 8–10 December 2016; IEEE: Piscataway, NJ, USA, 2016; pp. 1–8. [Google Scholar]
  9. Alnagar, Y.; Hosny, S.; El-Sherif, A.A. Towards Mobility-Aware Proactive Caching for Vehicular Ad hoc Networks. In Proceedings of the 2019 IEEE Wireless Communications and Networking Conference Workshop (WCNCW), Marrakech, Morocco, 15–18 April 2019; IEEE: Piscataway, NJ, USA, 2019; pp. 1–6. [Google Scholar]
  10. Khelifi, H.; Luo, S.L.; Nour, B.; Sellami, A.; Moungla, H.; Naït-Abdesselam, F. An Optimized Proactive Caching Scheme Based on Mobility Prediction for Vehicular Networks. In Proceedings of the 2018 IEEE Global Communications Conference (GLOBECOM), Abu Dhabi, United Arab Emerites, 9–13 December 2018; IEEE: Piscataway, NJ, USA, 2019; pp. 1–6. [Google Scholar]
  11. Yao, L.; Chen, A.; Deng, J.; Wang, J.; Wu, G. A Cooperative Caching Scheme Based on Mobility Prediction in Vehicular Content Centric Networks. IEEE Trans. Veh. Technol. 2018, 67, 5435–5444. [Google Scholar] [CrossRef]
  12. Zhao, Z.; Guardalben, L.; Karimzadeh, M.; Silva, J.; Braun, T.; Sargento, S. Mobility Prediction-Assisted Over-the-Top Edge Prefetching for Hierarchical VANETs. IEEE J. Sel. Areas Commun. 2018, 36, 1786–1801. [Google Scholar] [CrossRef]
  13. Zhang, F.; Xu, C.; Zhang, Y.; Ramakrishnan, K.K.; Mukherjee, S.; Yates, R.; Nguyen, T. EdgeBuffer: Caching and Prefetching Content at the Edge in the MobilityFirst Future Internet Architecture. In Proceedings of the 16th International Symposium on a World of Wireless, Mobile and Multimedia Networks (WoWMoM), Boston, MA, USA, 14–17 June 2015; IEEE: Piscataway, NJ, USA, 2015; pp. 1–9. [Google Scholar]
  14. Hou, L.; Lei, L.; Zheng, K.; Wang, X. A Q-Learning based Proactive Caching Strategy for Non-safety Related Services in Vehicular Networks. IEEE Internet Things J. 2018, 6, 4512–4520. [Google Scholar] [CrossRef]
  15. Gerla, M.; Tsai, J.T.-C. Multicluster, mobile, multimedia radio network. Wirel. Netw. 1995, 1, 255–265. [Google Scholar] [CrossRef]
  16. Basu, P.; Khan, N.; Little, T.D.C. A Mobility Based Metric for Clustering in Mobile Ad Hoc Networks. In Proceedings of the 21st International Conference on Distributed Computing Systems Workshops, Mesa, AZ, USA, 16–19 April 2001; Association for Computing Machinery: New York, NY, USA, 2001; pp. 413–418. [Google Scholar]
  17. Chatterjee, M.; Das, S.K.; Turgut, D. WCA: A Weighted Clustering Algorithm for Mobile Ad Hoc Networks. Clust. Comput. 2002, 5, 193–204. [Google Scholar] [CrossRef]
  18. Huang, W.; Song, T.; Yang, Y.; Zhang, Y. Cluster-Based Cooperative Caching with Mobility Prediction in Vehicular Named Data Networking. IEEE Access 2019, 7, 23442–23458. [Google Scholar] [CrossRef]
  19. Huang, W.; Song, T.; Yang, Y.; Zhang, Y. Cluster-Based Selective Cooperative Caching Strategy in Vehicular Named Data Networking. In Proceedings of the 2018 1st IEEE International Conference on Hot Information-Centric Networking (HotICN), Shenzhen, China, 15–17 August 2018; IEEE: Piscataway, NJ, USA, 2018; pp. 7–12. [Google Scholar]
  20. Fang, S.; Fan, P. A Cooperative Caching Algorithm for Cluster-Based Vehicular Content Networks with Vehicular Caches. In Proceedings of the 2017 IEEE Globecom Workshops (GC Wkshps), Singapore, 4–8 December 2017; IEEE: Piscataway, NJ, USA, 2017; pp. 1–6. [Google Scholar]
  21. Hu, B.; Fang, L.; Cheng, X.; Yang, L. In-Vehicle Caching (IV-Cache) Via Dynamic Distributed Storage Relay (D2SR) in Vehicular Networks. IEEE Trans. Veh. Technol. 2019, 68, 843–855. [Google Scholar] [CrossRef]
  22. Dacey, M.F. Some Properties of the Superposition of a Point Lattice and a Poisson Point Process. Econ. Geogr. 2016, 47, 86–90. [Google Scholar] [CrossRef]
  23. Wei, M.; Jin, W.; Shen, L. A Platoon Dispersion Model Based on a Truncated Normal Distribution of Speed. J. Appl. Math. 2012, 2012, 1–13. [Google Scholar] [CrossRef]
  24. Cha, M.; Kwak, H.; Rodriguez, P.; Ahn, Y.; Moon, S. Analyzing the Video Popularity Characteristics of Large-Scale User Generated Content Systems. IEEE/ACM Trans. Netw. 2009, 17, 1357–1370. [Google Scholar] [CrossRef] [Green Version]
  25. Krajzewicz, D. Traffic Simulation with SUMO—Simulation of Urban Mobility. In Fundamentals of Traffic Simulation; Barceló, J., Ed.; Springer: Berlin/Heidelberg, Germany, 2010; pp. 269–293. [Google Scholar]
  26. Kagalkar, A.; Raghuram, S. CORDIC Based Implementation of the Softmax Activation Function. In Proceedings of the 2020 24th International Symposium on VLSI Design and Test (VDAT), Bhubaneswar, India, 23–25 July 2020; IEEE: Piscataway, NJ, USA, 2020; pp. 1–4. [Google Scholar]
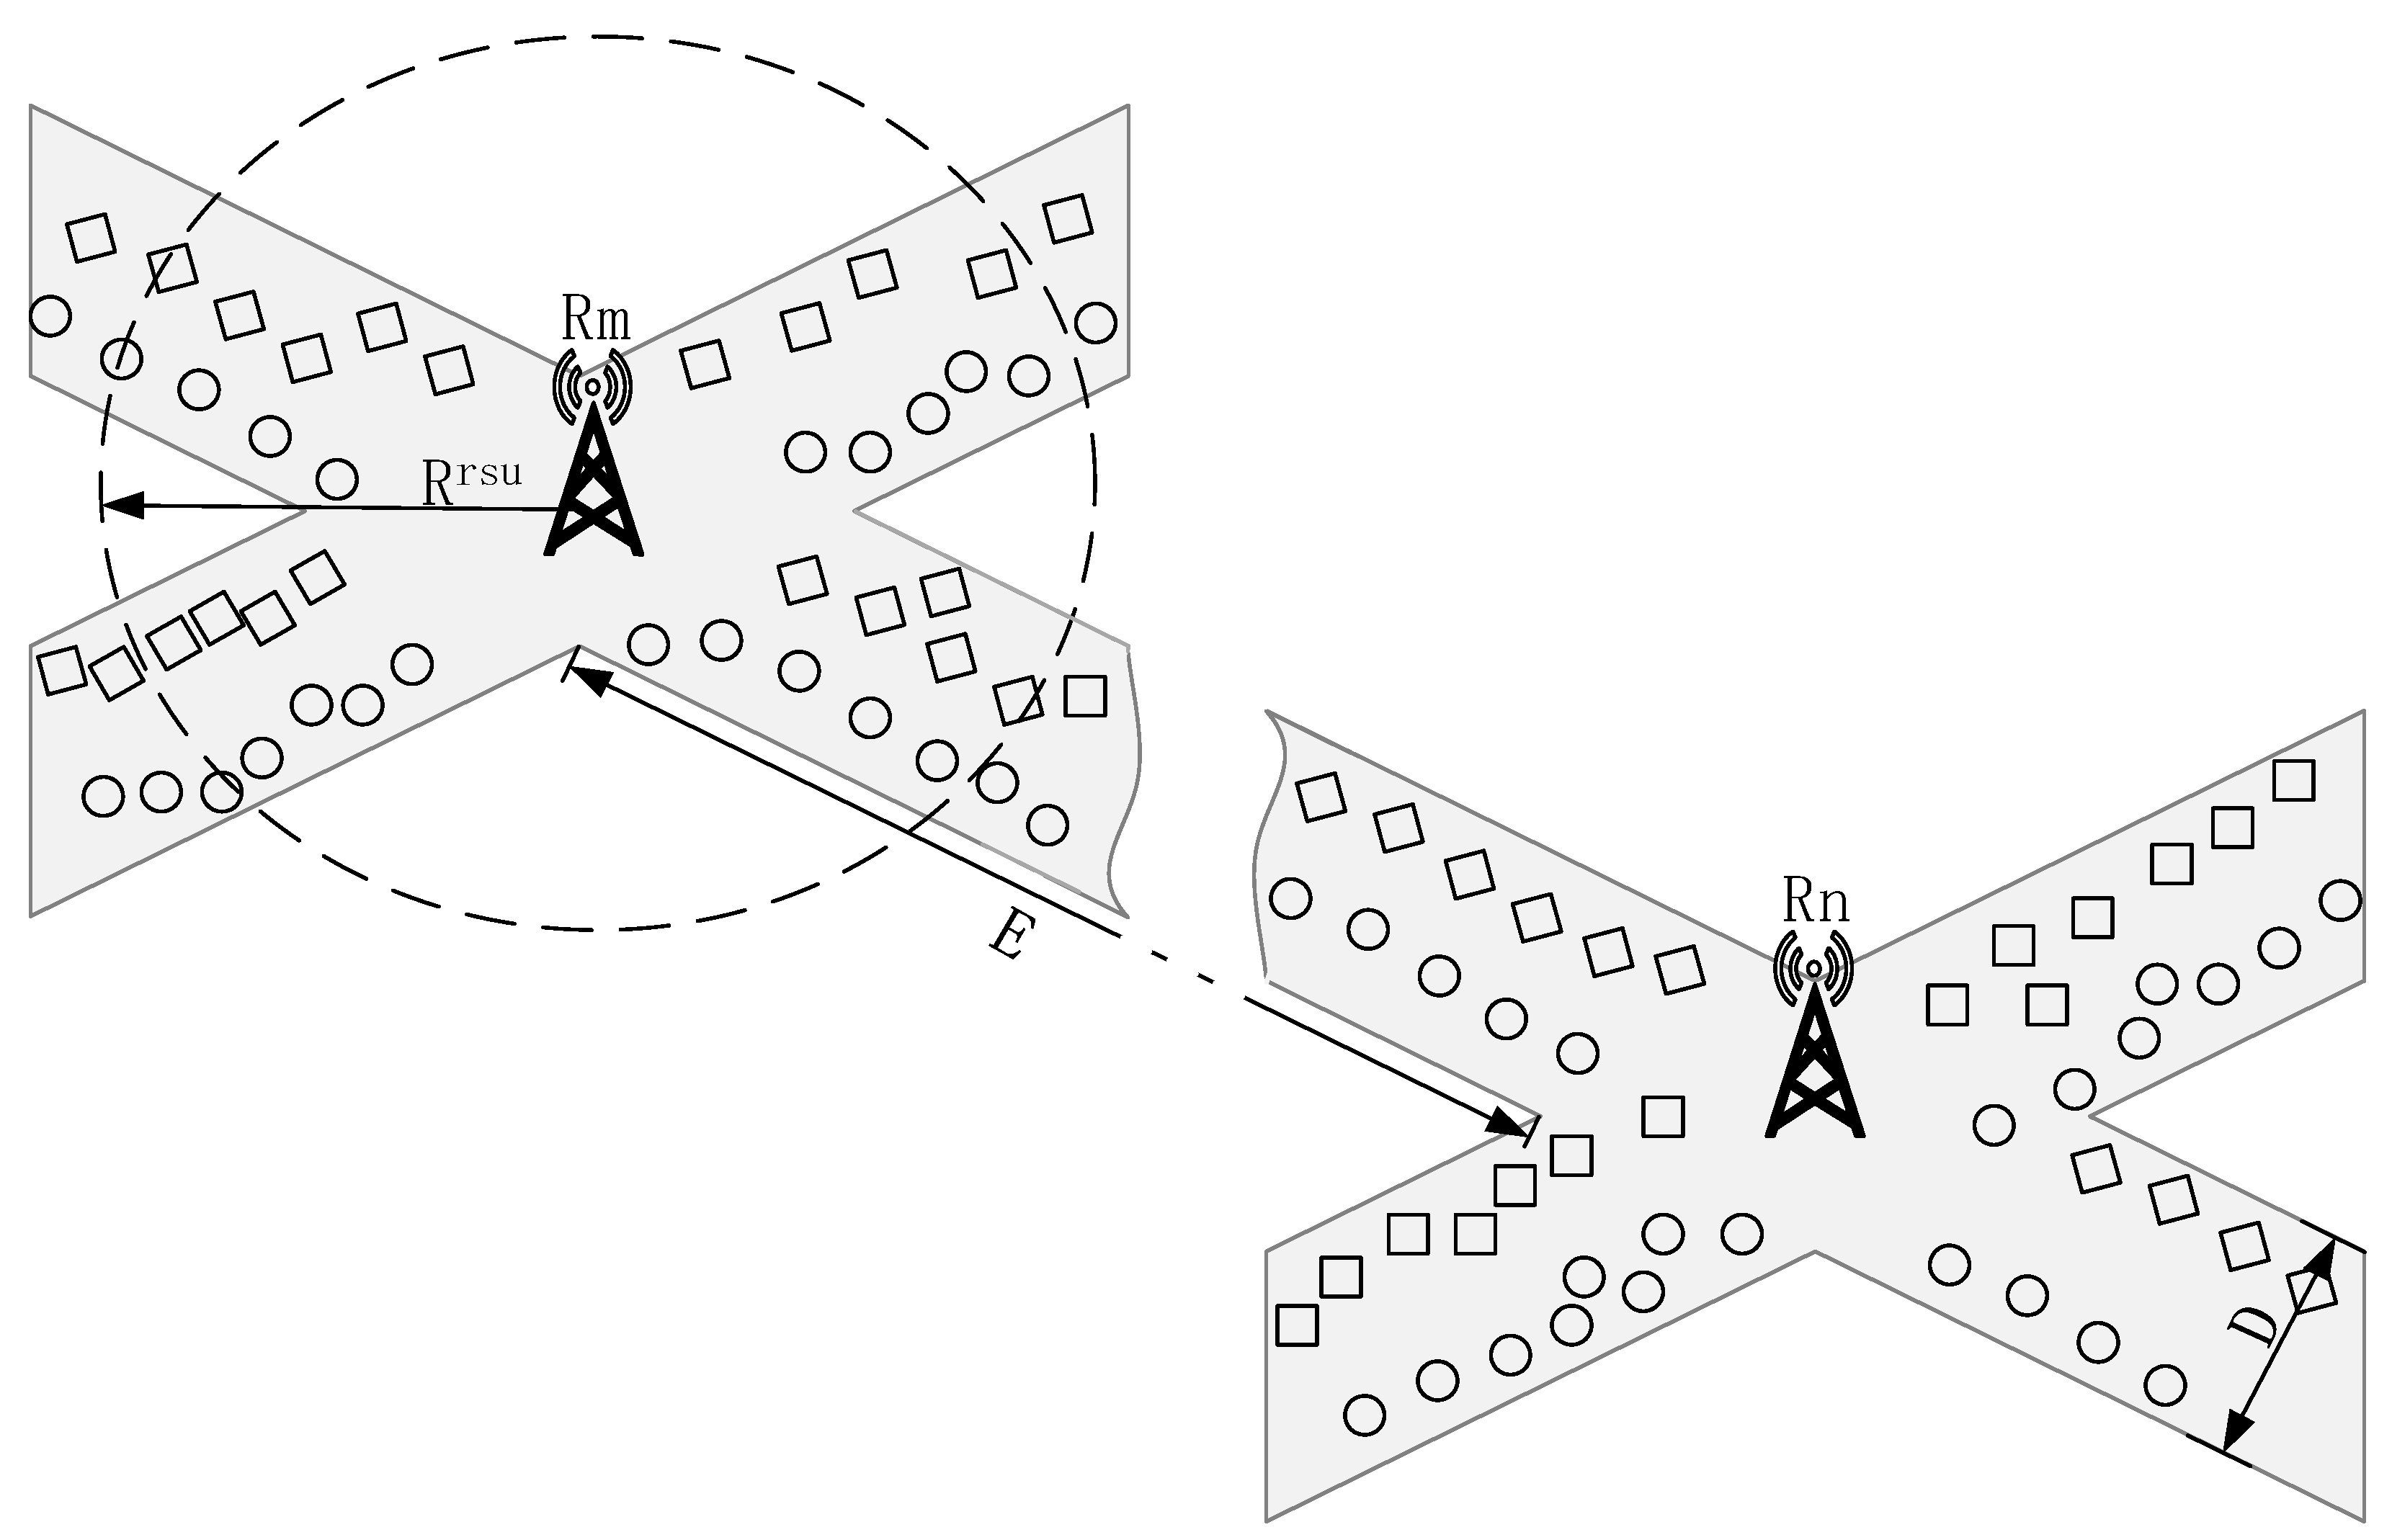
Figure 1. System model.
Applsci 11 02157 g001
Figure 2. The flowchart of content acquisition.
Applsci 11 02157 g002
Figure 3. The process of content acquisition.
Applsci 11 02157 g003
Figure 4. The structure of the neural network.
Applsci 11 02157 g004
Figure 5. Prediction accuracy of the neural network.
Applsci 11 02157 g005
Figure 6. Intersection model.
Applsci 11 02157 g006
Figure 7. The relationship between the Average Delay and content size.
Applsci 11 02157 g007
Figure 8. The relationship between the Request Success Ratio and content size.
Applsci 11 02157 g008
Figure 9. The relationship between the Average Delay and vehicle caching size.
Applsci 11 02157 g009
Figure 10. The relationship between the Request Success Ratio and vehicle caching size.
Applsci 11 02157 g010
Figure 11. The relationship between Average Delay and Zipf distribution parameter.
Applsci 11 02157 g011
Figure 12. The relationship between Request Success Ratio and Zipf distribution parameter.
Applsci 11 02157 g012
Table 1. The definitions of common symbols.
SymbolDescription
I The number of street
D The width of lane
E The length of lane
λ i The parameter of Poisson Point Process for the number of vehicles on lane i
M The number of the roadside units
R m The roadside unit with sequence number of m
R r s u The coverage range of roadside unit
R m a x The maximum transmission rate of roadside unit
R a The average travel distance of vehicle under the coverage range of roadside unit
λ m r s u The parameter of Poisson Process for the request number arriving at R m
L The number of content in content library
γ The parameter of Zipf distribution
W The size of content
V x The vehicle with sequence number of x
H x The number of vehicles in the same lane as V x under the coverage range of V x
N The maximum number of content that vehicle’s caching capacity can accommodate
r v The coverage range of vehicle
C m , i The cluster with vehicles have next prediction lane i under the coverage range of R m
C m , i n u m The number of vehicle in C m , i
Table 2. Simulation parameters.
ParameterValue
The number of content 200
The size of content (Mbit)600
The parameter of Zipf Distribution1
The transmission power of vehicle (mW)200
The transmission power of RSU (mW)2000
The coverage range of vehicle (m)50
The coverage range of RSU (m)100
The length of lane (m)2000
The width of lane (m)7
Publisher’s Note: MDPI stays neutral with regard to jurisdictional claims in published maps and institutional affiliations.