Abstract
Otoacoustic emissions (OAEs) are currently used as a valuable audiological test or as a hearing screening tool. There are many commercially available OAE recording systems that are used both for clinical practice and for research. However, there is little information in the literature comparing their performance in detecting hearing loss. The purpose of this prospective, nonrandomized, and controlled study was to evaluate the screening performance obtained from recent and older versions of the Otometrics Accuscreen OAE screening device in comparison with the Otodynamics ILO-292 OAE system, which has been used as the gold standard. Testing included otoscopic assessment, pure tone audiometry, tympanometry, and transiently evoked OAE (TEOAE) recordings. There was about a 77% agreement between the two versions of the Accuscreen device. Agreement between the two Accuscreen devices and the ILO was approximately 70% for the old and 80% for the new. The newer version of Accuscreen seems to perform better than the old, being more consistent with the reference ILO system and with the audiometry profiles of the tested subjects. In order to set robust standards for OAE evaluation and analysis, additional studies comparing different OAE hearing screening systems are needed.
1. Introduction
Otoacoustic emissions (OAEs) are low-level sounds generated in the cochlea [1]. Their most common application is in the area of universal newborn hearing screening (UNHS) programs [2,3]. Additionally, OAEs can be used in the diagnosis of various cochlear pathologies across all age groups [4]. The main advantages of the OAE acquisition procedures are that they require short measurement times and, since they are noninvasive, they do not require highly specialized clinical personnel [5]. The present study focuses on transiently evoked OAEs (TEOAEs), which are evoked by a click or a chirp [6,7,8].
In general, commercial OAE equipment can be divided into two classes: clinical systems and screening devices. Clinical systems offer numerous methods of OAE stimulation, OAE measurement (transient, spontaneous, and distortion product OAEs), and OAE signal analysis. Clinical systems can be used for hearing screening, but the greater size of the equipment and their higher price can be considered a disadvantage. Screening devices are small and handheld and, in most cases, provide limited information of the OAE response, i.e., a “pass” or a “refer” screening outcome. It is important to note that the objectives of hearing screening are very different from those related to the clinical assessment of a patient, and this is why screening and clinical OAE protocols differ. In a hearing screening context, a high-quality OAE response is not so important as a quick reading that indicates whether an OAE signal is present or not. For this reason, screening protocols use shorter recording windows (usually 10 ms, compared to the 20 ms used in a standard clinical system), which result in shorter acquisition times and therefore faster responses. TEOAEs are very weak signals, and so in order to get a valid response, a large number of averages is needed (usually 1024). Shorter acquisition windows result in the acquisition of more responses in the same time, i.e., around 30 s. Additionally, different manufacturers use different signal processing techniques in order to achieve reliable OAE responses in the least possible time. Although screening OAE devices were initially developed for UNHS programs, they are also used to assess the hearing status of children and adults [9].
Recently, significant progress has been made in OAE measurement protocols and analysis methods [10,11] as well as in OAE hardware and calibration [12,13]. Unfortunately, these improvements have not been widely adopted in the clinic or in the available clinical equipment. It can be assumed that OAE manufacturers consider the achieved OAE performance as very good and not needing any further improvement.
Despite the fact that a large volume of OAE data has been collected since the early 1990s, there have been relatively few reports presenting information on performance issues between different OAE systems or on methods of analysis, even though new methods of analysis have been developed and there is more knowledge about OAEs than when OAE-based UNHS was first recommended in the early 1990s [14]. Clinically used OAE measurement and detection procedures have remained more or less the same. The data in the literature suggest that OAE hearing screening does seem to work adequately, but if one considers the advances in electronics and signal processing over the last 15 years, there still seems to be considerable room for improvement in terms of OAE hardware, OAE protocols, and especially in the area of OAE screening criteria for infants, children, and adults.
The stimulus for the present study stemmed from personal clinical observations related to a long series of unexplained and erroneous results of the OAE hearing screening system that we happened to be using, i.e., the Madsen Accuscreen. We observed that young subjects (neonates, toddlers) with apparently normal hearing sometimes received a “refer” assessment, while subjects presenting a moderate sensorineural hearing impairment were assessed as “pass” cases. Over the years, evidence about similar occurrences has circulated unofficially at audiology and ear, nose, and throat (ENT) specialist meetings, but these anomalies have never been properly assessed or evaluated. One might expect that the data in the literature regarding the performance of OAE devices would help lessen the doubts about these difficult to interpret cases, but over the last 24 years very few papers have presented rigorous data comparing different OAE systems [15,16,17,18,19]. OAEs are clinically very popular and are also chosen as the ideal tool to study the basic mechanisms of hearing [20,21]. The need of being able to compare data across different OAE devices is an important issue, particularly when one considers recent reports of OAE issues caused by erroneous OAE calibration procedures [13]. The issue of OAE screening criteria becomes even more involved when one takes note of the data in the literature suggesting that, across different devices, there is considerable variability in OAE measurements and in the OAE detection criteria [22].
The present study is designed to answer questions about the OAE data the authors have encountered and to document the variability of the OAE data between different devices. The Accuscreen device, with its statistical OAE evaluation algorithms, is considered in many countries of Europe and elsewhere as the device of choice for infant and children hearing assessment, and it is also used for clinical assessment of adult subjects.
The objective of this study is to compare the data acquired from the new touchscreen Accuscreen device with the outcomes from the previous Accuscreen model, using the ILO-292 equipment as the gold standard. To identify the factors that might be contributing to different performances between the tested devices, very high-quality OAE data are required. To minimize issues related to OAE recording variability, which are often observed in neonates, the data for this study are recorded from adult subjects. This provided important advantages: (i) The software and hardware for the OAE data collection of all these devices is the same for neonates, children, and adults, and so the conclusions from an adult group can be easily extended to another population of interest; (ii) the adult OAE responses present significantly lower levels of noise, and so effects related to the recording device are more easily identified; (iii) for every subject it is possible to have supporting audiometric data on hearing thresholds, i.e., data that are not easily available for neonates or young children.
2. Materials and Methods
2.1. Subjects
Data were recorded from 94 adult subjects (51 women and 43 men) with ages ranging from 21 to 85 years (M = 48.7; SD = 14.5). Data were obtained from a total of 185 ears (101 female and 84 male). The group consisted of 61 ears with normal hearing and 124 ears with various degrees of hearing impairment ranging from mild to severe. More detailed information on the hearing thresholds is presented in a later section, where hearing thresholds are compared with the OAE screening results.
Research procedures were approved by the Ethics Committee of the Institute of Physiology and Pathology of Hearing in Poland (IFPS/KB/06/2012), and all participants gave written informed consent.
2.2. Measurements
The audiological testing included an otoscopic assessment, pure tone audiometry (PTA), tympanometry measurements, and OAE recordings.
Hearing thresholds better than 25 dB HL between 0.125–8 kHz were taken to represent normal hearing. All subjects presented normal middle ear function, as assessed by otoscopic examination and tympanometry (tympanometric peak pressures were between –100 and +100 daPa and peak compensated static acoustic admittance values were approximately 0.2–1.0 mmhos).
TEOAEs were measured by three systems: the ILO-292 (software version 5.61, Otodynamics Ltd., Hatfield, UK) and two versions of the Madsen Accuscreen (Otometrics, Natus Medical Denmark ApS). All OAE testing was conducted inside an audiometric booth, and the testing order was randomized.
The ILO-292 was selected as the gold standard for two reasons: (i) Results from this system have been reported in the majority of papers in the literature; (ii) the system has been tested extensively by the authors and has proved to provide good separation of normal and impaired ears [22,23,24,25]. Signal-to-noise ratios (SNRs) were collected using the standard nonlinear protocol (stimulus of 80 dB peSPL with a 50 Hz click rate and a 20 ms recording window), providing information at frequencies of 1.0, 1.4, 2.0, 2.8, and 4.0 kHz. The recording was qualified as a pass when the SNR in 3 of 5 frequency bands exceeded 3 dB [26].
In the case of Accuscreen, two versions were used. The older device, Accuscreen Pro (firmware: 1.07E1M, GN Otometrics, Denmark)), which was produced between 2005 to 2010, will be referred to as Accu 1. The newer device, the Accuscreen OAE and ABR Screener (touchscreen, Type 1077, firmware 1.12.04877 SEU, GN Otometrics A/S, Denmark), which has been produced since 2010, will be referred to as Accu 2. The Accuscreen stimulus protocol uses 70–84 dB SPL click stimuli, in a nonlinear mode and with an approximately 60 Hz click rate. The Accuscreen manual states that the TEOAE waveform is evaluated by counting the number of significant peaks in a certain statistically generated graph; however, the user has no detailed insight into how this is performed. When the TEOAE measurement is complete, both devices provide a pass/refer evaluation of the OAE response. Since this evaluation is based on statistical criteria, there is no information on SNR parameters or any frequency-band analysis.
2.3. Statistical Analysis
The agreement between the Accu 1, Accu 2, and the ILO outcomes was calculated by dividing the number of concordant responses by the number of all responses. Additionally, Cohen’s kappa was used to evaluate agreement between devices. Cohen’s kappa represents the level of chance-corrected agreement [27], with its values ranging between –1 and +1. A value of 0 means there is no more agreement than can be expected by chance; a value below 0 means there is lower agreement than can be expected by chance. Kappa values above 0 were interpreted according to the classification given by Landis and Koch [28]: 0–0.2, slight agreement; 0.2–0.4, fair; 0.4–0.6, moderate; 0.6–0.8, substantial; 0.8–1, almost perfect agreement. A chi-square test was used to assess the relationship between the scores given by the two devices.
From the available data, three groups of results emerged: refer–refer (when both devices gave a positive screening result); pass–pass (when both devices gave a negative result); and pass–refer (when the devices gave inconsistent results).
Discriminant analysis was conducted to determine which variables (pure-tone hearing thresholds and SNR results) are best distinguished between the three groups (refer–refer; pass–pass; pass–refer). Discriminant analysis identifies the linear combination (functions) of predictors that contribute maximally to group separation. The number of discriminant functions is the number of groups minus 1 (i.e., for three groups, two discriminant functions are calculated). Discriminant coefficients act in a manner analogous to regression coefficients; the larger coefficient, the greater is the contribution of the given variable to the discrimination between groups. The centroids are the mean variate scores for each group. A combined-group plot shows the variate score for each object, grouped according to the condition to which the given object belongs to [29].
A value of p < 0.05 was considered statistically significant. Statistical analysis was performed with IBM SPSS (Statistical Package for the Social Sciences) Statistics version 24 (Armonk, NY, USA: IBM Corp., 2016).
3. Results
3.1. Agreement between Accu 1, Accu 2, and ILO TEOAE Responses
The Accu 1 TEOAE responses gave a 75.1% pass rate and a 24.9% refer rate, while the Accu 2 gave a 52.4% pass rate and a 47.6% refer rate. The gold standard ILO-292 gave a 45.9% pass rate and a 54.1% refer rate.
Table 1 summarizes the relationship between the outcomes of Accu 1, Accu 2, and ILO. Values of a chi-square test, Cohen’s kappa, and agreement between the devices are also presented.

Table 1.
Agreement between Accu 1 and Accu 2, and between each of the two devices and ILO. Comparisons show pass/refer rates (number of ears and percent values in brackets), values of chi-square test, and Cohen’s kappa.
There was a 77.3% agreement between the Accu 1 and the Accu 2 outcomes: 143 ears were classified concordantly by both devices, with 46 ears as refer and 97 ears as pass. For 42 ears (22.7%), disagreement between the devices was observed. Agreement between the Accu 1 and Accu 2 was 83.6% for ears with normal hearing and 74.2% for impaired ears. The relationship between the results of both devices was statistically significant (p < 0.001); Cohen’s kappa indicated moderate agreement between Accu 1 and Accu 2 for all ears.
The agreement between the Accu 1 and ILO-292 outcomes was 70.8%: 131 ears were classified consistently by both devices, with 46 ears as refer and 85 ears as pass. The disagreement was 29.2% (54 ears). Agreement between the Accu 1 and the ILO-292 was 95.1% for ears with normal hearing and 58.9% for impaired ears. The relationship between results of both devices was statistically significant (p < 0.001); Cohen’s kappa indicated moderate agreement between Accu 1 and ILO for all ears.
There was a 80.5% agreement between the Accu 2 and the ILO-292 outcomes: 149 ears were classified concordantly by both devices, with 76 ears as refer and 73 ears as pass. There was disagreement between the devices for 36 ears (19.5%). Agreement between the Accu 2 and the ILO-292 was 85.2% for ears with normal hearing and 78.2% for impaired ears. The relationship between results of both devices was statistically significant (p < 0.001); Cohen’s kappa showed moderate agreement for all ears between the Accu 2 and the ILO-292.
3.2. Audiometric Characteristics of the TEOAE Outcomes from the Accuscreen Devices
After the initial assessment across the two tested devices, the TEOAE outcomes were classified in three groups of ears, i.e., refer–refer, pass–pass, and pass–refer (see definition of the group names in the statistical analysis section).
For the refer–refer group, the average hearing thresholds exceeded 25 dB at all frequencies. For the pass–pass group, the average hearing thresholds did not exceed 25 dB in the frequency range 0.125–4 kHz but were above 25 dB at 8 kHz. The most inconsistent results were observed in cases of ears classified as pass–refer. Average hearing thresholds were approximately 25 dB; at 2 kHz the hearing threshold was 25.95 dB, but at 4 and 8 kHz the average hearing thresholds were >40 dB. The audiometric thresholds of these groups are shown in Figure 1A.
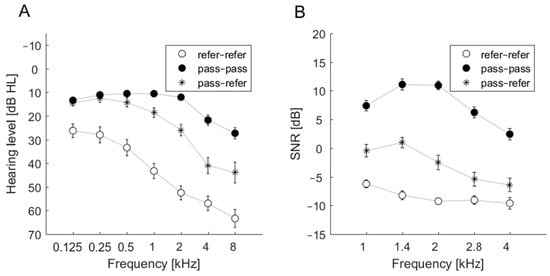
Figure 1.
Average pure tone audiometry (PTA) thresholds (A) and average signal-to-noise ratio (SNR) (B) of transiently evoked otoacoustic emissions (TEOAEs) as measured by the ILO device for three groups: refer–refer, pass–pass, and pass–refer.
3.3. SNR Estimates and the Outcomes of Accu 1 and Accu 2
SNR estimates were obtained from the ILO-292 recordings. The SNR data related to the three groups (refer–refer, pass–pass, pass–refer) revealed a particular pattern in the pass–pass group. Figure 1B summarizes the patterns. Only the pass–pass group had average SNRs above 0 dB at all frequencies. The average SNRs for the refer–refer group were well below 0 dB, indicating an absence of detectable TEOAEs. For the pass–refer group, average SNRs for 1 and 1.4 kHz were close to 0 dB, while higher frequencies were below 0 dB. Generally, these three groups were well separated, similar to the thresholds in the 1–4 kHz range. Figure 1B indicates that the disagreement between Accu 1 and Accu 2 in the pass–refer group may come from some borderline cases. A slight change in TEOAE detection criteria might change the classification result for this group from pass–refer to pass–pass or refer–refer. This situation was not observed in ears classified in the other two groups (pass–pass and refer–refer).
3.4. Accu 1 and Accu 2 Outcomes in Relation to Hearing Thresholds
Based on the audiometric data from each tested ear, it was possible to define three frequency ranges for hearing thresholds >25 dB, as in the scheme below:
- low frequency range: 0.125–0.5 kHz;
- mid-frequency range: 1–4 kHz;
- high frequency range: 8 kHz.
Test results for the ears were as follows: 10 ears above 25 dB only at mid-frequencies; 12 ears above 25 dB only at high frequencies; 1 ear above 25 dB at both low and high frequencies; 61 ears above 25 dB at both mid and high frequencies; 40 ears above 25 dB for all three ranges; and 61 ears where the hearing threshold was not elevated >25 dB for any of the three frequency ranges. Table 2 shows how the devices classified these ears (i.e., pass or refer).
Table 2.
Pass and refer rates of both Accuscreen devices in ears with hearing thresholds above 25 dB at low and/or mid and/or high frequencies. Number of ears and percent values (in parentheses) are given.
As can be seen in Table 2, both Accuscreen devices performed best when an ear presented simultaneous threshold elevation in all three frequency ranges. The Accu 2 was especially efficient in properly identifying these ears (82.5% refer rate). Accu 2 also performed fairly well in cases presenting a threshold elevation in the mid and high frequency ranges. The refer rate for Accu 2 was 60.7%, while the corresponding rate for the Accu 1 was 26.2%.
Both devices performed worst in ears where only the 8 kHz frequency threshold was >25 dB. The Accu 2 gave a 25% refer rate and the Accu 1 an 8.3% refer rate. These observations form indirect evidence suggesting that the Accuscreen probes have a rather narrow frequency response (capturing information mainly from the 1–2 kHz range).
The agreement (refer–refer, pass–pass, pass–refer) between the Accuscreen devices in classifying ears with hearing thresholds above 25 dB was also evaluated. These results are summarized in Table 3.
Table 3.
Agreement between both Accuscreen devices in ears with hearing thresholds above 25 dB in low and/or mid and/or high frequencies. Number of ears (and percent values) are given.
Table 3 shows that disagreement occurred most frequently in relation to ears with elevated thresholds in the mid and high frequency ranges, i.e., 34.4% of these ears received different assessments. Additionally, 39.3% of these ears (presenting threshold elevations in the mid and high frequency ranges) were classified by both devices as pass–pass cases, and only 26.2% were classified as refer–refer. Both Accuscreen devices classified the majority of ears having only a threshold elevation in the mid or high frequency range as pass–pass cases (60% and 75%, respectively); it is possible that there was a situation where substantial agreement ensued, but such consistency is questionable (i.e., it is more likely that both devices had difficulty recognizing the problem).
3.5. Discriminant Analysis
The aim of the discriminant analysis was to determine which variables among the hearing thresholds and SNR data best distinguished the three classification groups (i.e., refer–refer, pass–pass, pass–refer).
Based on assessed hearing thresholds, a discriminant analysis revealed two discriminant functions. The first one explained 95.2% of the variance (canonical R2 = 0.60), whereas the second explained 4.8% of the variance (canonical R2 = 0.07). In combination, both discriminant functions significantly differentiated the three groups (for the first function, Λ = 0.37; χ2 = 176.87; p < 0.001; for the second: Λ = 0.93; χ2 = 13.04; p = 0.042). Standardized discriminant function coefficients for the two functions are given in Table 4. The largest contribution to the first variate was made by thresholds at 1 and 2 kHz, while the 4 kHz threshold made the largest contribution to the second variable. The first function discriminates the refer–refer group from the pass–pass group (i.e., the distance between centroids is large). The second function discriminates the pass–refer group from the other two groups but is less powerful in differentiating them (Figure 2A).
Table 4.
Results of discrimination analysis based on PTA thresholds (A) and on SNR results (B).
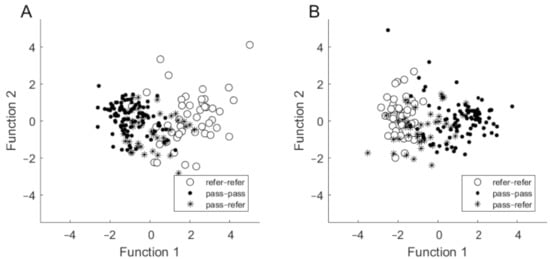
Figure 2.
Discriminant function plots in which discrimination is based on hearing thresholds (A) and on SNR (B).
Based on SNR results, the discriminant analysis revealed two discriminant functions. The first one explained 97.4% of the variance (canonical R2 = 0.64), whereas the second explained only 2.6% of the variance (canonical R2 = 0.04). The contribution of the first function was statistically significant (Λ = 0.35; χ2 = 189.80; p < 0.001), whereas the contribution of the second function was not statistically significant (Λ = 0.96; χ2 = 8.21; p = 0.084). Standardized discriminant function coefficients for the two functions are given in Table 4. The SNR at 2 kHz was the most important for the first function, while SNR at 1.4 kHz was the most important for the second. The first function discriminates the refer–refer group from the pass–pass group (i.e., there is a large distance between centroids), while the second function discriminates the pass–refer group from the other two groups, but again it is less powerful in its differentiation (Figure 2B).
4. Discussion
Many commercial OAE screening systems work as a “black box”, and so users have an incomplete knowledge about how they function. The stimulation parameters (stimulus shape, level, polarity), the recording properties (windows, filters), and the analysis method (criteria for classification) remain usually unspecified in the user manual, presumably because of copyright issues and technical patents. This study attempted to uncover some of these properties by comparing results from two versions of the Accuscreen OAE device and the ILO system. The motivation was that presently there are only a few papers in the literature that present data comparing different OAE systems. For example, in a study of two types of ILO systems, a screening and a clinical type, agreement above 90% was reported [17]. Grandori et al. reported a very high level of agreement (nearly 99%) between an ILO-88 and the Madsen EchoScreen, a predecessor of the Accuscreen [15]. Such results, as well as a scarcity of newer studies and shortage of information, have created the erroneous impression that there is good agreement between measurements from different OAE systems.
Our data show that there were significant differences in TEOAE evaluation as assessed by the old and new versions of the Accuscreen device, even though they are from the same manufacturer. Differences were also observed when the Accuscreen devices were compared with the ILO-292 system. Agreement between both Accuscreen devices was gauged as moderate (77.3%, κ = 0.54), similar to the level of agreement (70.8%, κ = 0.44) between the older device (Accu 1) and the ILO. Only agreement between the newer device (Accu 2) and the ILO was gauged as acceptable (80.5%, κ = 0.61). The best point of comparison for our results that we could find was a Food and Drug Administration report [30] that compared the new Accuscreen evaluated here (Accu 2) and the EchoScreen, which is the predecessor of the older version of Accuscreen (Accu 1). The disadvantage of this study was that it involved only a small study group. Nevertheless, for adult subjects, agreement of around 86% was achieved, which is slightly better than the agreements achieved here of around 70–80%.
In terms of audiometric results, the disagreement between the Accuscreen devices occurred most frequently in ears with higher thresholds in the 1–8 kHz range and where thresholds below 1 kHz were still within the norm. The newer version of the device (Accu 2) performed better than the old (Accu 1). We can only suppose that the TEOAE analysis method was improved in the new version. The biggest weakness of both devices is that they provided a pass to ears with a threshold elevation >25 dB at 8 kHz. However, this is not surprising in that the majority of TEOAE probes have a frequency response limited to 4–5 kHz. In addition, from previous studies, OAEs (especially TEOAEs) are generally known to perform best over only the 1–4 kHz range [31]. Indeed, the discriminant analysis revealed that the most important audiometric frequencies in terms of pass/refer results were 1, 2, and 4 kHz, which covers the TEOAE range. This range also includes the greatest slope for the group of ears for which the results were different (Figure 1). When the SNRs from the ILO were used in the discriminant analysis, it showed that the most important frequencies were 1.4 and 2 kHz. This is probably related to the fact that adult TEOAEs present higher amplitude levels in the 1–2 kHz range. It is also relevant that these frequencies are also dominant in speech, and so the presence of OAEs in this range may indicate good speech understanding; however, this cannot be generalized to cases of auditory neuropathy or disturbances to auditory brainstem responses (ABRs) [32]. For ears with weak TEOAEs, a response above 2 kHz may not be present, and in the 1.4–2 kHz range it can be very small. This weakness may give rise to disagreement between different systems when different classification criteria are used (e.g., if the criterion is that 3 of 5, or 2 of 5, frequency bands have to reach a certain SNR). Generally, it can be said that problems with incorrect pass/refer classifications come from ears with downward sloping audiograms.
Although our work looked at particular systems, we think the results have more general significance. We did not intend to promote or disparage any of the examined systems; we just evaluated the systems that are in use in our clinic. This paper shows there are significant differences between results obtained by different systems, even from the same manufacturer. This implies there is a need for more normative papers involving OAE data that compare different systems. There is some basic knowledge of what the pass/refer rates are in UNHS programs, but the results presented here indicate that the rate depends substantially on which device is used. It would be interesting to compare the results of UNHS programs made on different devices in different clinics or countries, similar to the study of Grandori et al. [15]. Another problem is that instructions for the devices often fail to provide details about how the OAE signal is detected and classified. For example, the Accuscreen systems tested here give only vague descriptions of noise-weighted averaging and counting of significant signal peaks.
Although screening devices are usually aimed at UNHS, it is worth mentioning that screening devices are often used for assessing the hearing status of adults in the clinic as well as in research [33], and the Accuscreen device has been tested by the U.S. Food and Drug Administration (FDA) for use on all age groups [30]. In order to compare the three OAE systems, only the highest quality OAE data were considered, i.e., data recorded from adult subjects. Since the same hardware and software algorithms are used to collect neonatal and adult data, the findings of this study can be extended to other types of populations (neonates, toddlers, etc.). For example, the data from Table 2 and Table 3 indirectly suggest that the Accuscreen evaluation algorithm deliberately uses a rather narrow frequency response, capturing information mainly from the 1–2 kHz band. This implies that hearing losses in other octave bands will not be detected and the inevitable outcome of an evaluation will be a pass.
Nevertheless, in order to improve the current OAE evaluation criteria, additional studies that compare different OAE devices and their performances in different age groups are needed.
5. Conclusions
This study shows there is an overlooked problem regarding OAE recording systems. There is an untested clinical consensus which assumes that different OAE devices provide consistent results. This study shows that the clinical situation is quite different, and that there are significant differences between different OAE systems, even from the same manufacturer. It does seem that the newer device is an improvement over the older one. Nevertheless, the manufacturer provides little information on the changes introduced in the newer generation of devices. The present study only scratches the surface of problems relating to OAE device compatibility, namely in where there are issues that were raised by other researchers of different calibration standards [12,13]. Users must demand more transparent information about the OAE systems in use. There is a need for additional studies comparing different OAE systems, conducted independently by researchers but also by the manufacturers themselves. We think the problem resides not so much with manufacturers but with the fact that the work on universal standards for OAE recording and analysis done by clinicians and researchers, perhaps somewhere in the past (probably from the early 1990s), was neglected.
Author Contributions
Conceptualization, W.W.J., and S.H.; methodology, W.W.J., E.P., and E.G.; validation, W.W.J. and E.P.; formal analysis, E.G. and W.W.J.; investigation, W.W.J., E.P., E.G., P.H.S., H.S., and S.H.; resources, W.W.J. and E.P.; data curation, W.W.J. and E.P.; writing—original draft preparation, W.W.J., E.G. and S.H.; writing—review and editing, W.W.J., E.G. and S.H.; supervision, P.H.S. and H.S.; project administration, W.W.J. and E.P.; funding acquisition, H.S. and P.H.S. All authors have read and agreed to the published version of the manuscript.
Funding
This research received no external funding.
Institutional Review Board Statement
The study was conducted according to the guidelines of the Declaration of Helsinki, and approved by the Ethics Committee of the Institute of Physiology and Pathology of Hearing in Poland (IFPS/KB/06/2012).
Informed Consent Statement
Informed consent was obtained from all subjects involved in the study.
Data Availability Statement
The data that support the findings of this study are available from the first author (W.W.J.) upon reasonable request.
Acknowledgments
We thank Andrew Bell for comments on an earlier version of this article.
Conflicts of Interest
The authors declare no conflict of interest.
Abbreviations
| ABR | Auditory brainstem response |
| ENT | Ear, nose, and throat specialist |
| FDA | U.S. Food and Drug Administration |
| HL | Hearing loss |
| OAE | Otoacoustic emissions |
| PTA | Pure tone audiometry |
| SNR | Signal-to-noise ratio |
| SPL | Sound pressure level |
| SPSS | Statistical Package for the Social Sciences |
| TEOAE | Transient evoked otoacoustic emissions |
| UNHS | Universal newborn hearing screening |
References
- Kemp, D.T. Stimulated acoustic emissions from within the human auditory system. J. Acoust. Soc. Am. 1978, 64, 1386–1391. [Google Scholar] [CrossRef]
- Grandori, F.; Collet, L.; Kemp, D.; Salomon, G.; Schorn, K.; Thornton, A.R. Universal screening for infant hearing impair-ment. European concerted action on otoacoustic emissions. Pediatrics 1994, 94, 956–957. [Google Scholar] [PubMed]
- Iii, J.W.H. Screening for and assessment of infant hearing impairment. J. Perinatol. 2000, 20, S113–S121. [Google Scholar]
- Lonsbury-Martin, B.L.; Martin, G.K. Otoacoustic emissions. Curr. Opin. Otolaryngol. Head Neck Surg. 2003, 11, 361–366. [Google Scholar] [CrossRef] [PubMed]
- Friderichs, N.; Swanepoel, D.W.; Hall, J.W. Efficacy of a community-based infant hearing screening program utilizing existing clinic personnel in Western Cape, South Africa. Int. J. Pediatr. Otorhinolaryngol. 2012, 76, 552–559. [Google Scholar] [CrossRef] [PubMed]
- Kemp, D.T.; Ryan, S.; Bray, P. A guide to the effective use of otoacoustic emissions. Ear Hear. 1990, 11, 93–105. [Google Scholar] [CrossRef] [PubMed]
- Jedrzejczak, W.W.; Kochanek, K.; Śliwa, L.; Pilka, E.; Piotrowska, A.; Skarżyński, H. Chirp-evoked otoacoustic emissions in children. Int. J. Pediatr. Otorhinolaryngol. 2013, 77, 101–106. [Google Scholar] [CrossRef] [PubMed]
- Keefe, D.H.; Feeney, M.P.; Hunter, L.L.; Fitzpatrick, D.F. Comparisons of transient evoked otoacoustic emissions using chirp and click stimuli. J. Acoust. Soc. Am. 2016, 140, 1949–1973. [Google Scholar] [CrossRef]
- Chao, Y.-H.; Wu, K.; Lin, C.-Y.; Tsai, M.; Peng, C.-T.; Wu, H.-P.; Lin, C.-D. Audiologic and vestibular assessment in patients with β-thalassemia major receiving long-term transfusion therapy. Pediatr. Blood Cancer 2013, 60, 1963–1966. [Google Scholar] [CrossRef]
- Long, G.R.; Talmadge, C.L.; Lee, J. Measuring distortion product otoacoustic emissions using continuously sweeping primaries. J. Acoust. Soc. Am. 2008, 124, 1613. [Google Scholar] [CrossRef]
- Kalluri, R.; Shera, C.A. Measuring stimulus-frequency otoacoustic emissions using swept tones. J. Acoust. Soc. Am. 2013, 134, 356–368. [Google Scholar] [CrossRef]
- Souza, N.N.; Dhar, S.; Neely, S.T.; Siegel, J.H. Comparison of nine methods to estimate ear-canal stimulus levels. J. Acoust. Soc. Am. 2014, 136, 1768–1787. [Google Scholar] [CrossRef] [PubMed]
- Charaziak, K.K.; Shera, C.A. Compensating for ear-canal acoustics when measuring otoacoustic emissions. J. Acoust. Soc. Am. 2017, 141, 515–531. [Google Scholar] [CrossRef]
- Maxon, A.B.; White, K.R.; Vohr, B.R.; Behrens, T.R. Using transient evoked otoacoustic emissions for neonatal hearing screening. Br. J. Audiol. 1993, 27, 149–153. [Google Scholar] [CrossRef]
- Grandori, F.; Sergi, P.; Pastorino, G.; Uloziene, I.; Calori, G.; Ravazzani, P.; Tognola, G.; Parazzini, M. Original article: Comparison of two methods of TEOAE recording in newborn hearing screening: La comparación de dos métodos de registro de TEOAE en la identificatión de problemas auditivos en recién nacidos. Int. J. Audiol. 2002, 41, 267–270. [Google Scholar] [CrossRef] [PubMed]
- Hornsby, B.; Kelly, T.; Hall, J.W. Normative data for five FDA-approved distortion product OAE system. Hear. J. 1996, 49, 39–46. [Google Scholar]
- Maxon, A.B.; Vohr, B.R.; White, K.R. Newborn hearing screening: Comparison of a simplified otoacoustic emissions device (ILO1088) with the ILO88. Early Hum. Dev. 1996, 45, 171–178. [Google Scholar] [CrossRef]
- Parthasarathy, T.K.; Klostermann, B. Similarities and differences in distortion-product otoacoustic emissions among four FDA-approved devices. J. Am. Acad. Audiol. 2001, 12, 397–405. [Google Scholar] [PubMed]
- Ciorba, A.; Hatzopoulos, S.; Camurri, L.; Negossi, L.; Rossi, M.; Cosso, D.; Petruccelli, J.; Martini, A. Neonatal newborn hearing screening: Four years’ experience at Ferrara University Hospital (CHEAP Project): Part 1. Acta Otorhinolaryngol. Ital. 2007, 27, 10–16. [Google Scholar] [PubMed]
- Kemp, D.T. Otoacoustic emissions, their origin in cochlear function, and use. Br. Med Bull. 2002, 63, 223–241. [Google Scholar] [CrossRef] [PubMed]
- Shera, C.A. Mechanisms of mammalian otoacoustic emission and their implications for the clinical utility of otoacoustic emissions. Ear Hear. 2004, 25, 86–97. [Google Scholar] [CrossRef]
- Trzaskowski, B.; Pilka, E.; Jedrzejczak, W.W.; Skarzynski, H. Criteria for detection of transiently evoked otoacoustic emissions in schoolchildren. Int. J. Pediatr. Otorhinolaryngol. 2015, 79, 1455–1461. [Google Scholar] [CrossRef]
- Hatzopoulos, S.; Pelosi, G.; Petruccelli, J.; Rossi, M.; Vigi, V.; Chierici, R.; Martini, A. Efficient otoacoustic emission protocols employed in a hospital-based neonatal screening program. Acta Oto-Laryngol. 2001, 121, 269–273. [Google Scholar] [CrossRef] [PubMed]
- Jedrzejczak, W.W.; Kochanek, K.; Trzaskowski, B.; Pilka, E.; Skarzynski, P.H.; Skarzynski, H. Tone-burst and click-evoked otoacoustic emissions in subjects with hearing loss above 0.25, 0.5, and 1 kHz. Ear Hear. 2012, 33, 757–767. [Google Scholar] [CrossRef] [PubMed]
- Zimatore, G.; Cavagnaro, M.; Skarzynski, P.H.; Fetoni, A.R.; Hatzopoulos, S. Detection of Age-Related Hearing Losses (ARHL) via transient-evoked otoacoustic emissions. Clin. Interv. Aging 2020, 15, 927–935. [Google Scholar] [CrossRef] [PubMed]
- Zhang, Z.; Zhang, V.; Chan, S.; McPherson, B.; Hu, Y. Time–frequency analysis of click-evoked otoacoustic emissions by means of a minimum variance spectral estimation-based method. Hear. Res. 2008, 243, 18–27. [Google Scholar] [CrossRef] [PubMed]
- Cohen, J. A coefficient of agreement for nominal scales. Educ. Psychol. Meas. 1960, 20, 37–46. [Google Scholar] [CrossRef]
- Landis, J.R.; Koch, G.G. The measurement of observer agreement for categorical data. Biometrics 1977, 33, 159–174. [Google Scholar] [CrossRef] [PubMed]
- Field, A. Discovering Statistics Using IBM SPSS Statistics, 4th ed.; Sage: London, UK, 2014. [Google Scholar]
- Food and Drug Administration Indication for Use 510(k), Madsen Accuscreen Type 1077. Available online: https://www.accessdata.fda.gov/scripts/cdrh/cfdocs/cfPMN/pmn.cfm?ID=K132957 (accessed on 27 February 2014).
- Gorga, M.P.; Neely, S.T.; Bergman, B.M.; Beauchaine, K.L.; Kaminski, J.R.; Peters, J.; Schulte, L.; Jesteadt, W. A comparison of transient-evoked and distortion product otoacoustic emissions in normal-hearing and hearing-impaired subjects. J. Acoust. Soc. Am. 1993, 94, 2639–2648. [Google Scholar] [CrossRef]
- Moser, T.; Starr, A. Auditory neuropathy—neural and synaptic mechanisms. Nat. Rev. Neurol. 2016, 12, 135–149. [Google Scholar] [CrossRef] [PubMed]
- Hussain, D.M.; Gorga, M.P.; Neely, S.T.; Keefe, D.H.; Peters, J. Transient evoked otoacoustic emissions in patients with normal hearing and in patients with hearing loss. Ear Hear. 1998, 19, 434–449. [Google Scholar] [CrossRef] [PubMed]


Publisher’s Note: MDPI stays neutral with regard to jurisdictional claims in published maps and institutional affiliations. |
© 2021 by the authors. Licensee MDPI, Basel, Switzerland. This article is an open access article distributed under the terms and conditions of the Creative Commons Attribution (CC BY) license (http://creativecommons.org/licenses/by/4.0/).