Communication

Comparison of Hysteresis Based PWM Schemes ΔΣ-PWM and Direct Torque Control

by
Kevin Klarmann
†,‡,
Malte Thielmann
*,†,‡ and
Walter Schumacher
Institut für Regelungstechnik, TU Braunschweig, 38106 Braunschweig, Germany
*
Author to whom correspondence should be addressed.
Current address: Institute of Control Engineering, Technische Universität Braunschweig, Hans-Sommer-Str. 66, 38106 Braunschweig, Germany.
These authors contributed equally to this work.
Appl. Sci. 2021, 11(5), 2293; https://doi.org/10.3390/app11052293
Submission received: 3 February 2021 / Revised: 1 March 2021 / Accepted: 2 March 2021 / Published: 5 March 2021

Abstract

:
This paper presents the differences and similarities of Δ Σ -PWM as a hysteresis-based PWM scheme with direct torque control (DTC) using simulation models. The variable switching frequency caused by the hysteresis element is examined with regard to its instantaneous values. The comparison is based on an equal maximum switching frequency as a design criterion. With this first assumption, the variation of the instantaneous switching frequency is higher when using DTC because of the temporary prioritization of one inverter leg. Besides the lower variation, Δ Σ -PWM shows a higher average switching frequency. Because the switching frequency is related to the torque ripple, the usage of Δ Σ -PWM results in a smaller torque ripple. Due to the dependence of torque ripple on switching frequency, a second comparison is carried out based on the same average switching frequency. In this comparison the Δ Σ -PWM shows higher torque ripple than DTC.

1. Introduction

Electric drive systems are used in automotive industry more often. Because of climate change and the increasing global awareness of reducing greenhouse gas emission the demand on zero emission drive systems rises as well [1,2]. However, widespread requirements has to be considered in automotive industry. Weight, performance and constructed size of the drive system are just a few of the numerous requirements for automotive applications. Furthermore, the electric consumption including the efficiency of the electric drive is an important design criterion for manufacturers [1,3,4]. Several papers compare different control or modulation schemes with respect to efficiency [4]. Some of them use hysteresis elements, others fixed frequency modulation schemes. In this paper, a simulative comparison of the novel, Δ Σ signal processing based, Δ Σ pulse width modulation ( Δ Σ -PWM) with direct torque control (DTC) is performed.
Δ Σ signal processing has become increasingly important in recent years. It is characterized by a high small-signal bandwidth [5]. The high frequent binary bit streams, which are the basis of Δ Σ signal processing, cannot be transferred directly to power electronics [6]. To ensure a widespread application of Δ Σ signal processing in electrical drive systems, a decimation is required, to reduce the sampling rate. In [7,8], the highly dynamic coupling of bit streams to the power electronics was demonstrated by the application of a three-phase hysteresis modulator. While the average switching frequencies of the modulator in [8] are asymmetrical with respect to the three phases, equal switching frequencies for all phases were achieved in [6] by adapting the vector sequence of the space vector modulation. This helps to keep the equal distribution of switching power losses among the phases.
In contrast to other pulse width modulation (PWM) methods, such as classical carrier-based techniques or the space vector modulation, Δ Σ -PWM has a variable switching frequency [9,10]. In this paper, the differences and similarities of the novel Δ Σ -PWM with an established PWM method are presented. The comparison is made using an example from the field of electric drives. In order to analyze the differences and similarities in detail, the comparison is limited to one method. Since the switching behavior has a great influence on the control quality of the method, a fair comparison can only be taken to other variable frequency modulation schemes [11].
DTC is one of the most famous control schemes working with a variable switching frequency [12]. Although DTC was developed in 1986, it is still frequently used in various applications [13,14,15,16,17,18]. Due to its history and familiarity with electrical drive systems, DTC was chosen to be compared with Δ Σ -PWM. In addition to the variable switching frequency, there are other similarities between DTC and Δ Σ -PWM, which make a comparison of the two methods reasonable. In this context, the hysteresis controller as the base component of both methods is the first thing to mention. While DTC controls the flux and torque with two independent hysteresis elements, Δ Σ -PWM consists of a two-dimensional hysteresis element [6,12]. This element is fed with the two components of the integrated voltage error vector [6]. Since the flux is calculated by integrating the voltage, thus Δ Σ -PWM features a flux controller as well. Furthermore, due to the proportionality between q-current and torque, torque control can be achieved by embedding Δ Σ -PWM in a field-oriented current control loop. Thus, equivalent control structures can be set up with both methods. Furthermore, both methods are characterized by a low voltage reserve, since both use almost the entire inverter hexagon [6,12].
This paper aims to analyze the main differences and similarities between the basic algorithms of those hysteresis based PWM schemes. Since the practical applicability of the methods was already shown in [6,9,19,20,21] for Δ Σ -PWM and in [12,22,23,24] for DTC this paper summarizes the main results of a simulative comparison. The simulation presented, compares the control quality by current and torque ripple and distribution of switching frequency over phases and time. Consequently, the switching frequency is analyzed with respect to its instantaneous values, variation and mean value. All simulations shown were performed with MATLAB/Simulink®.

2. Model of a PMSM

For the simulative comparison of the PWM schemes, a permanent magnetic synchronous machine (PMSM) is connected as a load to an ideal inverter. This ideal inverter is simply modeled as a multiplication of the PWM output signals with the DC link voltage [25,26]. The following chapter describes the basic equations of a PMSM and the coordinate transformations involved.

2.1. Coordinate Transformations

Based on the space vector theory, the Clarke- and Park-transformation link the different coordinate systems. The Clark-transformation, shown in (1) and (2), converts a quantity, e.g., the phase current vector i ̲ s = i s 1 , i s 2 , i s 3 T , from the 120° coordinate system into the α / β coordinate system [27,28]
i s α = i s 1 1 2 ( i s 2 + i s 3 ) = 3 2 i s 1 ,
i s β = 3 2 ( i s 2 i s 3 ) .
Then, the Park-transformation transfers the values into the rotor oriented d / q coordinate system [27]
i s d = i s α · c o s ( ε e l ) + i s β · s i n ( ε e l )
i s q = i s β · c o s ( ε e l ) + i s α · s i n ( ε e l ) .
Here ε e l designates the rotor angle.

2.2. Equations of a PMSM

With the stator resistance R s , the stator voltage vector u ̲ s is given by [27,28]
u ̲ s = R s · i ̲ s + d Ψ ̲ d t .
The electromagnetic flux vector Ψ ̲ can be expressed by [27]
d Ψ ̲ d t = L s d i ̲ s d t + d d t ( Φ F · e j · ε e l ) .
The stator inductance is named L s and both expressions are valid for various types of three phase machines. In the following, (5) and (6) are adopted for a PMSM [27]. Substituting (6) for (5) and applying both coordinate transformations leads to the following result [27]
u s d = R s · i s d + L d d i s d d t ω e l · L q · i s q
u s q = R s · i s q + L q d i s q d t + ω e l · L d · i s d + ω e l · Φ F .
Besides, the flux components can be derived from (7) and (8) [29,30]
Ψ q = i s q · L q
Ψ d = i s d · L d + Φ F .
The electric angular velocity ω e l is linked to the mechanical angular velocity ω m e c h by the pole pair number p and is given by [28]
ω e l = p · ω m e c h .
The dynamic of the mechanical part of the PMSM is described by [27,28]
T e l T L = J d ω m e c h d t
ω m e c h = d ε m e c h d t .
Both parts are connected by the electric torque
T e l = 2 3 · p · Φ F · i s q + ( L d L q ) · i s d · i s q .
This set of equations, i.e., (7), (8), (12)–(14) is referred to as the machine model.

3. Hysteresis Based Pulse Width Modulation Schemes

This chapter introduces the Δ Σ -PWM as well as the DTC scheme. When using a classical modulation scheme, like a carrier-based PWM or the space vector modulation, a fixed switching frequency is applied [25,26]. In contrast, hysteresis based schemes introduce new switching events only if the control error crosses predefined boundaries. This leads to a non-uniform switching frequency [11].

3.1. Δ Σ -PWM

Δ Σ signal processing operates internally on bitstreams with a datarate of 10 MBit/s. This reduces the wiring effort between calculation units on chip, respectively, in an FPGA.
Since modern inverters can handle input signals at switching frequencies between4 and 40 kHz [6], a decimation has to be implemented. For this purpose, the authors of [6] introduce a two-dimensional hysteresis element, which derives the switching decisions from the accumulated voltage time error vector. As shown in Figure 1, the two components of this vector ( Int 1 , Int 2 ) are calculated by two integrators. The input to each integrator is the difference of two high frequent bit streams [9]. The advantages and disadvantages of several schemes in bit stream signal processing are compared in, e.g., [31]. As a result, the bipolar interpretation is shown to be suitable to apply linear algebra on a high frequent bit stream. In this approach, the values of the high frequent bit stream are mapped to “1” and “−1”, followed by an optional bipolar arithmetic operation. Afterwards, a Δ Σ -modulator generates a bit stream from the multi bit signal [31].
Furthermore, all input signals of Δ Σ -PWM are converted to high frequent bit streams by using Δ Σ -modulators [19]. Those transformation blocks can be found in Figure 1, which shows the inner control loop of Δ Σ -PWM. Unless otherwise stated, second order Δ Σ -modulators, as in [6,32] and [33], are utilized. Those modulators are known to push the quantization noise to higher frequencies [6].
However, the control loop presented in Figure 1 combines several calculation tasks within a single step operation. Additionally to the error calculation, a coordinate transformation is applied. The voltage error is calculated in a 120° two phase coordinate system according to the following equation [6]
u ̲ s = ( u s 1 u s 3 ) · e j · 0 + ( u s 2 u s 3 ) · e j · 120
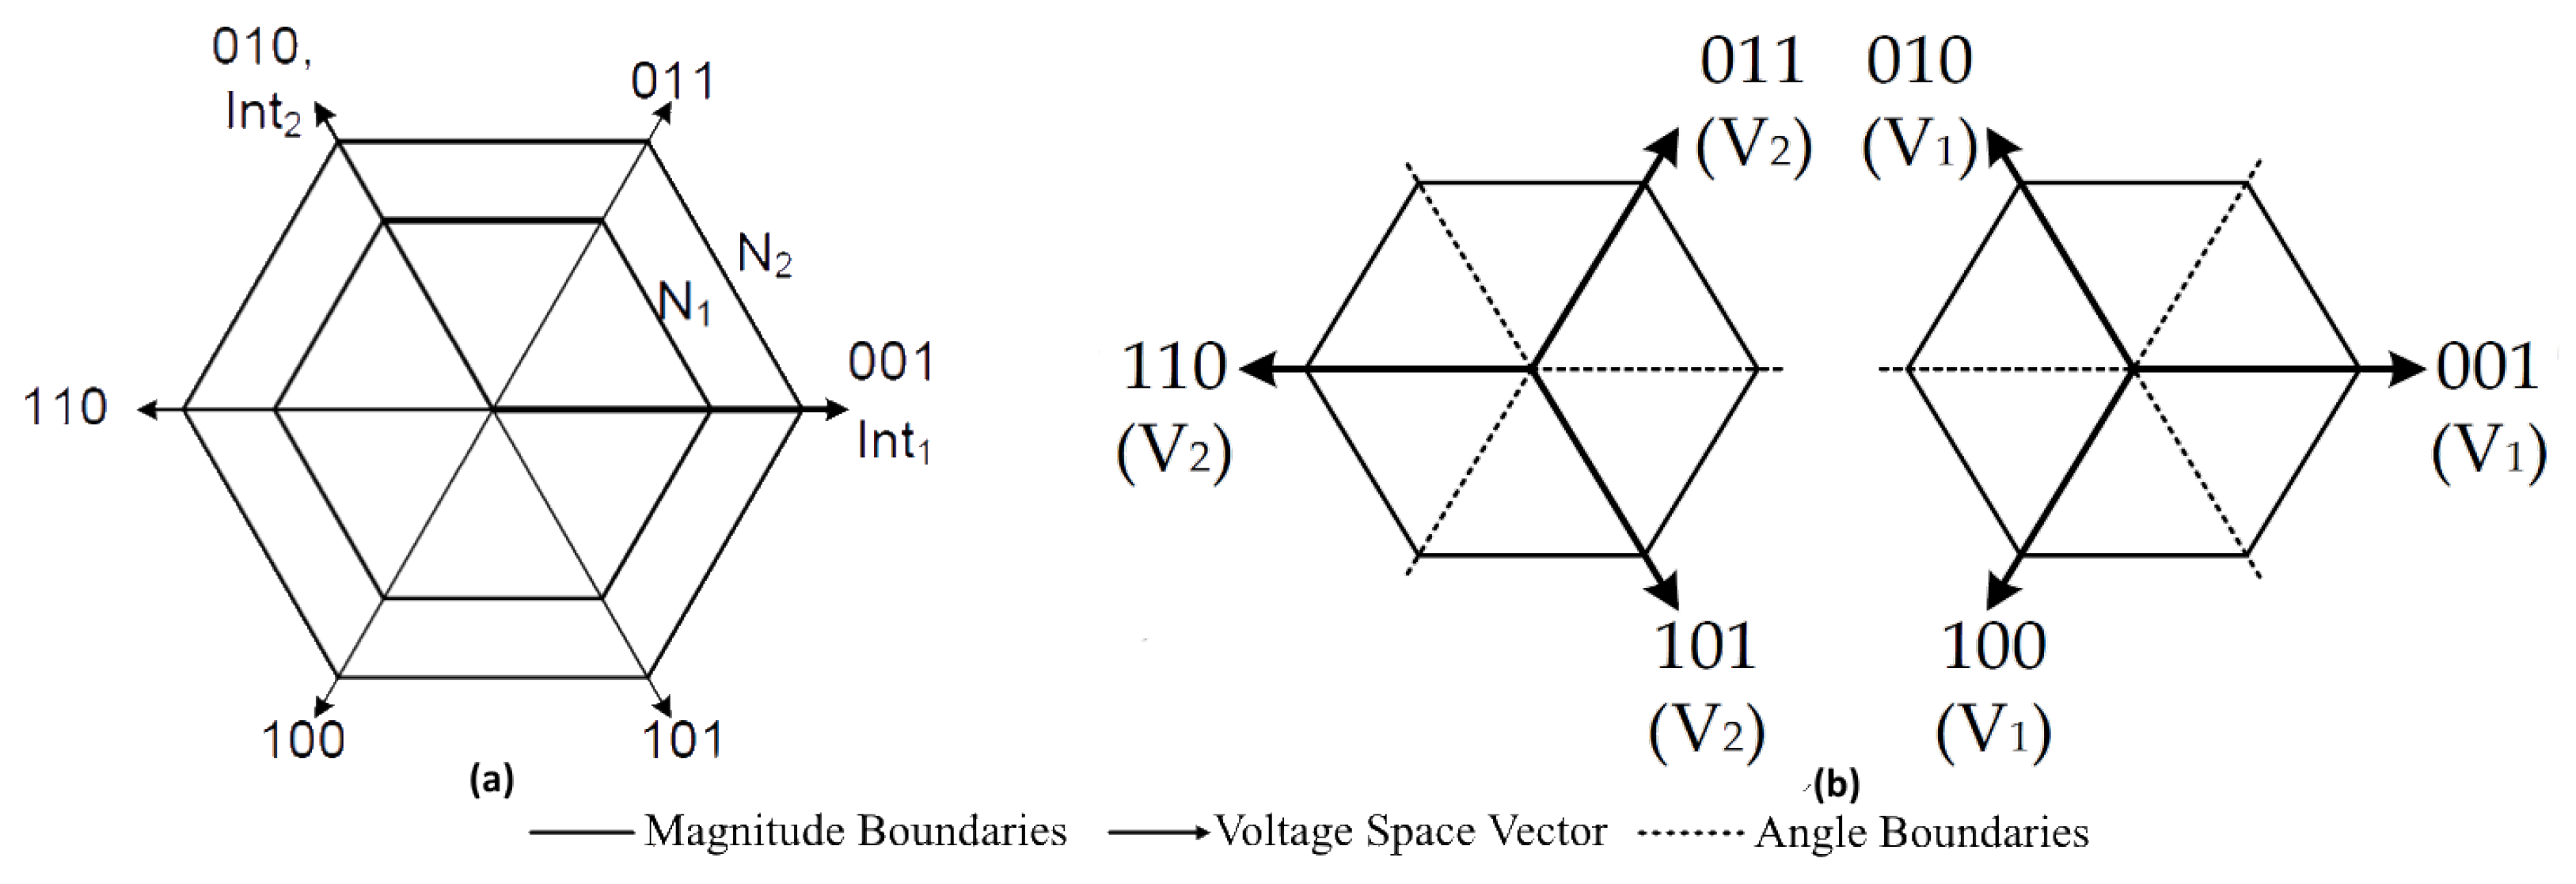
The integrator output, i.e., the voltage time error trajectory, moves with each bit stream clock in a plane spanned by the 120° coordinate system. The associated magnitude and angle boundaries are shown in Figure 2 [9].
The boundaries of Δ Σ -PWM can be divided into two groups. The constants N 1 and N 2 are magnitude boundaries. While N 1 mainly controls the average switching frequency of Δ Σ -PWM, N 2 defines the functionality in the case of overmodulation [9]. Figure 2b explains the angle boundaries which are used in Δ Σ -PWM. The angle boundaries are activated depending on the applied vector. As long as the error trajectory stays within active boundaries, the switching state is kept. Only when the error trajectory crosses an angle or magnitude boundary, the voltage space vector is changed [10]. The new vector is selected according to the sequence [6]
( 000 ) V 1 V 2 ( 111 ) V 2 V 1 ( 000 ) .
This sequence of voltage space vectors is well known from the concept of space vector modulation [26]. At the beginning of the sequence, i.e., the voltage vector (000) is applied to the inverter, the voltage time error trajectory is usually close to the origin. As (000) results in zero voltage at the inverter output, the trajectory is driven only by the reference bit stream [19]. Consequently, the error trajectory moves apart from the origin and the boundary N 1 is exceeded in one of the three sectors connected to the vectors of type V 1 (001, 010, 100), see Figure 2b. Then the respective vector is switched on and the error trajectory is directed to the origin. If the trajectory leaves the sector associated with the active V 1 vector, the adjacent V 2 vector (011, 101, 110) is the modulator output [10]. Thus, the angle boundaries switch to those in Figure 2b. If the associated sector is left, the zero vector (111) is applied and the second half cycle starts with interchanged roles of V 1 and V 2 . For a more detailed discussion of Δ Σ -PWM see [9].
Δ Σ -PWM can be embedded in additional control loops. The complete control structure utilized in this paper is shown in Figure 3. The voltage control loop is cascaded with a current controller in field coordinates [20]. Due to the high frequent bit stream, it is necessary to utilize digital controllers, see [21]. An outer speed control loop is realized in Figure 3. The reasons for choosing PI-controllers in all cascades are discussed in [20].

3.2. Direct Torque Control

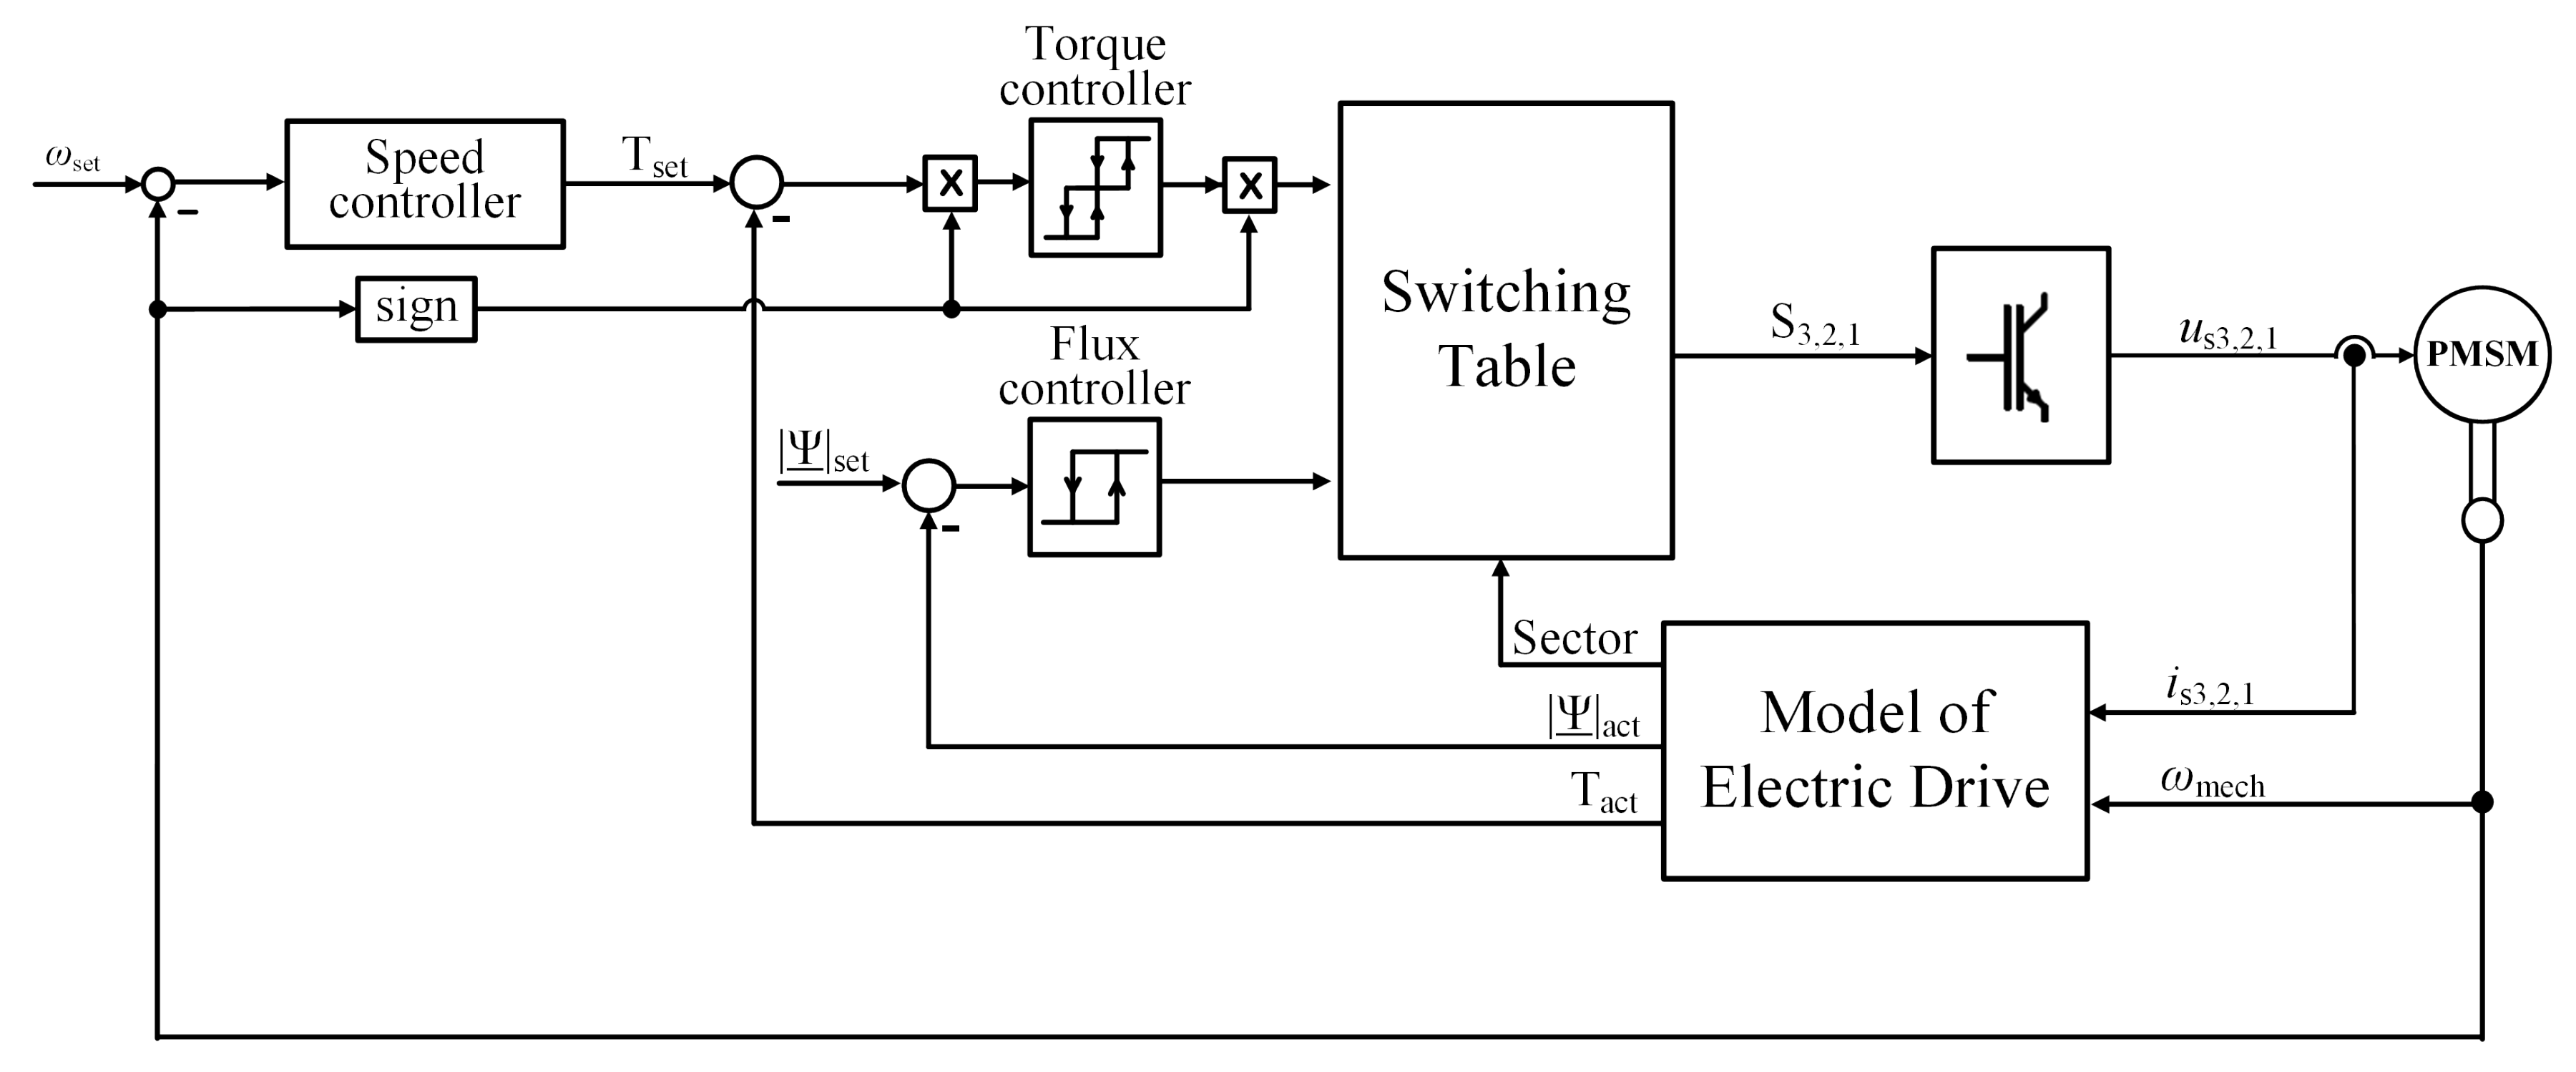
The basic idea of DTC is to focus on the stator flux linkage [11]. This can be realized by the control structure presented in Figure 4. First of all, a two-step as well as a three-step controller generate the voltage vector. A switching table [12] is considered. Secondly, a machine model calculates all state variables of the PMSM. This includes the torque and the magnitude as well as the sector of the stator flux space vector [12,29].
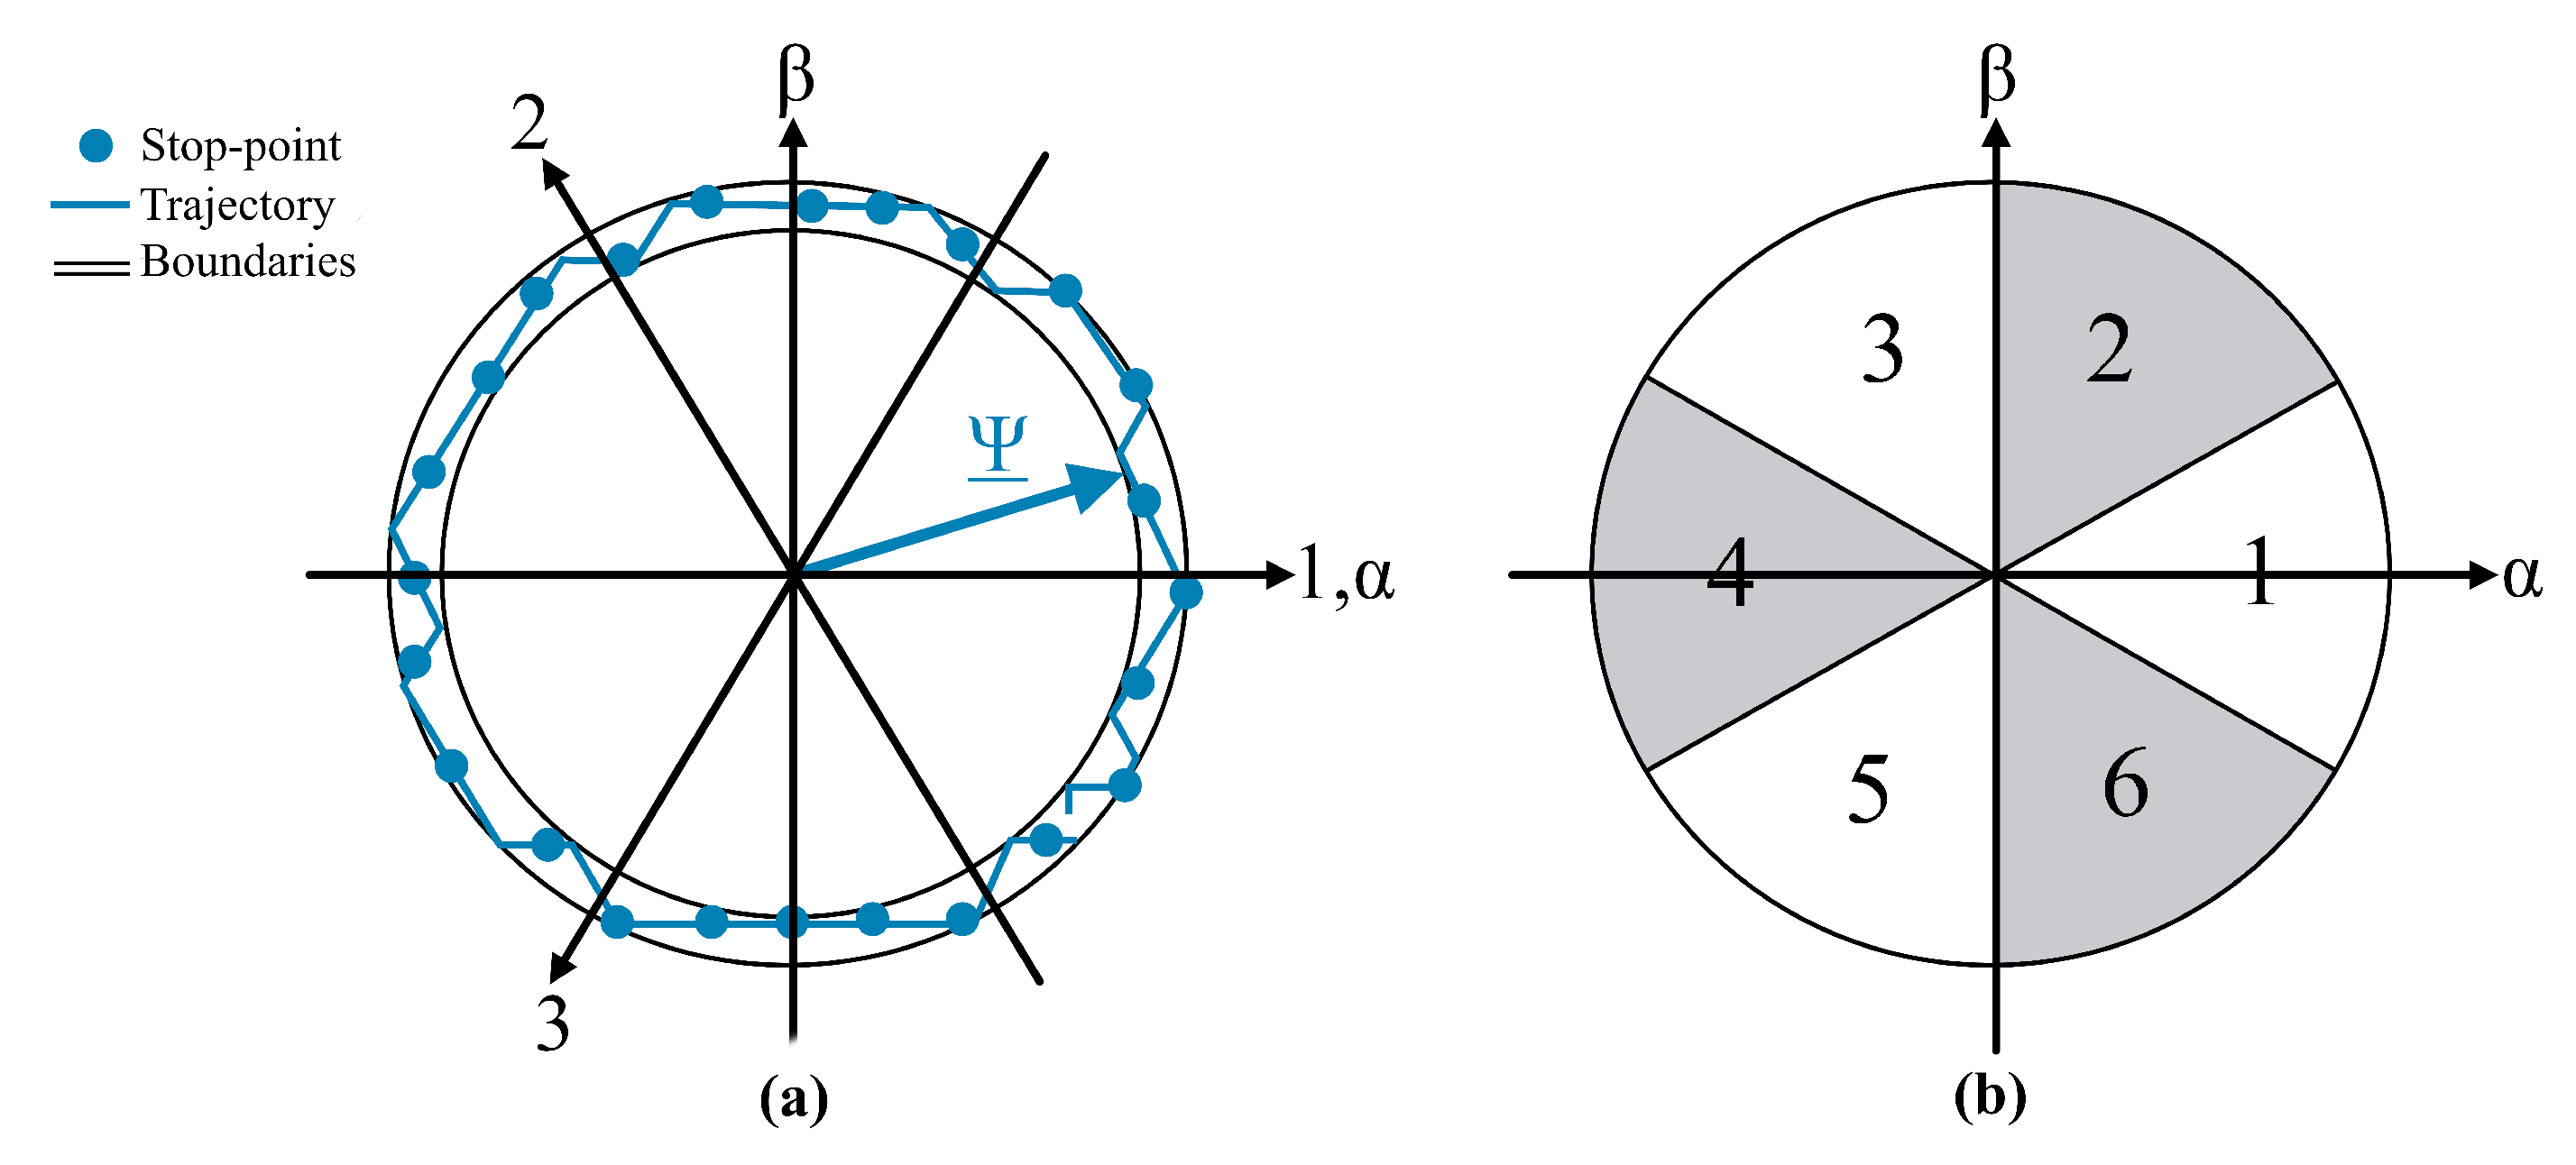
Figure 5a shows the reference trajectory of DTC. It is described by the motion of the stator flux space vector [29]. The two-step controller keeps the magnitude of the stator flux within a defined tolerance band. Each time the trajectory reaches the lower boundary the control changes its switching state [12]. The new applied switching state increases the magnitude of the stator flux until the upper boundary is reached [34]. Additionally, the effect of voltage space vectors depends on the actual position of the stator flux space vector. The coordinate system of the flux vector is divided into six different sectors [30]. The definition of those sectors is shown in Figure 5b and described in [29].
In [35], it is explained that the torque can be expressed depending on the angle between rotor and stator flux linkage. Hence, the DTC regulates the torque by accelerating or decelerating the stator flux space vector. In this context, three different discrete output values are possible [29]. The first is expressed by “1” which results in an acceleration. Thus, the angle towards the rotor flux space vector as well as the generated torque will increase. Secondly, an output of “−1” effects an acceleration of the stator flux space vector against the direction of rotation. This reduces the torque. When the output of the controller is “0”, the space vector of the stator caused flux components is stopped immediately [12]. Hence the angle towards the rotor caused flux components decreases and the torque reduces. Due to the choice of the hysteresis parameters the control only uses the states “1” and “0” under normal conditions [29].
The information of both controllers and the sector of the flux space vector is passed to a switching table [12]. This element defines the switching state of the inverter. Table 1 shows the complete switching table which is derived in [12].
Because DTC already implements a torque control within the inner cascade, only an outer speed control has to be realized [29]. For comparability, to Δ Σ -PWM a PI controller is implemented. Figure 4 shows the holistic DTC model. Due to the asymmetrical structure of the torque controller, the information of the direction of rotation is needed [30].

3.3. Design of Control Parameters

Both control methods contain non-linear hysteresis based elements. Since there are no analytical methods for designing parameters in the literature, an empirical approach is utilized [29]. Due to the variable switching frequency of Δ Σ -PWM and DTC, a maximum switching frequency of 40 kHz is considered [6]. For keeping a reserve to this boundary, the parameters are tuned to realize a maximum switching frequency of 30 kHz at the nominal point of the PMSM. As it is shown in Table 2, this point is defined as 800 rpm and 1.4 Nm. To adjust the inner control loop of Δ Σ -PWM according to these criteria, N 1 and N 2 must be specified. For the design of DTC one parameter for the flux and two parameters for the torque controller have to be set. The parameters for the outer cascades of Δ Σ -PWM and DTC are also designed by an empirical approach. All parameters of the studied PMSM are summarized in Table 2 and the control parameters are given in Table 3.

4. Simulation Results

This chapter compares the simulation results of both PWM schemes with a focus on the stationary behavior. Thus, only parameters of the inner control loop influence the simulation results. A comparison of the voltage and stator flux trajectories is made. The variation of the switching frequency as a function of electric angle is discussed. All presented figures in this chapter refer to the nominal operating point of the PMSM. With some exceptions, the results shown can be transferred to other operating points.

4.1. Stationary Behavior of Both PWM Schemes

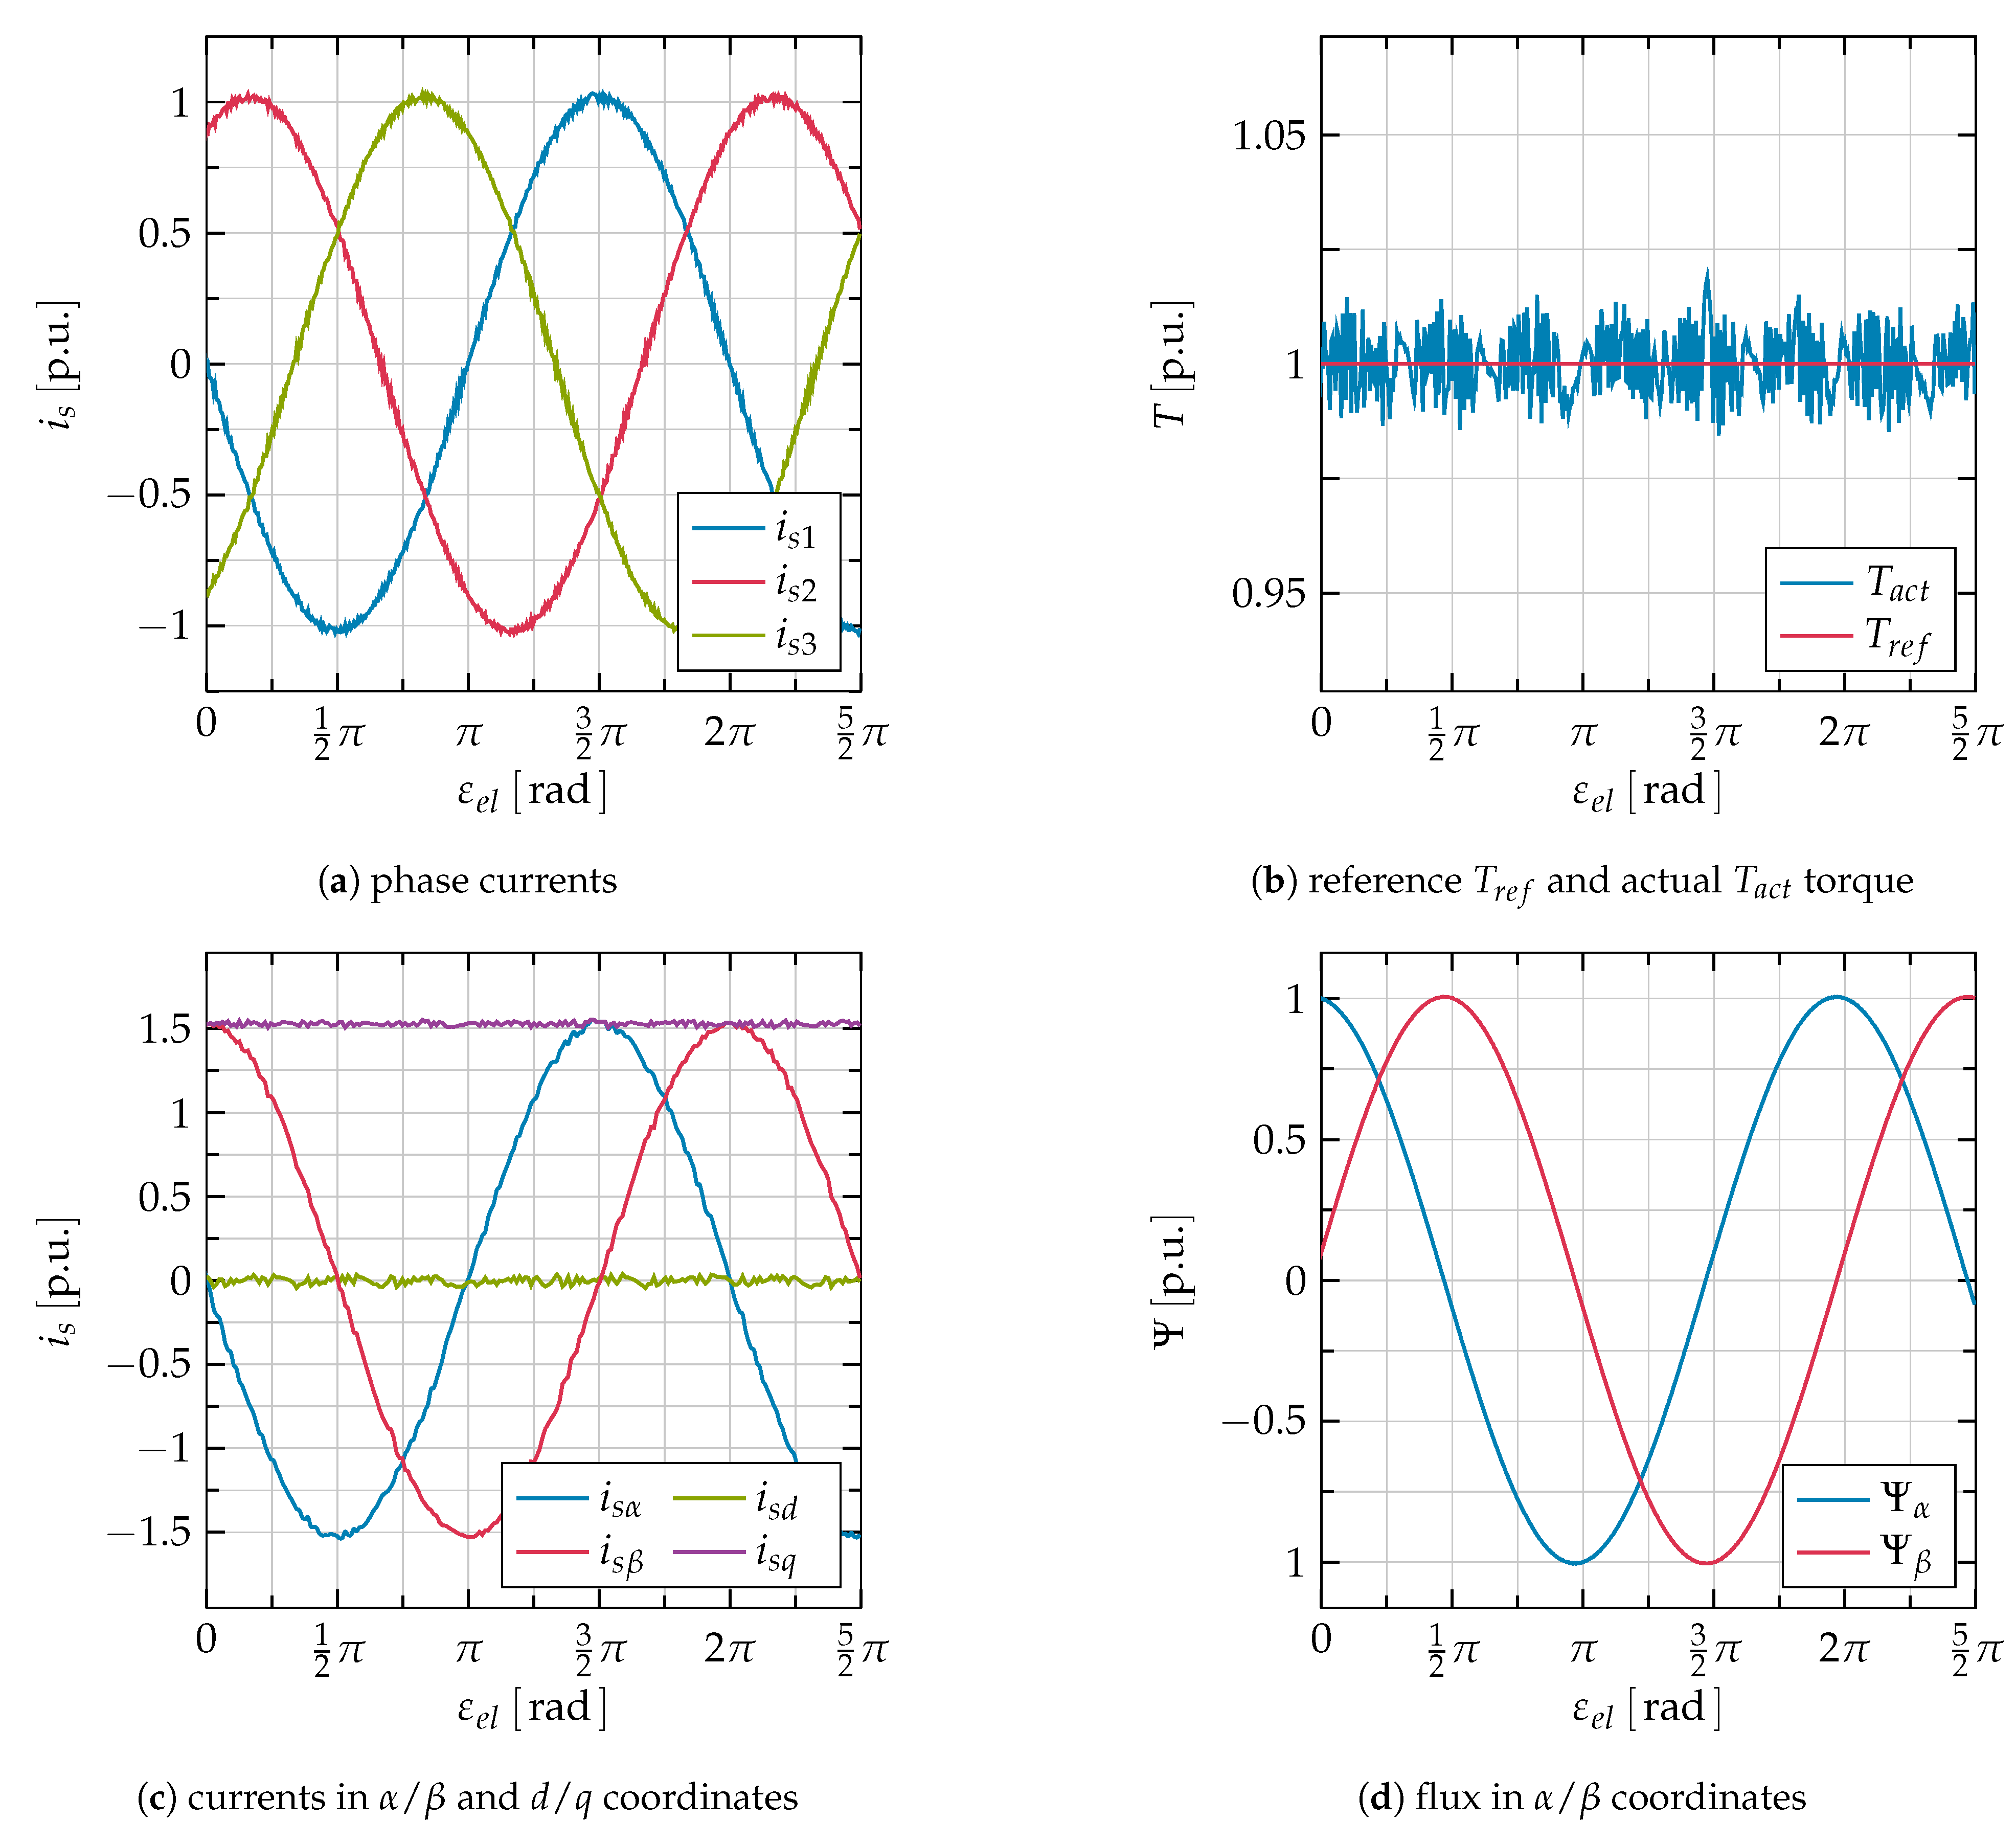
Figure 6 shows the stationary operation of the studied PMSM when using Δ Σ -PWM. Figure 6a presents the phase current, whereas Figure 6c shows the transformed currents in α / β as well as d / q coordinates. The behavior of the field-orientated control approach can be noted. The nominal operating point is reached with a q current of 1.5 · i 0 and a d current of 0 A. All shown quantities have a certain oscillation around the reference point.
Figure 6b compares the differences between the reference and actual values of the torque. Given a stationary operation point, the requested value is achieved. Nevertheless, the torque is subject to some small superimposed quantization noise in a range of ± 1.79 %. By increasing N 1 , the hysteresis width becomes larger. The number of switching events decreases and the magnitude of torque oscillation increases. Because of the high frequent bit stream, no equation can be derived which forecasts the absolute torque ripple.
The flux components in α / β coordinates are presented in Figure 6d. This diagram shows a phase shift of the stator flux space vector with respect to the d axis. According to (9) and (10), the field-orientated current i s q causes a q component in flux space vector of 9.77 % to the nominal flux. Due to the approach of field-orientated control, which is specified by the cascades of Δ Σ -PWM, a phase shift of 5.58 occurs. The undesired q component influences the magnitude of the flux space vector. The current controller in field coordinates uses d current for controlling flux space vector only. Thus, the effect of i s q on the flux space vector is not measured and does not result in a phase shift in the waveforms from Figure 6d.
The results from the DTC simulation are presented in Figure 7, which is structured as Figure 6.
In contrast to Δ Σ -PWM, all physical quantities shown are distorted by a higher proportion of harmonics. The torque, for example, shows an absolute ripple of ± 2.0 % related to the nominal load. Thus, the torque is always within the defined tolerance. Furthermore, i s d is permanently negative, resulting in a phase shift of 3.8 of the current with respect to the d axis. The reason for the negative d current is based on the field forming property of i s q . According to (9) and (10), the magnitude of the flux space vector is increased by 0.4 %. The magnitude with this offset is now closer to the upper boundary of the flux controller ( Δ Ψ + = 0.5 % of nominal flux) than to the lower boundary. To compensate for this unwanted amplification, the control enforces a negative current in the d axis.
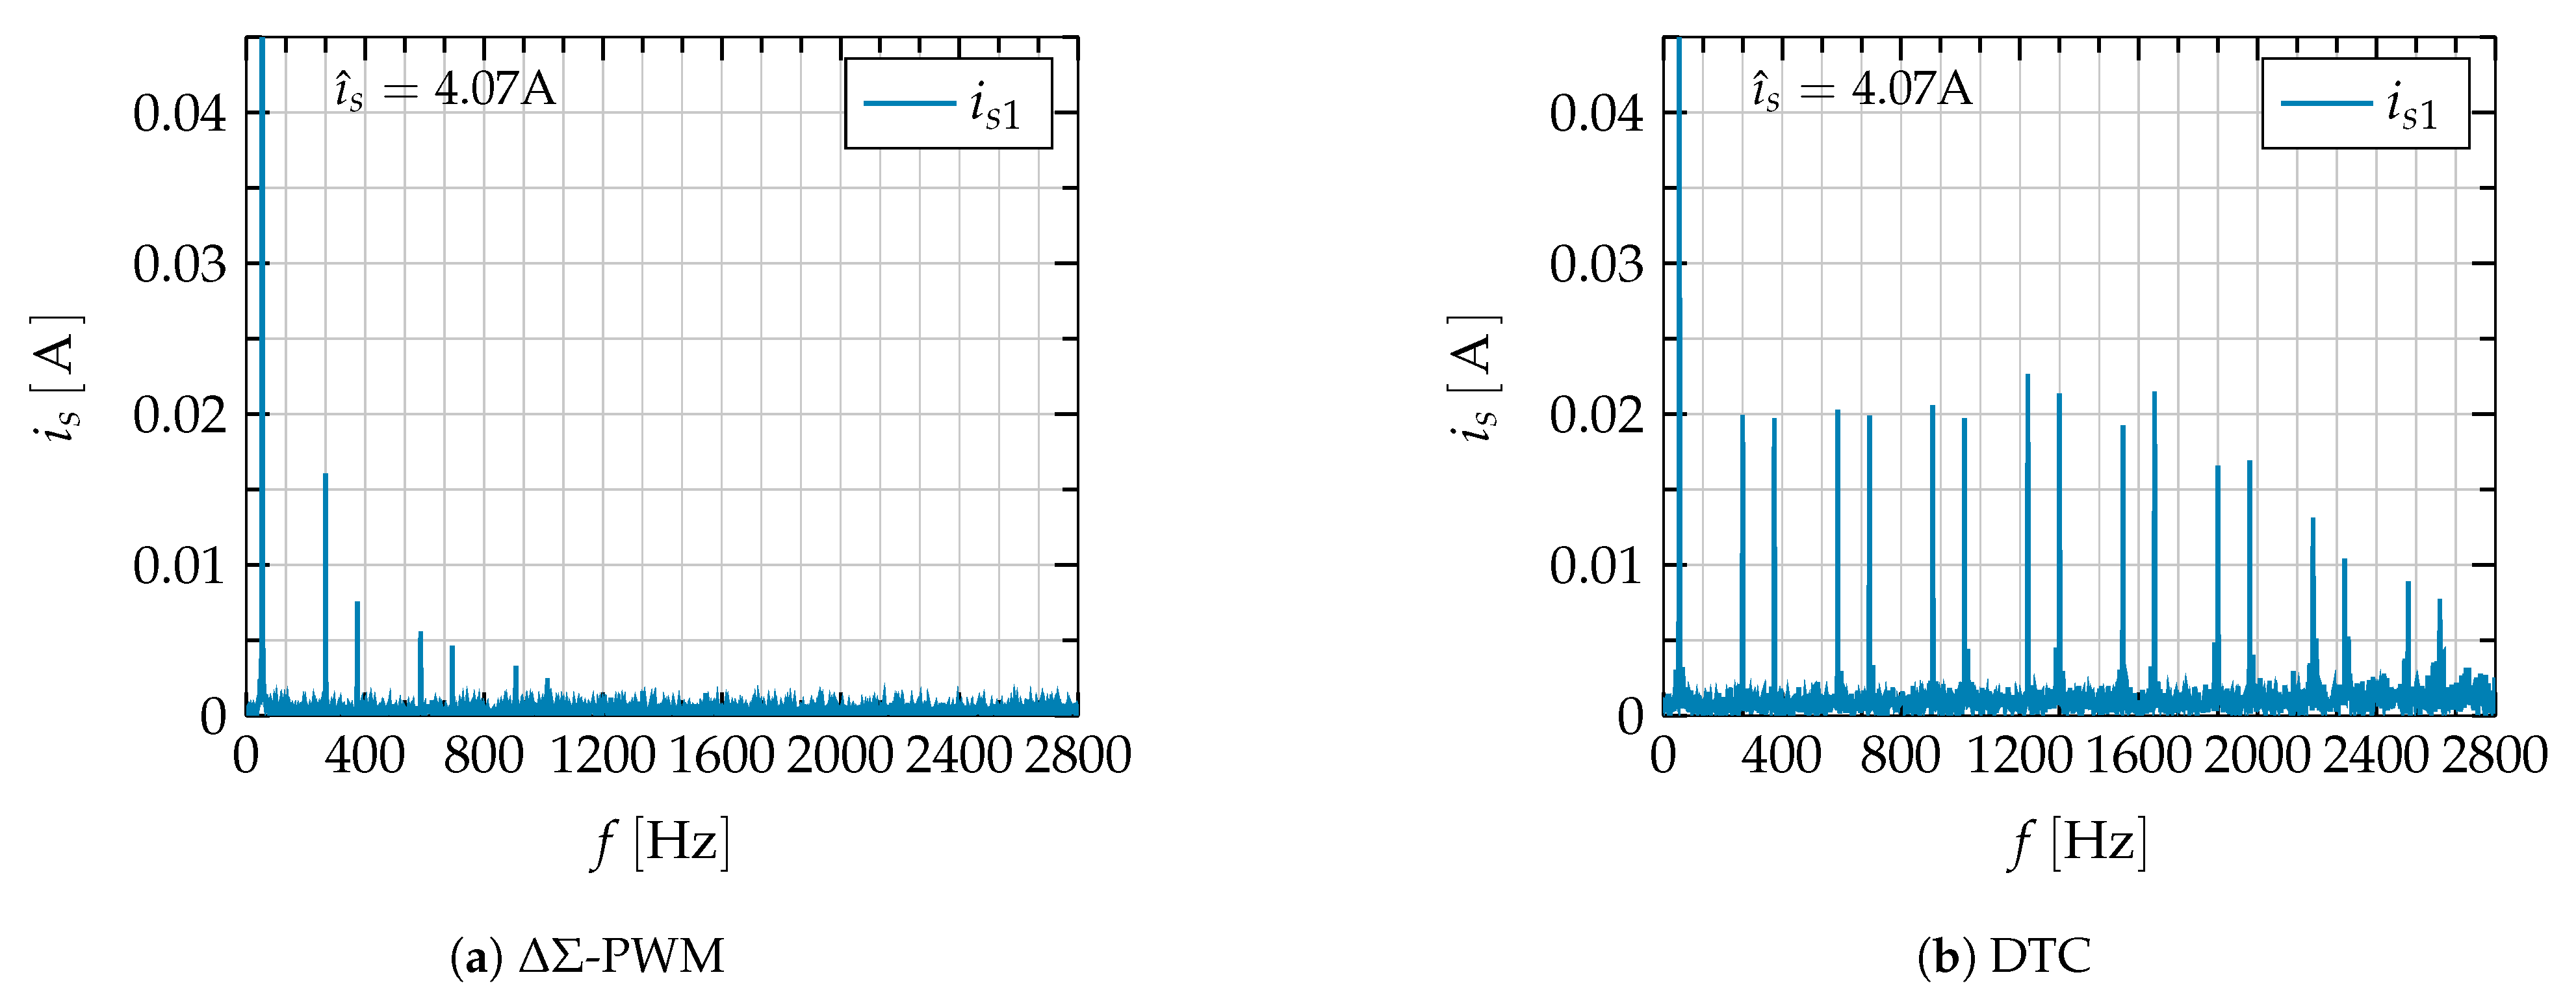
Figure 8 compares the frequency spectra of the phase currents. The electrical fundamental frequency is 55.33 Hz. Due to the disconnected neutral conductor only therms which are not divisible by three may occur in the phase current. Furthermore, even orders may not occur in the frequency range, because of the use of a symmetrical star point circuit.
When comparing both PWM methods, it can be seen that the Δ Σ -PWM has a low proportion of harmonics. The THD is 0.51% whereas with the DTC a THD of 1.79% can be determined. Furthermore, the harmonics in Figure 8a are of the orders 5, 11, 13, 17 and 19. All other barely rise above noise level. Whereas DTC shows significant harmonics up to frequencies of 2800 Hz as can be determined from Figure 8b.

4.2. Comparison of Voltage Space Vector Trajectory

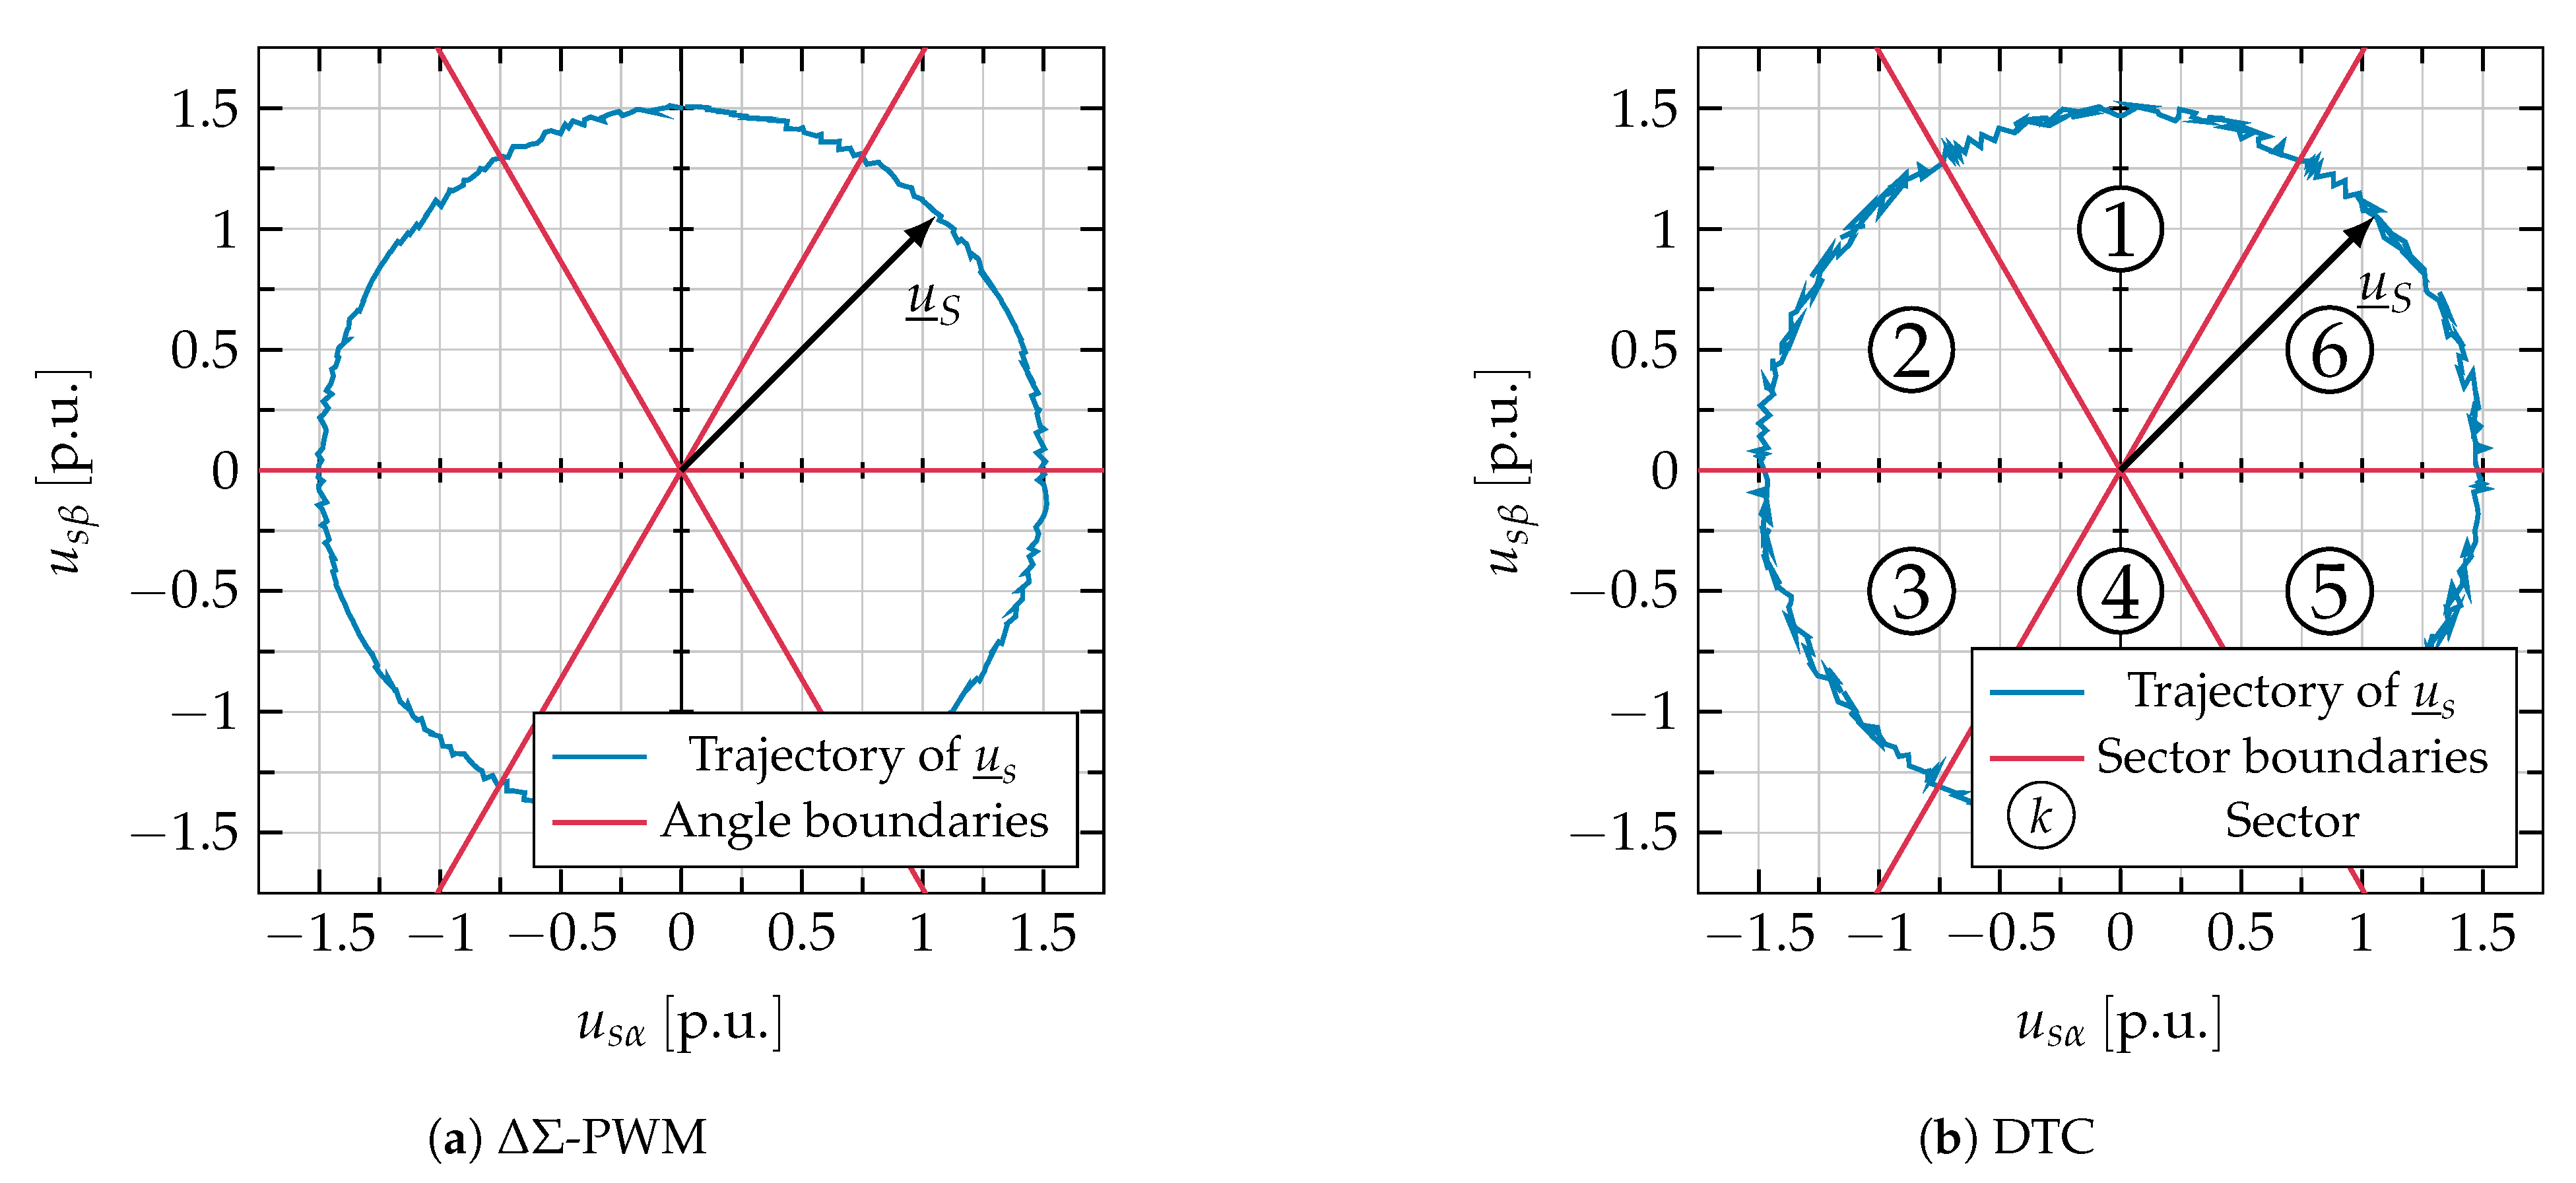
The voltage space vector trajectories for both PWM schemes are compared in Figure 9. Since Δ Σ -PWM as well as DTC utilize PWM signals to construct the voltage space vector, filters have to be applied to measure the actual voltage value. Consequently, the trajectories in Figure 9 are related to several switching states.
For Δ Σ -PWM, the magnitude of the voltage space vector moves within a range of 0.983 · u 0 and 1.013 · u 0 . In contrast, the magnitude of the voltage space vector trajectory ranges from 0.969 · u 0 to 1.014 · u 0 at DTC.
The rotation of the DTC sector boundaries can be explained by the fact that the stator flux is obtained from stator voltage by integration. Consequently, they coincide with angle boundaries of Δ Σ -PWM.
Figure 9a presents the trajectory of the voltage space vector from Δ Σ -PWM. The reference space vector is synthesized by space vector modulation. Each cycle consists of voltage vectors from at least two different groups (see (16)). The trajectory moves clockwise as well as counterclockwise. This behavior can be explained by the impact of the switching states on the actual voltage space vector. If, for example, a zero vector is applied the trajectory moves towards the origin. This behavior results from a continuous reduction of the magnitude of the voltage space vector, taking the first-order lag characteristic of a PMSM into account. In contrast, if the control applies an active voltage vector, the trajectory moves towards this voltage space vector. Whereas the movement of the trajectory against the direction of rotation is visible in Figure 9b, it cannot be observed in Figure 9a. This behavior is based on the differences in the switching frequency. As it will be seen later, the average switching frequency is lower with DTC, than with Δ Σ -PWM. For this reason, the voltage space vector is held longer in the first case. Because the applied filter has the same group delay counterclockwise movements of DTC trajectory can be seen.
Further explanations refer to the second sector. In Figure 9b, the control uses exclusively the two active voltage vectors (010) and (110). If the switching state (110) is set, the trajectory moves in the direction of rotation. (010) causes a motion against the direction of rotation. The speed refers to the distance between the applied d voltage vector and the actual position of the voltage space vector. The closer this distance is, the slower is the speed of the voltage space vector trajectory.

4.3. Comparison of Flux Space Vector Trajectory

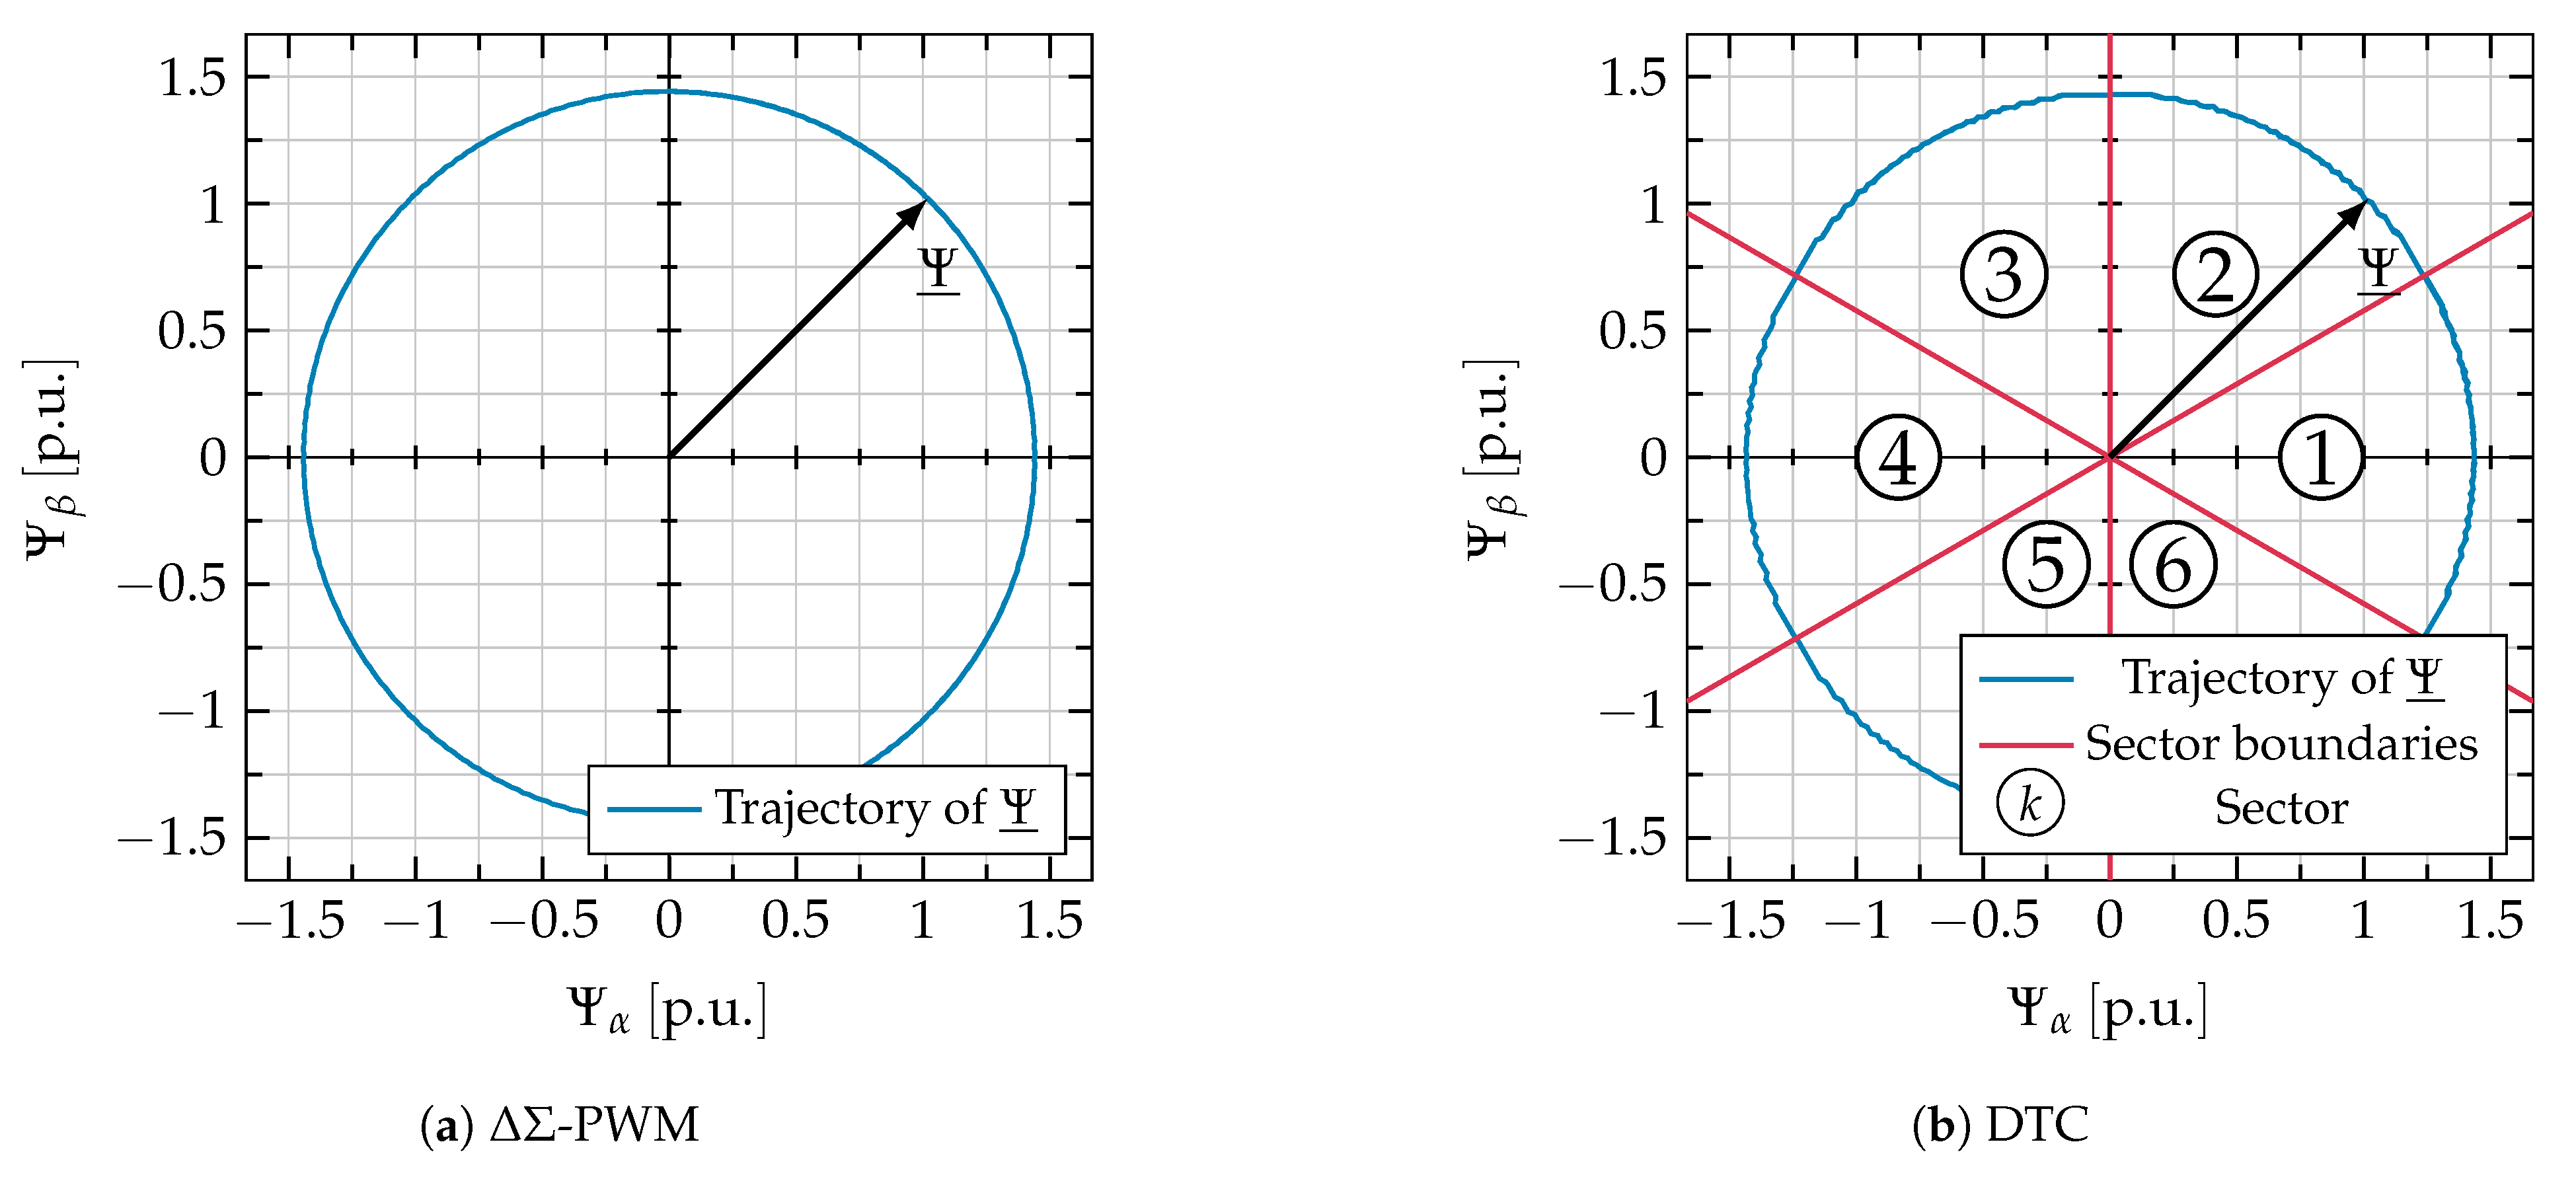
DTC utilizes the flux space vector as trajectory. Figure 10 compares those trajectories. It is worth to mention that both figures do not present zero vectors and the procedure of stopping the flux space vector for decreasing torque is not visible within Figure 10b.
First of all, both PWM schemes ensure that the flux space vector stays on an almost circular curve. The trajectory of DTC shows a flux ripple with a magnitude that corresponds to the limits of the flux controller ( Δ | Ψ ̲ | / Ψ 0 = ± 0.5 % ). In contrast, the tolerance range of Δ Σ -PWM is Δ | Ψ ̲ | / Ψ 0 = 0.37 % and corresponds to the required limits as well. The hysteresis parameter as well as the ripple of physical quantities are inversely proportional to the switching frequency. Because the average switching frequency of Δ Σ -PWM is higher, more switching events per electric rotation are triggered. The tolerance in the flux space vector is smaller for Δ Σ -PWM.
Secondly, DTC switching events near the sector boundaries are rare. For explanation, the following descriptions refer to the second sector. The control uses the switching states (010) and (000) to increase the magnitude of the flux space vector. In contrast, the states (110) and (111) are used for reduction. The impact of voltage vector depends on the actual position of the flux space vector. The perpendicular component is responsible for accelerating and the parallel component for changing the magnitude of Ψ ̲ . However, the coupling between both components is dependent on the actual position of the flux space vector. Within one sector, the magnitude increasing state will change to the accelerating state. Thus, the change of the magnitude of the flux space vector by this switching state will be faster at the beginning of the sector. In contrast, the behavior of the accelerating switching state reverses. Just before reaching a sector boundary a certain switching state must be held for a relatively long time. After that, the control has to hold the increasing state for a long time. According to Table 1, the voltage vectors exchange their roles at sector boundaries. Thus, the control uses one switching state and the corresponding zero vector for a long time only.
During the transition from sector two to sector three, the voltage vectors (110) and (111) are used most frequently. Hence the control changes the switching state of the first inverter half bridge only. In the meantime, the maximum negative voltage is applied in the first phase of the PMSM. Consequently, the minimum of u s 1 will be reached. When entering sector three, the duty cycle of switching state (100) increases according to Table 1.

4.4. Comparison of Instantaneous Switching Frequencies

Hysteresis based PWM schemes are characterized by a variable switching frequency. The literature distinguishes between instantaneous and average switching frequency. According to [36], the instantaneous switching frequency f s w can be calculated by the time difference between a first ( t o n 1 ) and its following rising edge ( t o n 2 ), with
f s w = 1 t o n 2 t o n 1 .
Due to the hysteresis elements, the instantaneous switching frequency can vary during an electrical cycle. Thus, a maximum and minimum switching frequency of the inverter can be measured. Furthermore, [36] defines an average switching frequency f m for capturing those oscillations by
f m = N r i s Δ T .
In (18) the number of rising edges N r i s of one inverter half bridge are divided by a previously defined period Δ T . Within this paper, the time period Δ T is set to the duration of one electric rotation. Additionally, the average switching frequency of all inverter half bridges f m ¯ can be calculated by
f m ¯ = 1 3 · ( f m 1 + f m 2 + f m 3 ) .
Given (17), Figure 11 shows the instantaneous switching frequencies for Δ Σ -PWM and DTC as a function of the electric angle. Figure 11a,b presents the filtered phase voltages, where, in addition, also the angle boundaries of Δ Σ -PWM and the sector boundaries of DTC are marked.
Figure 11c shows the instantaneous switching frequency for Δ Σ -PWM. All three half bridges of the inverter operate with a switching frequency in a range between 18.8 kHz and 30.7 kHz at any angle of electric rotation. The instantaneous switching frequency reaches its minimum if the phase voltage reaches its maximum or minimum. During this moment, the control passes an angle boundary and the reference voltage space vector is aligned with a voltage vector of the inverter hexagon. Thus, the reference voltage space vector can only be synthesized by the corresponding switching state. This switching state is kept as long as possible without violating the switching sequence given in (16). As a result, the number of switching operations is minimized and the instantaneous switching frequency is reduced [6]. Δ Σ -PWM evenly uses all inverter half bridges at any angle of electric rotation.
Figure 11d presents the instantaneous switching frequency for DTC. In this case, huge oscillations ranging from 660 Hz to 30.5 kHz are observed. DTC seems to prioritize certain switching states periodically. The instantaneous switching frequency always has its maximum when the corresponding phase voltage reaches its minimum or maximum (see Figure 11b). At this moment, the voltage space vector crosses a sector boundary. During such a transition, the switching state which should decrease the magnitude of the flux space vector accelerates the flux space vector more than changing its magnitude (see Section 4.3). Hence the flux controller changes its state infrequently. To keep the torque constant, the active voltage vector must often be interrupted by a zero vector. To do so, only one inverter half bridge has to change its state. The switching frequency of this half bridge will increase whereas the switching frequency of both other half bridges remains low. The flux controller increases its activity towards the midpoint of the sector. Consequently, active voltage vectors are changed more often and all inverter half bridges operate with an approximately same instantaneous switching frequency.
The average switching frequency is 10.1 kHz for DTC and 25.6 kHz for Δ Σ -PWM. The flux ripple discussed in Section 4.1, Section 4.2 and Section 4.3 is directly related to the switching frequency. Since DTC switches less frequent than Δ Σ -PWM, the harmonics in physical values are higher.

4.5. Comparison of Torque Ripple

This chapter compares the relative torque ripple w ^ u of both PWM schemes, which is defined as the ratio of torque ripple and its average value T ¯ , i.e.,
w ^ u = T m a x T m i n 2 · T ¯
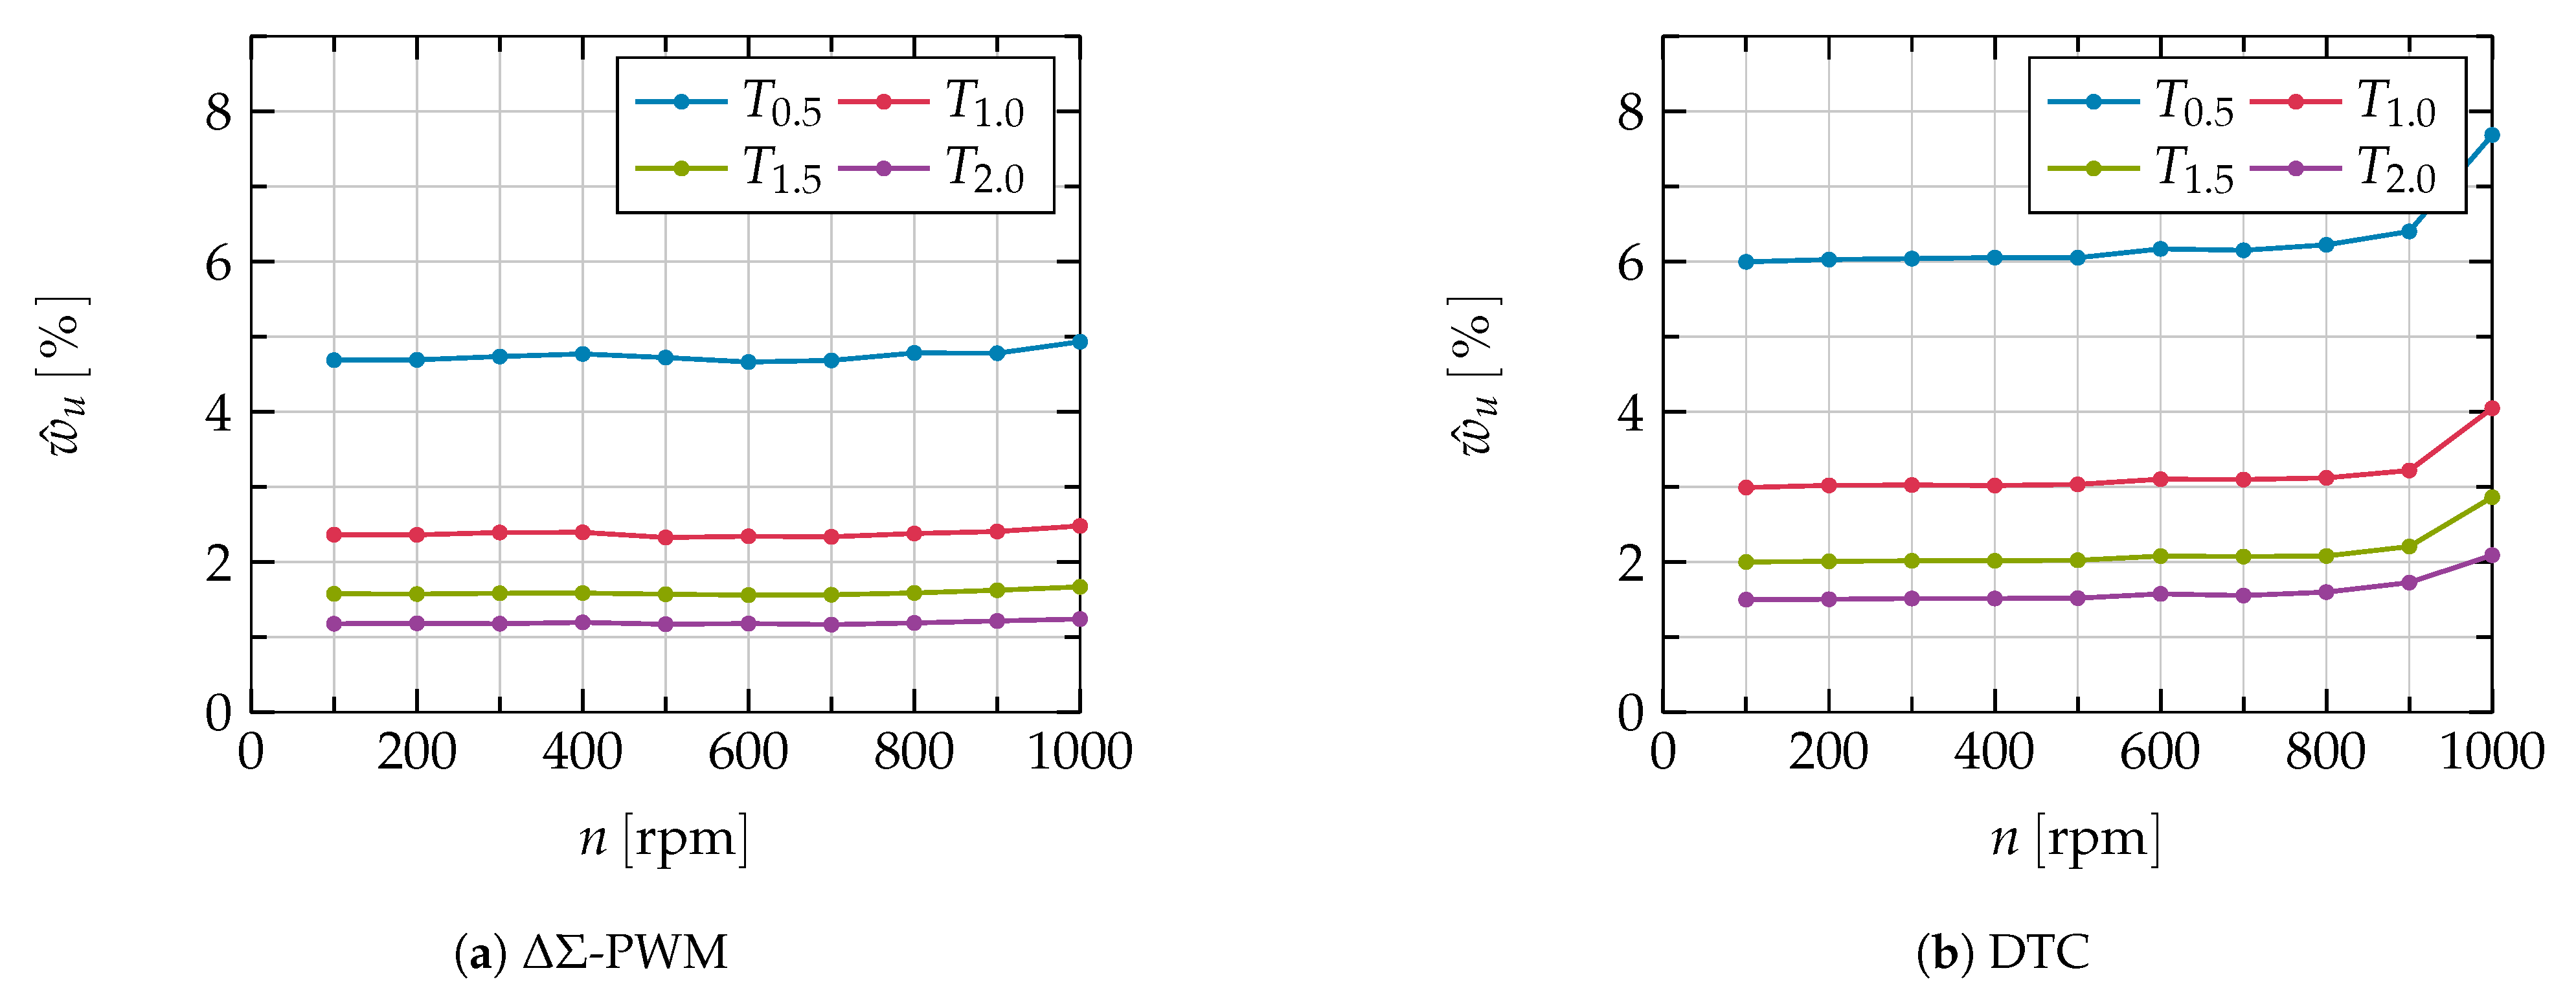
Figure 12 shows the relative torque ripple as a function of the whole operating range. To avoid a division by zero, the torque ripple is only shown for loads of 0.5, 1, 1.5 and 2 Nm. Moreover, standstill is omitted because only one half bridge is used at this operation.
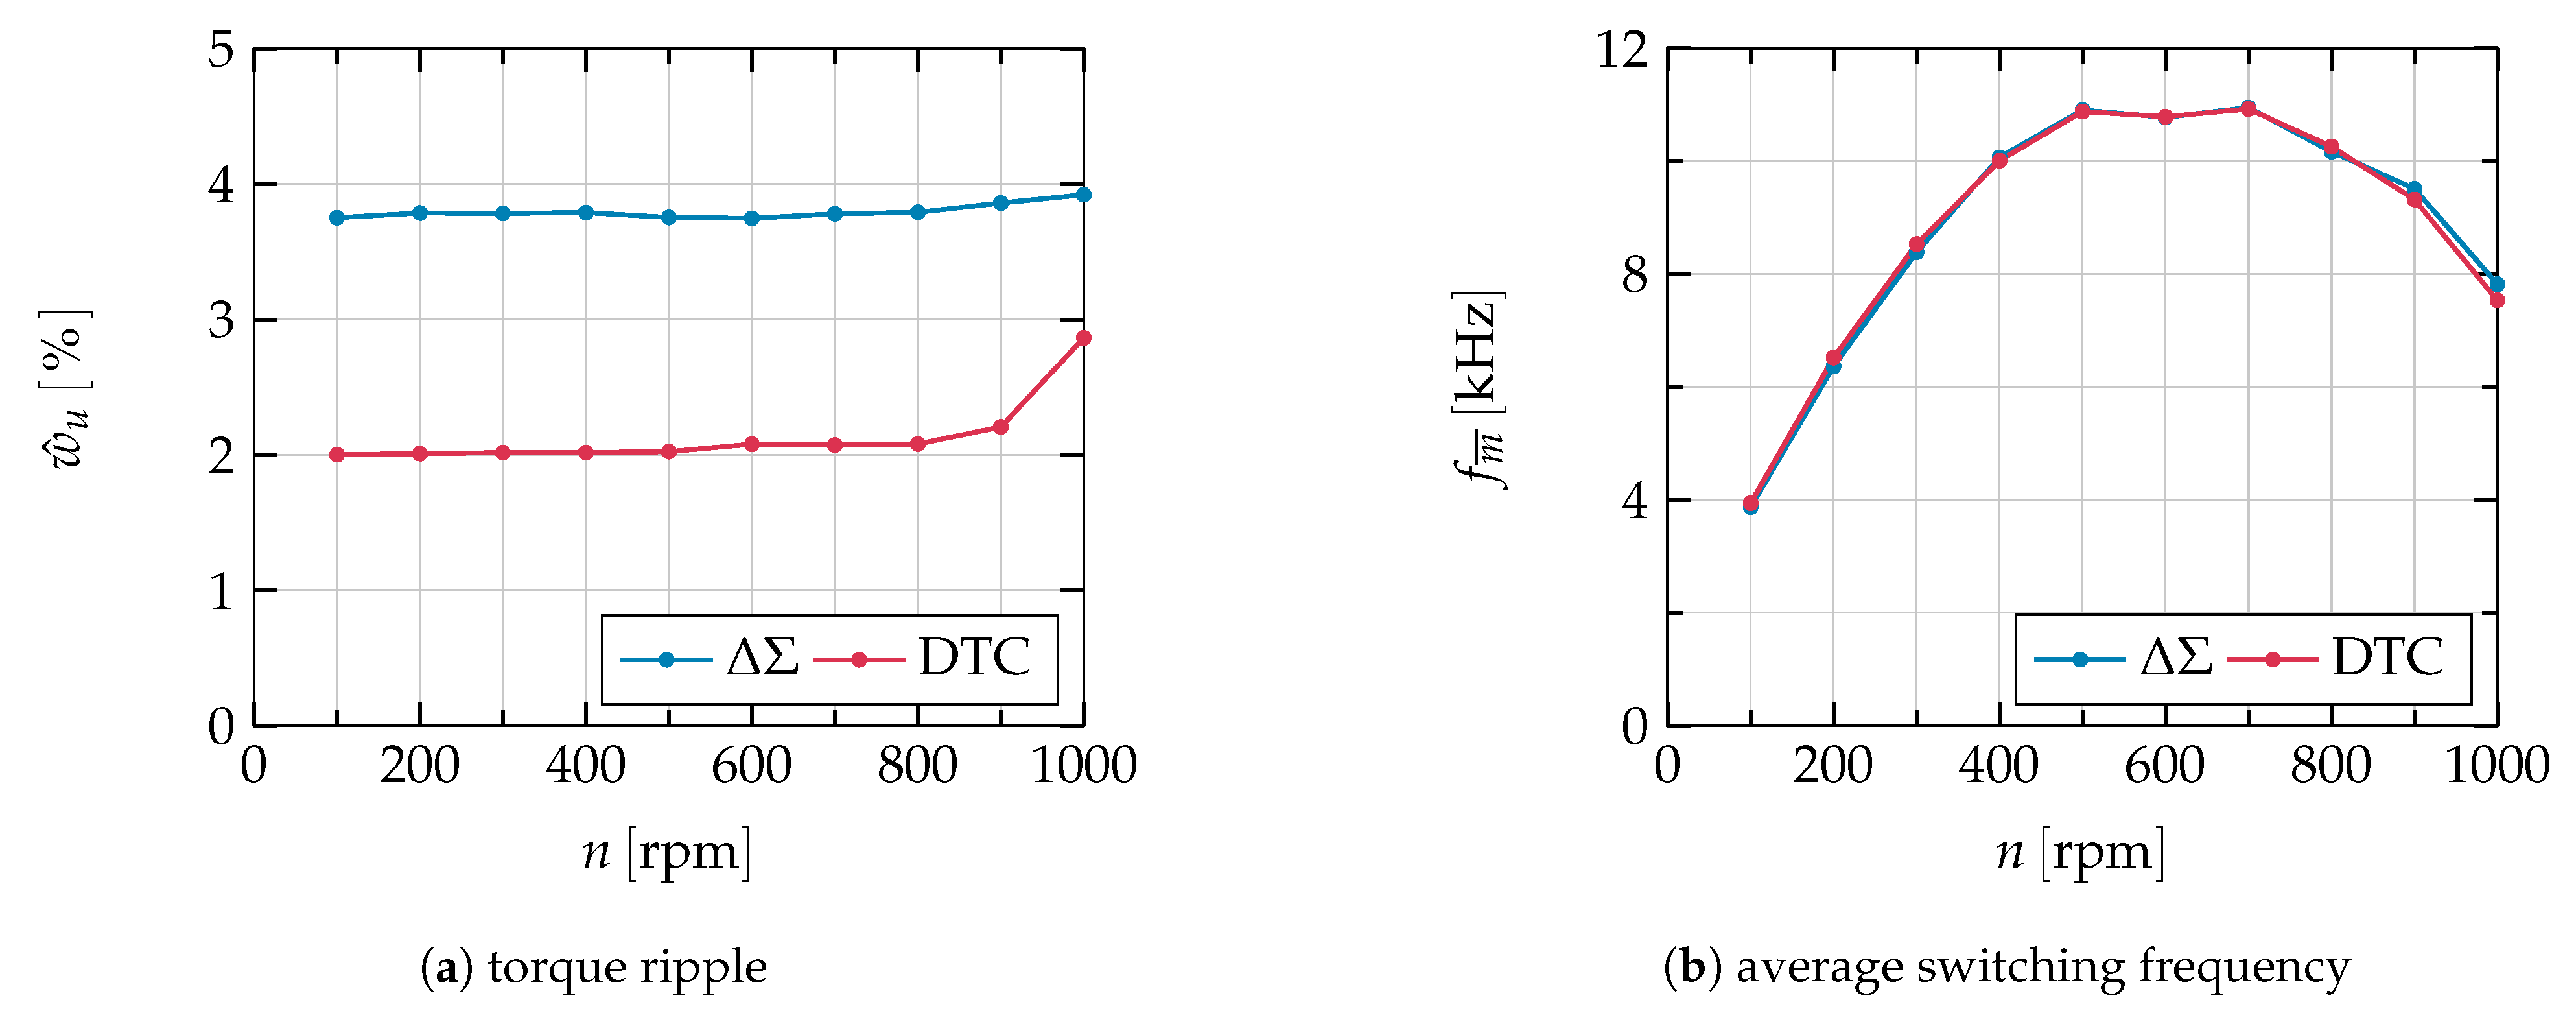
In Figure 12, the relative torque ripple rises with a decrease in the torque reference point, whereas the absolute ripple is approximately the same. Furthermore, the relative torque ripple is independent from speed. This behavior is the same for both PWM schemes. Considering (20), also the absolute torque ripple is more or less constant over the whole speed range. Due to a higher maximum switching frequency, the relative as well as the absolute torque ripple is smaller by using Δ Σ -PWM. Consequently, the different average switching frequencies influence the results. Figure 13 illustrates the difference in average switching frequency for both PWM schemes.
It is confirmed that the average switching frequency of both PWM schemes is mainly dependent on the speed and corresponds to the voltage magnitude. The average switching frequency increases almost linearly with the speed and with the voltage magnitude in the low speed range. Above 700 rpm, the frequency shows a further increase in case of Δ Σ -PWM, whereas it is reduced with DTC. However, the average switching frequency is always higher than with DTC. Due to the EMF, the magnitude of the reference space vector increases with the speed, when using the Δ Σ -PWM, N 1 is exceeded more often and consequently the switching frequency increases [37]. With PMSM, the flux moves synchronously with the rotor. As a result, at higher speeds the flux space vector is less frequently slowed down by a zero vector. This leads to the decrease of the switching frequency of the DTC.
To analyze the effects of these differences, the following comparison in torque ripple is based on modified boundary conditions. The hysteresis parameters of Δ Σ -PWM are adopted, so that the average switching frequency of both schemes matches.
The result is shown in Figure 14b and the corresponding torque ripple for both PWM schemes is illustrated in Figure 14a. The diagram is based on a load of 1.5 Nm and presents the relative torque ripple at various speeds. In contrast to Figure 12 it can be seen, that DTC exhibits a smaller torque ripple within the whole working area. Except for speeds higher than 800 rpm the torque ripple stays rather constant at 2%, whereas Δ Σ -PWM shows a torque ripple of 3.9%.

5. Conclusions

In this paper, the differences between Δ Σ -PWM and DTC were analyzed to benchmark both schemes. A simulation model was used to compare several quantities with a focus on the behavior of the switching frequency. Using an equal maximum switching frequency of 30 kHz for both schemes, the simulation results were discussed. The aim of this paper was in particular to show the differences in the instantaneous switching frequency over angular positions. Because of the fixed sequence, Δ Σ -PWM distributed the switching events more evenly among all inverter half bridges. DTC, in contrast, often used only one inverter leg causing the instantaneous switching frequency to be more widespread (see also Table 4). Whereas the Δ Σ -PWM had its minimum switching frequency near the angles of the maximum phase voltages, here the DTC switched more often.
All compared quantities from Section 4 are summarized in Table 4. For comparison, the ripples of torque, voltage and flux and the switching frequencies are listed. Due to the lower average switching frequency, all ripples with the DTC are higher. The additional simulations show that, DTC has a lower torque ripple than Δ Σ -PWM at the same average switching frequency. However, because of the lower variation of the instantaneous switching frequency, a higher average switching frequency can be achieved with the Δ Σ -PWM on the same inverter than with the DTC. Since the ripple is inverse to the switching frequency, a lower ripple is possible with the Δ Σ -PWM than with the DTC with the same hardware. According to this a higher control performance can be achieved with the Δ Σ -PWM than with the DTC.

Author Contributions

Conceptualization, M.T.; Investigation, K.K.; Supervision, W.S. All authors have read and agreed to the published version of the manuscript.

Funding

This publication was funded by the Publication Fund of the Technische Universität Braunschweig.

Institutional Review Board Statement

Not applicable.

Informed Consent Statement

Not applicable.

Data Availability Statement

The data presented in this study are available on request from the corresponding author.

Conflicts of Interest

The authors declare no conflict of interest.

Abbreviations

The following abbreviations are used in this manuscript:
PMSMpermanent magnetic synchronous machine
PWMpuls width modulation
DTCDirect Torque Control
Δ Σ -PWM Δ Σ pulse width modulation

References

  1. Un-Noor, F.; Padmanaban, S.; Mihet-Popa, L.; Mollah, M.N.; Hossain, E. A Comprehensive Study of Key Electric Vehicle (EV) Components, Technologies, Challenges, Impacts, and Future Direction of Development. Energies 2017, 10, 1217. [Google Scholar] [CrossRef] [Green Version]
  2. IEA. Global EV Outlook 2020; IEA: Paris, France, 2020; Available online: https://www.iea.org/reports/global-ev-outlook-2020 (accessed on 20 January 2021).
  3. Mi, C.; Abul Masrur, M. Hybrid Electric Vehicles—Principles ans Applications with Practical Perspectives; Wiley & Sons: Hoboken, NJ, USA, 2018. [Google Scholar]
  4. Shao, L.; Karci, A.E.H.; Tavernini, D.; Sorniotti, A.; Cheng, M. Design Approaches and Control Strategies for Energy-Efficient Electric Machines for Electric Vehicles—A Review. IEEE Access 2020, 8, 116900–116913. [Google Scholar] [CrossRef]
  5. Homann, M.; Klein, A.; Schumacher, W. Direct Delta Sigma Signal Processing for Control of Power Electronics. In PCIM Europe 2016; International Exhibition and Conference for Power Electronics, Intelligent Motion, Renewable Energy Management; VDE: Nürnberg, Germany, 2016. [Google Scholar]
  6. Homann, M. Hochdynamische Strom- und Spannungsregelung von Permanenterrregten Synchronmaschinen auf Basis von Delta-Sigma Bitströmen. Ph.D. Thesis, Technische Universität Braunschweig, Braunschweig, Germany, 2016. [Google Scholar]
  7. Bradshaw, J.; Madawala, U.; Patel, N.; Vilathgamuwa, M. A Bit- Stream based Space Vector Modulator. In Proceedings of the International Power Electronics Conference (IPEC), Sapporo, Japan, 21–24 June 2010; pp. 855–861. [Google Scholar]
  8. Bradshaw, J.B. Bit-Stream Control of Doubly Fed Induction Generators. Ph.D. Thesis, University of Auckland, Auckland, New Zealand, 2012. [Google Scholar]
  9. Thielmann, M.; Klein, A.; Homann, M.; Schumacher, W. Analysis of instantaneous switching frequency of a hysteresis based PWM for control of power electronics. In PCIM Europe 2017; International Exhibition and Conference for Power Electronics, Intelligent Motion, Renewable Energy Management; VDE: Nürnberg, Germany, 2017. [Google Scholar]
  10. Klein, A.; Thielmann, M.; Homann, M.; Schumacher, W. Operation Modes of a High Bandwidth Three Phase Hysteresis Modulator based on Delta Sigma Bitstreams. In Proceedings of the 2017 19th European Conference on Power Electronics and Applications (EPE’17 ECCE Europe), Warsaw, Poland, 11–14 September 2017; pp. 1–10. [Google Scholar]
  11. Haun, A. Vergleich von Steuerverfahren für Spannungseinprägende Umrichter zur Speisung von Käfigläufermotoren. Ph.D. Thesis, Technische Universität Darmstadt, Darmstadt, Germany, 1992. [Google Scholar]
  12. Takahashi, I.; Noguchi, T. A New Quick-Response and High-Efficiency Control Strategy of an Induction Motor. IEEE Trans. Ind. Appl. 1986, 5, 820–827. [Google Scholar] [CrossRef]
  13. Ammar, A.; Kheldoun, A.; Metidji, B.; Talbi, B.; Ameid, T.; Azzog, Y. Comparative analysis of different control approaches of direct torque control induction motor drive. In Proceedings of the 2018 International Conference on Electrical Sciences and Technologies in Maghreb (CISTEM), Algiers, Algeria, 28–31 October 2018; pp. 831–835. [Google Scholar]
  14. Koratkar, P.J.; Sabnis, A. Comparative analysis of different control approaches of direct torque control induction motor drive. In Proceedings of the 2017 International Conference on Intelligent Computing, Instrumentation and Control Technologies (ICICICT), Kannur, India, 6–7 July 2017; pp. 831–835. [Google Scholar]
  15. Harikrishnan, R.; George, A.E. Direct Torque Control of PMSM using hysteresis modulation, PWM and DTC PWM based on PI Control for EV—A comparative analysis between the three strategies. In Proceedings of the 2019 2nd International Conference on Intelligent Computing, Instrumentation and Control Technologies (ICICICT), Kannur, India, 5–6 July 2019; pp. 566–571. [Google Scholar]
  16. Zhang, X.H.; Chen, P.F. Efficiency Optimization of Direct Torque Controlled Interior Permanent Magnet Synchronous Motor Considering Iron Losses. In Proceedings of the 2016 19th International Conference on Electrical Machines and Systems (ICEMS), Tokyo, Japan, 13–16 November 2016; pp. 1–5. [Google Scholar]
  17. Dankadai, N.K.; Mcdonald, S.P.; Elgendy, M.A.; Atkinson, D.J.; Ullah, S.; Atkinson, G. Direct Instantaneous Torque Control of Switched Reluctance Motor for Aerospace Applications. In Proceedings of the 2018 53rd International Universities Power Engineering Conference (UPEC), Glasgow, Scotland, 4–7 September 2018; pp. 1–6. [Google Scholar]
  18. Sung, S.; Lin, W.; Yu, C. Predictive Direct Torque Control ASIC with Speed Feedback Controller in Motor Drive. In Proceedings of the 2014 IEEE International Conference on Systems, Man, and Cybernetics (SMC), San Diego, CA, USA, 5–8 October 2014; pp. 2284–2288. [Google Scholar]
  19. Homann, M.; Schumacher, W. High Bandwidth Phase Voltage and Phase Current Control Loop of Permanent Magnet Synchronous Motor based on Delta Sigma Bitstreams. In Proceedings of the 18th European Conference on Power Electronics and Applications (EPE), Karlsruhe, Germany, 5–8 September 2008. [Google Scholar]
  20. Klein, A. Delta-Sigma Signalverarbeitung in der Regelungstechnik; Technische Universität Braunschweig: Braunschweig, Germany, 2019. [Google Scholar]
  21. Matthes, C.; Thielmann, M.; Klein, A. Ressourceneffiziente Regelungen im FPGA. ATP Mag. 2018, 60, 56–65. [Google Scholar] [CrossRef]
  22. Ammar, A.; Kheldoun, A.; Metidji, B.; Talbi, B.; Ameid, T.; Azzoug, Y. An Experimental Assessment of Direct Torque Control and Model Predictive Control Methods for Induction machine drive. In Proceedings of the 2018 International Conference on Electrical Sciences and Technologies in Maghreb (CISTEM), Algiers, Algeria, 28–31 October 2018; pp. 1–6. [Google Scholar]
  23. Wang, S.; Li, C.; Che, C.; Xu, D. Direct torque control for 2L-VSI PMSM using switching instant table. IEEE Trans. Ind. Electron. 2018, 65, 9410–9420. [Google Scholar] [CrossRef]
  24. Xia, C.; Wang, S.; Gu, X.; Yan, Y.; Shi, T. Direct torque control for VSI-PMSM using vector evaluation factor table. IEEE Trans. Ind. Electron. 2016, 63, 4571–4583. [Google Scholar] [CrossRef]
  25. Hans, F.; Oeltze, M.; Schumacher, W. A Modified ZOH Model for Representing the Small-Signal PWM Behavior in Digital DC-AC Converter Systems. In Proceedings of the IECON 2019-45th Annual Conference of the IEEE Industrial Electronics Society, Lisbon, Portugal, 14–17 October 2019; pp. 1514–1520. [Google Scholar]
  26. Monmasson, E. Power Electronic Converters. PWM Strategies and Current Control Techniques. Ph.D. Thesis, University of Auckland, Auckland, New Zealand, 2006. [Google Scholar]
  27. Leonhard, W. Control of Electrical Drives; Springer: Berlin/Heidelberg, Germany, 1996. [Google Scholar]
  28. Schröder, D. Elektrische Antriebe—Regelung von Antriebssystemen; Springer: Berlin/Heidelberg, Germany, 2015. [Google Scholar]
  29. Lehmann, O. Geberfreie Regelung perManentmagneterregter Synchronmaschinen im Elektrischen Antriebsstrang von Straßenfahrzeugen. Ph.D. Thesis, Universität Stuttgart, Stuttgart, Germany, 2017. [Google Scholar]
  30. Sadek, S.M. Direct Torque Control of Permanent Magnet Synchronous Motors; University of Kairo: Kairo, Egypt, 2016. [Google Scholar]
  31. Klein, A.; Schumacher, W. Algebraic Operation on Delta-Sigma bit streams. Math. Comput. Appl. 2018, 23, 49. [Google Scholar] [CrossRef] [Green Version]
  32. Zrilic, D.G. Circuits and Systems Based on Delta Modulation; Springer: Berlin/Heidelberg, Germany, 2005. [Google Scholar]
  33. Schreier, R.; Temes, G.C. Understanding Delta-Sigma Data Converters; IEEE Press: Piscataway, NJ, USA, 2005. [Google Scholar]
  34. Wang, L.; Gao, Y. A Novel Strategy of Direct Torque Control for PMSM drive Reducing Ripple in Torque and Flux. In Proceedings of the 2007 IEEE International Electric Machines & Drives Conference, Antalya, Turkey, 3–5 May 2007; Vo1ume 1, pp. 403–406. [Google Scholar]
  35. Jänecke, M.; Kremer, R.; Steuerwald, G. Direct self-control (DSC), a novel method of controlling asynchronous machines in traction applications. Elektrische Bahnen eb 1990, 88, 81–87. [Google Scholar]
  36. Knop, A. Entwicklung Eines Schnelltakenden Stromrichters für Netzimpedanzanalyse im Frequenzbereich bis 10 kHz; Christian-Albrechts-Universität zu Kiel: Kiel, Germany, 2013. [Google Scholar]
  37. Klein, A.; Thielmann, M.; Schumacher, W. Switching Frequency Control for a ΔΣ-PWM. In PCIM Europe 2018; International Exhibition and Conference for Power Electronics, Intelligent Motion, Renewable Energy and Energy Management; VDE: Nürnberg, Germany, 2018. [Google Scholar]
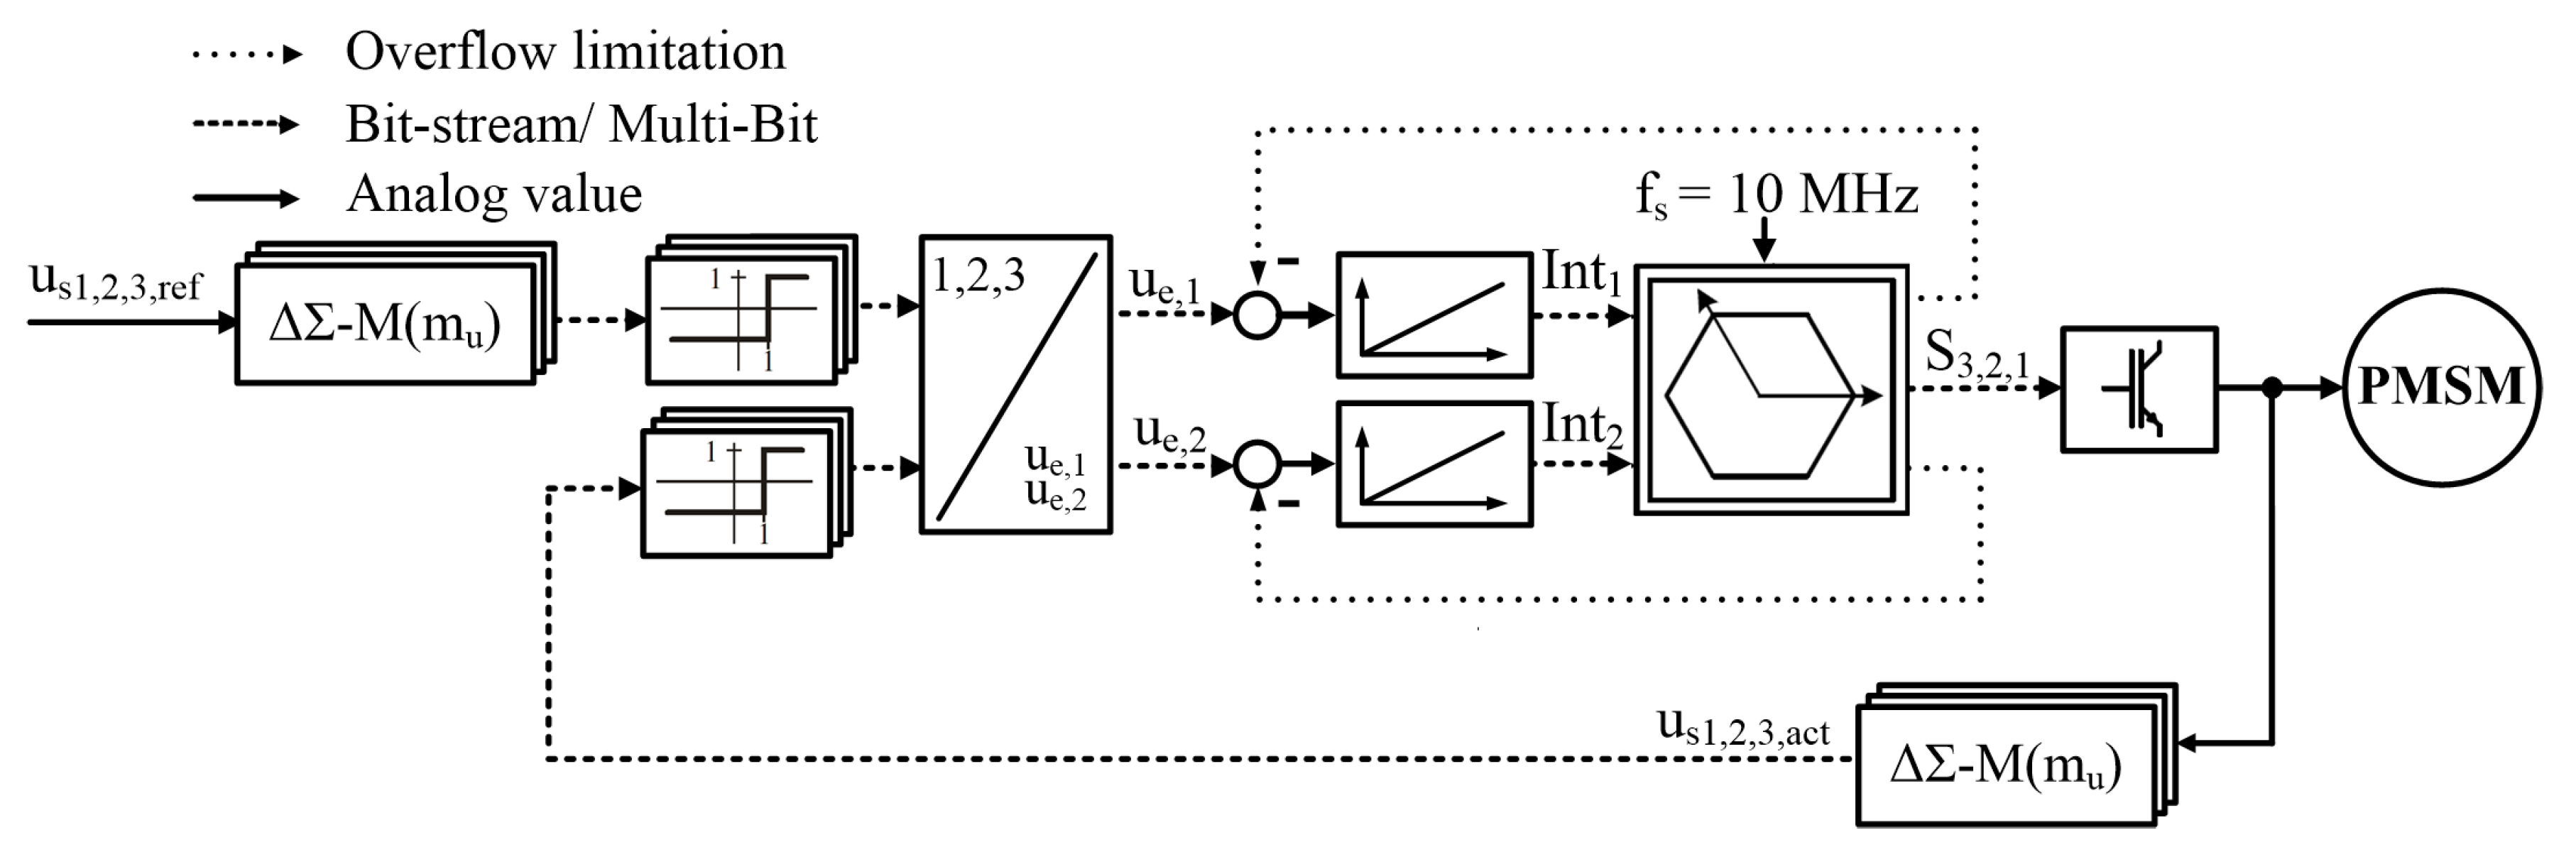
Figure 1. First control loop of Δ Σ -PWM, adapted with permission from [6], Homann, 2016.
Applsci 11 02293 g001
Figure 2. (a) Amplitude boundaries as well as (b) angle boundaries for V2 and for V1 voltage space vectors in DS-PWM, adapted with permission from [6], Homann, 2016.
Applsci 11 02293 g002
Figure 3. Speed control loop with Δ Σ -PWM, adapted with permission from [6], Homann, 2016.
Applsci 11 02293 g003
Figure 4. Speed control loop of DTC.
Applsci 11 02293 g004
Figure 5. (a) Trajectory of stator flux space vector and (b) sectors of DTC.
Applsci 11 02293 g005
Figure 6. Stationary behavior of simulation results at nominal point for Δ Σ -PWM.
Applsci 11 02293 g006
Figure 7. Stationary behavior of simulation results at nominal point for DTC.
Applsci 11 02293 g007
Figure 8. Phase current spectrum at nominal operating point.
Applsci 11 02293 g008
Figure 9. Trajectory of voltage space vector.
Applsci 11 02293 g009
Figure 10. Trajectory of flux space vector.
Applsci 11 02293 g010
Figure 11. Phase voltage and instantaneous switching frequency.
Applsci 11 02293 g011
Figure 12. Torque ripple at various operating points.
Applsci 11 02293 g012
Figure 13. Average switching frequency at various operating points.
Applsci 11 02293 g013
Figure 14. Torque ripple and average switching frequency at various operating points.
Applsci 11 02293 g014
Table 1. Switching table for DTC, according to [12].
Change in FluxChange in TorqueS1S2S3S4S5S6
Increase (1)011010110100101001
Increase (1)Slow Decrease (0)111000111000111000
Decrease (−1)101001011010110100
Increase (1)010110100101001011
Decrease (−1)Slow Decrease (0)000111000111000111
Decrease (−1)100101001011010110
Table 2. Nominal parameters of the PMSM Model.
VariableValueVariableValue
Rated speed ( n 0 )800 rpmRated torque ( T 0 ) 1.4 Nm
Rated phase voltage ( u 0 )20 VRated phase current ( i 0 )4 A
Number of pole pairs (p)4Stator winding resistance ( R s ) 188.79 m Ω
d axis inductance ( L d ) 0.926 mHq axis inductance ( L q ) 1.4 mH
Flux linkage ( Ψ 0 )86 mWbNominal inertia (J)3.96 × 10 4 kg m / s 2
Table 3. Control parameters of Δ Σ -PWM and DTC.
Control parameters of Δ Σ -PWM
Hysterisis element N 1 = 58 N 2 = 78
Current controller V i q = 2 V/A T i q = 0.00074 s V i d = 2 V/A T i d = 0.00074 s
Speed controller V ω = 2 As T ω = 0.03 s
Control parameters of DTC
Flux controller Δ Ψ + = 0.43 mWb Δ Ψ = 0.43 mWb
Torque controller Δ T + = 0.03 Nm Δ T 0 = 0.03 Nm Δ T = 0.09 Nm
Speed controller V ω = 226.39 As T ω = 0.04 s
Table 4. Summary of discussed differences.
Ripple Switching Frequency
SchemeTorqueVoltageFluxMaxMinAverage
Δ Σ -PWM 1.79 %3% 0.37 % 30.37 kHz 18.8 kHz 25.6 kHz
DTC2% 4.4 %1% 30.5 kHz660 Hz 10.1 kHz
Publisher’s Note: MDPI stays neutral with regard to jurisdictional claims in published maps and institutional affiliations.