1. Introduction
The key factor determining the continuous and effective production of a mining enterprise is maintaining the highest possible availability of the machinery park in each area of the technological line. Mining devices are usually functionally connected, creating an extensive network of technical objects. Each object has an assigned function, and there is a certain hierarchy of these objects and rules of cooperation between them. Such systems of “connected vessels” are used, among other contexts, in belt conveyor transportation systems. Belt conveyors (
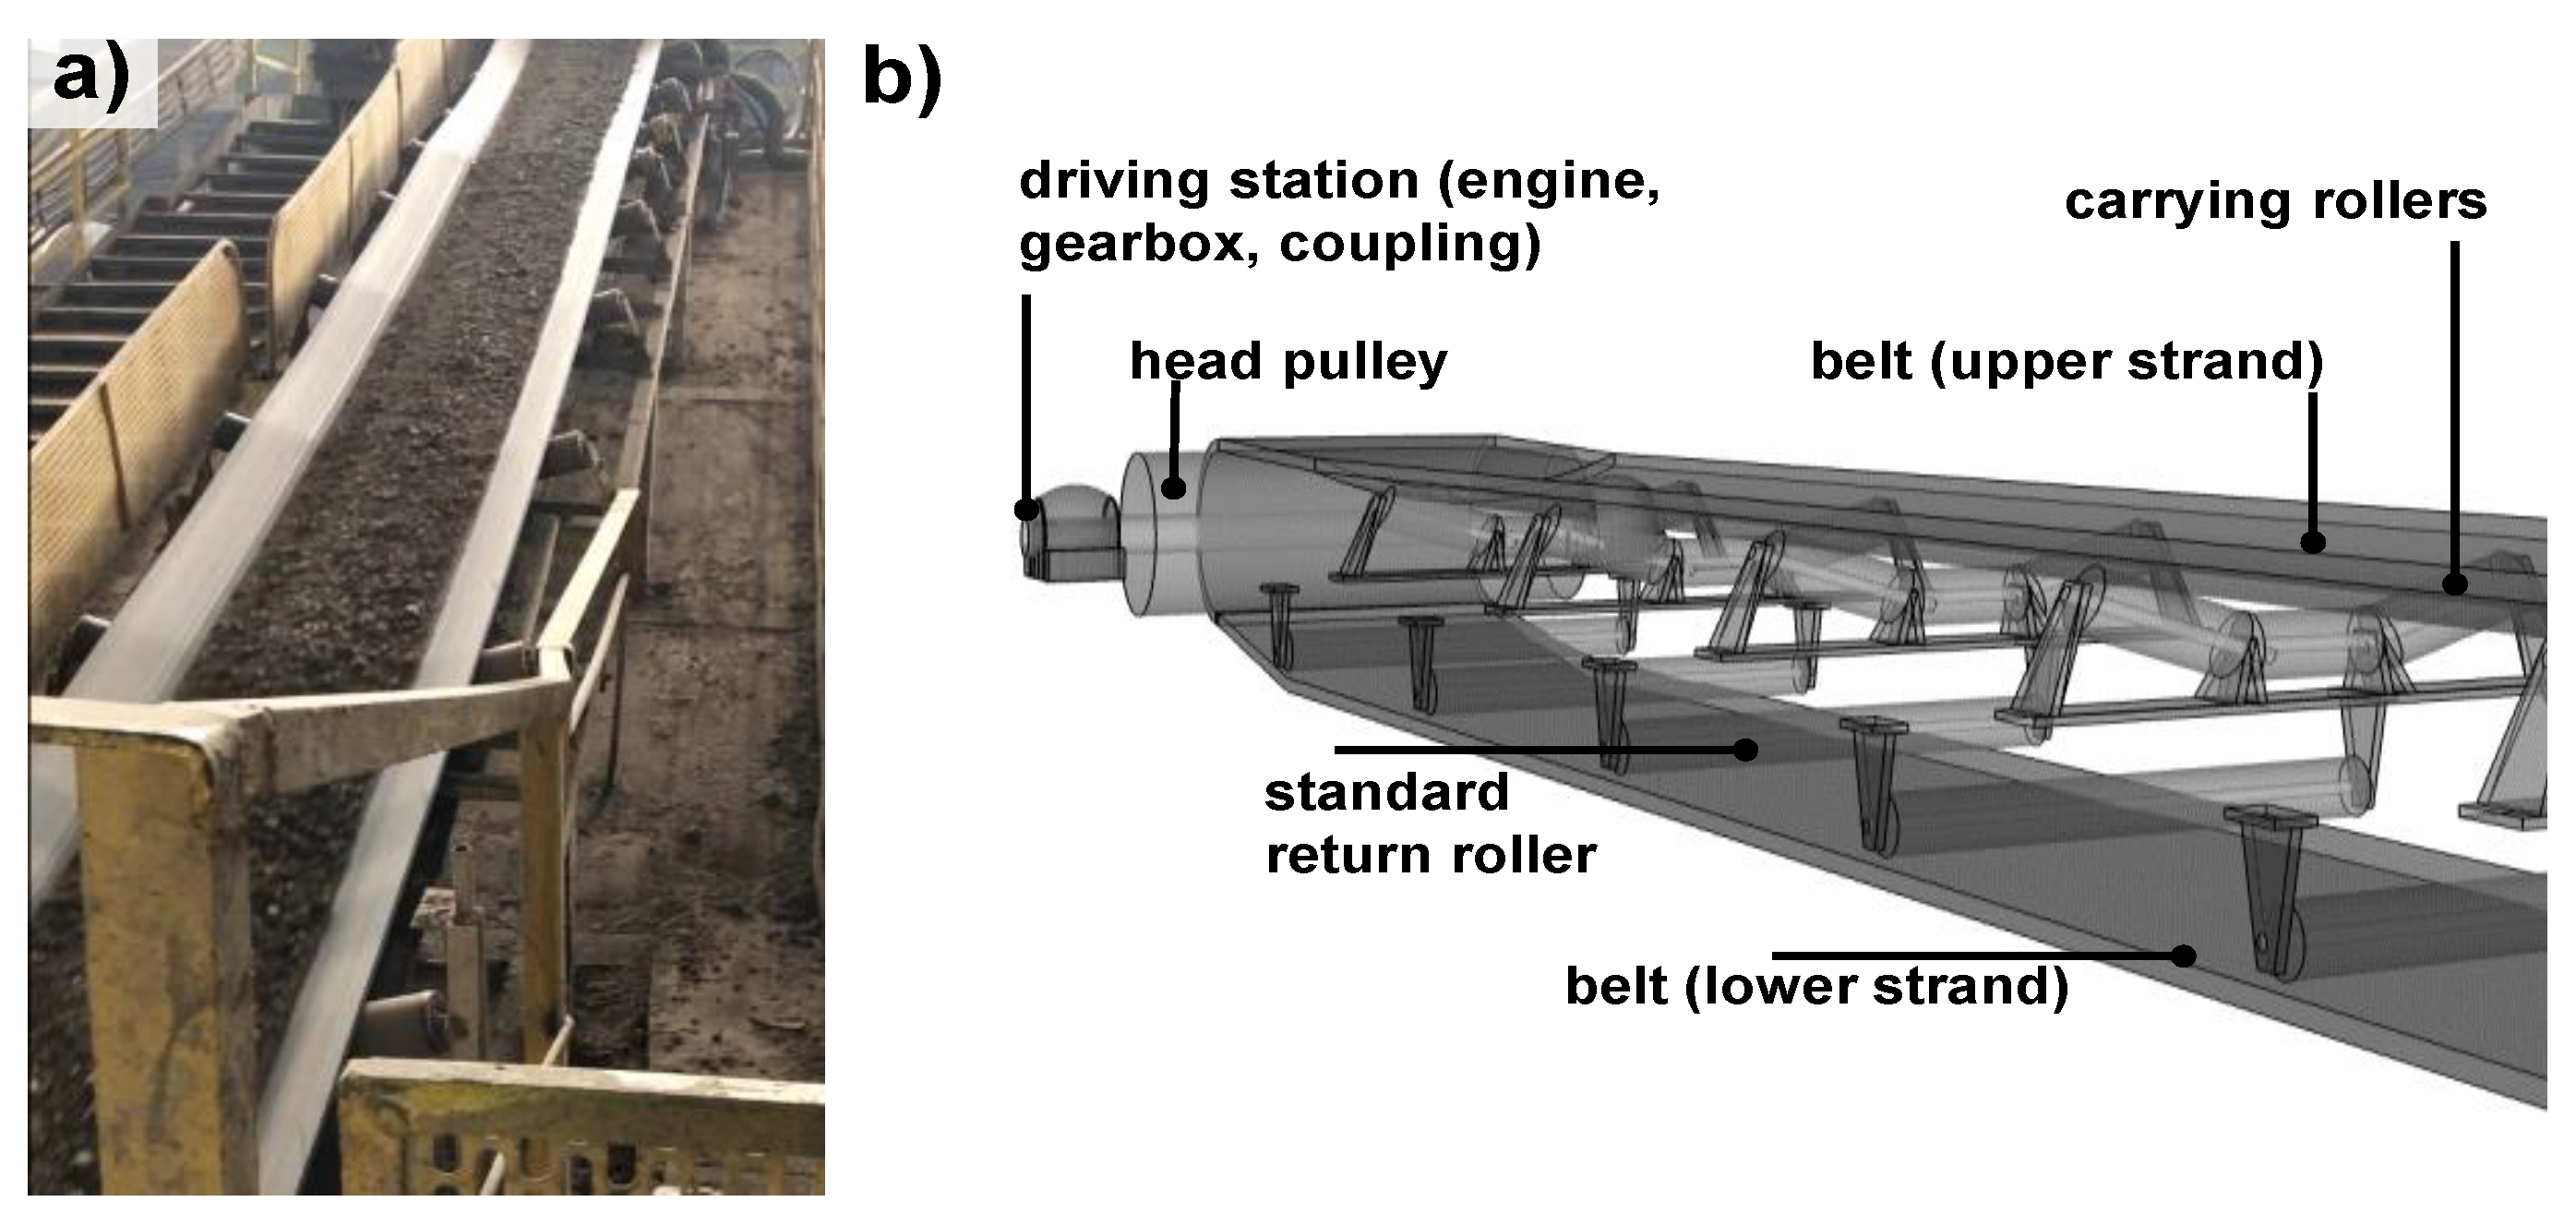
Figure 1) are commonly used devices in continuous horizontal transport of bulk material. In underground mining, the length of a single conveyor usually fluctuates from several dozen meters to several dozen kilometers (depending on the place and destination). A typical belt conveyor has a long belt wrapped in a loop that runs on sets of rollers. Everything is usually powered by 1–4 drive units. The entire system forms an extensive infrastructure; therefore, the greatest challenge for a mine is to achieve full availability of these machines by reducing the downtime caused by different kinds of failures. Conveyor breakdown may stop the production process, which is unfavorable for economic and safety reasons. The repair of some failures may take a long time and requires a considerable engagement of mining staff in areas such as failure diagnosis, ensuring safety, first operational decisions, disassembly, transport of material, repair, and assembly. Critical components are primarily the belt (whole loop), upper and lower rollers, and the drive. Moreover, many other external factors can lead to a serious failure or even fire, which commonly used monitoring systems cannot detect or are too expensive for a wide range of applications. Therefore, it should be highlighted why the role of inspection in the maintenance of mining infrastructure is so important.
In practice, there are often thousands of kilometers of conveyors routes that need to be checked from both sides before and after startups. Due to the growing demand for raw materials and exhausting deposits, world mining is forced to descend to even greater depths. Unfortunately, this poses a serious challenge related to the deteriorating geological and mining conditions, together with environmental conditions (temperature, toxic and explosive gases) and the intensification of seismic activity in the rock mass. These will lead to an increased amount of belt conveyor failures and an even larger need for diagnostic systems. In addition, human perception is limited and often results in many injury events and threat or leads to incorrect indications. In practice, many portable monitoring systems for inspection (thermovision, vibrational, magnetic, acoustic) are available on the market but are problematic due to transport and the need to stop the conveyor for the complicated assembly process. Therefore, in the area underground mining, there is a growing technological expectation in terms of new solutions eliminating the role of humans in the mining area. Due to the size and dispersion of the conveyor infrastructure, monitoring systems must be inexpensive, reliable, easy to use, and able to integrate data from various sources.
In [
1], an Internet of Things and Big Data solution dedicated to conveying a transportation system was described. The authors presented the concept of a smart roller for a conveyor, which measures temperature and has the ability to communicate via RFID (Radio-frequency Identification). The general architecture of such a solution has also been presented but has not been implemented on a larger scale. Currently, such solutions are rare in the mining industry mainly due to the hard, expensive, and long-term implementation. In article [
2], the authors present a robot for belt conveyor suspension inspection. The described robot moves along a cable mounted above the conveyor, and the inspection is carried out by a thermographic camera and CO and CH4 sensors. The authors claim that the proposed solution can be used to analyze and detect any kind of anomaly; however, only a concept is presented in the article. ABB company offers a similar suspended device [
3,
4]. The device proposed by the company differs in that it is mounted on a durable rail located on the side of the conveyor, which allows for a more accurate analysis of its suspension. The company also uses ultrasonic analysis to assist detection. The proposed solution has already been implemented in industrial conditions. Another solution for mine inspection of conveyors is proposed in article [
5]. The authors present a prototype of a wheeled robot based on a UGV (Unmanned Ground Vehicle) platform for inspection works. The robot is remotely controlled via radio communication. Its sensor layer is mainly based on an RGB color camera and thermography. The article presents the results of tests carried out on a test rig, including standard techniques for detecting anomalies in thermal images. The authors point out the great challenge in achieving the required motor skills of the robot related to the difficult ground conditions along the conveyor route. An extension of this research is [
6], in which a UGV robotic system is tested for rescue action support in an underground mine with special emphasis on image processing techniques using YOLO (“You Only Look Once”) and HOG (Histogram of Oriented Gradients) algorithms. Experiments have shown that the robot is capable of operating in harsh environments. Automatic inspection of conveyor rollers was also mentioned in [
7], where the authors proposed a platform with a 6 DoF (Degrees of Freedom) robotic arm upon which a thermal imaging camera, microphone, and LIDAR were mounted. The described solution inspects conveyor elements by continuous analysis using acoustics and thermography, and in case of anomalies, by accurate mapping of the element with LIDAR. The authors of [
8] presented a mobile platform suspended in the middle of the conveyor (between the upper and lower belt), which performs inspection through infrared thermography. In [
9], the use of UAVs to control the condition of rollers based on thermovision is presented. The first tests showed effective detection of damages to the belt conveyor rollers. It was proposed to use a backend platform that enables cloud connectivity and integration with other enterprise IT systems. In the case of an underground mine, the use of UAV and thermovision requires high needments in terms of terrain recognition (poor visibility, dust, little light), quality of infrared images (mainly dusting of air and conveyor elements), and maintaining stability (obstacles, air vortices, ventilation).
In the case of conveyor inspection, three main elements on which the inspection should focus are belt, rollers, and a drive unit. Rollers (idlers) are rotating elements supporting the belt. They are composed of two bearings mounted on a stationary shaft covered with cylindrical cladding. In the case of idlers, typical damage applies to such elements as shaft, roller tube, bearing block, and bearing. Moreover, the idler may become blocked, causing it to rub against the belt, or it may also not adhere to the belt. A frequent issue is also the lack of a stable fixing of the idler set to the ground. Generally, the most common damage of the rollers concerns the bearings. Belt conveyor idler roll behaviors were considered in detail in [
10]. In the case of idlers, the usual diagnostic solutions are based on vibration, thermal and acoustic signals. From the inspection robotization point of view for the belt conveyor, methods based on thermovision and acoustics seem to be the most appropriate. During the rotation of the roller, we observe the phenomenon of friction between its internal parts. For example, bearing failure increases the level of friction and temperature. Looking globally at a thermal image, it is easy to notice anomalies by usually comparing adjacent idlers. Therefore, setting a threshold is a trivial task. Similarly, detection of non-rotating idlers (bearing blockage, no contact with the belts). The acoustics provide more complex damage-oriented features (especially spectral) compared to thermography. It allows detecting specific acoustic emissions corresponding to specific elements of the idler and types of damage in various stages of development. For this reason, it is promising from the perspective of both early failure detection but also its prediction [
11,
12,
13,
14]. More information about roller damages and belt conveyor issues in general can be found for example in [
15,
16,
17,
18].
Given a multitude of different potential issues with the rollers, there are many different diagnostic procedures and algorithms described in the literature. The authors of [
19] have presented a review of such methods for the more general problem of fault diagnostics in rotating machinery. In the article, various methods for bearings, but also gears and rotors, have been presented. A similar review was done in [
20], although in this case, the authors focused on audio- and vibration-based methods. In [
21], the most common bearing fault problem was addressed, and a hybrid method based on autocorrelation analysis was described. To reduce the problem of the interfering vibration signal coming from other sources, the authors proposed the usage of an optimal Morlet wavelet filter. The authors of [
22] addressed the tutorial aspects of the bearings’ fault diagnostics. To help the engineers learn the concept, three different, very common, approaches to the problem were presented: the autoregressive model, spectral kurtosis, and envelope filter. In [
23], a roller state monitoring system implementation on a belt conveyor running in the coal preparation plant was described. The presented roller state diagnostic method based on the stacked sparse encoders and convolutional neural network were able to achieve an accuracy rate of 96.7%. The authors of [
24] addressed the problem of the low-speed bearings diagnostics, which can be characterized by the long periods between the defect-related impulses and relatively high level of noise. The proposed autocorrelation-based method was compared to the common envelope spectrum approaches, which turned out to be prone to induce an incorrect conclusion in the low-speed conditions. In [
25], an acoustic signal-based method is presented, which utilizes Mel Frequency Cepstrum Coefficients and Gradient Boost Decision Tree for the process of feature extraction and classification. The method achieved over 94.5% accuracy with a very high recall rate of 99.7%. In [
26], authors considered the issue of bearing acoustic diagnosis based on a 2D sound field, given the fact that in the single-channel variation, the methods tend to be very sensitive to the sound signal acquisition location. The authors of [
27] compared three different methods based on the Short-Time Fourier Transform (STFT), Continuous Wavelet Transform (CWT), and Hilbert Huang Transform (HHT) to evaluate their bearing systems fault detection performance.
Although many automatic procedures have been developed in practical applications, at the moment, diagnosis of the technical state of the idlers is performed very often by mining staff during current and periodic conveyor inspections. For best results, each element should be checked separately, which takes a considerable amount of time in the case of longer conveyors. Our approach involves an autonomous robot that would constantly monitor the condition of the idler sets with the use of sound processing techniques. Then, during the scheduled maintenance, specialists would only perform basic inspection and repair work on some selected elements without the need to inspect idlers along the entire length of the conveyor.
Most of the research on automatic conveyor inspection concerns mainly thermographic analysis and is performed using mobile platforms that often require integration with the conveyor, which additionally increases the overall cost of the solution and extends implementation. Therefore, we propose a simple, acoustic-based method for detecting damage to the elements of a belt conveyor that could be implemented in a legged robot operated in difficult deep mine conditions. The work uses the ANYmal commercial robot, whose inspection functionality and resistance to underground conditions are developed as part of the “THING subTerranean Haptic INvestiGator” project. For the inspection of mining infrastructure, the robot was equipped with an RGB and thermovision camera, microphone, and accelerometers installed in the haptic legs. The article presents the results of testing the functionality of the robot during surface tests in industrial conditions. A novelty is the proposal of a universal method based on acoustics that allows identifying incorrect operation of rotating components of the mining infrastructure as an extension of the commonly used thermal imaging methods in robotic solutions for conveyors.
This paper is organized as follows.
Section 2 contains a description of the autonomous robot inspection procedure and sound signal processing algorithm for the analyzed problem.
Section 3 presents the results of our work, the comparison with other similar algorithms, and a short discussion about them. Finally,
Section 4 presents our conclusions.
2. Material and Methods
In the analyzed problem, loosening occurred in the roller set due to the long work under tension. This loosening alongside vibrations from the belt and the transported material caused the whole set to repeatedly move sideways. This movement resulted in friction between the metal components, which in turn resulted in a high-pitched sound. However, the detection of this sound is difficult because of the conditions in the plant. Namely, there is a considerable level of sonic disturbance produced by a plurality of sources. In addition, some disturbances partially coincide with the studied phenomenon. One of these is a passing mechanical joint of belt slices. The steel rivets in the mechanical connections of belt slices hit each idler, creating a repetitive disturbance similar to the problem under investigation. Another source of disturbance is the tripper car alarm, which is activated when performing activities such as movement/discharge.
The noise coming from a damaged conveyor roller can be observed in the spectrogram shown in
Figure 2. Each sound produced by the shift of the rollers frame is visible in the image as a peak with the greatest power at frequencies lower than 18 kHz.
To detect anomalies associated with incorrect operation of the idler set, the algorithm shown in
Figure 3 was proposed. The entire method can be divided into 4 steps. The first step is signal segmentation; then, in the second step, spectral analysis is performed, and its results are separated into signals of individual frequencies. In the third step, the autocorrelation of each signal is calculated. Finally, in the last step, the results for particular frequencies are combined.
2.1. Data Collection
The described algorithm was developed based on the data collected during the tests in the Ore Enrichment Plant. Over 100 m of operating belt conveyor were inspected with the use of an ANYmal robot with additional microphones and thermographic camera mounted on. There were several idler sets, among which characteristic cyclic sounds were noted.
2.2. Autonomous Inspection Robot and Inspection Procedure
For the best performance, the conveyor inspection robot should be fully autonomous. This means that it should be able to perform a passage/drive along a previously designated route, along with the possibility of reacting to obstacles that appear regularly. Taking into account the mining infrastructure, it should be able to climb stairs and platforms with different slopes. The robot must also be able to stand up by itself after falling. It should also diagnose difficult-to-access conveyor elements (e.g., lying close to a wall or enclosed in a protective housing). In our research, the ANYmal robot was used for this purpose, which is certified to work in typical conditions of an underground mine (see
Figure 4).
ANYmal can operate in two modes: fully autonomous and remote control. During remote-controlled operation of the robot, a 3D map of the site can be created using a LIDAR mounted on it [
28]. The inspection route can be then marked on this map and can be used for future inspections (
Figure 5). In the experiment, the robot was equipped with a dedicated acquisition module to collect video and audio signals, a thermal imaging camera, and feet with a built-in accelerometer.
The inspection procedure based on audio signals assumes that the robot walks along a designated route and continuously measures the sound emission. In the experiment described in this article, the results were processed offline after the measurements were performed, but it is possible to run it in real-time. Based on the processed sound signal, a map that symbolizes the degree of rollers damage can be created. Depending on the results obtained by the sound-processing algorithm, a color on the heat map will indicate the degree of roller wear or dysfunction that requires quick correction. Although this approach does not give the exact position of the damaged roller, it allows the search area to be narrowed for conveyor maintenance staff and thus reduces the time needed for the inspection. To accurately identify the conveyor components, it is necessary to integrate the data from the robot location system and thermovision.
2.3. Signal Extraction
The input data of the algorithm are a sound signal sampled at a frequency of 44,100 Hz and converted into a two-dimensional 2xN matrix, where N denotes the length of the signal as a number of samples and 2 results from the microphone recording 2 audio channels. However, more than one audio channel is unnecessary for this algorithm; therefore, the additional channel has been removed.
After the extraction, the signal was divided into fragments of 1 s length (L = 44,100 [samples]). The fragments did not overlap, which provided a lower computational load and due to the low speed of the robot, such fragmentation procedure gives reliable results.
2.4. Spectral Analysis
From each of the fragments, a spectrogram calculation was performed. The spectrogram is a two-dimensional matrix where the
x-axis is the time, the
y-axis describes the frequency (
), and the value is signal intensity, which is usually visualized as a color map. Overall, the spectrogram gives a visual representation of the power of frequencies in signal over time. The spectrogram operation consists of dividing the signal
x(
n) (where
n (0,
L−1)) into short sections of length
m with a window
w(
n) and then performing the Fast Fourier Transform on each of them [
29] (Equation (1)):
The spectrogram with time axis
and frequency axis
is next achieved by calculating the magnitude squared of the STFT (Equation (2)):
All operations related to the spectrogram and subsequent steps were performed using the SciPy library for the Python language [
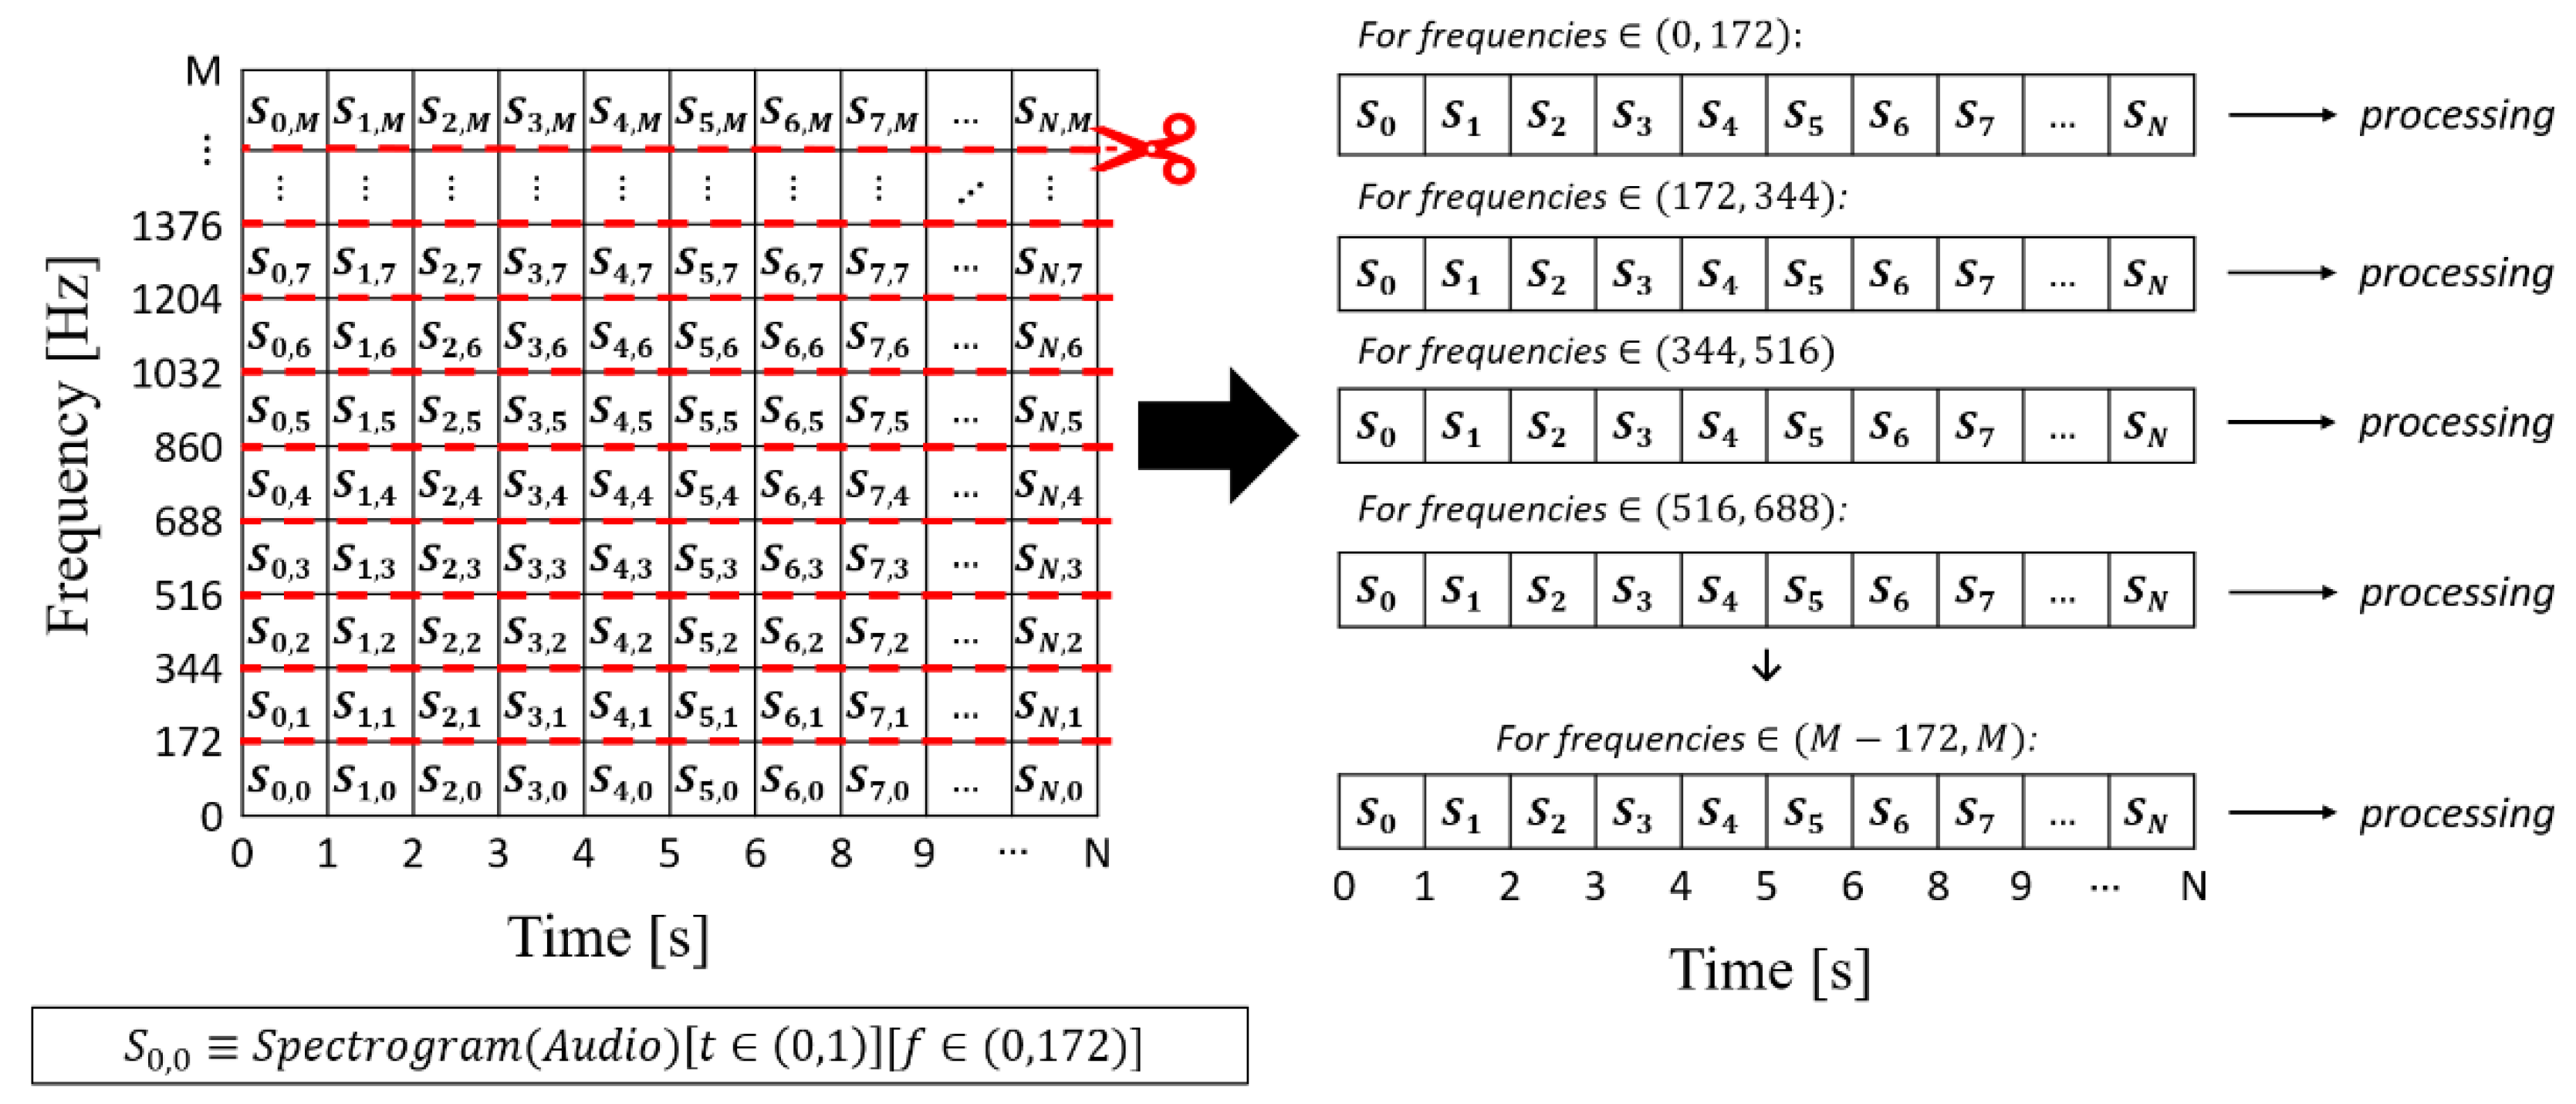
30]. When executing a spectrogram, this library returns a two-dimensional matrix where the time axis is graded every second, and the frequency axis is graded by the value that results from dividing the Nyquist frequency (half the sampling frequency, i.e., 22,050 Hz) [
31] by 129, which gives values every 171 Hz. Thus, when the spectrogram is visualized as a color map, each pixel of such image will describe the signal intensity for the frequency band from X to X + 172 Hz and 1 s. The next step is the segmentation of the spectrogram matrix with respect to the frequency axis. The matrix is divided into 129 one-dimensional pieces, each of which describes the Power Spectral Density for the selected frequency band during the entire measurement. This process is presented in
Figure 6.
The purpose of the above operations performed on the spectrogram is to facilitate the detection of the indicated defect. As is visible in
Figure 2, the defect presents itself as a significant peak passing through the vast majority of the frequencies present in the signal. After transforming the spectrogram into a series of 129 vectors, such peaks are visible on most of them as a local maximum. Since the defect produces a periodically repeated sound, the local maxima signifying this sound also repeat from time to time.
2.5. Repeatability Analysis
Autocorrelation analysis was used to study the further part of the signal, in particular the periodic peaks. In the course of analysis, it was noticed that in the case of the discussed anomaly, there are significant peaks in the multiples of the 50th lag in the autocorrelation. Additionally, as the distance to the damaged element decreases (and thus its loudness increases), the discussed peaks become larger and more distinct. These behaviors are the same for most of the studied frequency bands. Similar results were obtained by the authors of [
24], who also related the presence of a peak in the 50th lag to damage to the rotating element.
Figure 7 shows an example of the autocorrelation from the signal for 120 s of the measurement and the frequency band: 8550–8721 Hz.
Therefore, at this stage of the algorithm, autocorrelation is performed from the signal of each frequency band (
x(
m) extracted from spectrogram(
m,
) by slicing). Autocorrelation
z[
k] is calculated for each of them (Equation (3)) and later smoothed with a moving average.
where
N = ||x(m)|| and
||x(m)|| is the length of x(m). To find the peaks, a function from the SciPy library was used (find_peaks). In addition, some restrictions were applied: the minimum distance between peaks was used to exclude the peaks, which are too close to each other, and peaks prominence was used to exclude insignificant peaks. In the case of peak prominence, the minimum value was equal to the maximum value of autocorrelation for the current signal, divided by 5. Then, the detected peaks were checked for whether any of them were present in the previously defined range of autocorrelation lags (between 45 and 55).
3. Results and Discussion
The last step of the algorithm is to combine the results of signal processing for different frequencies. For each frequency band, the value
true/false is returned describing whether there are repeating peaks observed on the autocorrelation of the signal. The effects of this process are presented in
Figure 8, where the frequencies for which repeating peaks occurred in the autocorrelation are marked with dark blue. There were two damaged rollers on the inspected section of the belt conveyor. Two pronounced clusters of dark blue points are observed in
Figure 8, which correspond to those damaged rollers. In addition, a higher density of points can be observed between those clusters, which also indicates damage to the conveyor element, but of a different nature. Accurate fault identification could not be performed in this case due to insufficient information in the recording.
By aggregating these results (Equation (4)), we can obtain the percentage of frequency bands, for which repeating peaks in the autocorrelation signal are observed in time (
W(
t)).
where
represents the peak of the autocorrelation at a given frequency
. Results of this operation are shown in
Figure 9, where the blue line is the percentage of the number of frequency bands in which the change is detected, while the red line is the same value averaged. Two main failures are clearly visible on this plot. In addition, one can also see one smaller peak, which is caused by the unidentified damage to the conveyor. The analysis showed that the signal is influenced by many factors. However, none of them can raise its value above 30%, while in the case of the problem examined, the signal increases to the level of about 60–80%.
In order to test the presented algorithm, we decided to compare its results with other algorithms with similar applications. The first such algorithm was the one presented by Grebenik [
32]. This algorithm approaches the subject very similarly, first performing segmentation, then transforming the signal into the frequency domain in which it is filtered. From the signal processed in this way, the following features were selected: peaks exceeding the set limit, the total number of peaks in the segment, and the product of peaks amplitude in each window. These features were then processed by the SVM algorithm, but this operation was omitted due to the lack of an appropriate training sample. Another algorithm implemented for comparison is the one presented by Yang [
23], where the authors first calculated the feature vector from segments of signal (statistical measures) and then reduced its dimensionality with PCA and made classification using three algorithms (K-means, Spectral Clustering, Deep Neural Network). The comparison shows the classification on the sample using K-means, with the number of groups sought equal to 4. The last algorithm of the comparison is that described by Nikula [
24]. Its authors focused on the calculation of four features on the segmented and filtered signal, two from the spectrum (kurtosis, skewness), and two from the autocorrelation (maximum, 95th percentile). Additionally, a timeline was added to the comparison to better present what was happening in the sample. The comparison results are shown in
Figure 10.
As can be seen in the comparison, the proposed algorithm correctly detected type 1 two defects and partially one type 2 defect that remained unaffected by the disturbances in the sample. The type 1 defect at the end was also found by Grebenik and Nikula; Yang detected a type 2 defect. All three algorithms used for the comparison showed some degree of increase in the defect measure when the tripper car alarm appeared for the second time.
Table 1 shows the results of the proposed algorithm and other similar approaches. The percentage values given in the table mean that if the algorithm detected one of the two occurring failures (the time of precise detection was not taken into account), the detection of this failure was 50%. Additionally, false detections caused by environmental disturbances are also included.
The results show that the proposed algorithm can be a reliable method to detect conveyor damage in industrial cases. Other methods, although also based on similar activities (mainly frequency analysis), were developed for laboratory cases, mostly without tests in other conditions. For this reason, most of the methods that have been used to diagnose conveyors use thermovision or vibration, and sound-based methods are a definite minority, even though they are much simpler and cheaper to implement. This is even more important in the case of implementation on devices that perform automated inspections, such as the presented robot. The implementation of the acoustics-based algorithm requires only a microphone, unlike an expensive thermal imaging camera or the entire vibration measurement procedure, which requires the robot to locate the place to perform the measurement and connect the sensor to it, which is complicated. For the presented method to become a good alternative, it is necessary to conduct tests on a much larger scale, which will include various environmental conditions, types of damage, and disturbances.


