Abstract
An isoinertial strength assessment was performed to examine the kinetic and kinematic behavior of the barbell during several muscle actions. Velocity–time characteristics, force–time relationship, one repetition maximum (1RM), power output, and acceleration were compared in eccentric–concentric (EC) versus concentric only (C) sequences of the bench press (BP) and military press (MP). In two separate sessions, 28 and 29 resistance-trained athletes executed EC or C sequences in random order of the BP and MP, respectively, in an incremental load test up to their 1RM. Higher values were recorded in BP-EC than in BP-C, MP-EC, or MP-C (p < 0.01) for peak acceleration, peak rate of force development, peak rate of velocity development, and power output. Significant differences were detected between exercises in terms of the portion of the concentric phase (%) at which peak acceleration was detected, or acceleration up until peak velocity was observed (p < 0.05). No differences were observed between exercises in the portion of the concentric phase where acceleration up to the braking phase took place. The eccentric muscle action prior to concentric movement was a key factor to enhance the kinematic and kinetic performance in BP exercise. No such effects of the countermovement were produced in MP.
1. Introduction
Strength can be described as an acceleration of a mass and defined as the ability to produce force [1]. Thus, a capacity to generate force in a short amount of time (force–time relationship) is a good indicator of performance in activities where great acceleration is required [2,3]. Isoinertial strength assessment resembles training and competition tasks that involve acceleration and deceleration [4,5] and appears to be an appropriate option to analyze changes in strength produced by regular training [6].
Recently, isoinertial strength tests have been used to examine the kinetic and kinematic behavior by examining velocity– and power–load relationships during the concentric phase of a lift [7,8,9]. These studies have included a pause between the eccentric and concentric phases in order to minimize the contribution of the rebound effect and allow for more reproducible, consistent measurements during isoinertial strength tests [7,8,9]. However, it is well known that the stretch-shortening cycle (SSC) improves neuromuscular performance [10], influencing both the kinetics and kinematics of the movement in the subsequent concentric muscle action [11]. Greater force and power are generated by muscle in a concentric phase when the concentric muscle action is preceded by an eccentric phase [12]. This performance improvement in the concentric muscle action likely depends on the movement velocity and force generated during the eccentric muscle action and the brief “coupling” time between eccentric and concentric muscle actions [13]. The mechanisms underlying this improved performance in the concentric muscle action after SSC have been a matter of debate for many years [14].
In resistance exercises, the effect of the SSC on kinetic and kinematic performance remains controversial during isoinertial strength assessment. Cronin et al. (2001) observed that the SSC increased instantaneous power output up to 260 ms in the concentric muscle action for light loads (40% of one repetition maximum (1RM)) during bench press (BP) throws. At high loads (80% 1RM), instantaneous power output was enhanced up to 460 ms in the concentric muscle action when the concentric phase was preceded by an eccentric muscle action. The authors found significant differences between light and high loads in the effect induced by the SSC [14]. However, Pallarés et al. (2014) determined that mechanical parameters linked to the load–power and load–velocity profiles (30–100% of 1RM) remained essentially unaffected by the SSC in BP and full squat exercises [7]. The authors concluded that the biological within-subject variation for the isoinertial strength assessment was decreased when a pause was established between the eccentric and concentric phases [7].
The contradictory findings of these studies do not clarify [7,8,9,14] whether it is best to undertake the isoinertial strength test with or without countermovement to examine the specific kinetic and kinematic performance. Increased muscle strength appears to be highly specific to the nature of the training task [15]. Therefore, it is plausible to propose a more specific isoinertial strength assessment to determine the neuromuscular adaptations as a consequence of training. For this purpose, it is essential to demonstrate that the eccentric phase affects the kinetic and kinematic performance of the concentric muscle action during the isoinertial strength test.
On the other hand, when a load is lifted in a traditional resistance exercise such as the BP, the movement involved starting from zero velocity until peak velocity (PV) is reached at a given time during the concentric phase of exercise, and, thereafter, this velocity gradually decreases again to zero. Thus, during an important portion of the concentric phase, the load is subject to deceleration, and, depending on the loading intensity, this deceleration phase will be of greater magnitude and length (for light or medium loads) or lower magnitude and length (for heavy loads). In both cases (light or medium vs. heavy loads) the force (F) applied against the external load of mass will be negative during this final portion of the concentric phase only when acceleration (a) is lower than acceleration due to gravity (g) (a < g). Accordingly, the concentric phase of a lift can be subdivided into a propulsive (F > 0 and a > 0) and braking phase (F < 0 and a < 0) [5]. Recently, several investigations have addressed the behavior of propulsive and braking phases during the concentric action of a lift in isoinertial strength tests [7,8,9].
Despite the key role played by the propulsive and braking phases in the concentric muscle action during isoinertial strength assessment [8], no much attention has been paid to the contribution of the eccentric muscle action by focusing on other kinematic parameters, such as acceleration. Specifically, the rate of velocity development (RVD) is defined as the slope of the velocity–time plot and is considered representative of acceleration from 0 to peak velocity. RVD has been considered as a relevant variable in previous investigations [16,17]. Thus, a high RVD will reflect an individual’s capacity to generate high power output and force levels to reach peak velocity in a short time period. A high RVD will be critical to enhance sport performance, especially in activities in which body mass or an object need to be rapidly displaced [18]. To the best of our knowledge, no studies have explored the behavior of RVD in traditional resistance exercises during the isoinertial strength test by determining the effect of the eccentric phase on the performance of concentric muscle action.
An in depth analysis of the velocity– and force–time relationship, by comparing the eccentric–concentric vs. concentric muscle actions, would provide valuable information for coaches and athletes to determine the loading intensity and muscle actions that enhance the kinetic and kinematic performance during isoinertial strength assessment.
This study examines the role of the eccentric muscle action preceding a concentric phase by comparing the RVD, rate of force development (RFD), 1RM, power output (mean and peak) between eccentric–concentric (EC) and concentric (C) muscle actions in bench press (BP) and military press (MP) exercises. A second purpose was to compare the relative contribution (%) of the total duration of the concentric phase between EC and C muscle actions at the moment of peak acceleration, peak velocity, and braking phase in BP and MP exercises.
2. Materials and Methods
2.1. Study Participants
Twenty nine healthy young men (age 22.2 ± 1.3 years; height 182.1 ± 7.6 cm; weight 78.8 ± 9.07 kg; BMI 22.2 ± 1.3) were recruited for the MP tests, and a further 28 men (age 22.6 ± 1.8 years; height 183.6 ± 6.9 cm; weight 80 ± 8.4 kg; BMI 23.7 ± 1.1) for the BP tests. The practitioners had 3.5 ± 1.2 years of experience in resistance training and were accustomed to BP and MP exercises. Exclusion criteria were as follows: (a) the use of any medication or performance-enhancing drugs, (b) any cardiovascular, metabolic, neurological, pulmonary, or orthopedic disorders that could limit exercise performance, and (c) a 1RM MP under 50 kg or 1RM BP under 60 kg.
Before the study commenced, participants were informed of the experimental procedures, and written consent was obtained from each participant. Participants were instructed to refrain from physical activity or other resistance training during the course of the study. The study protocol was approved by the university review board of the TecnoCampus, Pompeu Fabra University (IC 13/2018) according to the principles and policies of the Declaration of Helsinki.
2.2. Test Procedures
Participants undertook a preliminary practice session and two test sessions (BP or MP). A 48-h rest was established between sessions 1 and 2. A rest time of one week was established between sessions 2 and 3. Tests were performed at the same time of day (±2.5 h) under the same conditions of temperature and humidity.
In the first session (BP or MP), participants completed a questionnaire about their medical history and then undertook a set of practice tests using light and moderate loads. Kinetic and kinematic parameters were examined in sessions 2 and 3 during an isoinertial strength test up to 1RM. In these sessions, C or EC phases of each exercise were separately performed in random order by executing either the complete exercise (EC phase) or avoiding the initial eccentric phase (countermovement) by introducing a 2 s pause between the eccentric and concentric muscle action (C phase) [7]. In each repetition, weights were lifted at maximal voluntary velocity.
Each test session started with a general warm-up of 5 min on a cycle ergometer at a light intensity, and 5 min of joint mobility exercises of the upper limbs. Next, participants carried out a specific warm-up consisting of 2 sets of 5, and 3 repetitions, using a fixed 20 kg load in both exercises. Movement velocity was slightly increased in each repetition during the first set, and in the second set, lifts were executed at the maximum movement velocity to induce greater activation of the specific muscles involved in both exercises. The rest time between sets was 1 min.
Three minutes after the specific warm-up, the participants commenced the test protocols. The established initial load was 20 kg for both BP and MP exercises. This load was then increased in each set in 10 kg steps for BP and 8 kg steps for MP until the peak velocity recorded by a linear position transducer was lower than 0.70 m.s−1. Next, the load was individually adjusted in each participant using 5 kg−1 kg loadings for BP and 4 kg−1 kg for MP to determine 1RM as precisely as possible. When peak velocities (PVs) greater than 0.85 m.s−1 were recorded by the linear position transducer, two attempts were made using each load. Only one attempt was made for PVs under 0.85 m.s−1 to avoid considerable reductions in movement velocity and power levels in a second attempt and thus avoid unnecessary fatigue. The recovery time between each set was 5 min for PVs less than 0.85 m.s−1 and 3 min for PVs greater than 0.85 m.s−1. Only data for the best attempt in each corresponding load were used in the statistical analysis (>PV).
BP and MP exercises were carried out according to the guidelines described by Baechle and Earle (2008) [19].
2.2.1. Bench Press
Participants laid flat on their backs on a bench with feet on the ground and holding the barbell in a pronated grip with hands a little wider apart than the width of the shoulders (4–8 cm). When instructed by the observer, the participant commenced the movement using the corresponding weight executing a controlled eccentric muscle action (0.5–1 s) to vertically lower the barbell until almost touching the chest slightly above the nipples. From this point, the barbell was thrust vertically upwards in the concentric muscle action.
2.2.2. Military Press
Participants sat on a bench with their back against the back rest. The barbell was held in a pronated grip with hands a little wider apart than the width of the shoulders (4–8 cm). When instructed by the observer, the exercise commenced with the participant flexing the elbows to lower the barbell in front of the head in a controlled manner (0.5–1 s) until slightly above the shoulders. From this position, the propulsive muscle action (concentric) was executed to lift the bar until fully extending the elbows.
In both exercises, a repetition was taken as completed when elbows were fully extended. No dips or abnormal movements of the trunk or shoulders were allowed.
2.3. Measuring and Data Acquisition Methods
A Smith machine (Matrix G1-FW161, Johnson Health Tech. Ibérica S.L, Madrid, Spain) was used to execute the BP and MP tests. A linear position transducer, Tendo Weight-lifting Analyzer System (Tendo Sport, Trencin, Slovak Republic), was used to measure bar velocity (Figure 1). The validity and reliability of this instrument has been recently confirmed [20].
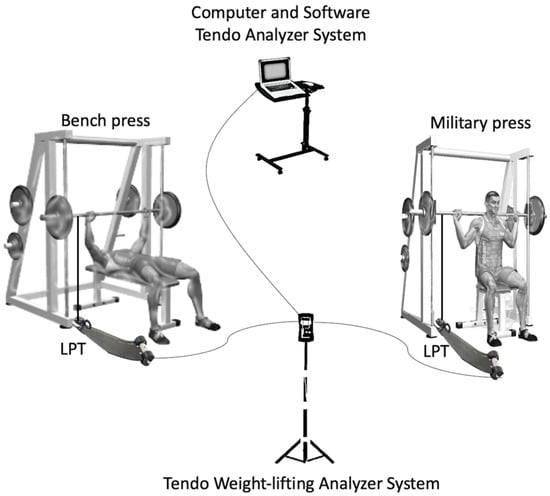
Figure 1.
Distribution and location of the Tendo Weightlifting Analyzer System on the Smith machine in the bench press and military press exercises. Abbreviations: LPT = linear position transducer.
The kinetic and kinematic variables were calculated internally by the specific software installed in the computer (Tendo Weight-lifting Analyzer 3.0.4) as follows:
Velocity (m.s–1) = vertical movement of the bar (m) × time (s–1)
Acceleration (m.s–2) = vertical bar velocity (m.s–1) × time (s–1)
Force (N) = system mass (kg) × (vertical acceleration of the bar (m.s–2) + acceleration due to gravity (m.s–2))
Power (W) = vertical force (N) × vertical bar velocity (m.s–1)
RVD was calculated as the slope of velocity–time curve (∆velocity/∆time), and the peak RVD was defined as the highest value.
RFD was obtained from the slope of the force–time curve (∆force/∆time), and the peak RFD was identified as the highest value.
The portion of the concentric phase (%) with respect to the total duration of the concentric phase was defined at the time of peak acceleration, peak velocity, braking phase, peak RVD, and peak RFD
Note that kinematic and kinetic variables were calculated according to bar velocity and not the velocity of the system’s center of mass.
2.4. Statistical Analysis
The Shapiro–Wilk test was used to check the normal distribution of data, which are provided as means, standard deviations (SD), and standard errors of the estimate (SEE). One-way ANOVA was used to compare differences in acceleration, peak velocity, RFD, RVD, 1RM, and power output between the exercise sequences (MP-EC, MP-C, BP-EC, BP-C) using the post-hoc Bonferroni test.
The reliability of the measurements was evaluated by the parallel forms method in terms of intraclass correlation coefficients (ICCs), and coefficients of variation (CVs) were expressed as percentages of the type error of the measures. All statistical tests were performed using the software package SPSS version 19.0 for Mackintosh (SPSS Inc., Chicago, IL, USA). Significance was set at p < 0.05.
3. Results
Data related to 1RM, power output, RFD, and RVD are shown in Table 1.

Table 1.
Data related to 1RM, power output, rate of force development, and rate of velocity development.
Significant differences between exercises were produced in 1RM (F = 27.50, p < 0.001), mean power output (F = 161.97, p < 0.001), and peak power output (F = 227.28, p < 0.001) (see Table 1).
Peak RFD was greater in BP-EC (F = 25.57, p < 0.001) compared to other exercises. Significant differences were also produced between exercises in the portion of the concentric phase (%) until reaching peak RFD (F = 4.28, p = 0.005). However, no differences emerged in the time (ms) required to reach peak RFD (see Table 1).
Peak RVD was higher in BP-EC (F = 7.89, p < 0.001) compared to other exercises. In addition, significant differences were observed in the time (ms) required to reach peak RVD (F = 2.86, p = 0.036). No significant differences were detected between MP and BP exercises in the time (ms) required to reach peak RVD (p > 0.05). Neither were differences observed between exercises modalities in the portion of the concentric phase (%) needed to reach peak RVD (p > 0.05).
In the relative contribution (%) of the total concentric phase duration, significant differences were detected in peak velocity when lifting lighter loads (BP-EC and BP-C vs. MP-C; p < 0.01). However, no differences were produced between BP-EC vs. BP-C and MP-EC vs. MP-C at each % of 1RM (p > 0.05) (see Table 2). Moreover, no significant differences were observed in the braking phase at each %1RM between exercises (p > 0.05) (see Table 2).
Table 2.
Relative contribution (%) of the total concentric phase duration at the time of peak acceleration, peak velocity, and braking phase.
No significant differences in peak velocity were produced between exercises (p > 0.05) (see Figure 2A). Significant differences were detected between exercises in peak and mean power output until reaching peak velocity (F = 55.86, p < 0.001; F = 41.88, p < 0.001, respectively) (see Figure 2B,C). Significant differences were detected between exercises in mean power output until reaching the braking phase (F = 40.85, p < 0.001) (see Figure 2D).
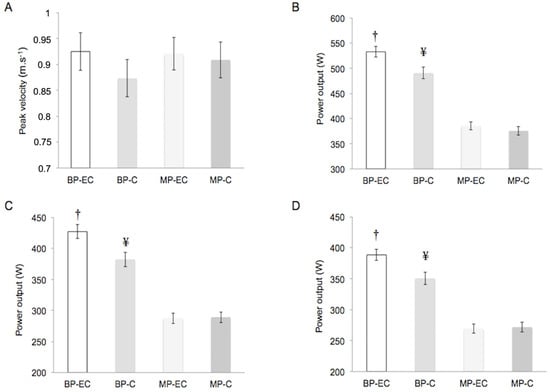
Figure 2.
Movement velocity and power output data recorded in the military press (MP) and bench press (BP) tests. (A) Peak velocity. (B) Peak power output up to peak velocity. (C) Mean power output up to peak velocity. (D) Mean power output up to braking phase. Abbreviations: C = concentric; EC = eccentric–concentric. † Significantly different to BP-C, MP-EC, MP-C (p ≤ 0.01). ¥ Significantly different to MP-EC, MP-C (p < 0.001). Data are presented as mean of all loads lifted during the isoinertial strength test.
Peak acceleration was higher in BP-EC (F = 7.99, p < 0.001) than in other exercises (see Figure 3A). Significant differences were detected between exercises in terms of the portion of the concentric phase (%) at which peak acceleration was detected (F = 3.47, p = 0.16) (see Figure 3B), or acceleration up until peak velocity was observed (F = 7.83, p < 0.001) (see Figure 3C). However, no differences were observed between exercises in the portion of the concentric phase where acceleration up to the braking phase took place (p > 0.05) (see Figure 3D).
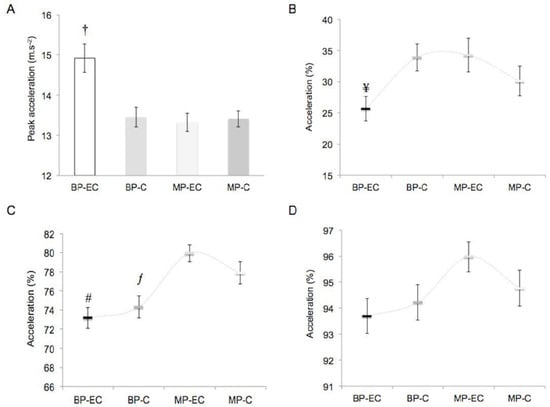
Figure 3.
Acceleration data in the military press (MP) and bench press (BP) tests. (A) Peak acceleration. (B) Portion of the concentric phase (%) at which peak acceleration was detected. (C) Portion of the concentric phase (%) where acceleration up to the peak velocity was detected. (D) Portion of the concentric phase (%) where acceleration up to the braking phase was detected. Abbreviations: C = concentric; EC = eccentric–concentric. † Significantly different to BP-C (p = 0.001), MP-EC (p = 0.001), MP-C (p = 0.002). ¥ Significantly different to BP-C and MP-EC (p < 0.05). # Significantly different to MP-EC (p < 0.001) and MP-C (p = 0.021). ƒ Significantly different to MP-EC (p = 0.003).
The reliability of measurements was analyzed according to bar peak velocity and acceleration. ICCs recorded for PV and acceleration in BP and MP were significant (p < 0.001).
In BP exercise (BP-EC vs. BP-C), ICCs were 0.94 (CI 95%: 0.92–0.96) for peak velocity and 0.88 (CI 95%: 0.84–0.91) for acceleration.
In MP exercise (MP-EC vs. MP-C) ICCs were 0.96 (CI 95%: 0.94–0.97) for peak velocity and 0.93 (CI 95%: 0.90–0.95) for acceleration.
The CVs for the PV measures were 7.9% in the BP and 6.2% in MP. The CVs for the acceleration were 9.2% in the BP and 4.2% in MP exercise.
4. Discussion
In this strength diagnosis, the EC and C phases of the resistance exercises BP and MP were compared. According to our data, the eccentric muscle action effectively contributed to enhancing peak RVD, peak RFD, power output (mean and peak), and 1RM in BP, increasing acceleration without improving peak velocity during the concentric phase. In contrast, the pre-stretch preceding the concentric movement did not improve kinetic and kinematic performance in the MP.
The positive effects observed in kinetic and kinematic variables in BP-EC are consistent with the results of other studies in which SSC and load effects were detected in strength, velocity, and power output during jump performance [10,21]. Similar effects were noted in upper limb resistance exercises [11]. In this study, average velocity, average and peak force, and average and peak power output were significantly increased for the SSC bench throws compared to the concentric bench throws. The highest mean power output was produced at the 30% (563 W) and 45% (560 W) loads during the SSC bench throws [11]. However, mean power output was higher in this study compared to our results (~560 w vs. ~365 w, respectively). Probably, the type of exercise was a key factor in noticing these differences in power output [11]. This could be interpreted as upper limbs showing explosive movement characteristics similar to those of the lower limbs after a SSC (jumps). However, the different kinetic and kinematic response to MP observed here indicates a need for further studies designed to address the SSC in other traditional resistance exercises of the upper limbs.
The trend of recent studies has been to examine the kinetic and kinematic behavior, including a pause between the eccentric and concentric phases, in order to minimize the contribution of the rebound effect [8,9]. This would allow for more reproducible, consistent measurements during isoinertial strength tests [7]. However, we consider it is best to carry out the isoinertial strength test with or without countermovement depending on the specific movement patterns evaluated. A prolonged pause between eccentric and concentric muscle actions is not an usual resistance training practice, and it could diminish the ecological validity of the measures [22], especially if reliability is only minimally affected between EC vs. C phases.
To our knowledge, this is the first study to examine RVD behavior in traditional resistance exercises under isoinertial strength test conditions comparing the EC vs. C phases. RVD is considered an important performance indicator [16,17] for motor patterns or sport modalities in which body mass and/or the mass of an object need to be quickly displaced [18]. The presence of the SSC gave rise to a greater RVD in the BP but not in the MP.
The behavior of acceleration up to peak velocity is critical to interpret the role of the RVD in resistance exercises. Certainly, peak velocity is a relevant factor reflecting performance in resistance exercises [18]. In our study, peak velocity was similar in all four exercise sequences examined, a finding in line with the results of a prior study [11], in which no peak velocity differences between EC vs. C actions were found. As an explanation for this lack of effect of the countermovement on peak velocity, we propose that the recovery of stored elastic energy and agonist muscle innervation produced by the stretch reflex only increased the early stage of the concentric action, and its effect was diminished in later stages [11].
In contrast, the eccentric action produced prior the concentric phase resulted in a greater peak acceleration in the BP-EC exercise sequence compared to other exercises, and also this peak acceleration was detected earlier at the onset of the concentric phase (see Figure 2A,B). For example, the pre-stretch in BP-EC caused the faster acceleration of the barbell at the beginning of the concentric phase compared to BP-C. Hereafter, acceleration continued to increase to a point where it was slightly higher, lower, or similar to that recorded for BP-C. From here on, both acceleration curves progressed to reach peak velocity and the braking phase in both exercises (see Figure 4A).
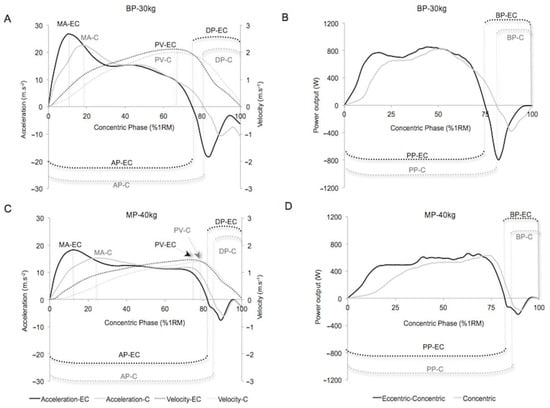
Figure 4.
Example of differences between eccentric–concentric (EC) vs. concentric (C) phases when lifting the same light load for a representative subject. (A) Acceleration and velocity curves in bench press. (B) Power output curves in bench press. (C) Acceleration and velocity curves in military press. (D) Power output curves in military press. Abbreviations used in A,C: AP = acceleration phase; DP = deceleration phase; MA = peak acceleration; PV = peak velocity. Abbreviations used in B,D: BP = braking phase; PP = propulsive phase.
Although the purpose of this study was not to gain in depth knowledge of the muscle activation produced in several muscle actions, it is also tempting to speculate that the eccentric phase was crucial to improve concentric performance in the BP, presumably because the pre-stretch confers a state of maximum muscle activation before the concentric contraction begins [23], and at the onset of the same (50–100 ms) mainly in the triceps and pectoralis major [11]. Theoretically, muscle activation was the determinant for the earlier load acceleration produced during the concentric phase. Nevertheless, we observed that the eccentric action effect was modified depending on the load lifted.
Hence, light and medium loads led to a greater peak acceleration as well as its earlier appearance in BP-EC (see Figure 4A) as opposed to heavy loads (see Figure 5A). In contrast, no significant changes in peak acceleration were observed between the EC and C sequences of the MP, although the same trend in the curves as in BP was observed. For light loads, peak acceleration was produced slightly earlier in MP-EC than MP-C (see Figure 4C). When lifting heavy loads, acceleration curves were similar in both BP and MP (see Figure 5C).
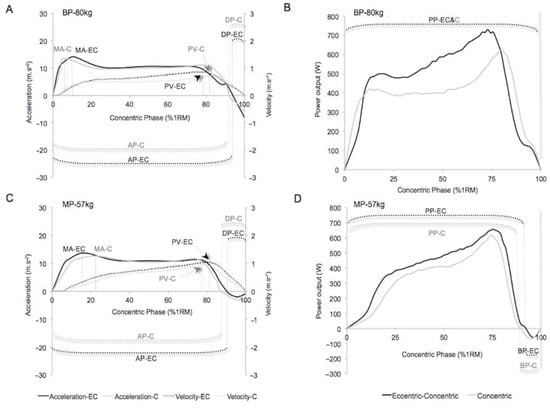
Figure 5.
Example of differences between eccentric–concentric (EC) vs. concentric (C) phases when lifting the same heavy load for a representative subject. (A) Acceleration and velocity curves in bench press. (B) Power output curves in bench press. (C) Acceleration and velocity curves in military press. (D) Power output curves in military press. Abbreviations used in A,C: AP = acceleration phase; DP = deceleration phase; MA = peak acceleration; PV = peak velocity. Abbreviations used in B,D: BP = braking phase; PP = propulsive phase.
As in a previous study [11], our kinematic results suggest that peak velocity should not be considered a differential factor indicating the performance of resistance exercises of the upper limbs involving similar agonist muscle groups (e.g., BP pectoralis, triceps, deltoids, and MP deltoids, and triceps) irrespective of the muscle action involved. On the other hand, the acceleration produced up to the point when peak velocity is reached does seem to be a good diagnostic variable, since peak acceleration and the time at which it occurs during the concentric action is conditioned by the type of muscle action and the exercise executed.
The fact that in BP the presence of the eccentric phase increases barbell acceleration and that this acceleration is also produced earlier during the concentric movement, indicates, at least in theory, an improved ability to apply force over a short time (relationship RFD—time or force). In effect, data reported confirm that SSC enhances the capacity to produce force quickly, improving the performance in BP-EC, as in previous studies [24], but this effect of RFD or its production time (ms) was not observed for the MP. Indeed, the RFD is an important strength diagnostic variable especially linked to performance in resistance training [25], jumping [26], weightlifting [27], and throwing [28].
Obviously, if RFD is enhanced in BP-EC, it stands to reason that the force–velocity relationship (power) will be greater in each stage of the power output curve. Mean and peak power output were improved in BP-EC over BP-C (mean 13%, peak 10%), as reported in similar studies [11,29] in which improvements in power by the SSC (8%–18%) were produced. In addition, power output produced up to peak velocity (peak velocity 9%, mean velocity 12%) and the braking phase (mean and peak approx. 11%) were increased in BP-EC, in proportion with the absolute values obtained in mean and peak power. However, power output levels were similar again between MP-EC and MP-C.
Our data also reflect increases in power output to reach approximately 50% of the concentric curve performed with light loads in BP-EC and BP-C (see Figure 4B); yet when heavier loads were used in BP and light and heavy loads in MP, power improvements were produced in close to 80% of the concentric curve (see Figure 4D, Figure 5B,D).
In the BP-EC tests, the greater power output observed could be largely attributed to the use of elastic energy stored during the eccentric action of the countermovement [30,31]. It has been described that during the eccentric phase of a countermovement plantar flexion, medial gastrocnemius muscle fibers contracted isometrically, and greater power output levels could be due to the elastic recoil of tendinous tissues [32].
Probably, these mechanisms in BP-EC, as part of the negative work absorbed by the muscle–tendon unit when the barbell descends towards the chest (eccentric phase), could be stored by the series elastic components as elastic energy [33]. Conversely, the similar responses observed in MP-EC vs. MP-C may be explained by a longer transition period from the eccentric to concentric movement, causing a decrease in the reuse of stored elastic energy. This could determine a longer time spent by the bar in the sticking region, reducing the force in the acceleration phase up to peak velocity. The coupling time was not measured in our study; hence, a longer transition period between both muscle actions is purely speculative.
With regards to the differences observed between BP and MP in our strength diagnosis (RFD, strength—1RM, power), we propose they could be attributed to changes in muscle architecture and arm muscle moments produced by body position. A mechanical disadvantage as occurs in MP is produced when the arm is lifted to an angle over 90º, because the deltoid muscle gradually shortens, and this induces a progressive loss in muscular strength [34]. In contrast, in BP, mechanical optimization is obtained with a glenohumeral abduction [35] of 90º, which is the angle normally used in BP.
To end this discussion, it is important to highlight that there were no differences in the times at which the peak velocity and braking phase were produced at each relative intensity (% 1RM) between BP-EC vs. BP-C and MP-EC vs. MP-C.
It therefore seems that the times of peak velocity and braking phase vary according to load and resistance exercise modality but not according to muscle action. Further, lighter loads displaced at high movement velocities increased the duration of the braking phase and led to the earlier appearance of peak velocity. As the load increased and movement velocity was reduced, the braking phase decreased, and peak velocity was achieved later.
The main limitation of this study was that participants were young practitioners of resistance training and its results are not therefore transferrable to high performance athletes, individuals with greater experience in resistance training, or women. In addition, our findings are restricted to performance of isoinertial strength tests on Smith machines, and the results cannot be extrapolated to free weights.
5. Conclusions
The kinematic and kinetic responses observed in the MP and BP were conditioned by the muscle action involved and the loading conditions applied. The eccentric muscle action prior to the concentric movement emerged as a key factor to improve performance in BP. However, the SSC does not seem to have the same effect in other traditional resistance exercises, such as MP.
Author Contributions
J.L.M.-M., and M.V.G.-C. conceived and designed the experiments; J.H.-L., P.G.-F., J.L.M.-M., and M.V.G.-C. performed the experiments; M.V.G.-C. analyzed the data; J.H.-L., P.G.-F., J.L.M.-M., and M.V.G.-C. contributed reagents/materials/analysis tools; M.V.G.-C. wrote the paper. All authors read and approved the final manuscript.
Funding
This research received no external funding.
Institutional Review Board Statement
This investigation was approved by the Ethics Committee of the TecnoCampus, Pompeu Fabra University (IC 13/2018) and was performed according to the principles and policies of the Declaration of Helsinki.
Informed Consent Statement
Informed written consent for participation was gained from all participants.
Data Availability Statement
Data are presented in the manuscript; further information is available upon request data.
Acknowledgments
The authors would like to thank the participants involved in this research for their cooperation.
Conflicts of Interest
The authors declare no conflict of interest.
References
- Siff, M. Biomechanical foundation of strength and power training. Biomechanics in Sport. In Biomechanics in Sport: Performance Enhancement and injury Prevention; Zatsiorsky, V., Ed.; Blackwell Scientific Ltd.: London, UK, 2001; pp. 103–139. [Google Scholar]
- Cronin, J.B.; Hing, R.D.; McNair, P.J. Reliability and validity of a linear position transducer for measuring jump performance. J. Strength Cond. Res. 2004, 18, 590–593. [Google Scholar] [PubMed]
- Kawamori, N.; Haff, G.G. The optimal training load for the development of muscular power. J. Strength Cond. Res. 2004, 18, 675–684. [Google Scholar] [PubMed]
- Cronin, J.B.; McNair, P.J.; Marshall, R.N. Force-velocity analysis of strength- training techniques and load: Implications for training strategy and research. J. Strength Cond. Res. 2003, 17, 148–155. [Google Scholar] [CrossRef]
- Jidovtseff, B.; Croisier, J.L.; Scimar, N.; Demoulin, C.; Maquet, D.; Crielaard, J.M. The ability of isoinertial assessment to monitor specific training effects. J. Sports Med. Phys. Fit. 2007, 47, 55–64. [Google Scholar]
- Abernethy, P.J.; Jurimae, J. Cross-sectional and longitudinal uses of isoinertial, isometric, and isokinetic dynamometry. Med. Sci. Sports Exerc. 1996, 28, 1180–1187. [Google Scholar] [CrossRef]
- Pallarés, J.G.; Sánchez-Medina, L.; Pérez, C.E.; De La Cruz-Sánchez, E.; Mora-Rodríguez, R. Imposing a pause between the eccentric and concentric phases increases the reliability of isoinertial strength assessments. J. Sports Sci. 2014, 32, 1165–1175. [Google Scholar] [CrossRef]
- Sánchez-Medina, L.; Perez, C.E.; Gonzalez-Badillo, J.J. Importance of the propulsive phase in strength assessment. Int. J. Sports Med. 2010, 31, 123–129. [Google Scholar] [CrossRef] [PubMed]
- Sánchez-Medina, L.; González-Badillo, J.J.; Pérez, C.E.; Pallarés, J.G. Velocity- and power-load relationships of the bench pull vs. bench press exercises. Int. J. Sports Med. 2014, 35, 209–216. [Google Scholar] [CrossRef]
- Komi, P.V. Physiological and biomechanical correlates of muscle function: Effects of muscle structure and stretch-shortening cycle on force and speed. Exerc. Sport Sci. Rev. 1984, 12, 81–122. [Google Scholar] [CrossRef]
- Newton, R.U.; Murphy, A.J.; Humphries, B.J.; Wilson, G.J.; Kraemer, W.J.; Häkkinen, K. Influence of load and stretch shortening cycle on the kinematics, kinetics and muscle activation that occurs during explosive upper-body movements. Eur. J. Appl. Physiol. 1997, 75, 333–342. [Google Scholar] [CrossRef]
- Cavagna, G.A.; Saibene, F.P.; Margaria, R. Effect of negative work on the amount of positive work performed by an isolated muscle. J. Appl. Physiol. 1965, 20, 157–158. [Google Scholar] [CrossRef]
- González-Badillo, J.J.; Marques, M.C. Relationship between kinematic factors and countermovement jump height in trained track and field athletes. J. Strength Cond. Res. 2010, 24, 3443–3447. [Google Scholar] [CrossRef]
- Cronin, J.; McNair, P.; Marshall, R. Magnitude and decay of stretch-induced enhancement of power output. Eur. J. Appl. Physiol. 2001, 84, 575–581. [Google Scholar] [CrossRef]
- Buckthorpe, M.; Erskine, R.M.; Fletcher, G.; Folland, J.P. Task-specific neural adaptations to isoinertial resistance training. Scand. J. Med. Sci. Sports 2015, 25, 640–649. [Google Scholar] [CrossRef] [PubMed]
- Brown, L.E.; Whitehurst, M. The effect of short-term isokinetic training on force and rate of velocity development. J. Strength Cond. Res. 2003, 17, 88–94. [Google Scholar] [PubMed]
- Murray, D.P.; Brown, L.E.; Zinder, S.M.; Noffal, G.J.; Bera, S.G.; Garrett, N.M. Effects of velocity-specific training on rate of velocity development, peak torque, and performance. J. Strength Cond. Res. 2007, 21, 870–874. [Google Scholar] [PubMed]
- Khamoui, A.V.; Brown, L.E.; Nguyen, D.; Uribe, B.P.; Coburn, J.W.; Noffal, G.J.; Tran, T. Relationship between force-time and velocity-time characteristics of dynamic and isometric muscle actions. J. Strength Cond. Res. 2011, 25, 198–204. [Google Scholar] [CrossRef] [PubMed]
- Baechle, T.R.; Earle, R.W. Essentials of Strength Training and Conditioning, 3rd ed.; Human Kinetics: Champaign, IL, USA, 2008. [Google Scholar]
- Garnacho-Castaño, M.V.; López-Lastra, S.; Maté-Muñoz, J.L. Reliability and validity assessment of a linear position transducer. J. Sports Sci. Med. 2015, 14, 128–136. [Google Scholar]
- Komi, P.V.; Bosco, C. Utilization of stored elastic energy in leg extensor muscles by men and women. Med. Sci. Sports Exerc. 1978, 10, 261–265. [Google Scholar]
- Reilly, T.; Morris, T.; Whyte, G. The specificity of training prescription and physiological assessment: A review. J. Sports Sci. 2009, 27, 575–589. [Google Scholar] [CrossRef] [PubMed]
- Bobbert, M.F.; Gerritsen, K.G.; Litjens, M.C.; Van Soest, A.J. Why is countermovement jump height greater than squat jump height? Med. Sci. Sports Exerc. 1996, 28, 1402–1412. [Google Scholar] [CrossRef] [PubMed]
- Earp, J.E.; Kraemer, W.J.; Cormie, P.; Volek, J.S.; Maresh, C.M.; Joseph, M.; Newton, R.U. Influence of muscle–tendon unit structure on rate of force development during the squat, countermovement, and drop jumps. J. Strength Cond. Res. 2011, 25, 340–347. [Google Scholar] [CrossRef]
- Oliveira, A.S.; Corvino, R.B.; Caputo, F.; Aagaard, P.; Denadai, B.S. Effects of fast velocity eccentric resistance training on early and late rate of force development. Eur. J. Sport Sci. 2016, 16, 199–205. [Google Scholar] [CrossRef]
- De Ruiter, C.J.; Vermeulen, G.; Toussaint, H.M.; De Haan, A. Isometric knee-extensor torque development and jump height in volleyball players. Med. Sci. Sports Exerc. 2007, 39, 1336–1346. [Google Scholar] [CrossRef] [PubMed]
- Haff, G.G.; Carlock, J.M.; Hartman, M.J.; Kilgore, J.L.; Kawamori, N.; Jackson, J.R.; Morris, R.T.; Sands, W.A.; Stone, M.H. Force-time curve characteristics of dynamic and isometric muscle actions of elite women Olympic weightlifters. J. Strength Cond. Res. 2005, 19, 741–748. [Google Scholar]
- Stone, M.H.; Sanborn, K.; O’BRYANT, H.S.; Hartman, M.; Stone, M.E.; Proulx, C.; Hruby, J. Maximum strength-power-performance relationships in collegiate rowers. J. Strength Cond. Res. 2003, 17, 739–745. [Google Scholar]
- Cronin, J.; McNair, P.; Marshall, R. The role of maximal strength and load on initial power production. Med. Sci. Sports Exerc. 2000, 32, 1763–1769. [Google Scholar] [CrossRef]
- Aura, O.; Komi, P.V. Effects of prestretch intensity on mechanical efficiency of positive work and on elastic behavior of skeletal muscle in stretch–shortening cycle exercise. Int. J. Sports Med. 1986, 7, 137–143. [Google Scholar] [CrossRef] [PubMed]
- Bosco, C.; Viitasalo, J.T.; Komi, P.V.; Luhtanen, P. Combined effect of elastic energy and myoelectrical potentiation during stretch–shortening cycle exercise. Acta Physiol. Scand. 1982, 114, 557–565. [Google Scholar] [CrossRef]
- Kawakami, Y.; Muraoka, T.; Ito, S.; Kanehisa, H.; Fukunaga, T. In vivo muscle fibre behaviour during countermovement exercise in humans reveals a significant role for tendon elasticity. J Physiol. 2002, 540, 635–646. [Google Scholar] [CrossRef]
- Miyamoto, N.; Wakahara, T.; Sugisaki, N.; Murata, K.; Kanehisa, H.; Fukunaga, T.; Kawakami, Y. Effect of countermovement on elbow joint extension power–load characteristics. J. Sports Sci. 2010, 28, 1535–1542. [Google Scholar] [CrossRef] [PubMed]
- Bechtol, C.O. Biomechanics of the shoulder. Clin. Orthop. Relat. Res. 1980, 145, 37–41. [Google Scholar] [CrossRef]
- Clemons, J.M.; Aaron, C. Effect of grip width on the myoelectric activity of the prime movers in the bench press. J. Strength Cond. Res. 1997, 11, 82–87. [Google Scholar]


Publisher’s Note: MDPI stays neutral with regard to jurisdictional claims in published maps and institutional affiliations. |
© 2021 by the authors. Licensee MDPI, Basel, Switzerland. This article is an open access article distributed under the terms and conditions of the Creative Commons Attribution (CC BY) license (http://creativecommons.org/licenses/by/4.0/).