Abstract
The effect of the weaving architecture and the z-binding yarns, for 2D and 3D woven composites on the low-velocity impact resistance of carbon fibre reinforced composites, is investigated and benchmarked against noncrimp fabric (NCF). Four architectures, namely: NCF, 2D plain weave (2D-PW), 3D orthogonal: plain (ORT-PW) and twill (ORT-TW), were subjected to 15 J impact using a 16 mm-diameter, 6.7 kg hemispherical impactor. Nondestructive techniques, including ultrasonic C-scanning, Digital Image Correlation (DIC) and X-ray computed tomography (CT) were used to map and quantify the size of the induced barely visible impact damage (BVID). The energy absorption of each architecture was correlated to the damage size: both in-plane and in-depth directions. The 3D architectures, regardless of their unit-cell size, demonstrated the highest impact resistance as opposed to 2D-PW and the NCF. X-ray CT segmentation showed the effect of the higher frequency of the z-binding yarns, in the ORT-PW case, in delamination and crack arresting even when compared to the other 3D architecture (ORT-TW). Among all the architectures, ORT-PW exhibited the highest damage resistance with the least damage size. This suggests that accurate design of the z-binding yarns’ path and more importantly its frequency in 3D woven architectures is essential for impact-resistant composite structures.
1. Introduction
Due to their unique mechanical properties, composite materials have been largely used in high-tech manufacturing techniques. Their unique performance is clear in their high strength, stiffness, and low density. Such properties find their way into use in the aerospace, automotive, and civil engineering industries. Despite the high demand for such materials, there are some concerns about the durability and tolerance of these structures. Damage eventually occurs to composites even without being noticed; this is known as barely visible impact damage (BVID). The recurrence of these dents is dangerous for the structural health of composites as they promote instability within the structure leading to catastrophic failures. These low-velocity impacts are sometimes undetectable on closer inspection, since they manifest as cracks propagating through the matrix and interlaminar delamination within the composites [1]. The underlying reasons for the BVID have gained a lot of interest, and different approaches were tackled to identify the key parameters to enhance the impact resistance and minimise the damage to composites [2,3,4,5]. For instance, Shyr and Pan [6] studied the behaviour of low-velocity impact on three glass fibre laminates (multiaxial warp-knit, plain woven, nonwoven mat) with different thicknesses. The results showed that the dominant failure in thick laminate is the fibre fracture, while the thin laminate suffers from delamination mostly. In addition, by considering the fabric structure, they reported that noncrimp fabric (NCF) was more efficient in the impact resistance among composites laminate. Francesconi and Aymerich [7] analysed the low-velocity impact on a thin unstitched and stitched cross-ply laminate as a unidirectional carbon/epoxy tape. Two different cross ply lay–ups were used: [02/902]s and [902/02]s. It was found that the chosen combination of the lay-up is an important factor in stitching improvement. The results suggested that there was an increase in the postimpact residual properties in the stitched samples under high energy impacts. It was also reported that by increasing the stitch density the damage area was decreased by 33% and 16% for stitching densities of 25.4 and 12.7 mm, respectively [8]. Tan et al. [9] and Yoshimura et al. [10] conclude that the importance of the thicker stitch thread becomes obvious as the impact energy becomes higher.
Chen and Hodgkinson [11] studied the low-velocity impact on three different fibre architectures in terms of two factors: the energy absorption and the damage resistance. Those preform under investigation were unidirectional (UD), NCF and 3D woven architecture. They found that the 3D woven composites resist the most damages between the other samples while the UD laminate is the highest structure to absorb the energy among all the tested samples. Umer et al. [12] studied the energy absorption in three different 3D architectures (orthogonal, angle interlock, layer-to-layer), and noticed that under 20 J, all the samples absorbed approximately 50% of the impact energy. As the impact energy increased to 40 J, the angle interlock and layer-to-layer absorbed almost all the impact energy, while the 3D orthogonal structure absorbed the least energy. A twofold improvement in energy dissipation was reported [1,11,12,13], owing that to the existence of the z-binding yarns in 3D orthogonal structure. Beside improving the energy absorption, it acts as a restraint to the delamination and structure failure [14,15]. Miao et al. [16] explained, utilising the experimental and numerical approaches, that the preventions of the delamination depend on the zig-zag formation of the damages through the composite structure. Nevertheless to the authors’ knowledge, no research in the open literature has investigated the effect of varying the unit-cell size of 3D woven composites on the impact damage resistance.
When it comes to BVID detection and quantification, many researchers [9,10,17,18,19,20,21,22] have been using various nondestructive testing (NDT) techniques such as: ultrasonic, acoustic emission (AE), X-ray and electromagnetics. These methods promote the ability to identify and inspect material for different types of damage such as: fibre breakage, matrix cracking and interlaminar delamination. Ultrasonic and X-ray computed tomography (CT) have been widely used as nondestructive testing techniques for composite materials [23,24,25,26]. In the case of ultrasonic, Perez et al. [18] used ultrasonic testing for UD carbon/epoxy symmetric stacking sequence [45°/0°/−45°/90°]5S. The damaged area through the thickness has been identified, and the correlation between delamination area and impact energy was established. However, X-ray CT damage characterisation of 3D woven composites due to impact did not receive enough attention due to the complexity of its analysis and segmentation. Thus, this study is an attempt to provide a comprehensive benchmark comparison for the impact damage resistance of NCF, 2D and 3D woven composites utilising different NDT techniques: ultrasonic, digital image correlation (DIC) and X-ray CT. Moreover, the effect of changing the path of the z-binding yarn and consequently the unit-cell size for 3D woven composites represents a key design parameter in this research. The impact damage resistance is characterised in the light of the macroscopic behaviour, the energy absorption and the size of damage induced by low-velocity impact for four different composite architectures and accurately quantified by the proposed NDT techniques.
2. Materials and Methods
2.1. Materials and Architectures’ Design
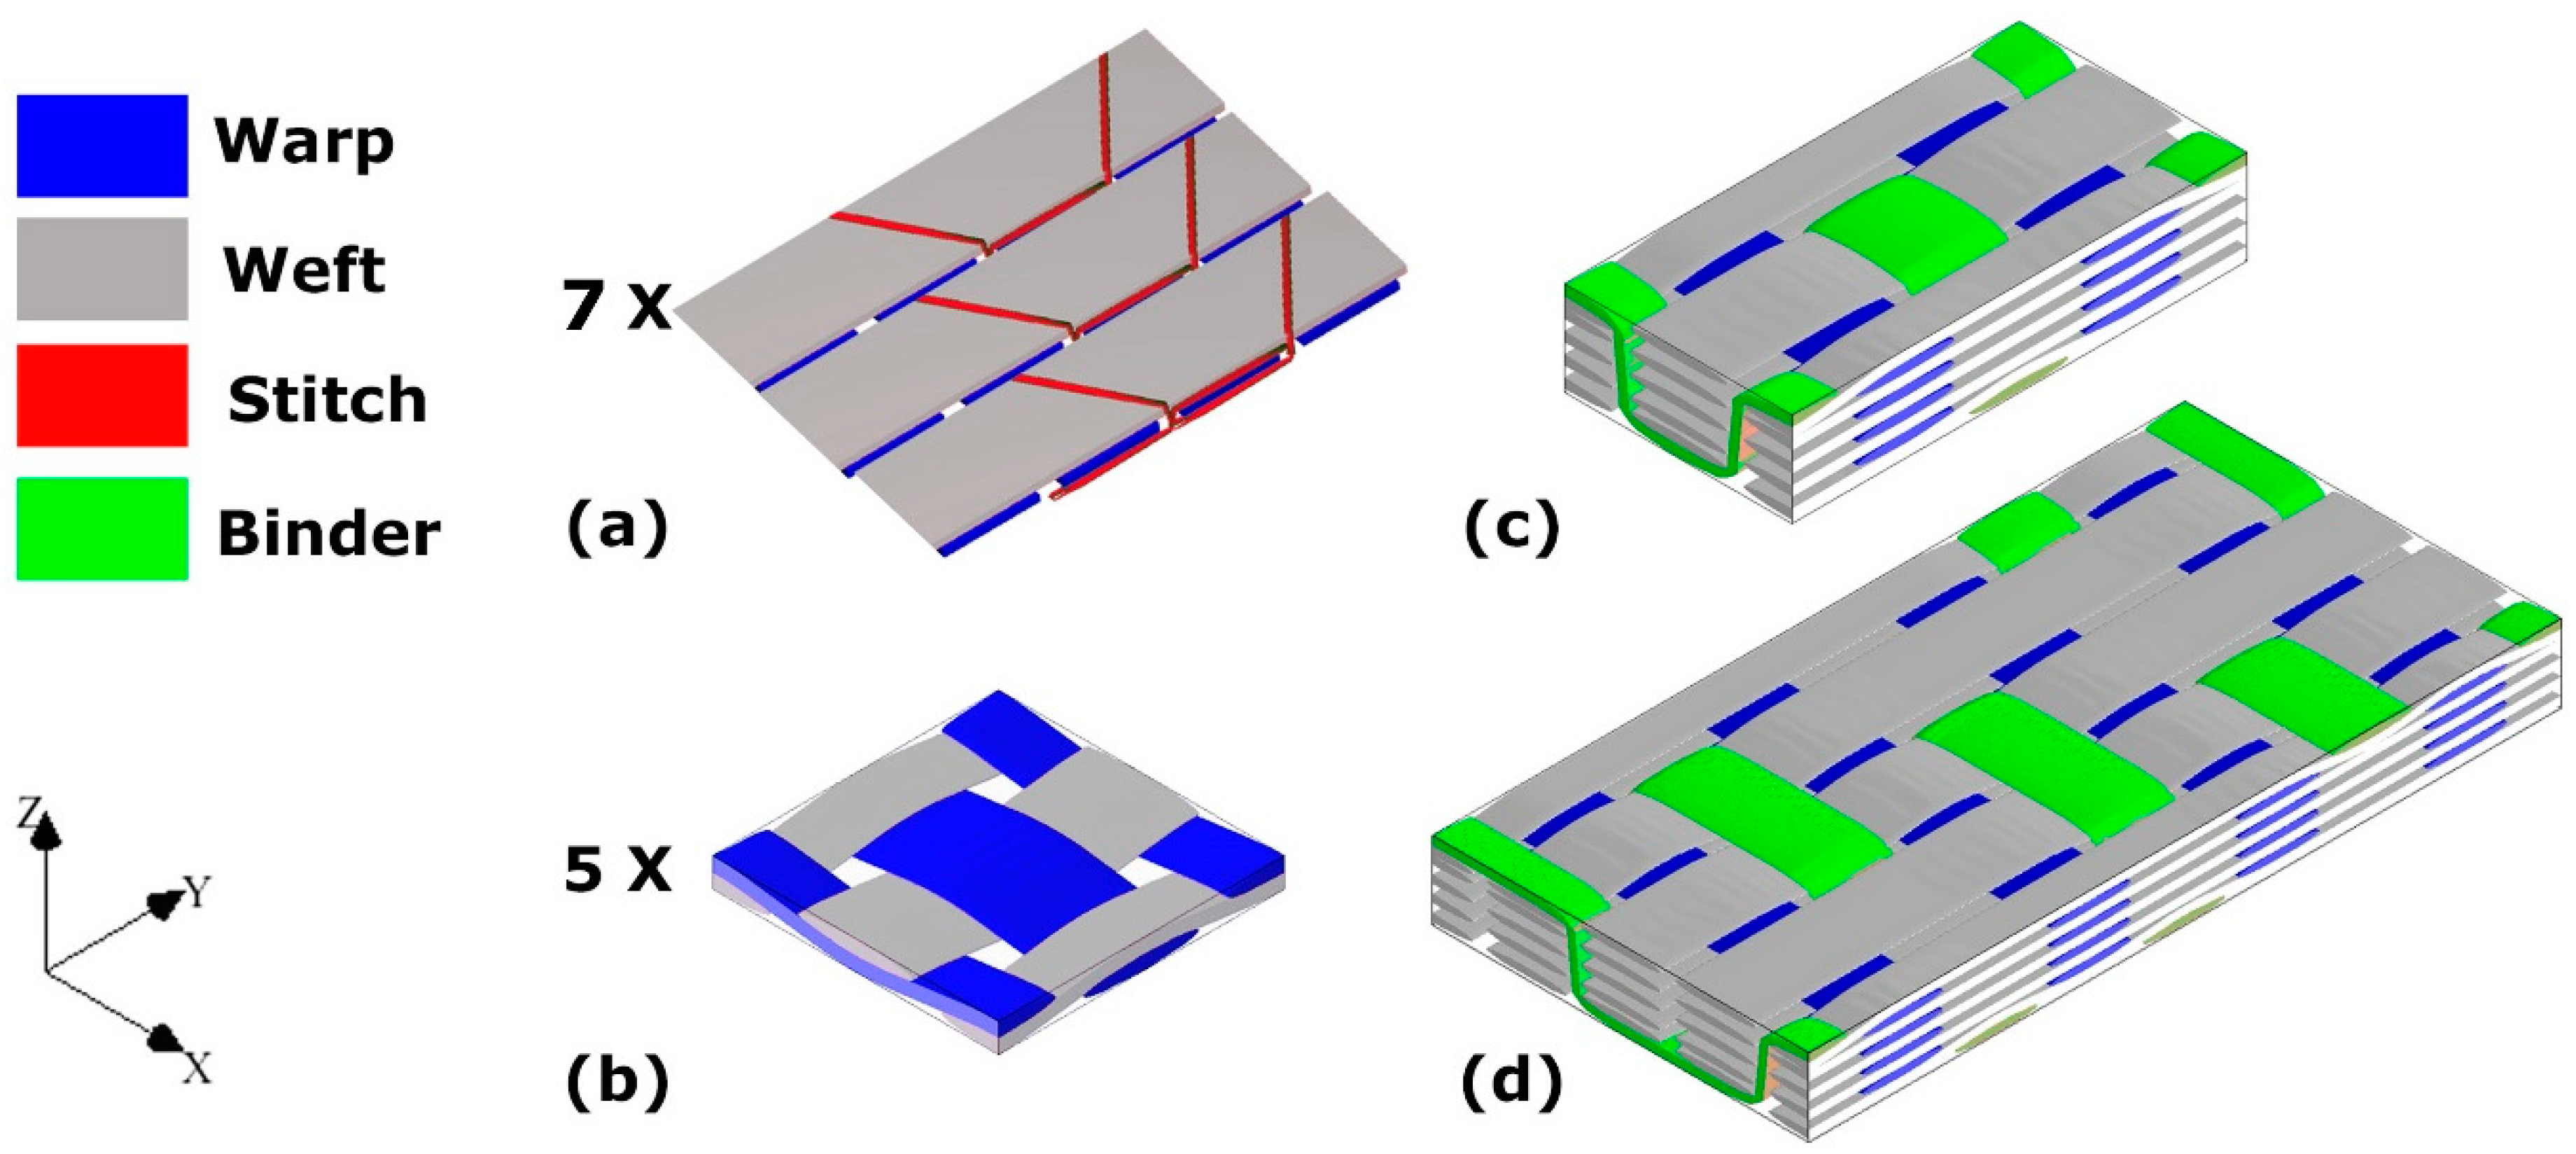
EAT-3D Composites Module, a newly developed weave-design program for technical weaving and complex composite structures, was used to design all the weaving architectures in this study. These architectures are referred to as: 2D plain (2D-PW), 3D plain orthogonal (ORT-PW) and twill (ORT-TW) weaves, each of which consists of 5 warp and 5 weft layers, including z-binding warp yarns. Figure 1 schematically summarises the unit-cells of the four different fabrics used in this study. The main difference between the two 3D orthogonal weaves is the z-binding yarn’s path, which translates into different unit-cell sizes. In the case of the ORT-TW (Figure 1d), the binding frequency, through the thickness, is half the binding frequency of the ORT-PW (Figure 1c). This unit-cell size variation is one of the main design parameters of this study as its effect on the impact resistance is detailed in Section 4.2.
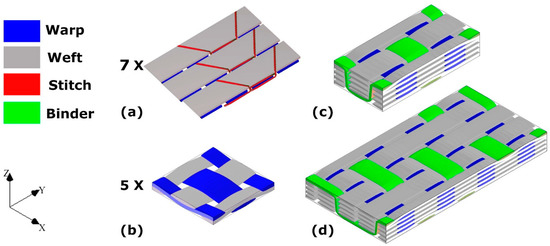
Figure 1.
Schematic of the different types of investigated composites: (a) noncrimp fabric (NCF), (b) 2D plain (2D-PW), (c) twill (orthogonal) and (d) ORT-TW (twill) (the warp yarns highlighted in blue, the weft yarns in grey, the through thickness z-binding yarns in green, and the stitch “polyester” yarns for the noncrimp fabric (NCF) in red).
Both the 2D and 3D weaves were produced using a modified DORNIER double-rapier FT-Dobby loom, equipped with a creel of 1100 positions of T700-12k carbon fibre bobbins. All the warp, weft and z-binding yarns were made using the same carbon fibre yarns with the same count (T700-12k). In order to be able to control the tension of the warp and z-binding yarns during the weaving process, the creel was equipped with a tension control system. All fabrics produced were balanced fabrics with the same warp and weft densities: 12.66 ends/cm and 12.66 picks/cm, respectively. For the NCF (Figure 1a) and the 2D-PW (Figure 1b) architectures, seven and five layers of the fabric were used, respectively, to produce the composite laminates with approximately the same areal density (~2000 GSM) as their 3D woven counterparts.
2.2. Composite Panels Manufacturing
All the composite flat panels, regardless of their architecture, were manufactured using a 500 mm × 500 mm resin transfer moulding (RTM) tool from Composite Integration Ltd. The target thickness of all laminates was ~2.5 mm which was controlled by introducing a shim of the same thickness in the RTM tool. This thickness yields ~50% fibre volume fraction for all the manufactured laminates. The resin system used was Gurit T-Prime 130-1, with a mixing ratio of 100/27 by wt% of resin/hardener. The RTM tool was preheated to 80 °C. The resin injection process was carried out while maintaining 2 bars of pressure and −1 bar of vacuum at the outlet pipe. As per the resin manufacturer datasheet, all panels were cured in the mould for 1 h at 80 °C. One panel was manufactured per each architecture resulting in four panels in total. Each panel was then cut into specimens with dimensions of 150 mm × 100 mm to produce enough repeats for the impact testing.
3. Experiment and Characterisation
3.1. Optical Microscopy
To prepare the composite specimens for the optical microscopy, samples were cut into (20 mm × 20 mm). Afterwards, they were cured in 30 mm diameter blocks of two-part epoxy resin. After curing, the blocks were polished as follows: 20 s using silicon carbide SiC-220, flatting them afterwards using SiC-1200 for 2 min, 4 min using 9-μ (MD-Plan), 4 min using 3-μ (MD-Dac), rinse for 2.5 min using OP-S and finally 1 min with water to clean the blocks from any OP-S traces. The polishing process parameters were: rotation speed of 150 rpm and applied force of 30 N. Once the specimens were ready, they were optically scanned using Alicona-IFM-G4 microscope.
3.2. Impact Testing
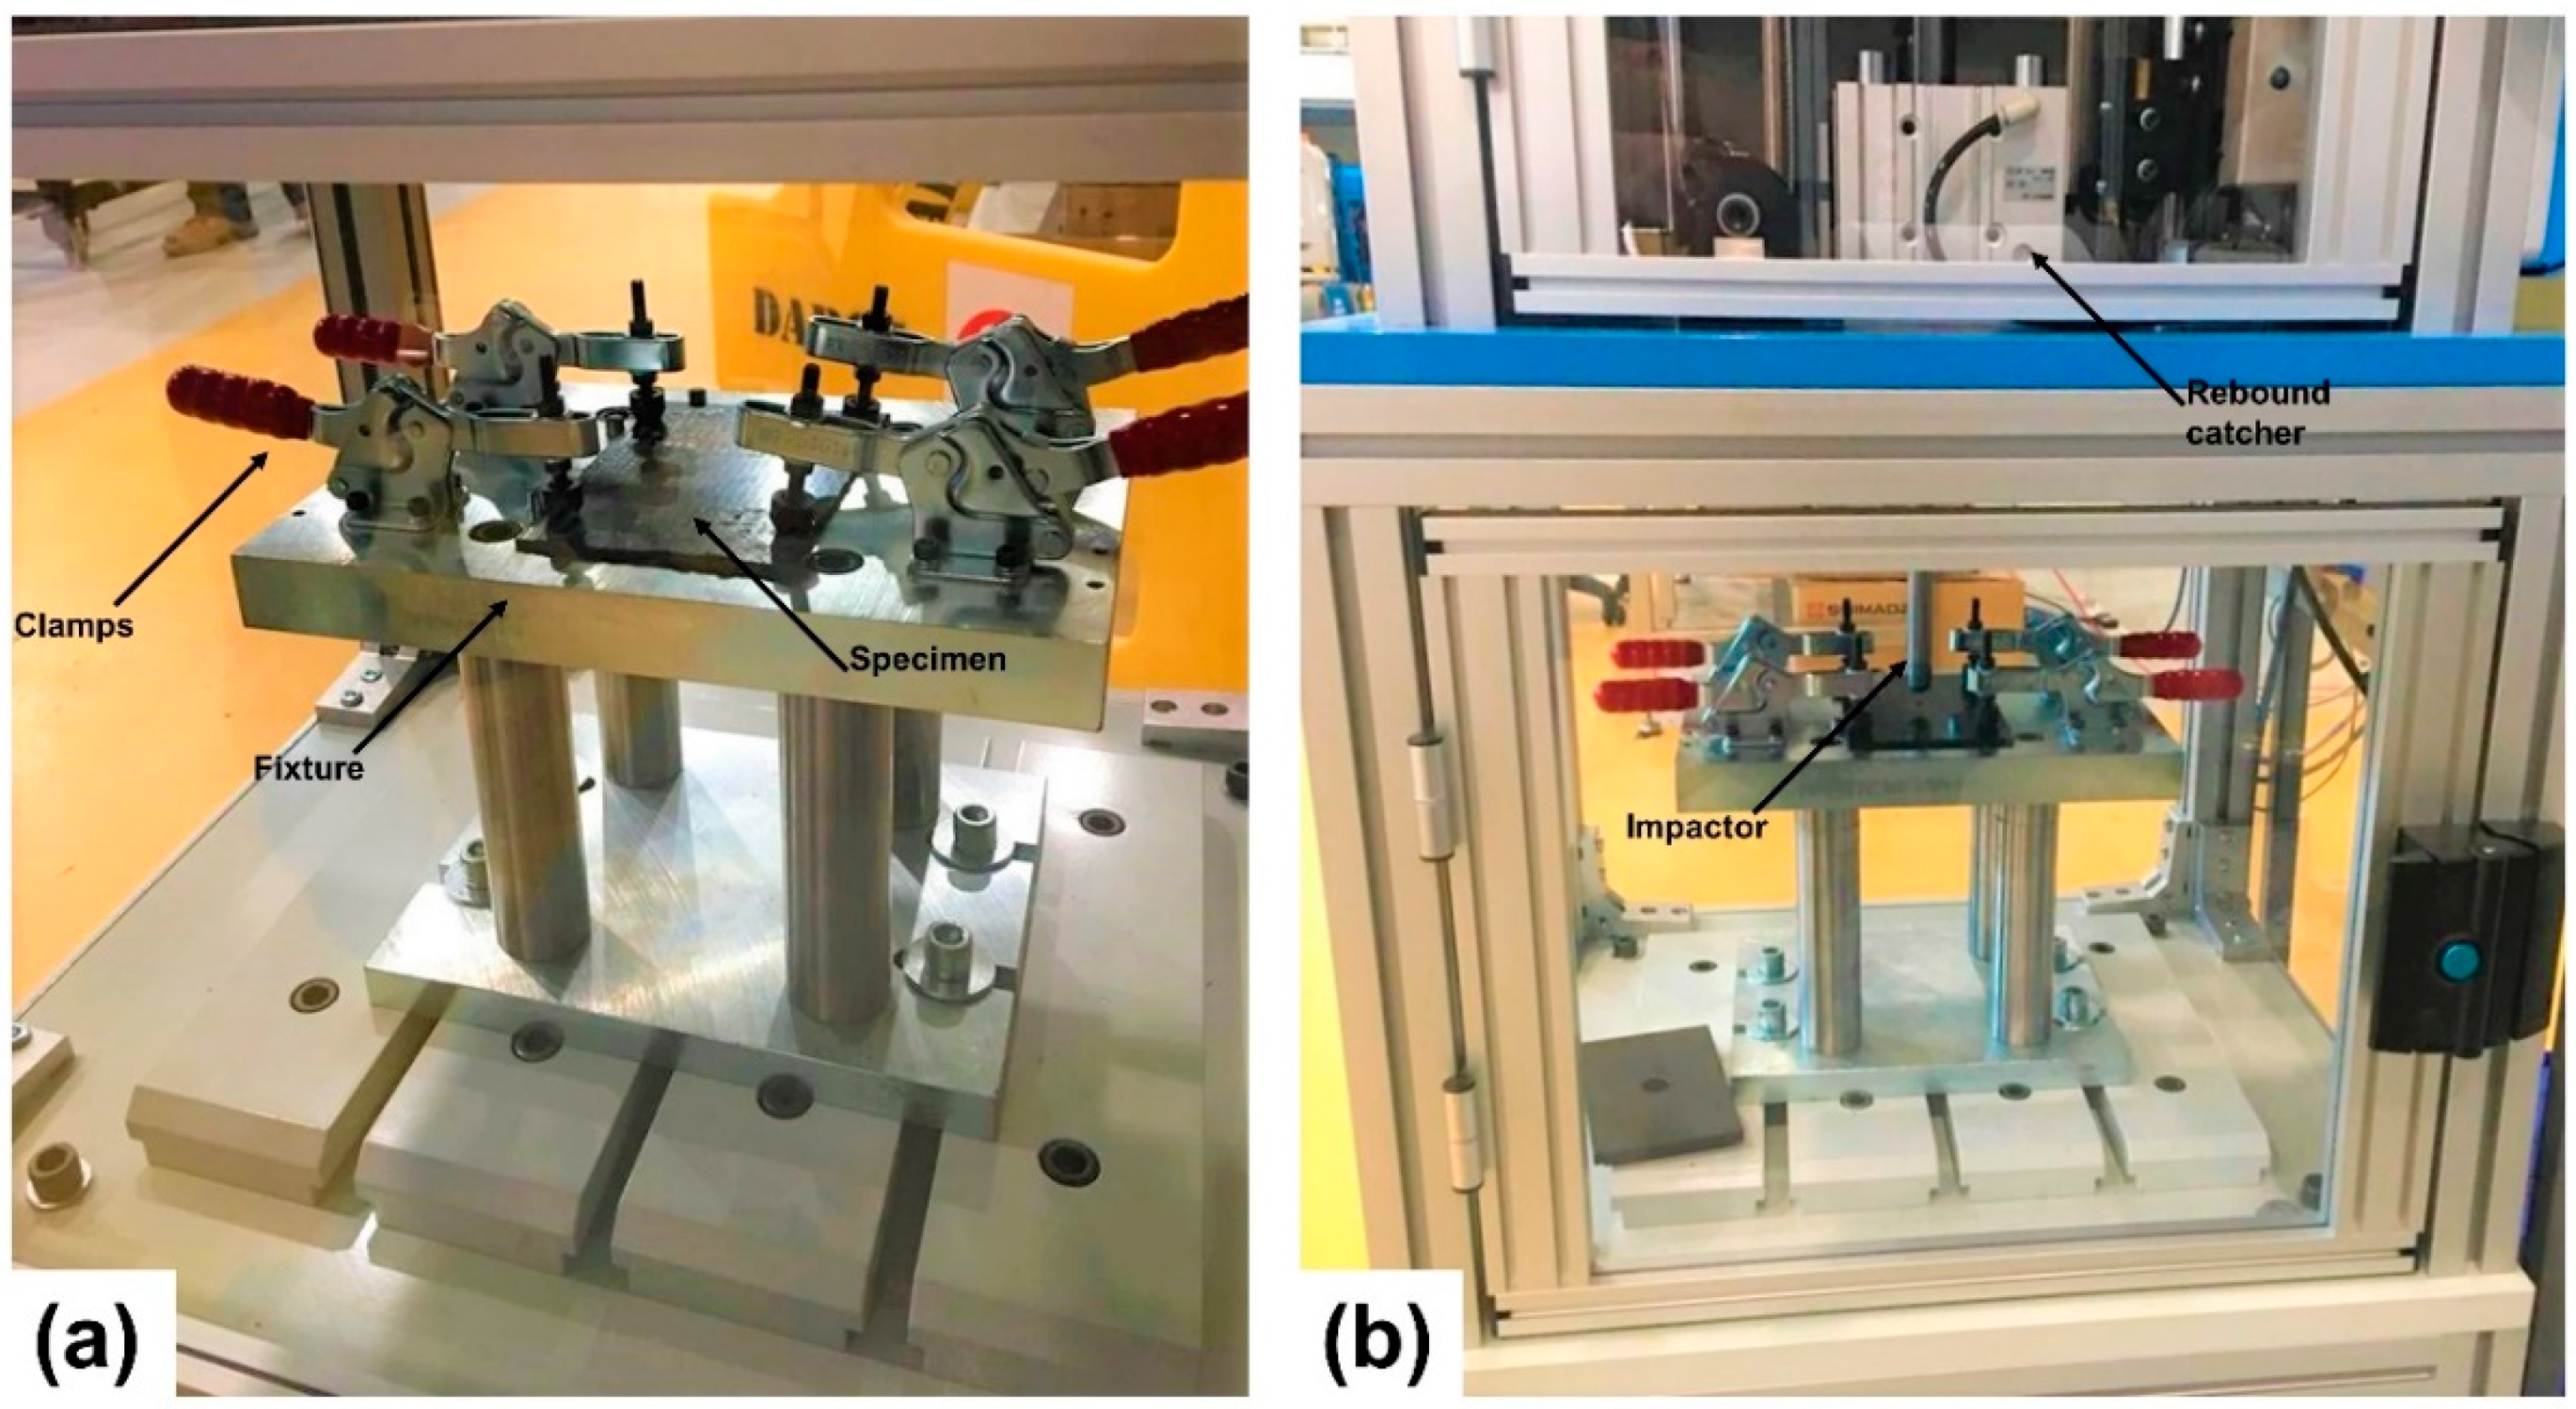
Using a drop-weight impact tester (IM1C-15) from Imatek Ltd. UK, impact testing for all specimens, 3 repeats per architecture, was carried out as per the ASTM D7136 [27] standard. The SI Units version of the standard was used. The clamping fixture of the specimens, according to the ASTM standard, should have a cut-out with an area of 125 × 75 mm2. All specimens were secured with four clamps to ensure they were fully restrained during the impact test (see Figure 2). A 16 mm diameter hemispherical impactor with a mass of approximately 6.7 kg was used to impact all the specimens in the centre. To avoid puncture of the specimens due to impact, initial trials were conducted with 15, 18, 20 and 25 J. The 15 J energy level was then chosen as the weakest architecture. “NCF” could not survive the higher energy levels. The force, velocity and displacement as a function of time were recorded during the testing. In addition, the drop-weight tower was equipped with a rebound catcher to ensure that the striker would only hit the specimen once and no damage accumulation due to multiple repeated impacts would occur.
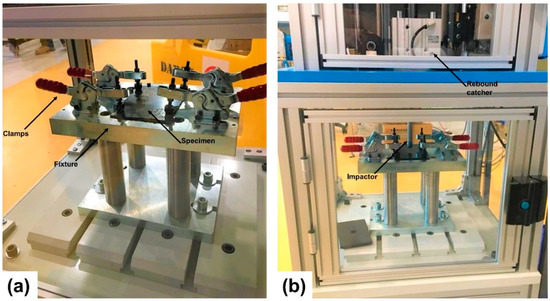
Figure 2.
Testing setup (a) before and (b) after impact.
3.3. Nondestructive Testing of the Impact-Induced Damage
3.3.1. Ultrasonic C-Scanning
As a nondestructive technique (NDT), ultrasonic C-scanning was used to get an idea of the extent of damage caused by the drop-weight impact tower and to provide more knowledge about the resistance of the various architectures of interest in this research. A Midas NDT system with Zeus software is the system used to scan the impacted specimens. It is fitted with one transmitter and one receiver with a frequency of 10 MHz, and the specimens have been mounted in-between. The diameter of the crystal and the nozzle were 10 and 8 mm, respectively. The used scanning velocity was 200 mm/min.
3.3.2. Digital Image Correlation (DIC)
Using a calibrated three-dimensional (3D) DIC system, the dent depth of the impacted specimens can be successfully determined [28]. Two 8-bit “Point Grey” cameras with “XENOPLAN 1.4/23” lenses were used, each of which has a resolution of 5 MP. For each specimen, on average, 15 speckle pattern images were recorded by the system using Vic-Snap 8 software from Correlated Solutions Inc. Each image had a size of (2048 × 1194) pixels, which corresponded to a field of view of approximately (120 × 70) mm2. Vic-3D 8 software was then used for the postprocessing of the captured images.
3.3.3. X-ray Computed Tomography (CT)
X-ray CT scans were performed for the impacted specimens, using a Nikon XTH-320 system, to determine the extent of the internal damage. With a 0.125 mm copper filter, the 225 kV source, with a reflective target, was used. The volume captured by the field of view had the dimensions of 22.5 × 19 × 5.5 mm3, resulting in a resolution of ~13.2 μm. The source current and voltage were set to 59 μA and 220 kV, respectively. Each radiograph had an exposure time of ~1.4 s. With ~3140 radiographs being collected over 360°, the total data acquisition time was ~1.25 h. After scanning, VGSTUDIO MAX software was used to reconstruct the 3D volume from the raw data.
4. Results and Discussion
4.1. Optical Microscopy
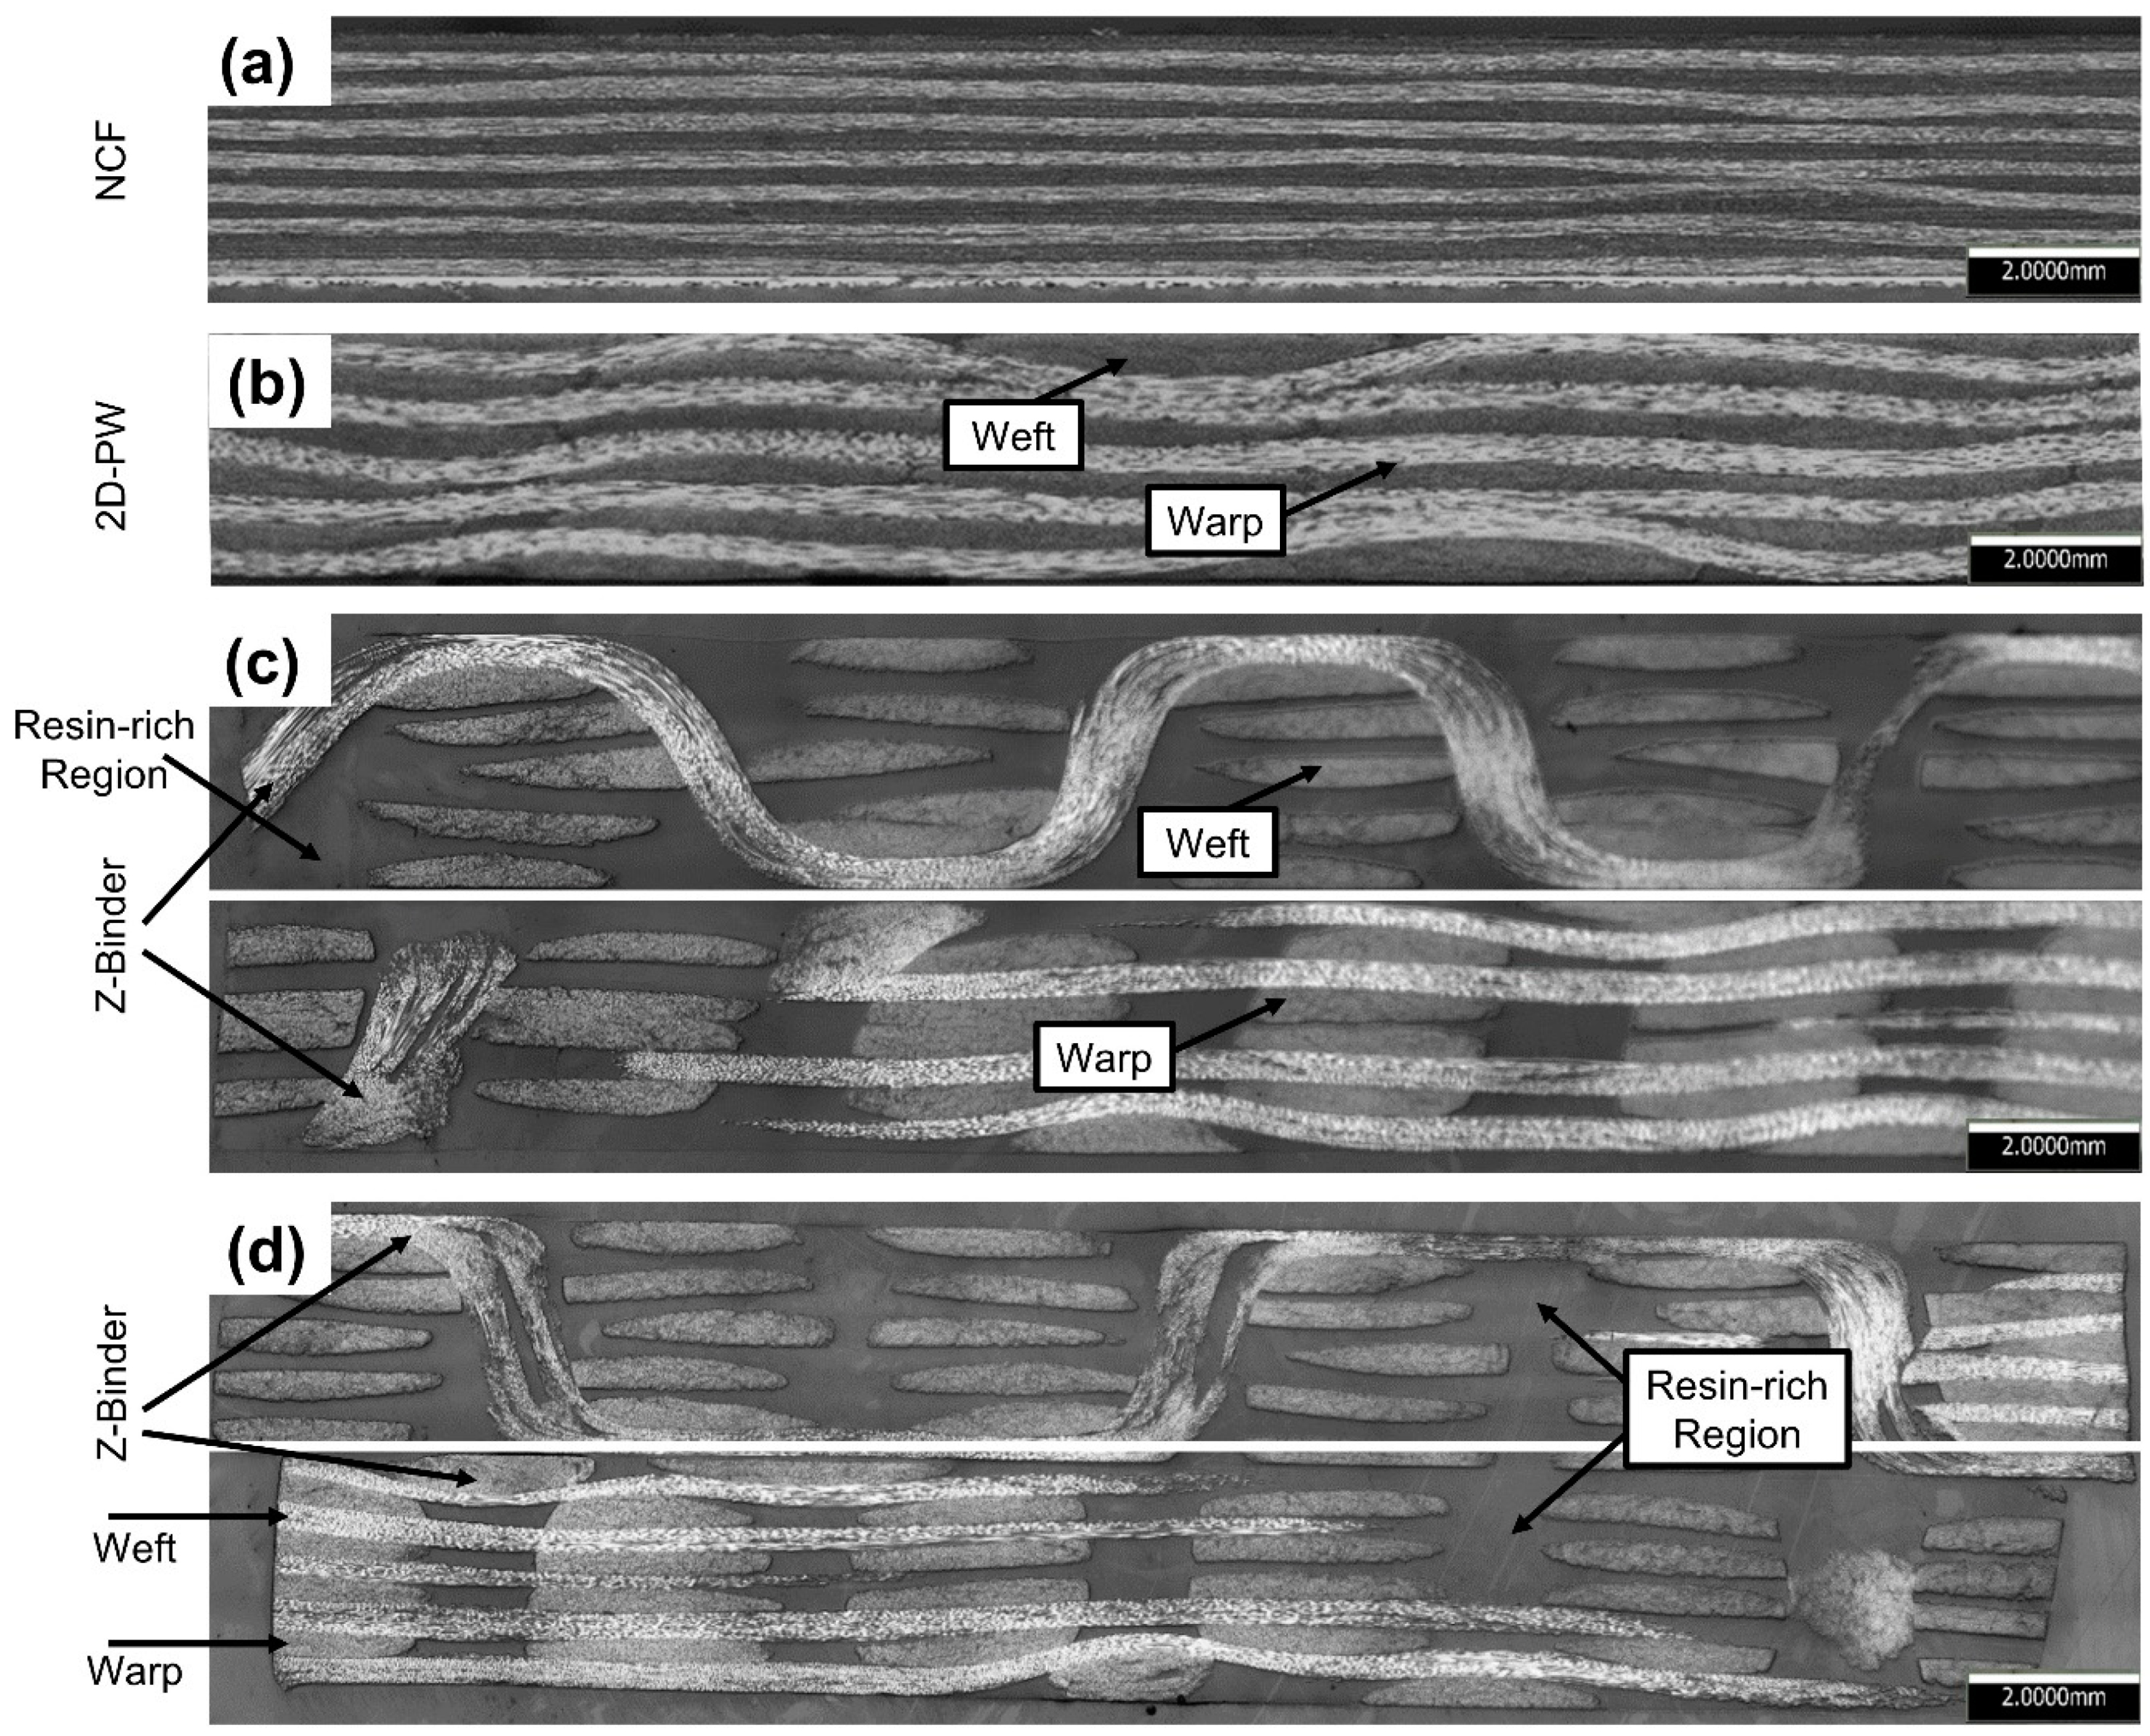
Images of the optical cross-sections were obtained for all architectures, namely: NCF, 2D-PW, ORT-PW and ORT-TW (see Figure 3). In the case of NCF (Figure 3a) and 2D-PW (Figure 3b), one cross-sectional image is shown for each along the warp direction. However, for the ORT-PW and ORT-TW, in order to fully inspect the microstructure of these complex architectures, micrographs are taken along both the warp and weft directions. All the optical cross-sectional images show no trace of voids in the microstructure, confirming the quality of the infusion process. The NCF specimen is characterised by straight yarns with minimal crimp as opposed to the 2D-PW and the 3D woven architectures. Moreover, as expected, due to the infusion process and compaction of the 3D preforms, some geometrical distortions of the cured laminates can be observed. This is even more significant in ORT-PW when it comes to the weft yarns being staggered (see Figure 3a). It is also observed in the nonuniform thickness of the z-binding yarns in the ORT-TW case (see Figure 3b), especially at the interlacement locations with the weft yarns. Clearly, the optical images confirm that all the manufactured specimens are void-free. However, the existence of the z-binding yarns resulted in relatively large resin-rich regions in the cured laminates, which is one of the well-known drawbacks of 3D woven composites. In addition, it is clear that in the case of ORT-PW architecture, the frequency and undulation of z-binding is higher than that of ORT-TW confirming that the ORT-TW is less crimped.
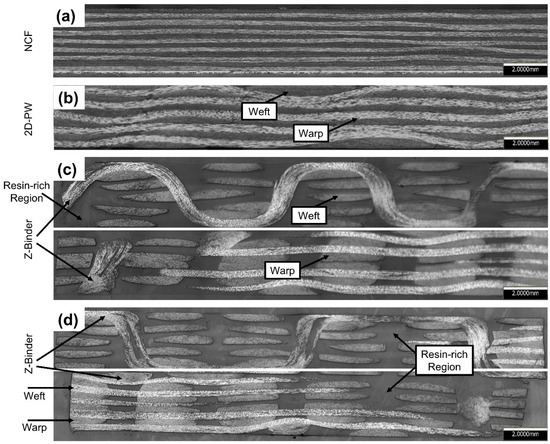
Figure 3.
Optical micrographs of composites cross-sections: (a) NCF, (b) 2D-PW, (c) ORT-PW and (d) ORT-TW. For ORT-PW and ORT-TW architectures, two micrographs were captured: along the warp (top image) and along the weft (bottom image).
4.2. Impact Testing
4.2.1. Impact Force–Displacement Analysis
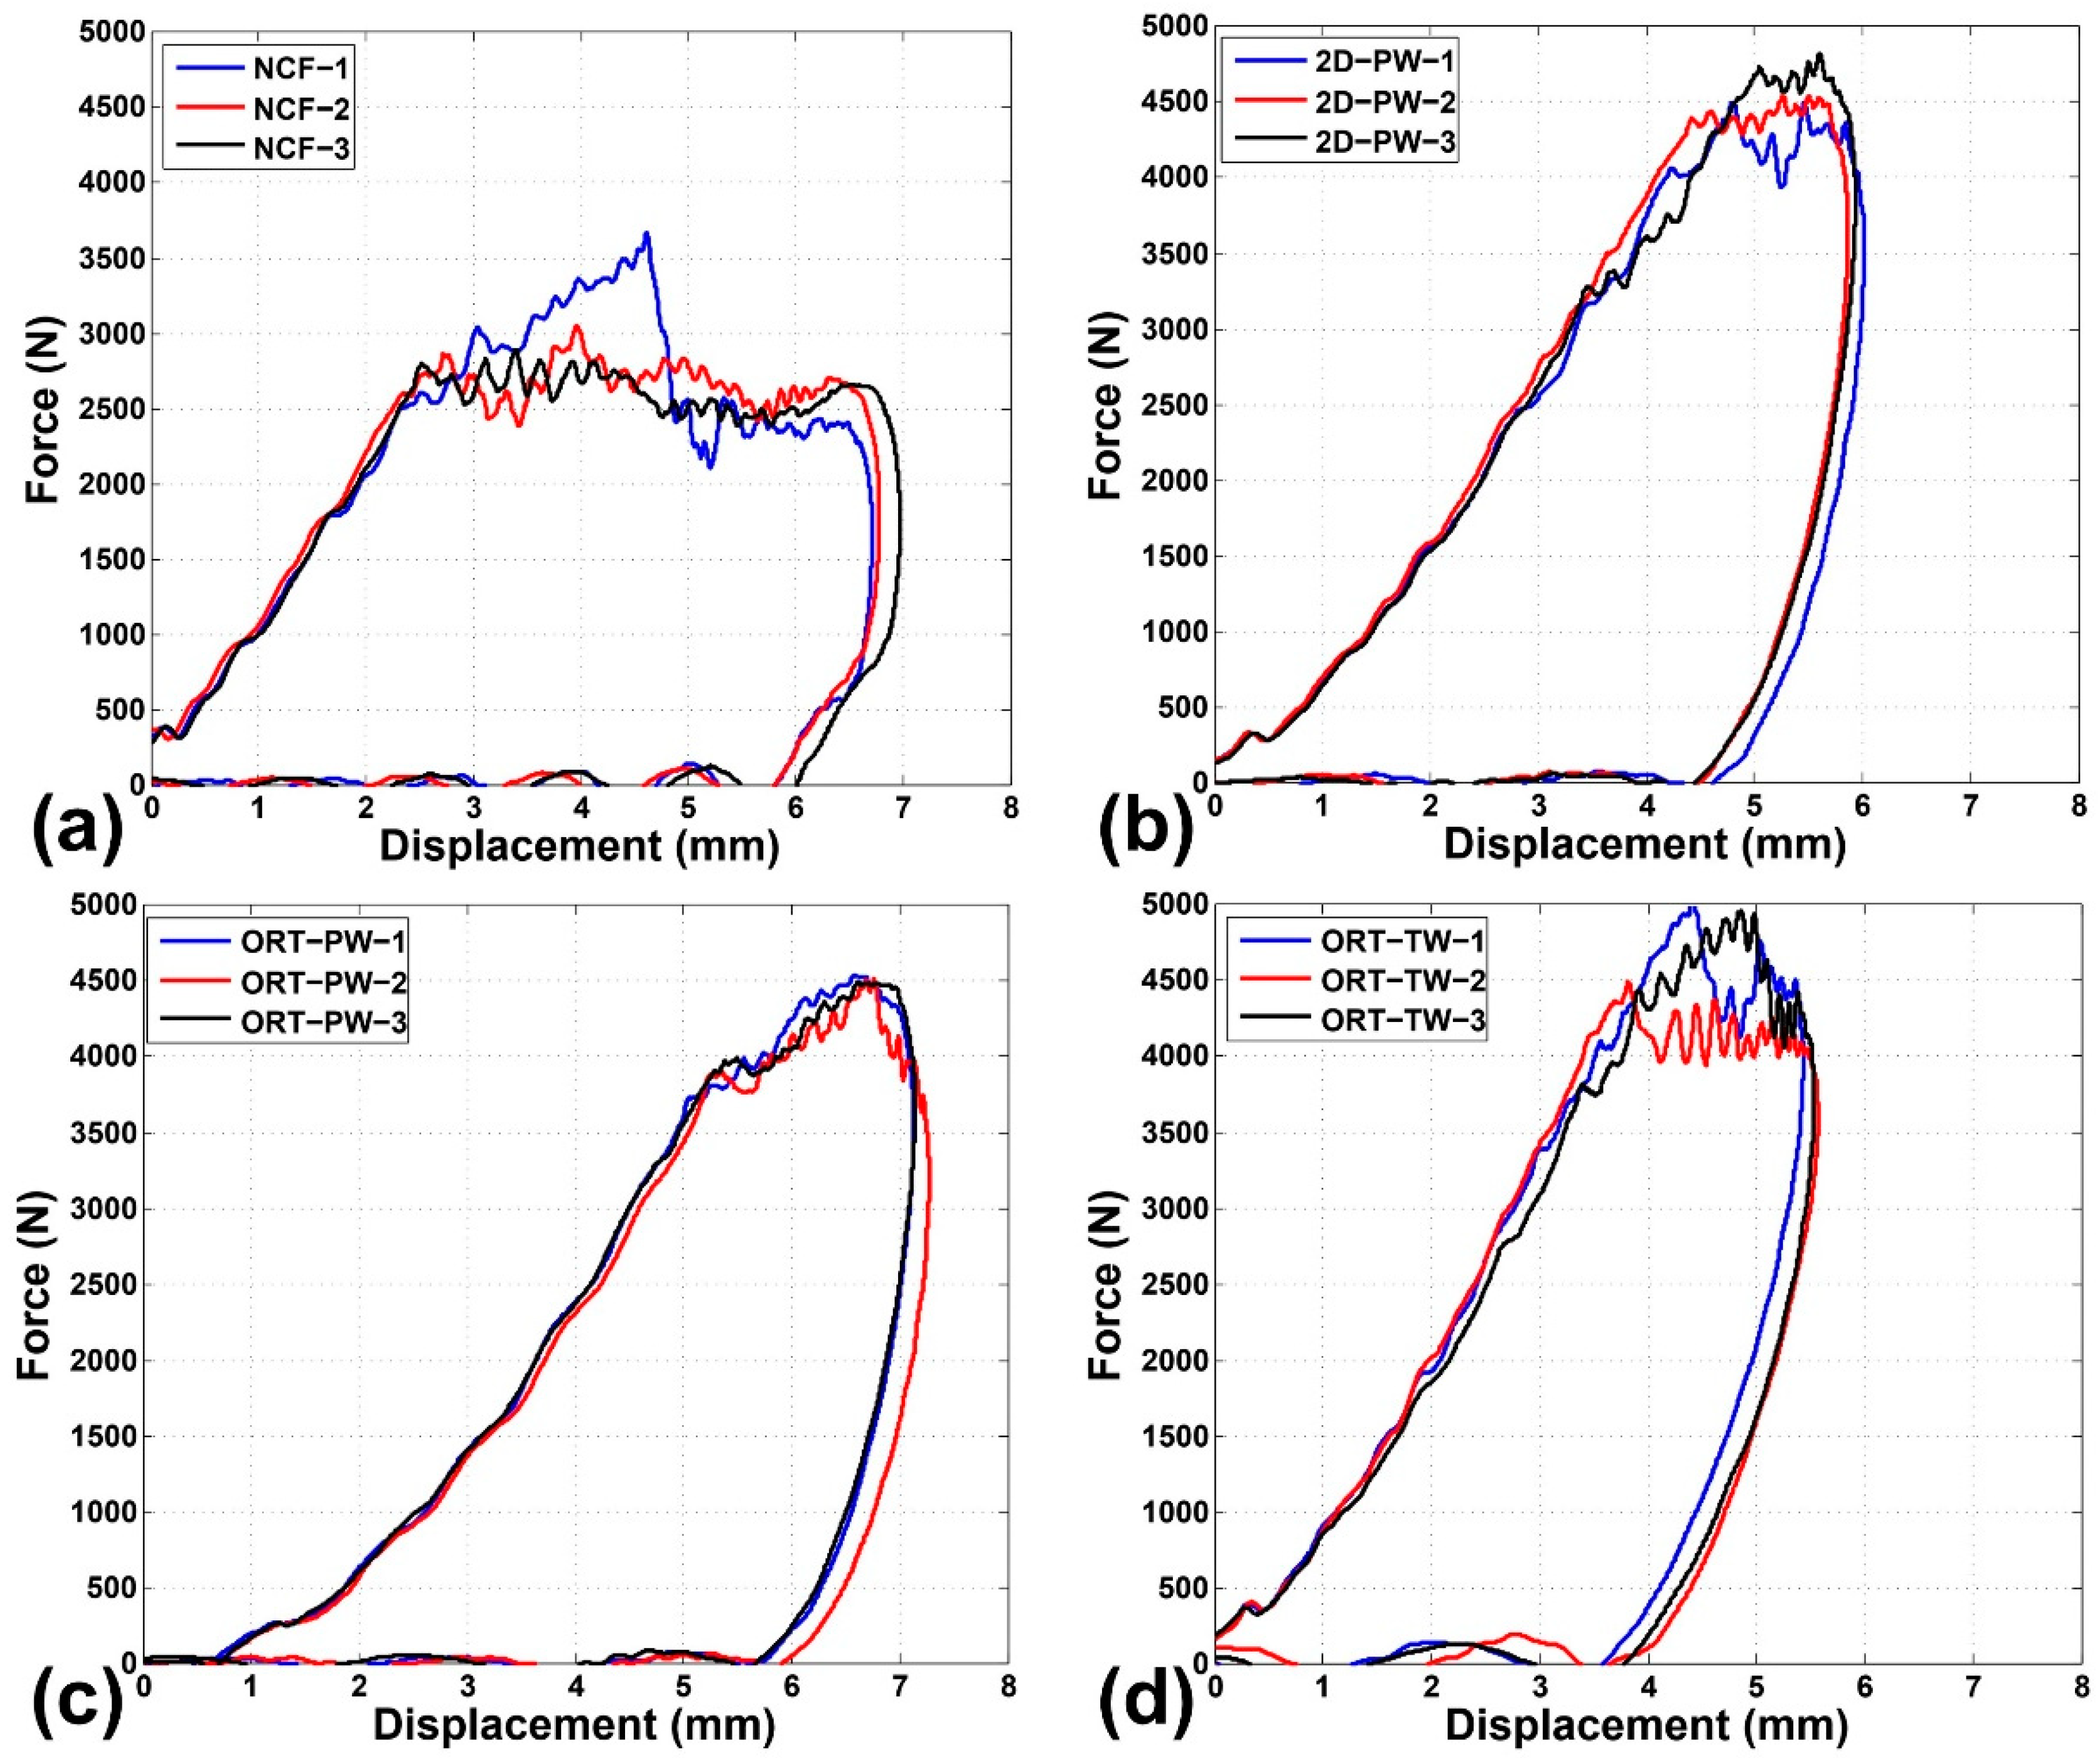
The impact force–displacement curves of the four impacted architectures are depicted in Figure 4. The displacement was calculated by numerically integrating the acceleration (the impact force divided by the mass of the impactor) as a function of time. The reproducibility of the test results and the repeatability of the impact response are confirmed by the small experimental scatter in all cases. In an impact test, the force increases linearly as a function of the displacement/time up to a maximum value when the impactor velocity changes direction. This can be accompanied by damage occurrence in the specimen, in the form of a sudden drop in the force. Afterwards, the force gradually decreases to zero and the impactor returns back to zero displacement. The stiffness of the specimen can be calculated as the slope of the initial linear segment of the force–displacement curve. A clear difference is noticed among the architectures in the sense that the NCF specimens experience the least maximum force of approximately 2500 N while all the other remaining architectures (2D-PW, ORT-PW and ORT-TW) have almost the same range of maximum force ~4500 N. However, the calculated stiffness of all the architectures is comparable (NCF: 954 ± 50, 2D-PW: 966 ± 29, ORT-PW: 963 ± 14 and ORT-TW: 1075 ± 70 N/mm). This suggests that the crimp and undulation in the 2D and 3D woven architectures have a negligible effect on the stiffness of the impacted specimens.
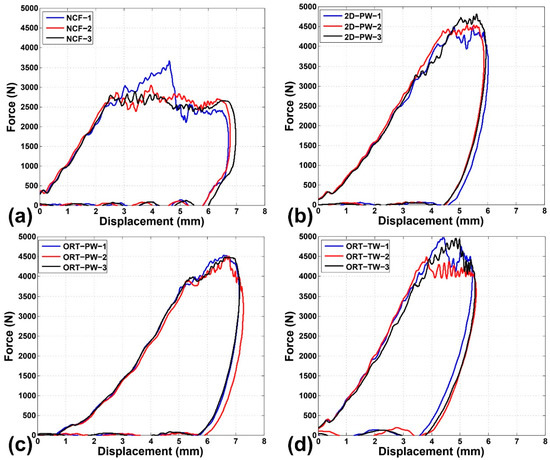
Figure 4.
Impact force–displacement curves for the impacted specimens: (a) NCF, (b) 2D-PW, (c) ORT-PW and (d) ORT-TW.
4.2.2. Damage Characterisation
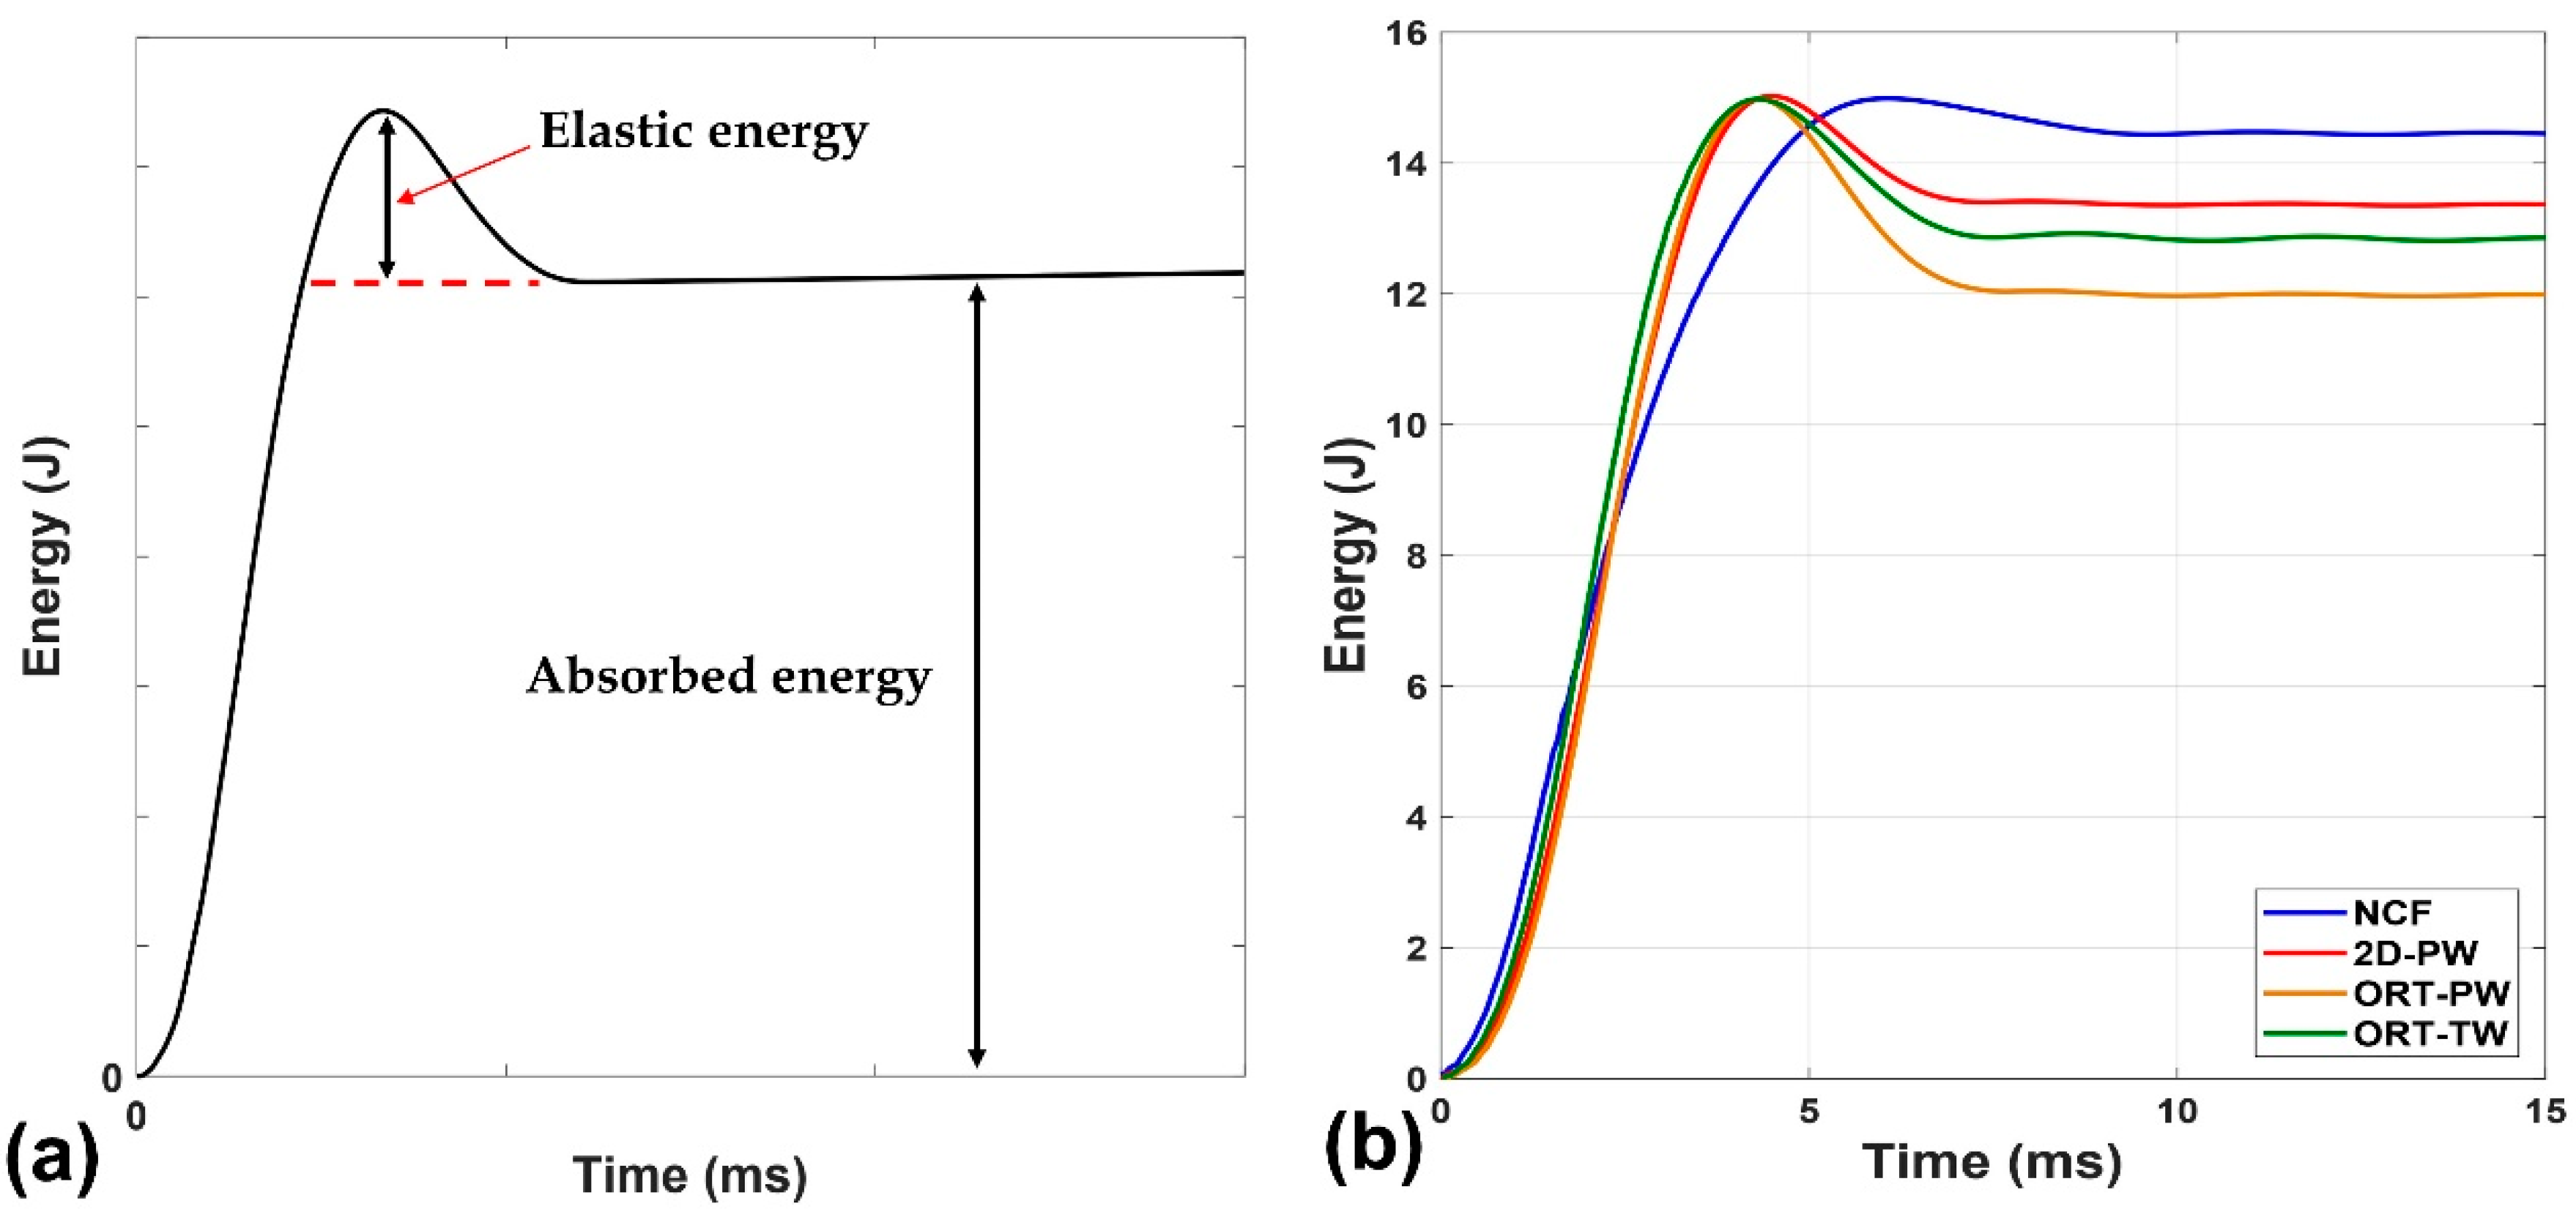
In an impact test, the majority of the energy is absorbed by the impacted specimen in the form of permanent induced damage while the remaining part of the energy is stored in the form of elastic energy due to the specimen deformation. As a function of time, the energy can be calculated by numerically integrating the area below the impact force–displacement curve. Figure 5a depicts a representative energy vs. time impact curve [29]. This curve clearly differentiates the elastic component of the energy from the absorbed energy component by the asymptotic dashed line shown (see Figure 5a). The higher the absorbed energy, the larger the damage induced in the specimen due to impact. When applying this principle on the comparison among the four tested architectures in this study (see Figure 5b), it is found that the NCF architecture absorbs the highest energy followed by the 2D-PW, then ORT-TW and finally the ORT-PW. This suggests that the induced damage size should be expected to follow the same pattern. This can be supported by the ultrasonic C-scanning results as well as the damage quantification using the X-ray CT data.
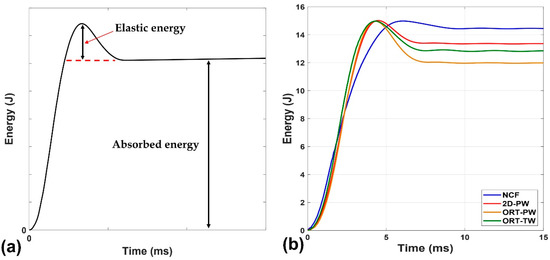
Figure 5.
Energy versus time: (a) schematic explaining the elastic and absorbed component and (b) representative sample for each architecture.
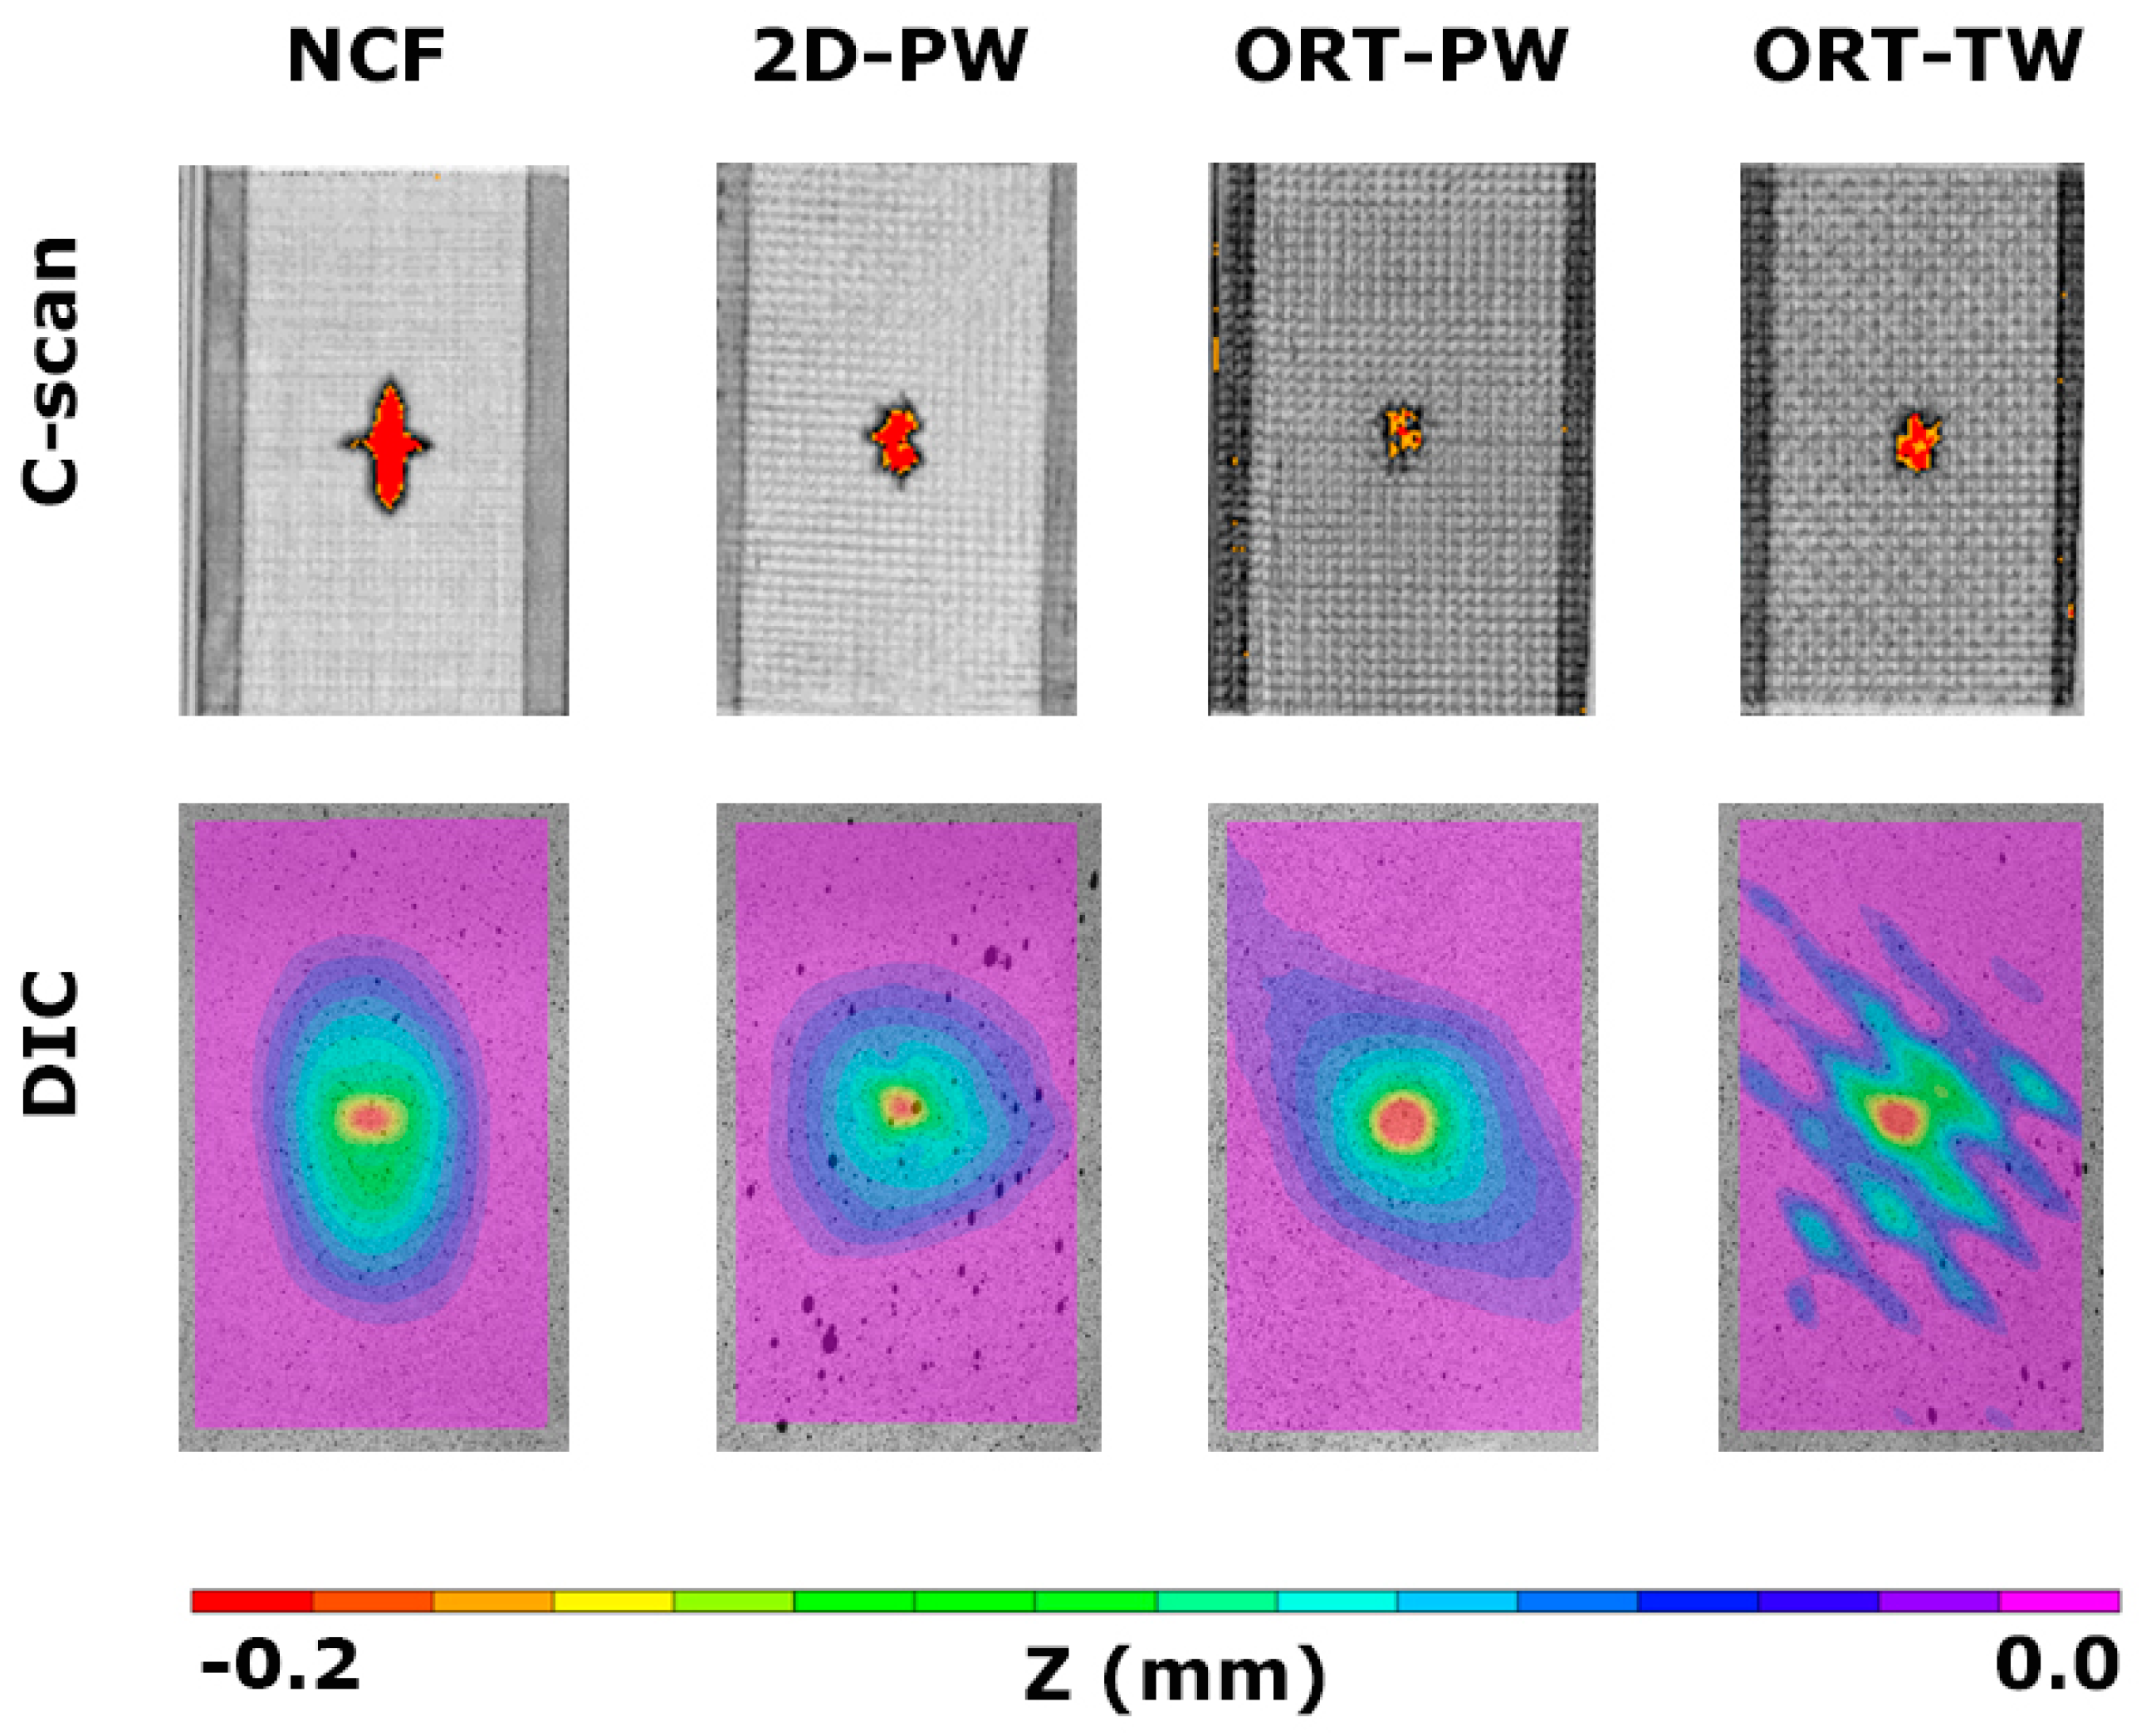
After all the specimens were impacted, the ultrasonic C-scanning was used to have a better idea of the level of the internal induced damage. A representative C-scan of each architecture is shown in Figure 6. Just by visual inspection, it was difficult to spot the difference among all the different architectures as the impact was a BVID; however, thanks to the C-scans, a clear distinction can be made. Before even calculating the size of the damaged area, it is obvious that the shape of the induced damage is dependent on the architecture. For the NCF case, which has the minimum waviness among all the tested architectures, the shape of the damage induced is characterised by a cross (0°/90°) shape. This can be attributed to the fact that, due to impact loading, splitting occurs in the 0° plies, which have longer floats as opposed to the 90° counterparts [29]. Moving on to the 2D-PW case, this cross shape almost disappears with a relatively smaller damage region, but still, it is larger compared to the 3D woven architectures. For both ORT-TW and ORT-PW, the damage size is smaller but still, the ORT-PW demonstrates the smallest induced damage region.
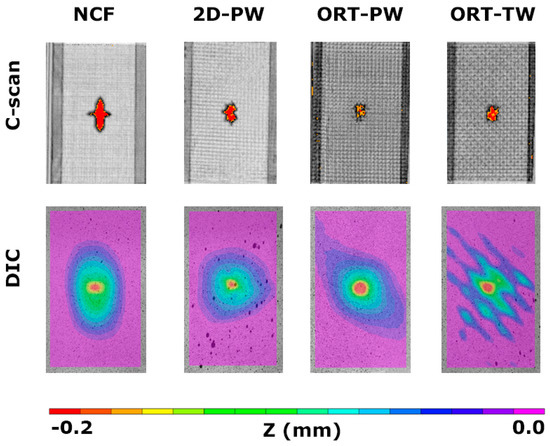
Figure 6.
C-scanning and digital image correlation (DIC) results for the impacted specimens.
Impact damage resistance is generally evaluated in light of the size of induced damage and the energy absorption. The comparison among all the architectures using these two parameters should help in understanding the effect of the fabric/composite architecture. Therefore, the size of the induced damage was calculated using MATLAB image segmenting tool for all the architectures using the C-scan images. Table 1 summarises the percentage of the damaged area normalised by the total area of the specimen. It is clear that the NCF architecture experienced the largest damage due to impact followed by the 2D-PW. When it comes to the 3D woven architectures, although both architectures experienced less damage as opposed to the NCF, a significant difference is observed between the ORT-PW and the ORT-TW specimens. The induced damage in the case of ORT-TW is almost 1.5 times the damage in the case of the ORT-PW, which clearly highlights the effect of the z-binding yarns frequency or in other words, the unit-cell size of the weave on the impact resistance of the woven composites. This is very much in line with observations, previously reported in [30,31,32,33,34,35], explaining the role of the z-binding yarns in resisting delamination propagation in 3D woven composites for different loading conditions. The z-binding yarns’ path effect is further discussed in this study using the X-ray CT ortho-slices. When it comes to energy absorption, the results confirm the findings obtained from the C-scan images. The NCF architecture which experienced the largest damage absorbed approximately 1 and 2 more Joules compared to the 2D-PW counterpart and the two 3D woven architectures, respectively. In the case of the 3D woven architectures, despite the comparable energy absorption of both the ORT-PW and ORT-TW, the damage is less severe in the former.

Table 1.
Summary of the intensity of damage analysis.
Moreover, two conventionally used parameters, in literature [15], to assess the level and severity of damage and the resistance of the composite laminates to impact are: (i) the damage degree parameter (DD) and the absorbed energy per delaminated area (EDA/A). These two parameters are widely used for the comparison of composites that possess similar areal density and number of layers, which is the case in this research study. The damage degree parameter is defined as the normalised absorbed energy per the initial impact energy. The higher the value of (DD), the less resistance of a specific type of composite to impact loading. On the contrary and based on its definition, the higher the (EDA/A) value, the more capacity a specific composite structure has to resist impact. This is achieved either by absorbing less energy or by experiencing less damage due to impact. Both parameters are compared in Table 1 for all the tested architectures. The conclusion confirms the previously highlighted differences in the sense that NCF is found to be the least impact resistant architecture while ORT-PW is found to be the most impact-resistant counterpart. The (DD) parameter for ORT-PW is approximately 15% less than NCF and the (EDA/A) parameter is almost 2.3 times of the NCF counterpart. The ORT-TW results suggest that it is not very different from the 2D-PW architecture, which again highlights the importance of the careful design of the unit-cell size in the 3D woven composites in resisting damage induced due to impact. However, both architectures, 2D-PW and ORT-TW, still demonstrate higher impact resistance as opposed to the NCF specimens.
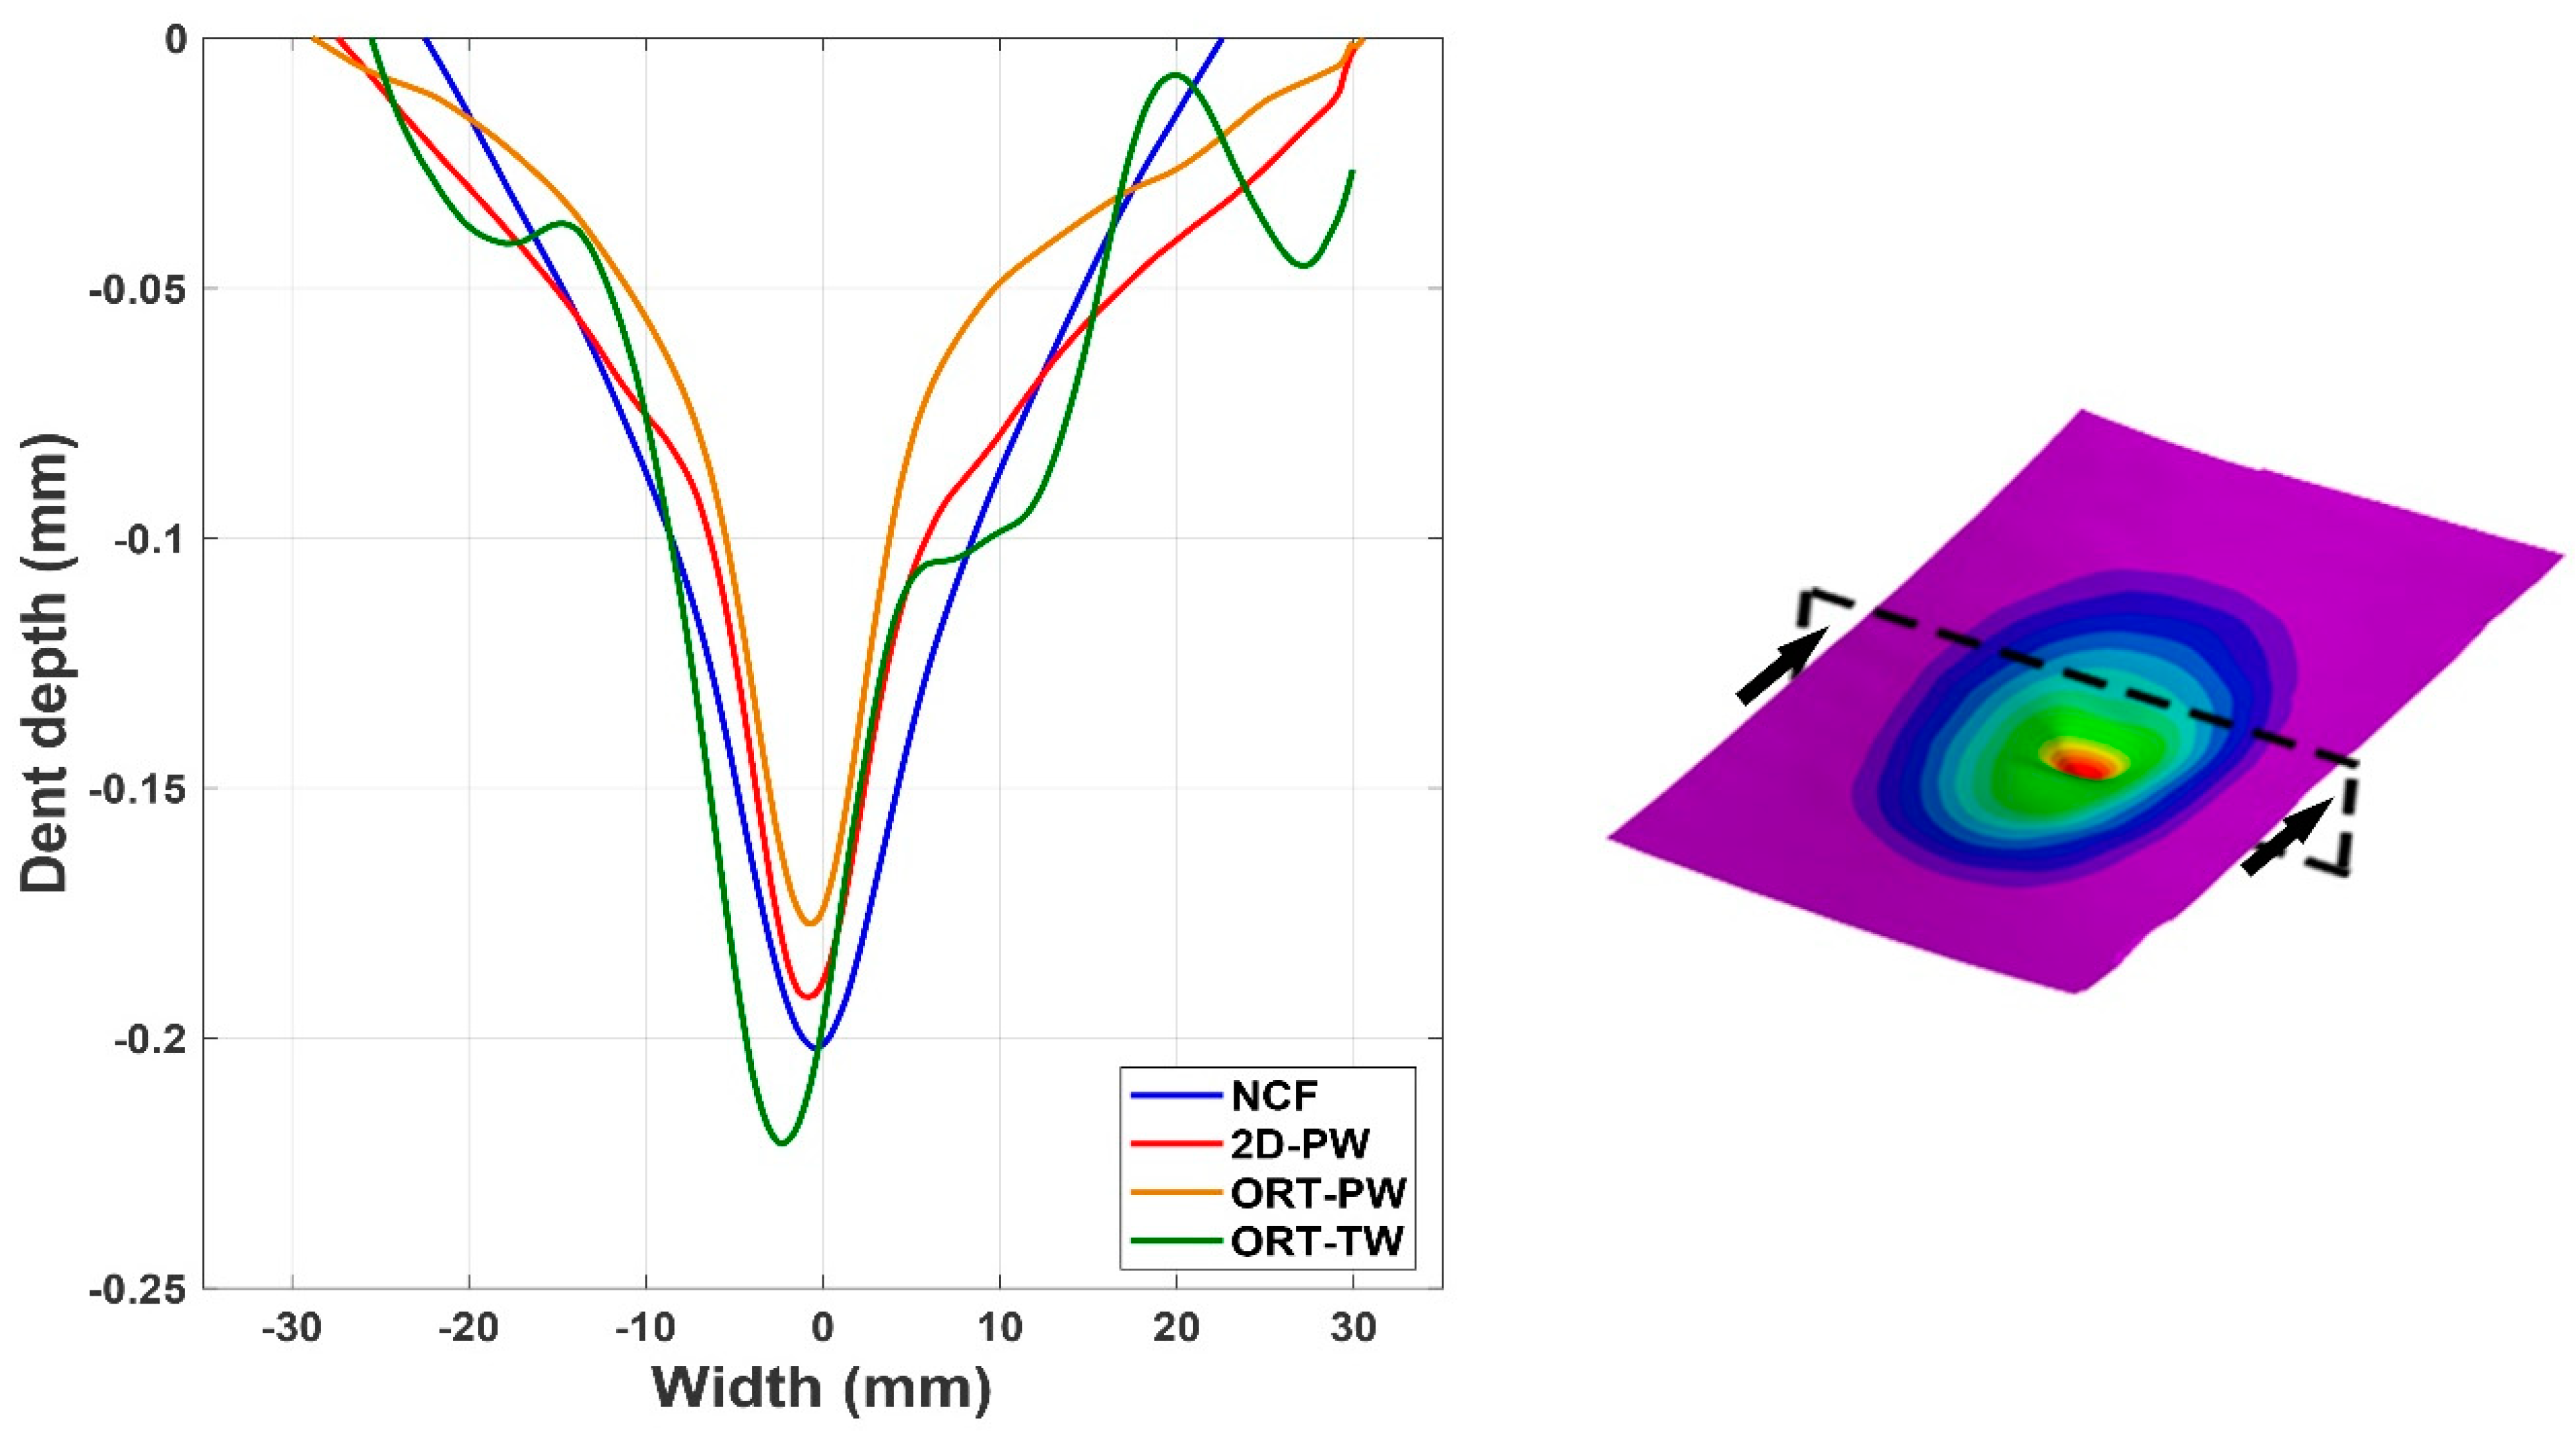
The C-scan image analysis is useful in providing planer information about the induced damage, but it does not provide any information regarding the thickness or the out-of-plane direction. Therefore, using the dent depth calculations by incorporating the 3D DIC analysis complements the understanding of the phenomena. The comparison of the dent depth, denoted by the z-coordinate, measured by the 3D DIC is detailed in Figure 7. It is again clear that the affected area, because of the low-velocity impact, is larger compared to the other architectures. By plotting a line across the width of a representative specimen from each architecture (see Figure 7), the level of plastic deformation, in the form of the dent depth, can be analysed. Regardless of the specimen architecture, it seems like the dent depth due to the impact is very comparable, with a value of ~0.2 mm. However, again it is noticed that the architecture with the shallowest dent is the ORT-PW, followed by the 2D-PW and then the NCF. The dent depth of the ORT-TW seems to be the deepest but this might be just due to the damage being very localised at maybe the z-binding yarn location. Later in the X-ray CT analysis it will be shown that specifically for this architecture, the yarns’ breakage was observed.
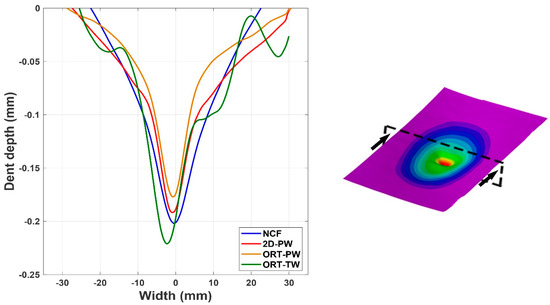
Figure 7.
Dent depth comparison for representative cases of all the tested specimens along the cutting plane shown.
4.2.3. X-ray CT Failure Analysis
Generally, low-velocity impact results in internal damage such as matrix cracking, fibre damage and fibre–matrix debonding. As discussed by Shah et al. [36], The level of damage caused by low-velocity impact depends on two primary factors including the fabric architecture and resin toughness. The resin toughness factor is outside the scope of this study. Nevertheless, to further understand the role of fabric architecture and the z-binding yarns in delamination and impact resistance, postprocessing of the 3D reconstructed volume from the X-ray CT was essential. The X-ray CT data was analysed using Avizo 2019.1 software from Thermo Fisher Scientific. The 32-bit data were first converted to 8-bit with the grey level range of 0–255. As can be seen in the CT sections/ortho-slices in Figure 8, the carbon fibre tows appear white, which corresponds to a higher grey value, and the polymer matrix appears in grey and the impact damage in black. Different phases can therefore be extracted/segmented based on thresholding the grey value in the CT images. For a simple and fair comparison among the four architectures, the damage due to the impact is discussed on three levels. The first is comparing the ortho-slice images captured along the warp (0 direction) plane in locations where there are no z-binding yarns. The second is to compare only the damage of the 3D woven architectures (ORT-PW and ORT-TW) along a plane sectioning the z-binding yarn’s path. Finally, the 3D reconstructed volume of all the architectures along with the 3D segmented damage volume are detailed and the 2D ortho-slice damage discussion is complemented with the 3D data to provide a comprehensive comparison of the impact-induced damage for all architectures.
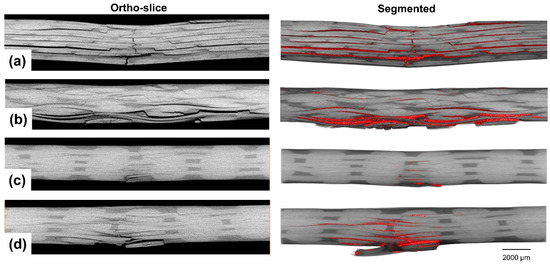
Figure 8.
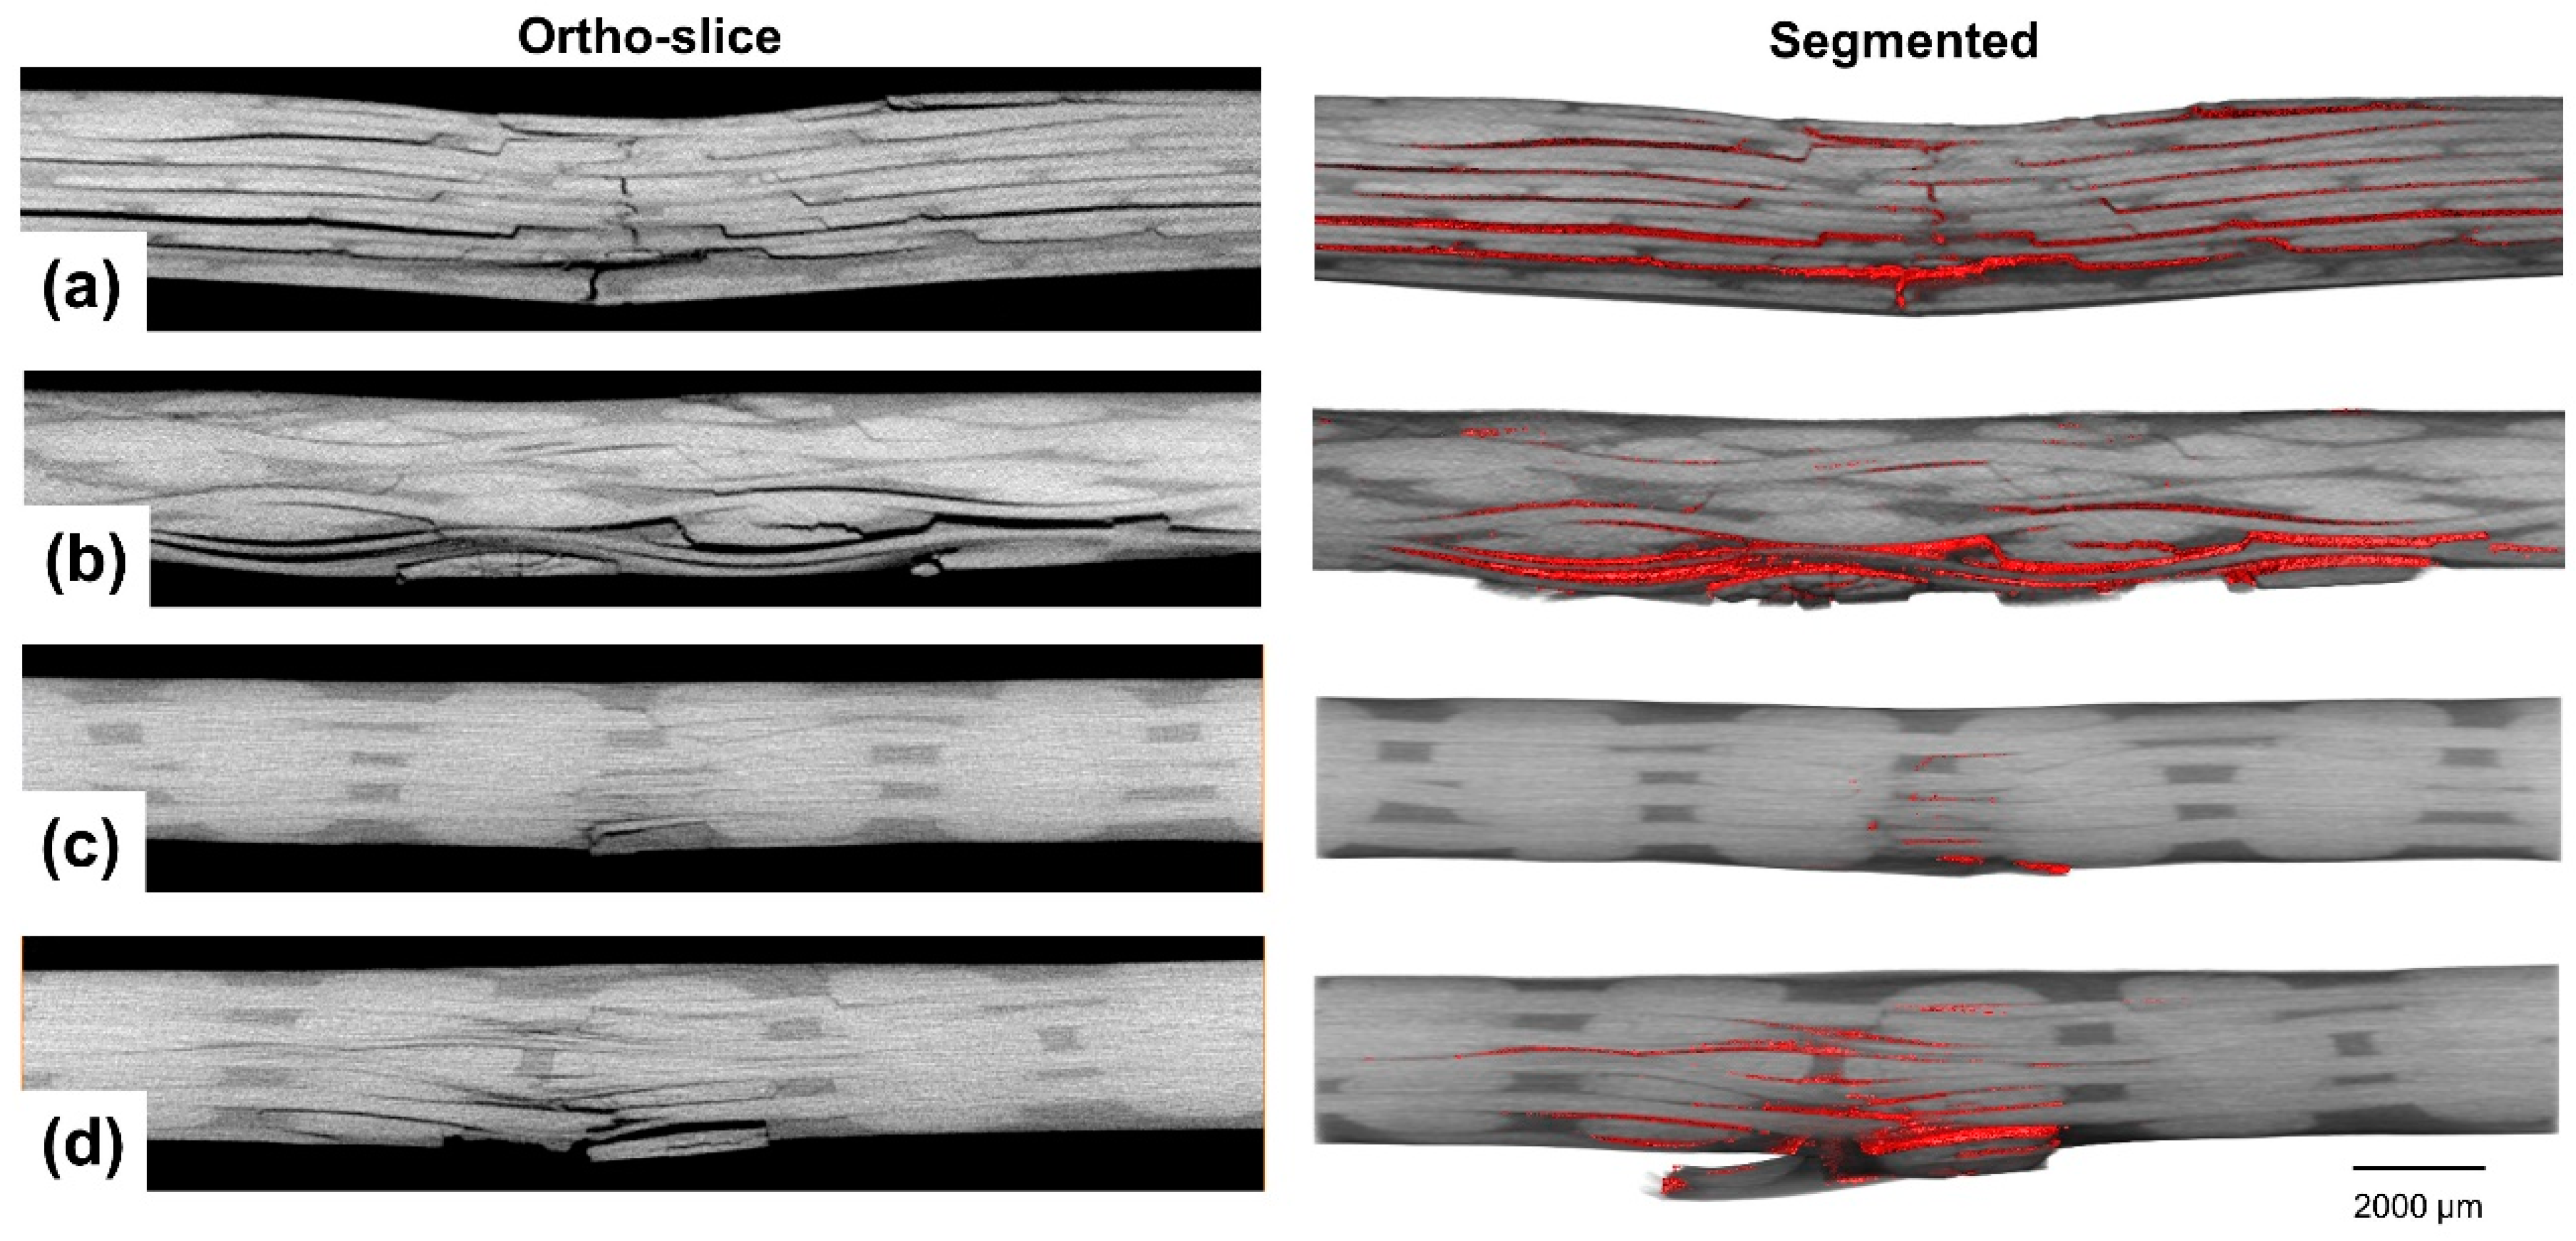
Ortho-slices and segmented damage highlighted in red in locations where there are no binding yarns (the top is the front side of the impact and the bottom is the backside) for: (a) NCF, (b) 2D-PW, (c) ORT-PW and (d) ORT-TW.
In locations where no z-binding yarns exist (see Figure 8), The dominant damage mechanisms represent the typical damage mechanisms due to low-velocity impact [37]: matrix cracking (due to shear and bending stresses), delamination (because of the large out-of-plane deformation and interlaminar shear) and localised fibres/yarns breakage (directly beneath the impactor at the front side and tensile failure at the backside due to bending). The severity of each damage mechanism differs from one architecture to the other. In the case of the NCF specimen (see Figure 8a), interlaminar delamination between all the adjacent plies, extending from the impact location, is very obvious as well as surface plies splitting. This is also accompanied by extensive matrix cracking and fibre/yarn breakage especially at the backside of the specimen, away from the impact location in the thickness direction. The interlaminar delamination, however, in the case of the woven architectures (2D-PW, ORT-PW and ORT-TW), is guided by the waviness of each architecture. The severity of the damage beneath the impact location at the front side is very minimal compared to the damage experienced at the backside. Tensile matrix cracking and fibre/yarn breakage are dominant especially in the 2D-PW (Figure 8b) and ORT-TW (Figure 8d) specimens. Moreover, this type of damage is much localised in the ORT-TW case, which could explain the reason why the dent depth previously measured in Section 4.2.2 using the DIC was found to be the largest. By visual inspection of the damage size among all the architectures in these locations, it is clear that the ORT-PW (Figure 8c) experiences the least damage, but this should be also confirmed in other planes as well as the 3D reconstructed volume as discussed later.
Moving on to locations where z-binding yarns exist (see Figure 9), a comparison can be made between the two 3D woven architectures, the ORT-PW and ORT-TW. Although the aforementioned dominant damage mechanisms (matrix cracking, delamination and fibre/yarn failure) are still the same, it is very obvious that the size of them is much smaller in the planes where the z-binding yarns exist. Again, most of the damage occurs at the backside, which is typical for low-velocity impact damage. Nevertheless, the unit-cell size effect is very significant. In the case of the ORT-PW (Figure 9a), the frequency of the z-binding yarns is double the frequency of the ORT-TW (Figure 9b) counterpart. In other words, the unit-cell size of the ORT-PW is half of the ORT-TW. This enables the ORT-PW architecture to resist the induced impact damage more than the ORT-TW. In both cases, the z-binding yarns act as crack/delamination stoppers, hence delamination or matrix cracking grows as long as it is not arrested by any z-binding yarn. This results in longer delamination and larger damage size in the case of the ORT-TW as opposed to the ORT-PW architecture.

Figure 9.
Ortho-slices and segmented damage highlighted in red in locations where there exist binding yarns in the 3D woven composites (the top is the front side of the impact and the bottom is the backside) for: (a) ORT-PW and (b) ORT-TW.
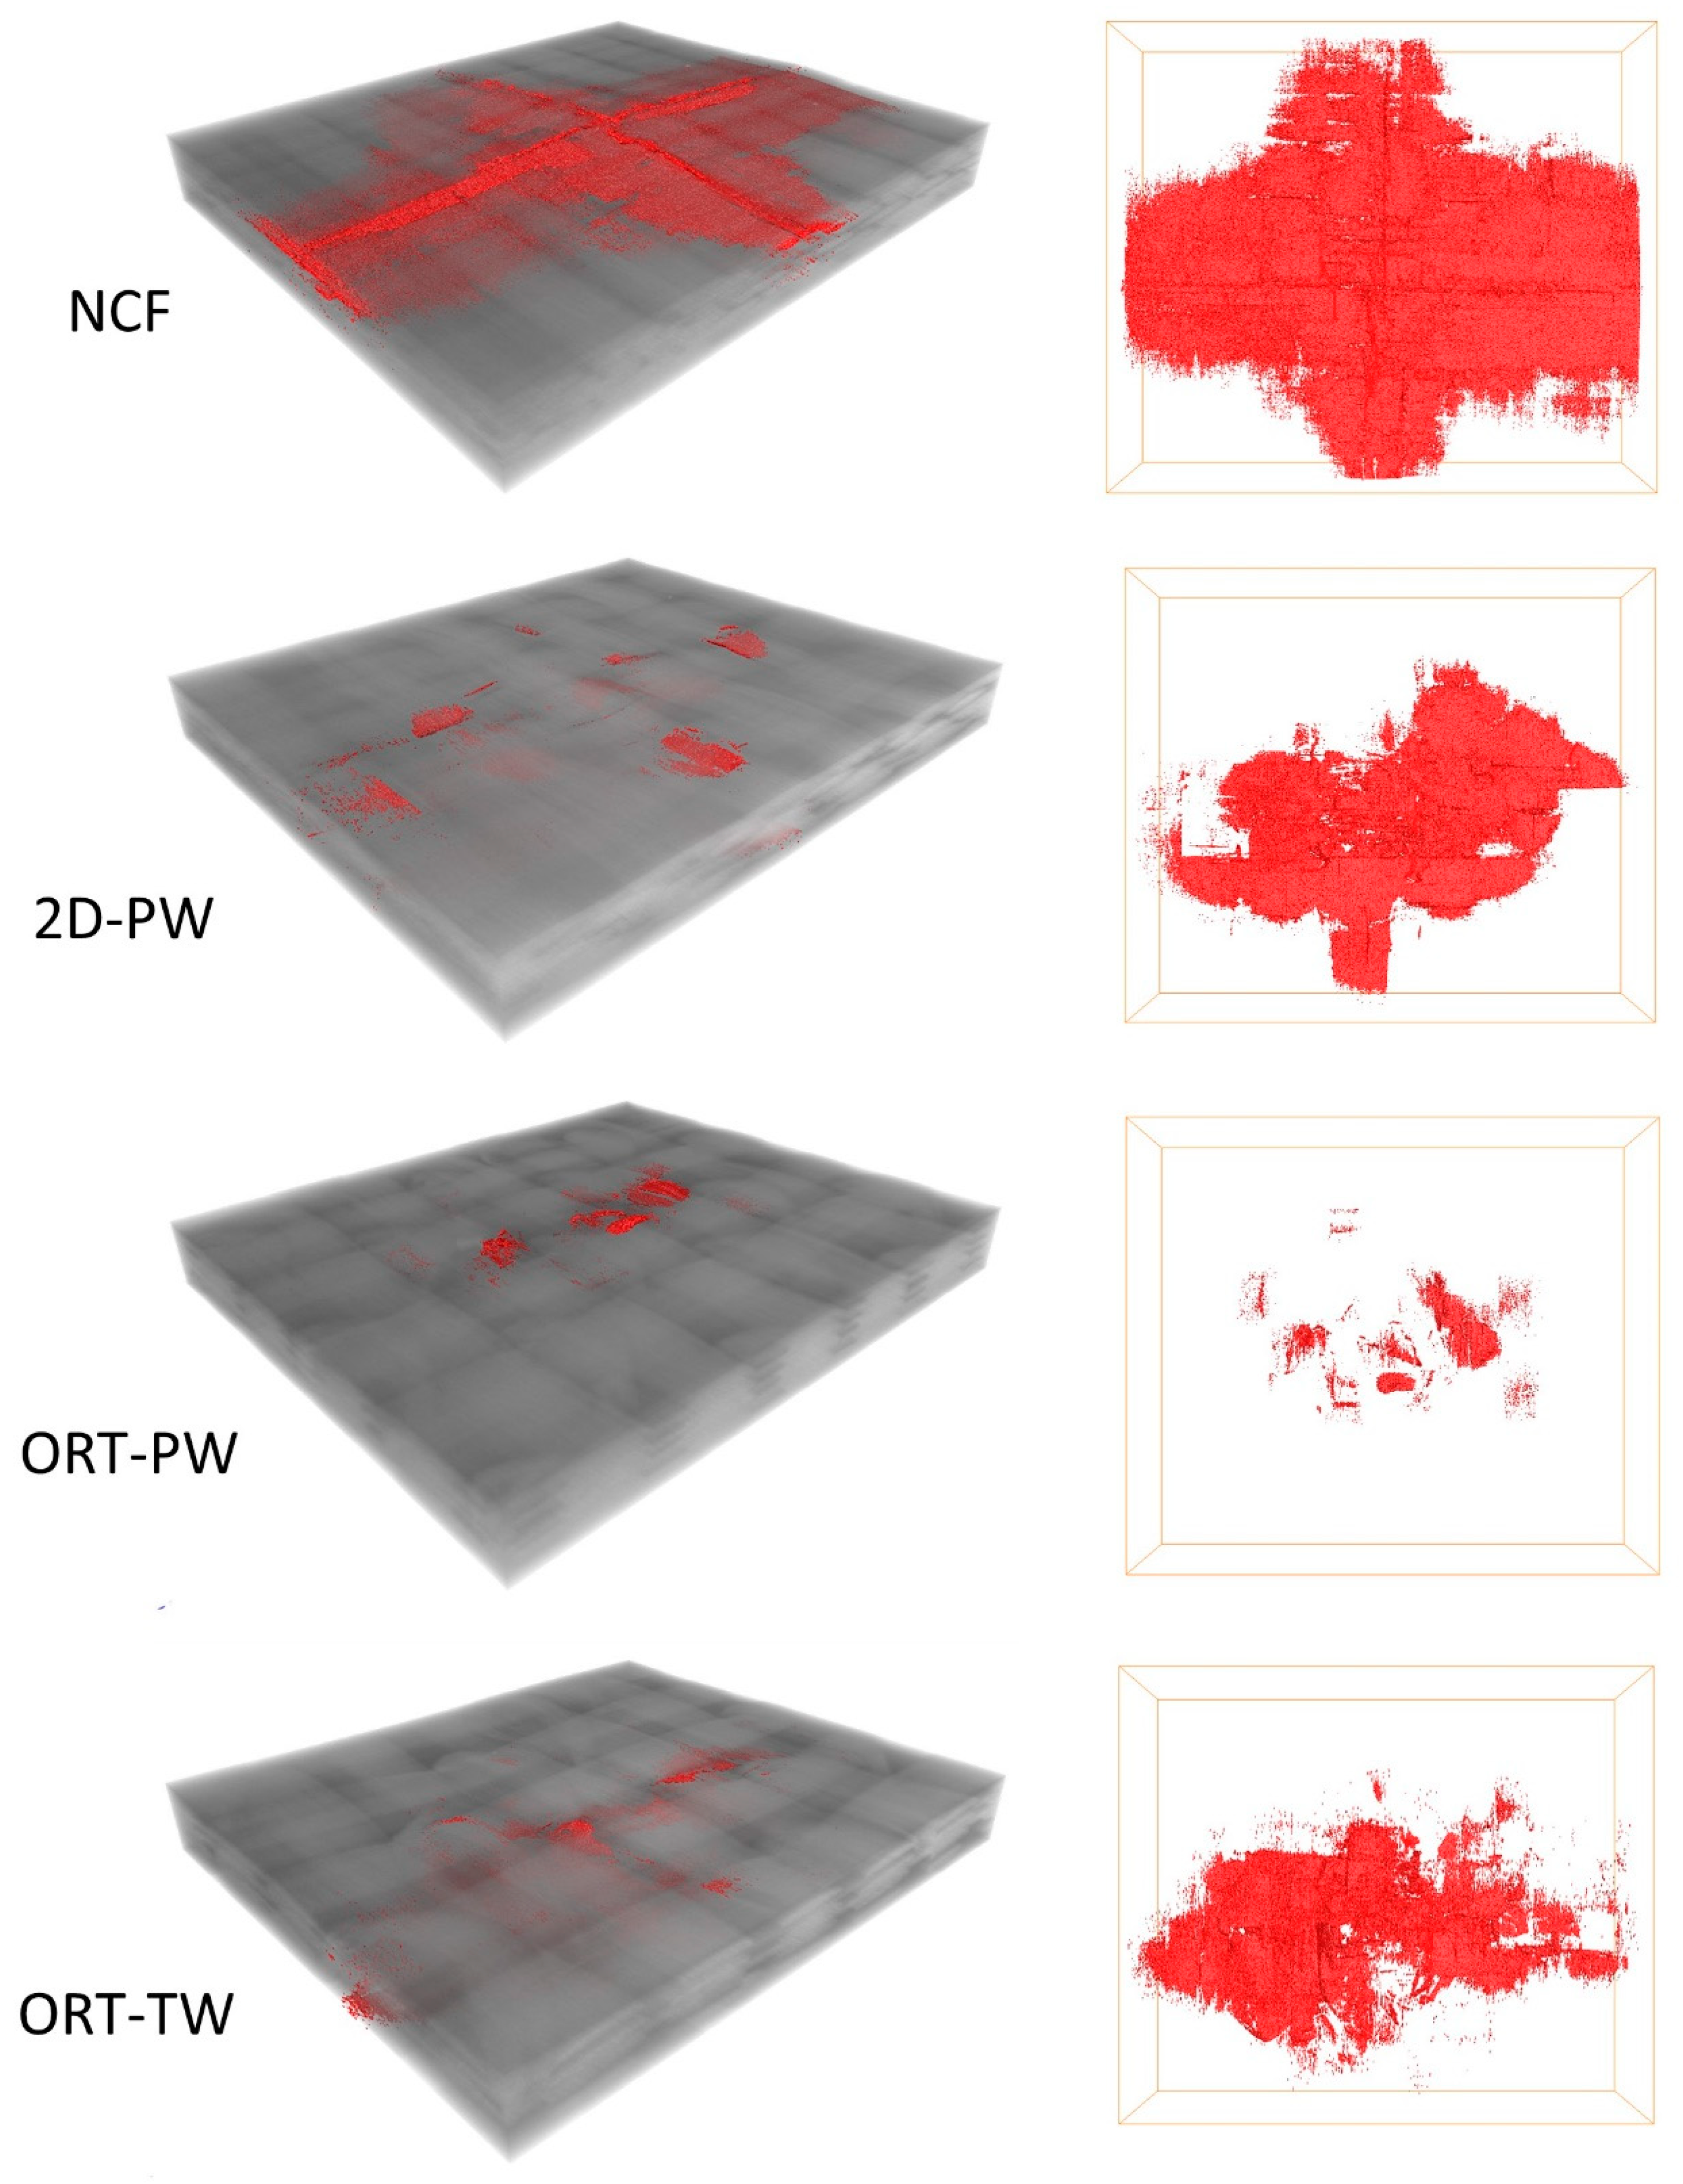
So far the discussion and comparison have been made only based on 2D planar data. To confirm the findings in 3D space, volume reconstruction and segmentation are inevitable. Here, the 3D morphology and distribution of interyarn impact damage are of interest and simple automatic thresholding could not fit this purpose. Thus, a routine was developed to segment interyarn damage (mostly in-plane but may deviate when z-binding yarns exist) in a reliable and repeatable way across different structures. The full composite volume was firstly segmented out to define the region-of-interest for further image processing. This was followed by applying the top-hat segmentation tool to the composite volume. Line kernels sized 40 lying in-plane were used as seeds to extract black features (in this case, the impact image) and the masking range of 48–255 was selected. The selected damage volume was then denoised by removing all isolated islands smaller than 5 voxels in 3D to provide the final segmented interyarn damage volume for all types of architectures as shown in Figure 10.
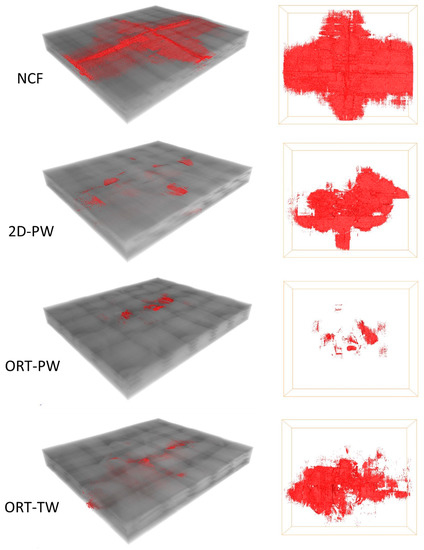
Figure 10.
3D X-ray CT reconstructed volume with the segmentation of damage due to impact highlighted in red (left) and 2D top view (right).
The damage volume fraction (see Table 2) was calculated by dividing the volume of the segmented impact damage by the analysed image volume (width ~19 mm × height ~22 mm × thickness) of the composite panel before impact. It is clear from the comparison that the same trend observed from the C-scan results is prevailing. The NCF architecture experiences the maximum damage due to the single impact followed by the 2D-PW. Both 3D woven architectures experience less damage with the ORT-PW having the least damage volume fraction. This demonstrates first the effect of the z-binding yarns in resisting the induced damage due to out-of-plane loading compared to laminated and 2D woven composites. Second, the frequency of the z-binding yarns through the thickness also has a noticeable effect on the damage resistance. The higher the z-binding yarns’ density, as in the ORT-PW case, directly translates into less damage volume fraction compared to the ORT-TW.

Table 2.
Summary of the X-ray segmentation data.
5. Conclusions
Four different architectures of composite specimens, namely: NCF, 2D-PW, ORT-PW and ORT-TW, were subjected to low-velocity impact with an energy level of 15 J. The low-velocity impact resistance response of these architectures was evaluated using mechanical analysis combined with various NDT techniques, including ultrasonic C-scanning, Digital Image Correlation (DIC) and X-ray computed tomography (CT). These NDT techniques were successfully utilised to quantify the internal induced damage in the in-plane and through-the-thickness directions. Correlating the absorbed energy to the total impact energy (DD parameter) as well as the delamination area (EDA/A) reveals the significant effect of the weaving architecture and the z-binding yarns’ path, for 2D and 3D woven composites, on the impact resistance response. From an internal damage point of view, typical dominant damage mechanisms such as matrix cracking, fibre damage and fibre–matrix debonding were observed, but with different degrees of severity depending on the composite architecture. Regardless of their unit-cell size, 3D architectures exhibited the highest impact resistance as opposed to 2D-PW and NCF. In addition, X-ray CT segmentation analysis demonstrated the effect of the higher frequency of the z-binding yarns, in the ORT-PW case, in delamination and crack arresting even when compared to the other 3D architecture (ORT-TW). Among all the architectures, ORT-PW was found to have the highest damage resistance with the least damage size. This clearly highlights the significance of the design of the z-binding yarns’ path and more importantly its frequency in 3D woven architectures for impact-resistant composite structures.
Author Contributions
H.M.E.-D.: conceptualization, investigation, writing—reviewing and editing, M.N.S.: conceptualization, methodology, formal analysis, writing—original draft preparation, supervision, Y.W.: methodology, formal analysis, M.S.A.: writing—original draft preparation. All authors have read and agreed to the published version of the manuscript.
Funding
This research received no external funding.
Conflicts of Interest
The authors declare no conflict of interest.
References
- Panettieri, E.; Fanteria, D.; Montemurro, M.; Froustey, C. Low-velocity impact tests on carbon/epoxy composite laminates: A benchmark study. Compos. Part B Eng. 2016, 107, 9–21. [Google Scholar] [CrossRef]
- Awais, H.; Nawab, Y.; Anjang, A.; Md Akil, H.; Zainol Abidin, M.S. Effect of fabric architecture on the shear and impact properties of natural fibre reinforced composites. Compos. Part B Eng. 2020, 195, 108069. [Google Scholar] [CrossRef]
- Wu, Z.; Zhang, L.; Ying, Z.; Ke, J.; Hu, X. Low-velocity impact performance of hybrid 3D carbon/glass woven orthogonal composite: Experiment and simulation. Compos. Part B Eng. 2020, 196, 108098. [Google Scholar] [CrossRef]
- Xin, W.; Sarasini, F.; Tirillò, J.; Bavasso, I.; Sbardella, F.; Lampani, L.; De Rosa, I.M. Impact and post-impact properties of multiscale carbon fiber composites interleaved with carbon nanotube sheets. Compos. Part B Eng. 2020, 183. [Google Scholar] [CrossRef]
- Bilisik, K.; Sapanci, E. Experimental determination of fracture toughness properties of nanostitched and nanoprepreg carbon/epoxy composites. Eng. Fract. Mech. 2018, 189, 293–306. [Google Scholar] [CrossRef]
- Shyr, T.-W.; Pan, Y.-H. Impact resistance and damage characteristics of composite laminates. Compos. Struct. 2003, 62, 193–203. [Google Scholar] [CrossRef]
- Francesconi, L.; Aymerich, F. Impact damage resistance of thin stitched carbon/epoxy laminates. Proc. J. Phys. Conf. Ser. 2015, 628, 12099. [Google Scholar] [CrossRef]
- Hosur, M.V.; Adya, M.; Alexander, J.; Jeelani, S.; Vaidya, U.; Mayer, A. Studies on impact damage resistance of affordable stitched woven carbon/epoxy composite laminates. J. Reinf. Plast. Compos. 2003, 22, 927–952. [Google Scholar] [CrossRef]
- Tan, K.T.; Watanabe, N.; Iwahori, Y. Effect of stitch density and stitch thread thickness on low-velocity impact damage of stitched composites. Compos. Part A Appl. Sci. Manuf. 2010, 41, 1857–1868. [Google Scholar] [CrossRef]
- Yoshimura, A.; Nakao, T.; Yashiro, S.; Takeda, N. Improvement on out-of-plane impact resistance of CFRP laminates due to through-the-thickness stitching. Compos. Part A Appl. Sci. Manuf. 2008, 39, 1370–1379. [Google Scholar] [CrossRef]
- Chen, F.; Hodgkinson, J.M. Impact behaviour of composites with different fibre architecture. Proc. Inst. Mech. Eng. Part G J. Aerosp. Eng. 2009, 223, 1009–1017. [Google Scholar] [CrossRef]
- Umer, R.; Alhussein, H.; Zhou, J.; Cantwell, W. The mechanical properties of 3D woven composites. J. Compos. Mater. 2016. [Google Scholar] [CrossRef]
- Seltzer, R.; González, C.; Muñoz, R.; Llorca, J.; Blanco-Varela, T. X-ray microtomography analysis of the damage micromechanisms in 3D woven composites under low-velocity impact. Compos. Part A Appl. Sci. Manuf. 2013, 45, 49–60. [Google Scholar] [CrossRef]
- Hart, K.R.; Chia, P.X.L.; Sheridan, L.E.; Wetzel, E.D.; Sottos, N.R.; White, S.R. Mechanisms and characterization of impact damage in 2D and 3D woven fiber-reinforced composites. Compos. Part A Appl. Sci. Manuf. 2017, 101, 432–443. [Google Scholar] [CrossRef]
- Kazemianfar, B.; Esmaeeli, M.; Nami, M.R. Experimental investigation on response and failure modes of 2D and 3D woven composites under low velocity impact. J. Mater. Sci. 2020, 55, 1069–1091. [Google Scholar] [CrossRef]
- Miao, H.; Wu, Z.; Ying, Z.; Hu, X. The numerical and experimental investigation on low-velocity impact response of composite panels: Effect of fabric architecture. Compos. Struct. 2019, 227, 111343. [Google Scholar] [CrossRef]
- Cao, W.; Zhang, J.; Sun, B.; Gu, B. X-ray tomography and numerical study on low-velocity impact damages of three-dimensional angle-interlock woven composites. Compos. Struct. 2019, 230, 111525. [Google Scholar] [CrossRef]
- Gil, L.; Oller, S.; Pérez Martínez, M.A. Non-destructive testing evaluation of low velocity impact damage in carbon fiber-reinforced laminated composites. Ultrasound 2011, 66, 21–27. [Google Scholar]
- Grondel, S.; Assaad, J.; Delebarre, C.; Moulin, E. Health monitoring of a composite wingbox structure. Ultrasonics 2004, 42, 819–824. [Google Scholar] [CrossRef]
- Savin, A.; Barsanescu, P.D.; Vizureanu, P.; Stanciu, M.D.; Curtu, I.; Iftimie, N.; Steigmann, R. Damage detection of carbon reinforced composites using nondestructive evaluation with ultrasound and electromagnetic methods. In IOP Conference Series: Materials Science and Engineering, Proceedings of the International Conference on Innovative Research—ICIR Euroinvent 2016, Iași, Romania, 19–20 May 2016; IOP: Bristol, UK, 2016; p. 12013. [Google Scholar]
- Saeedifar, M.; Saleh, M.N.; El-dessouky, H.M.; Freitas, D. Damage assessment of NCF, 2D and 3D woven composites under compression after multiple-impact using acoustic emission. Compos. Part A Appl. Sci. Manuf. 2020, 132. [Google Scholar] [CrossRef]
- Li, Z.; Haigh, A.D.; Nasr Saleh, M.; McCarthy, E.D.; Soutis, C.; Gibson, A.A.P.; Sloan, R. Detection of impact damage in carbon-fibre composites using an electromagnetic sensor. Res. Nondestruct. Eval. 2017, 29, 1–20. [Google Scholar] [CrossRef]
- Sencu, R.M.; Yang, Z.; Wang, Y.C.; Withers, P.J.; Rau, C.; Parson, A.; Soutis, C. Generation of micro-scale finite element models from synchrotron X-ray CT images for multidirectional carbon fibre reinforced composites. Compos. Part A Appl. Sci. Manuf. 2016, 91, 85–95. [Google Scholar] [CrossRef]
- Emerson, M.J.; Jespersen, K.M.; Dahl, A.B.; Conradsen, K.; Mikkelsen, L.P. Individual fibre segmentation from 3D X-ray computed tomography for characterising the fibre orientation in unidirectional composite materials. Compos. Part A Appl. Sci. Manuf. 2017, 97, 83–92. [Google Scholar] [CrossRef]
- Mahadik, Y.; Brown, K.A.R.; Hallett, S.R. Characterisation of 3D woven composite internal architecture and effect of compaction. Compos. Part A Appl. Sci. Manuf. 2010, 41, 872–880. [Google Scholar] [CrossRef]
- Khosravani, M.R. Influences of defects on the performance of adhesively bonded sandwich joints. Key Eng. Mater. 2018, 789, 45–50. [Google Scholar] [CrossRef]
- ASTM D7136/D7136M-15 Standard Test Method for Measuring the Damage Resistance of a Fiber-Reinforced Polymer Matrix Composite to a Drop-Weight Impact Event 2011; American Society for Testing and Materials: West Conshohocken, PA, USA, 2011; pp. 1–16.
- Saleh, M.N.; El-Dessouky, H.M.; Saeedifar, M.; De Freitas, S.T.; Scaife, R.J.; Zarouchas, D. Compression after multiple low velocity impacts of NCF, 2D and 3D woven composites. Compos. Part A Appl. Sci. Manuf. 2019, 125. [Google Scholar] [CrossRef]
- Mubeen, A. Damage Tolerance of 3D Woven Composites with Weft Binders. Ph.D. Thesis, The University of Manchester, Manchester, UK, 2014. [Google Scholar]
- Saleh, M.N.; Yudhanto, A.; Potluri, P.; Lubineau, G.; Soutis, C. Characterising the loading direction sensitivity of 3D woven composites: Effect of z-binder architecture. Compos. Part A Appl. Sci. Manuf. 2016, 90, 577–588. [Google Scholar] [CrossRef]
- Saleh, M.N.; Soutis, C. Recent advancements in mechanical characterisation of 3D woven composites. Mech. Adv. Mater. Mod. Process. 2017, 3. [Google Scholar] [CrossRef]
- Saleh, M.N.; Wang, Y.; Yudhanto, A.; Joesbury, A.; Potluri, P.; Lubineau, G.; Soutis, C. Investigating the Potential of Using Off-Axis 3D Woven Composites in Composite Joints’ Applications. Appl. Compos. Mater. 2016, 24, 377–396. [Google Scholar] [CrossRef]
- Ivanov, D.S.; Lomov, S.V.; Bogdanovich, A.E.; Karahan, M.; Verpoest, I. A comparative study of tensile properties of non-crimp 3D orthogonal weave and multi-layer plain weave E-glass composites. Part 2: Comprehensive experimental results. Compos. Part A Appl. Sci. Manuf. 2009, 40, 1144–1157. [Google Scholar] [CrossRef]
- Midani, M.; Seyam, A.-F.; Saleh, M.N.; Pankow, M. The effect of the through-thickness yarn component on the in-and out-of-plane properties of composites from 3D orthogonal woven preforms. J. Text. Inst. 2018. [Google Scholar] [CrossRef]
- El-Dessouky, H.M.; Saleh, M.N. Chapter 4: 3D Woven Composites: From Weaving to Manufacturing. In Recent Developments in the Field of Carbon Fibers; IntechOpen: London, UK, 2018; pp. 51–66. [Google Scholar]
- Shah, S.Z.H.; Karuppanan, S.; Megat-Yusoff, P.S.M.; Sajid, Z. Impact resistance and damage tolerance of fiber reinforced composites: A Review. Compos. Struct. 2019, 217, 100–121. [Google Scholar] [CrossRef]
- Defects and damage and their role in the failure of polymer composites. In Failure Analysis and Fractography of Polymer Composites; Woodhead Publishing: Cambridge, UK, 2009; pp. 356–440.
Publisher’s Note: MDPI stays neutral with regard to jurisdictional claims in published maps and institutional affiliations. |
© 2021 by the authors. Licensee MDPI, Basel, Switzerland. This article is an open access article distributed under the terms and conditions of the Creative Commons Attribution (CC BY) license (http://creativecommons.org/licenses/by/4.0/).

