Article

Experimental Study on Strengthening Effect Analysis of a Deteriorated Bridge Using External Prestressing Method

Advanced Composites Research Center, Korea Institute of Civil Engineering and Building Technology, 283, Goyang-daero, Ilsanseo-gu, Goyang-si 10223, Gyeonggi-do, Korea
*
Author to whom correspondence should be addressed.
Appl. Sci. 2021, 11(6), 2478; https://doi.org/10.3390/app11062478
Submission received: 10 February 2021 / Revised: 7 March 2021 / Accepted: 8 March 2021 / Published: 10 March 2021

Abstract

:
The external prestressing method was developed to improve the load carrying capacity of concrete bridges damaged by ageing or other external environmental factors. Therefore, it is necessary to examine the performance of the structure before and after strengthening, and verification and confirmation of the actual strengthening effect should be preceded. However, for reasons such as securing deteriorated bridges and the absence of design data, the strengthening effect of an actual bridge is rarely analyzed. Hence, in this study, the strengthening effect was verified by conducting a set of material property tests and four-point loading tests before and after strengthening of an actual bridge, which had been utilized for over 45 years. As a result, it was determined that confirming the strengthening effect before cracking is challenging due to the nature of the external prestressing method, which has an insignificant effect on the stiffness; however, the effect of increasing the crack load of the external prestressing method was experimentally verified. The result of the study is expected to contribute to the determination of the load carrying capacity and required strengthening amount when strengthening existing prestressed concrete girder bridges.

1. Introduction

Concrete structures gradually deteriorates due to material deterioration, excessive loads, and other environmental factors, and their initial performance progressively deteriorates, affecting the usability and safety of the structures [1,2,3]. Especially, in the case of prestressed concrete (PSC) bridges, the collapse of the actual bridge due to corrosion of the internal tendon has been reported, thus forming a consensus on the importance of maintenance [4,5,6].
Bridges gradually deteriorate due to an increase in common usage, and performance degradation accelerates due to changes in environmental factors such as an increase in traffic volume and the number of large-sized vehicles [7,8,9]. Therefore, various strengthening methods are applied to restore and improve the performance of these bridges along with raising awareness regarding the importance of structure maintenance [10,11,12,13,14,15,16].
The external prestressing method is one of the strengthening methods for deteriorated bridges, which increases the load carrying capacity of the existing structure by installing tendons on the outer tensile zone of the structure and directly tensioning force. The method is widely used for its advantages such as preventing corrosion of reinforcement bars and restoring deflection by closing cracks in the tensile zone [17].
Several studies have been conducted to confirm the strengthening effect of the external prestressing method [18,19,20,21], however, there are few cases where the strengthening effect of the method on an actual old bridge has been verified. Because the external tendon does not adhere to the base material concrete, it is difficult to predict the exact behavior of the bridge as the strain compatibility condition is not established. In addition, external prestressing strengthening method has a characteristic that it is difficult to confirm the strengthening effect because there is no significant change in stiffness before cracking.
In the meantime, a number of studies have been conducted on the external prestressing method to evaluate existing structures, analysis of the behavior of the bridge, and strengthening effects of bridges. Since the strengthening effect is the difference between the performance of the structure before and after strengthening, evaluation of the behavior of the existing structure is the key to confirm the correct strengthening effect. The value of prestressing force is of primary importance in the behavior analysis of prestressed concrete structure. Therefore, various studies on the losses of prestressing force have been conducted to evaluate the existing structures. For example, studies on the loss of prestress in unattached continuous beams [22], estimation of the effective prestressing force of PSC girders [23,24,25], stress of non-adherent tendons in extreme conditions [26], and prestressing force losses over time were also conducted [5,27].
For understanding the behavior and effects of reinforced structures, Shenoy et al. [23] conducted structural tests on PSC girders that had been used for 27 years, and Tabatabai et al. [25] evaluated the ultimate load-bearing capacity of long-term common bridges by performing structural and load-bearing tests on old PSC girders that had been used for 34 years. In addition, Ramos et al. [28] studied the behavior of PSC bridges reinforced with external steel wires with multiple deflections, and Harajli et al. [29] analyzed the behavior of continuous bridges with external prestressing method. Aparicio et al. [21] and Chun et al. [30] performed a load test on concrete bridges reinforced with external steel wires to evaluate the behavior of the bridge and the load-bearing capacity under common load. Moreover, numerous studies have been conducted to confirm ultimate stress and flexural strength of non-adherent external tendons [26,28,30,31,32,33]. However, in general, there are few cases in which the strengthening effect before and after the actual strengthening has been systematically verified, since most studies only focused on the condition evaluation of the existing members required for the strengthening of the PSC girder bridge and verification of the required performance after strengthening.
For this reason, in this study, the external prestressing method was applied to a bridge that was demolished after 45 years of service, and a loading test before and after strengthening was performed to analyze the behavior according to the strengthening and confirm its efficacy.

2. Experimental Program

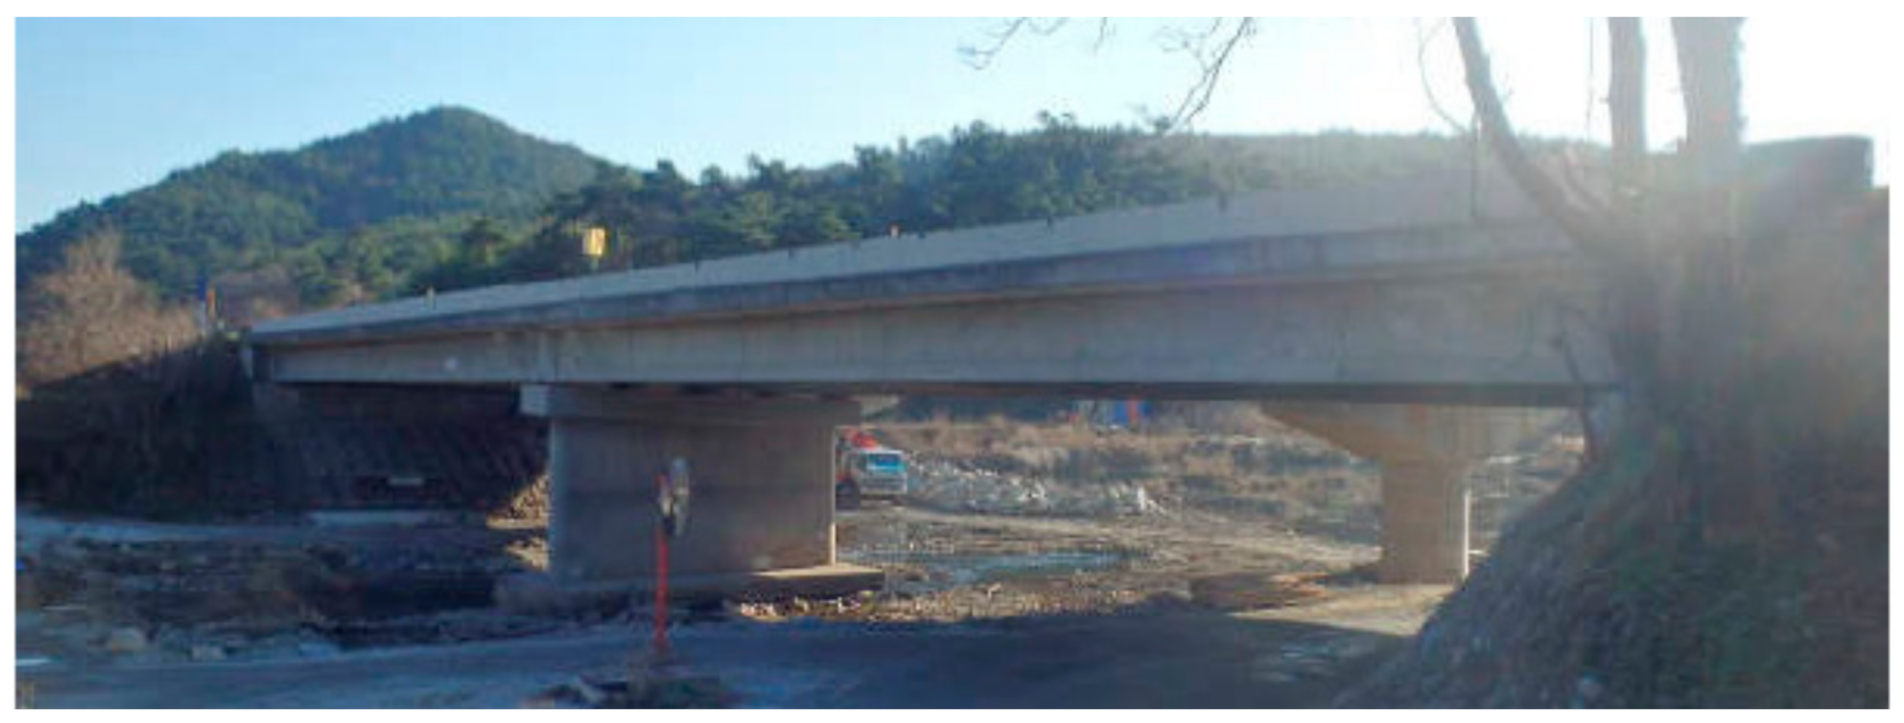
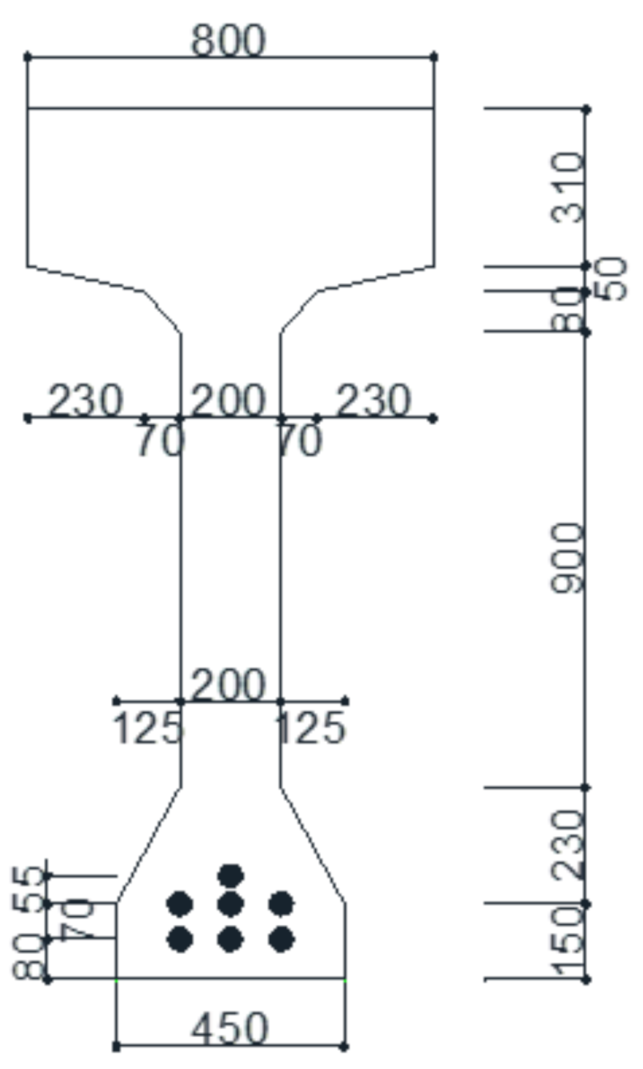
2.1. Deteriorated Bridge

As shown in Figure 1, the actual bridge used in the experiment was constructed in 1975 and demolished after being utilized for approximately 45 years. It is a two-span continuous PSC girder bridge with the following dimensions: 60.9 m length, 30.5 m maximum span, and 11.7 m width. However, due to its long service period, the design data are almost non-existent. In addition, due to the low resolution of the design drawing, it is difficult to inspect the exact specifications. For these reasons, the specifications of the actual bridge were confirmed through measurement. The cross-section of the bridge is shown in Figure 2. Referring to the existing design data, the compressive strength of the girder is 27 MPa, and tendons with a diameter of 8 mm and tensile strength of 1560 MPa were inserted into each of seven ducts using 12 strands.

2.2. Material Properties

In order to obtain the material properties of the bridge, material property tests of the concrete and tendons of the deteriorated bridge were performed. As shown in Figure 3, approximately 50 cores were sampled from various positions of the girder, and a compressive strength test was conducted. The result of the test yielded a concrete compressive strength of 33 MPa, which was 22% higher than that obtained during initial concrete placement (27 MPa). However, it was not possible to confirm whether the strength was altered, due to the absence of an experimental value during its construction. For the tendons, a tensile strength test was performed by cutting five tendons from the target bridge. As a result of the test, the tensile strength was determined to be 1660 MPa, which is approximately 6% higher than the tensile strength of 1560 MPa noted in the original design data. Therefore, it can be concluded that there was no significant effect on the performance of the tendons inside the grout, even after 45 years.
In addition, the effective tensile strength of the internal tendon was evaluated to confirm the performance of the existing real bridge. As shown in Figure 4, after removing the grout and exposing the internal tendon, it was pulled in the transverse direction to evaluate the effective tensile strength from the force–displacement relationship. The prestressing force was measured using a loadcell installed in the anchorage. From this test, an effective tension of 25.1–32.7 kN was measured. This value corresponds to 32–43% of the tensile strength of the tendon, and it is estimated that approximately 50% of the tension has been lost because approximately 40–53% of the effective tension remains compared to the maximum introduced tension force suggested by ACI 318 [34]. However, as presented in Table 1, the deviation of each tendon was relatively large, and there were tendons in which tension was completely released. However, it was difficult to ascertain whether the losses of the prestressing force generated here occurred during the use of the bridge or during the demolition of the bridge for testing. Moreover, it should be noted that because the grout was removed, the performance of the existing structure might have been affected by the influence of the exposed portion of the internal tendon or the deviation from prestress force of each tendon [4,5].

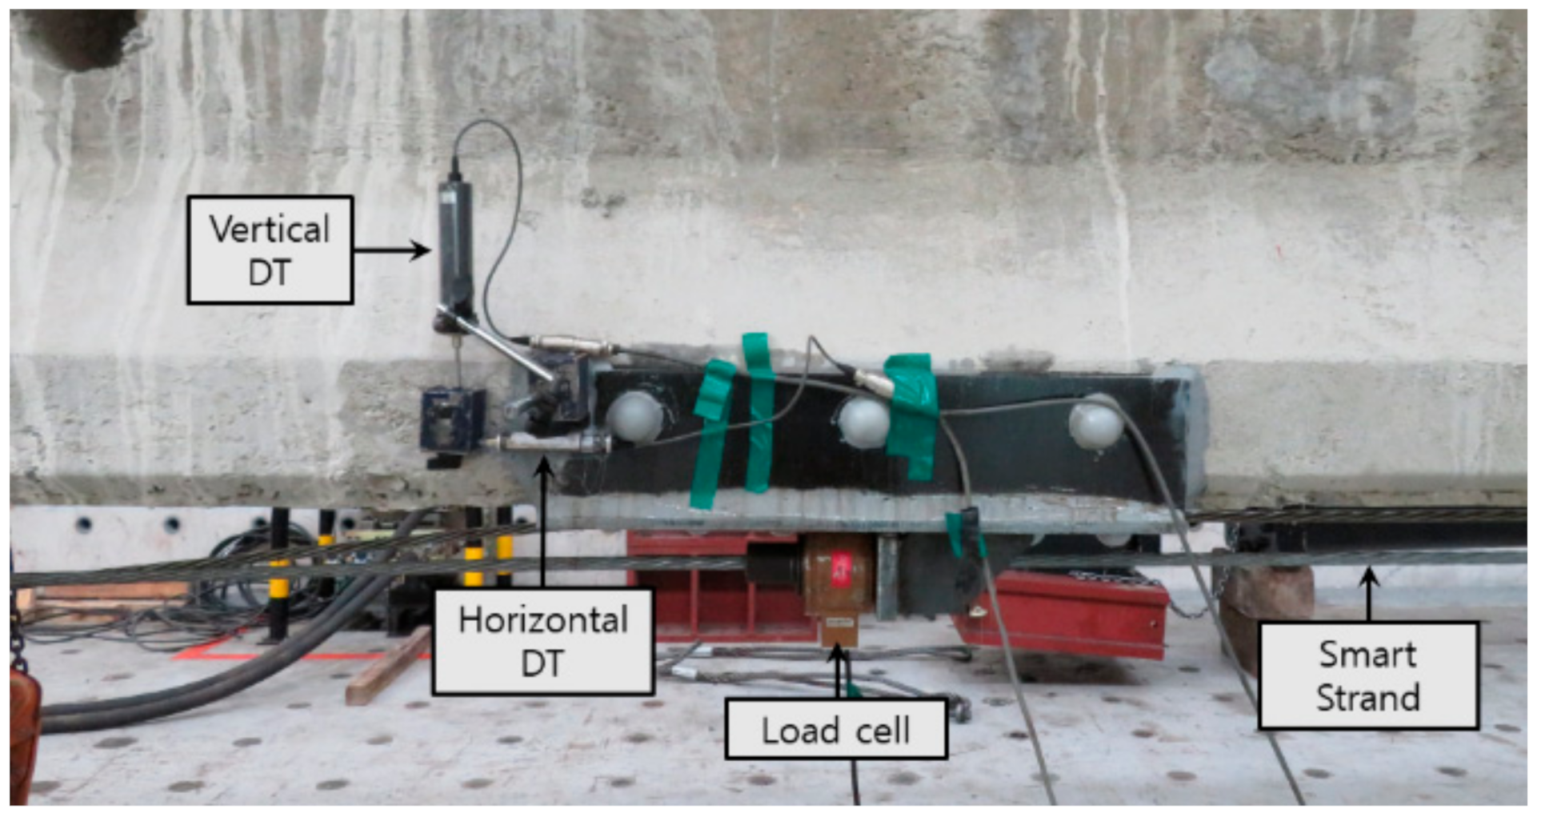
2.3. Measurement and Loading Plan

Experimental measurement was performed in a total of three stages. First of all, an assessment was conducted to check the performance of the existing bridge before strengthening of the demolished bridge. The second step is the application of the external prestressing method, which strengthens the structure by prestressing external tendons. Finally, after strengthening, a loading test was performed to verify the performance. As shown in Figure 5 and Figure 6, two actuators with a capacity of 5000 kN were utilized, and for safety reasons, a four-point loading test was performed with a displacement control method at a speed of 2 mm/min. The boundary condition was a simple beam using a hinge and roller at 250 mm from both ends, and the load was set such that the length of the pure bending section was 6 m with a width of 3 m from the center of the specimen to both sides. In the before strength phase, the load was applied only until the crack occurred, and in the after strength phase, the load was applied until the point of destruction of the structure.
Sensors were installed around the displacement transducer in the middle of the span and at 1/4 and 3/4 of the span to measure the behavior of the structure and the activity of the anchorage during loading. In addition, strain gauges were installed on the internal tendons and the concrete surface. A displacement transducer that can measure the activity of the anchorage during and after strengthening was installed, and a load cell was installed at the end of the external tendon to check the change in the introduced tension.

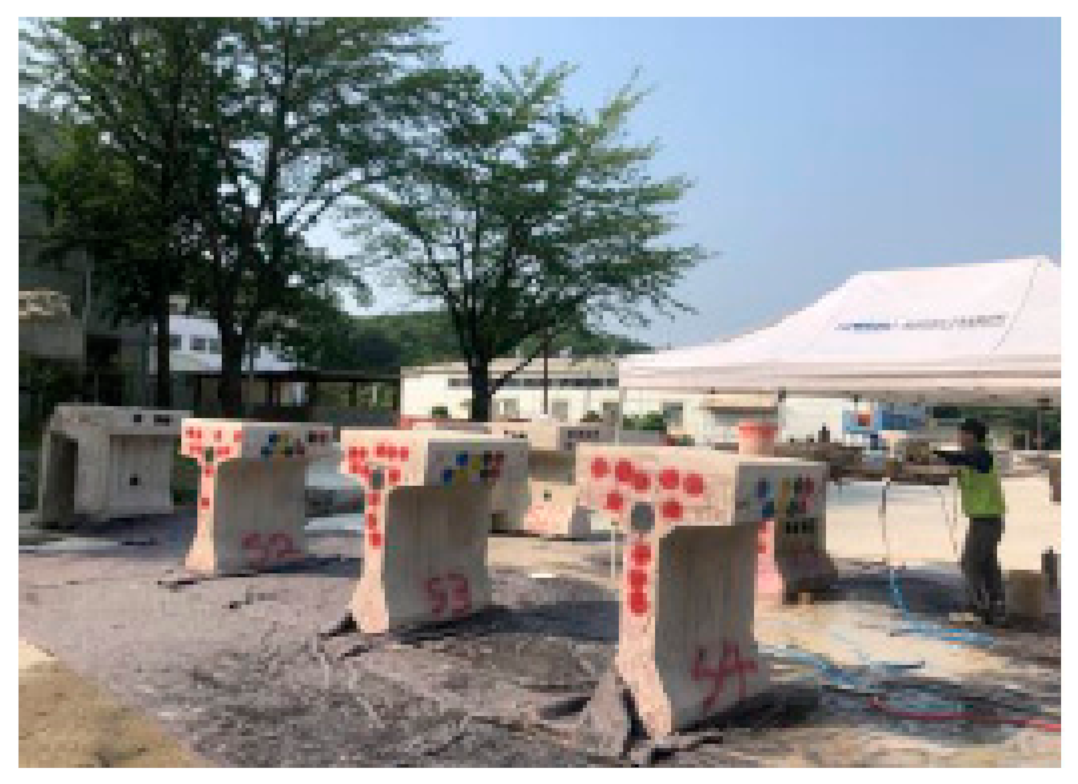
2.4. Strengthening Deteriorated Bridge

In the case of the external prestressing method, the performance of the anchorage is critical for achieving a sufficient strengthening effect. In some cases, the strengthening effect could not be properly verified due to the early elimination of the anchorage. This is because if the anchorage is designed with the tensile strength of the external tendons or the stress borne by the external tendons at the point of failure of the structure, the anchorage becomes excessively large. Therefore, it was confirmed that the anchorage was designed using prestressing force jacked in some parts. Therefore, in this study, the tensile strength of the external tendon was considered as the design strength when designing the anchorage and anchor bolt spacing, complying with the regulations. In addition, early destruction of the anchorage was prevented by considering side anchor bolts that were not considered in the design phase of the construction.
A leaflet-type anchorage that supports all loads with the installed anchor bolts was used, and in consideration of the anchorage performance, two strands were distributed and fixed as shown in Figure 5.
The prestressing force designed for each external tendon was 180 kN, and the maximum tension forces introduced into the four external tendons measured using the load cell were 184.8, 180.0, 179.5, and 181.5 kN as shown in Table 2.
It was confirmed that the introduced tension was reduced according to the slip generated during the process of fixing the tendon to the fixing device and the loss in elasticity due to the tension of the subsequent tendon. Moreover, the amount of activity of the anchorage according to the introduction of the tension force to the individual tendon was 0.06 mm, and it was observed that the anchorage ensured safety with regard to the applied tension. Finally, a displacement of 11.5 mm (rise) occurred in the middle of the span when all prestressing forces were applied. The displacement of the girder due to the prestressing of the external tendons is presented in Figure 7.

3. Experiment Result and Analysis

Figure 8 presents the displacement of the anchorage. Where, the number means the number of the tendon, H means the horizontal displacement, and V means the vertical displacement. The maximum displacement that occurred as shown in Figure 8 was 0.5 mm, and the safety of the anchorage was secured even when the load increased.
Figure 9 presents the stress of the external tendon as the load increases. The mechanical properties of the external tendon are 15.2 mm in diameter, 138.7 mm2 in area, 222 kN yield load, and 261 kN tensile load. As experimental results, the yield was confirmed at about 210 kN, and the failure of the external tendon occurred around 230 kN. This is different from the theoretical mechanical properties, and it is judged as an experimental error caused by not aligning with the tendon when installing the loadcell.
Figure 10 presents the load–displacement relationship of the girder before and after strengthening. Before strengthening, the girder was additionally loaded with only 570 kN. After strengthening with all external tendons jacking, the girder was loaded with 1028 kN, according to the progress of the bending crack. The experiment after strengthening ended with failure of the external tendon, not with the dropout of the anchorage. Until the end of the experiment, detachment or cracking of the anchorage was not observed, suggesting that the tensile strength of the strands was sufficient when designing the anchorage.
When a crack occurs on the surface of concrete, the values measured using the attached strain gauge fluctuate rapidly. Hence, the measured value after the occurrence of the crack is unreliable. Accordingly, to compare the behavioral characteristics before and after strengthening, the strengthening performance was compared through the deflection measurement result, reflecting the overall behavioral characteristics and using the strain gauge attached by exposing the internal tendon after crushing the concrete surface.
For the analysis of the experimental values, the effective cross-sectional second moment analysis method was applied as in Equation (1) [35]. This is calculated by simplifying the load–displacement relationship of the cracked member into two straight lines with slopes of I g and I c r . Compared to the simplified calculation, when the effective cross-sectional second moment was applied, I e was closer to the experimental value.
I e = I c r + M c r M a 3 I g I c r
where, I e represents the effective section secondary moment, I c r represents the crack section secondary moment, M c r represents the bending cracking moment of the section, M a represents the maximum bening moment acting on the member, and I g represents the non-cracked section secondary moment.
I g was calculated as the second moment of the entire section, and I c r was calculated as in Equation (2) from the crack moment. The slope of the graph calculated using I g , I e , and I c r after cracking is presented in Table 3. Each result has a similar meaning for stiffness. The slope of the theoretical value presented in Figure 10 has the same meaning as stiffness. As shown in Table 3, there is only a slight difference according to the crack load, but the slope of the theoretical value is the same, so it is difficult to confirm the actual strengthening effect before cracking.
M c r = f r Z 2 + P e Z 2 2 A c + e p
where, M c r represents the bending cracking moment of the section, f r represents the concrete tensile strength, Z 2 represents section constant, P e represents prestressing force, A c represents concrete section area, and e p represents distance to tendon.
It was confirmed that the slope of the load–displacement relationship changed at approximately 240 kN before strengthening and at approximately 470 kN after strengthening, resulting in concrete cracking and an increase of approximately 50% of the crack load. However, as shown in Figure 10b, the graph of the pre-crack load–displacement relationship before and after strengthening was identical. This means that the stiffness is the same, so it was difficult to compare the stiffness before and after the stiffness to confirm the strengthening effectiveness. Therefore, in the case of a real bridge, it is difficult to determine the crack load through an experiment; hence, it is concluded that confirming the reinforcing effect before cracking would be challenging. In addition, when comparing the amount of deflection generated by the same load before and after strengthening, it can be seen that the amount of deflection after applying strengthening decreases as shown in Table 4. At 400 kN, the deflection before strengthening was 39.7 mm, whereas after strengthening, a deflection of 30.3 mm occurred, confirming a strengthening effect of approximately 23.7%. In addition, at 470 kN, when cracks occur, the deflections before and after strengthening were 51.7 mm and 37.2 mm, respectively, and the strengthening effect was measured to be 28%; it was judged that the strengthening effect increased as the load increased. In the final loading phase before and after strengthening, a deflection of 77.1 mm and 51.3 mm occurred, respectively, confirming a 33% strengthening effect.
Therefore, for the deteriorated bridge used in this experiment, the load carrying capacity increased by approximately 33% with an external prestressing of 180 kN for four tendons.
Figure 11 presents the load–strain relationship occurring in the internal tendons before and after strengthening. The load–strain relationship of the internal tendons was also similar to the load–displacement relationship, so it was difficult to confirm the reinforcement effect as the slope before and after reinforcement was the same before cracking. However, the strengthening effect confirmed through the load-displacement relationship presented in Table 4 and the strengthening effect confirmed through the load-strain relationship presented in Table 5 was slightly different in value. The strain of the internal tendon was 555 με at 400 kN before strengthening. After strengthening, a strain of 366 με was generated, confirming a reinforcement effect of approximately 34.1%. In addition, at 470 kN, where cracks occur, the strains before and after strengthening were 741 με and 452 με, respectively, and a strengthening effect of 39% was measured.
In the final loading phase before and after strengthening, strains of 1115 με and 698 με occurred, respectively, confirming a 37.4% strengthening effect. At a load of 570 kN, the strengthening effect of the load–displacement relationship was 33%, and the strengthening effect of the load–strain relationship was 37.4%, showing a difference of 4%. Therefore, it can be concluded that it is difficult to confirm the exact strengthening effect through fragmentary information such as deflection and strain.

4. Conclusions

In this study, the material properties of 45-year-old PSC girder bridges were investigated and the strengthening effect of applying the external prestressing method was experimentally verified. For the purpose of this study, concrete and tendon material properties and effective tension evaluation were performed on the deteriorated bridge, and the load carry capacity of the bridge was compared through four-point loading tests before and after strengthening.
The results of this experiment are expected to contribute to verifying the performance of the existing deteriorated prestressed concrete bridge and determining the required amount of strengthening.
The results derived from this study are as follows.
(1)
As a result of conducting a concrete material test by collecting approximately 50 cores from the girders of an old bridge, the compressive strength of concrete was found to be 33 MPa, which was 22% higher than that used in the design (27 MPa). However, it was not possible to confirm the change in compressive strength due to the absence of the experimental values during the bridge’s construction. In addition, as a result of performing the tensile strength test by cutting five tendons in the deteriorated bridge, it can be concluded that the decrease in tensile performance was not significant as the tendons used in the bridge exposed for 45 years were also sealed with grout.
(2)
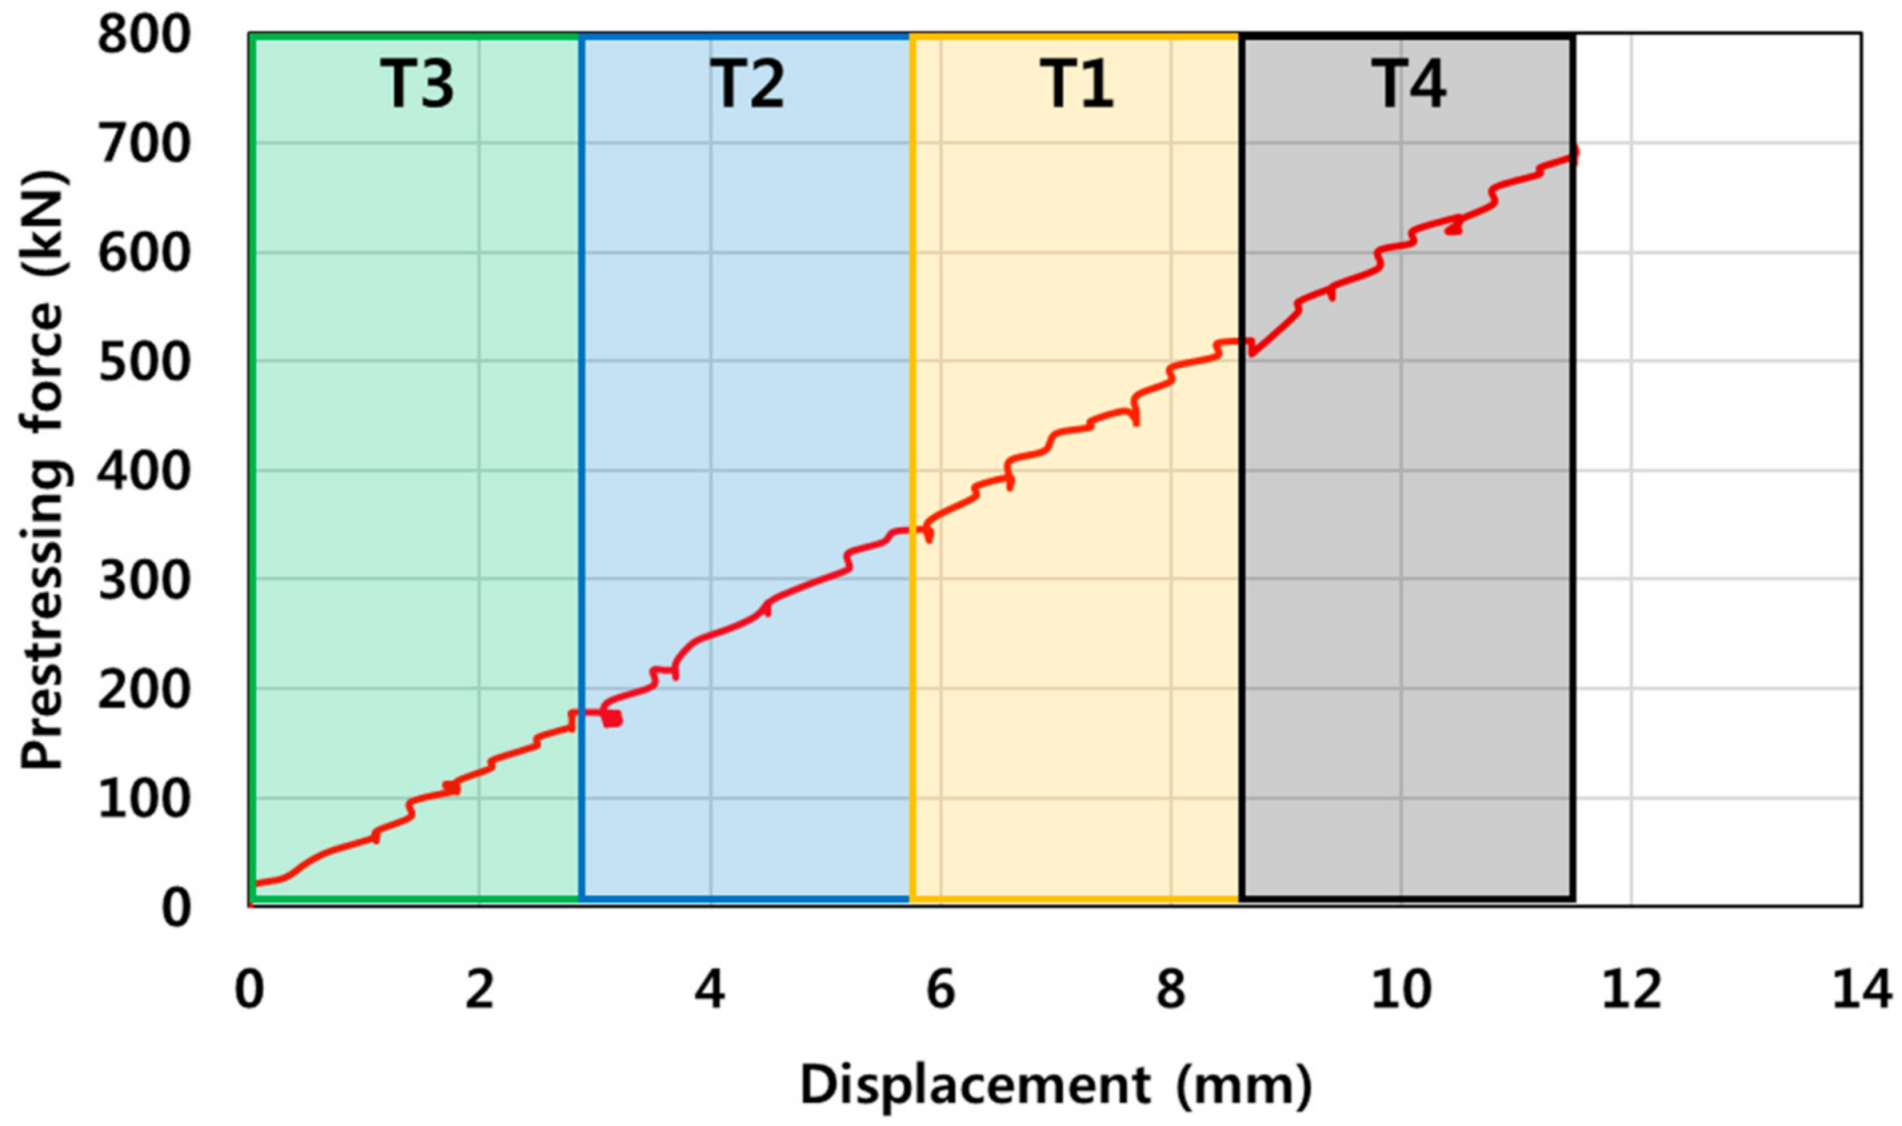
After exposing the internal tendon of the deteriorated bridge, the tendon was pulled in the transverse direction to evaluate the effective tension of the existing tendon. The effective tension is 25.1~32.7 kN and assuming the maximum introduced tension, the effective tension of 40~53% is measured; it is conceivable that about 50% of the prestressing force is lost during its service period.
(3)
When designing the anchorage for strengthening using the external prestressing method, in some cases, early failure of the anchorage was confirmed by considering the design strength up to the applied tension and not the tensile strength of the tendon. However, in this study, the anchorage did not fail until the member was destroyed because of the design reflecting the tensile strength of the tendon, the regulation of the anchor bolt spacing, and the strict consideration of the side anchors not considered in the design. Thus, it was confirmed that sufficient attention is required when managing strengthening design.
(4)
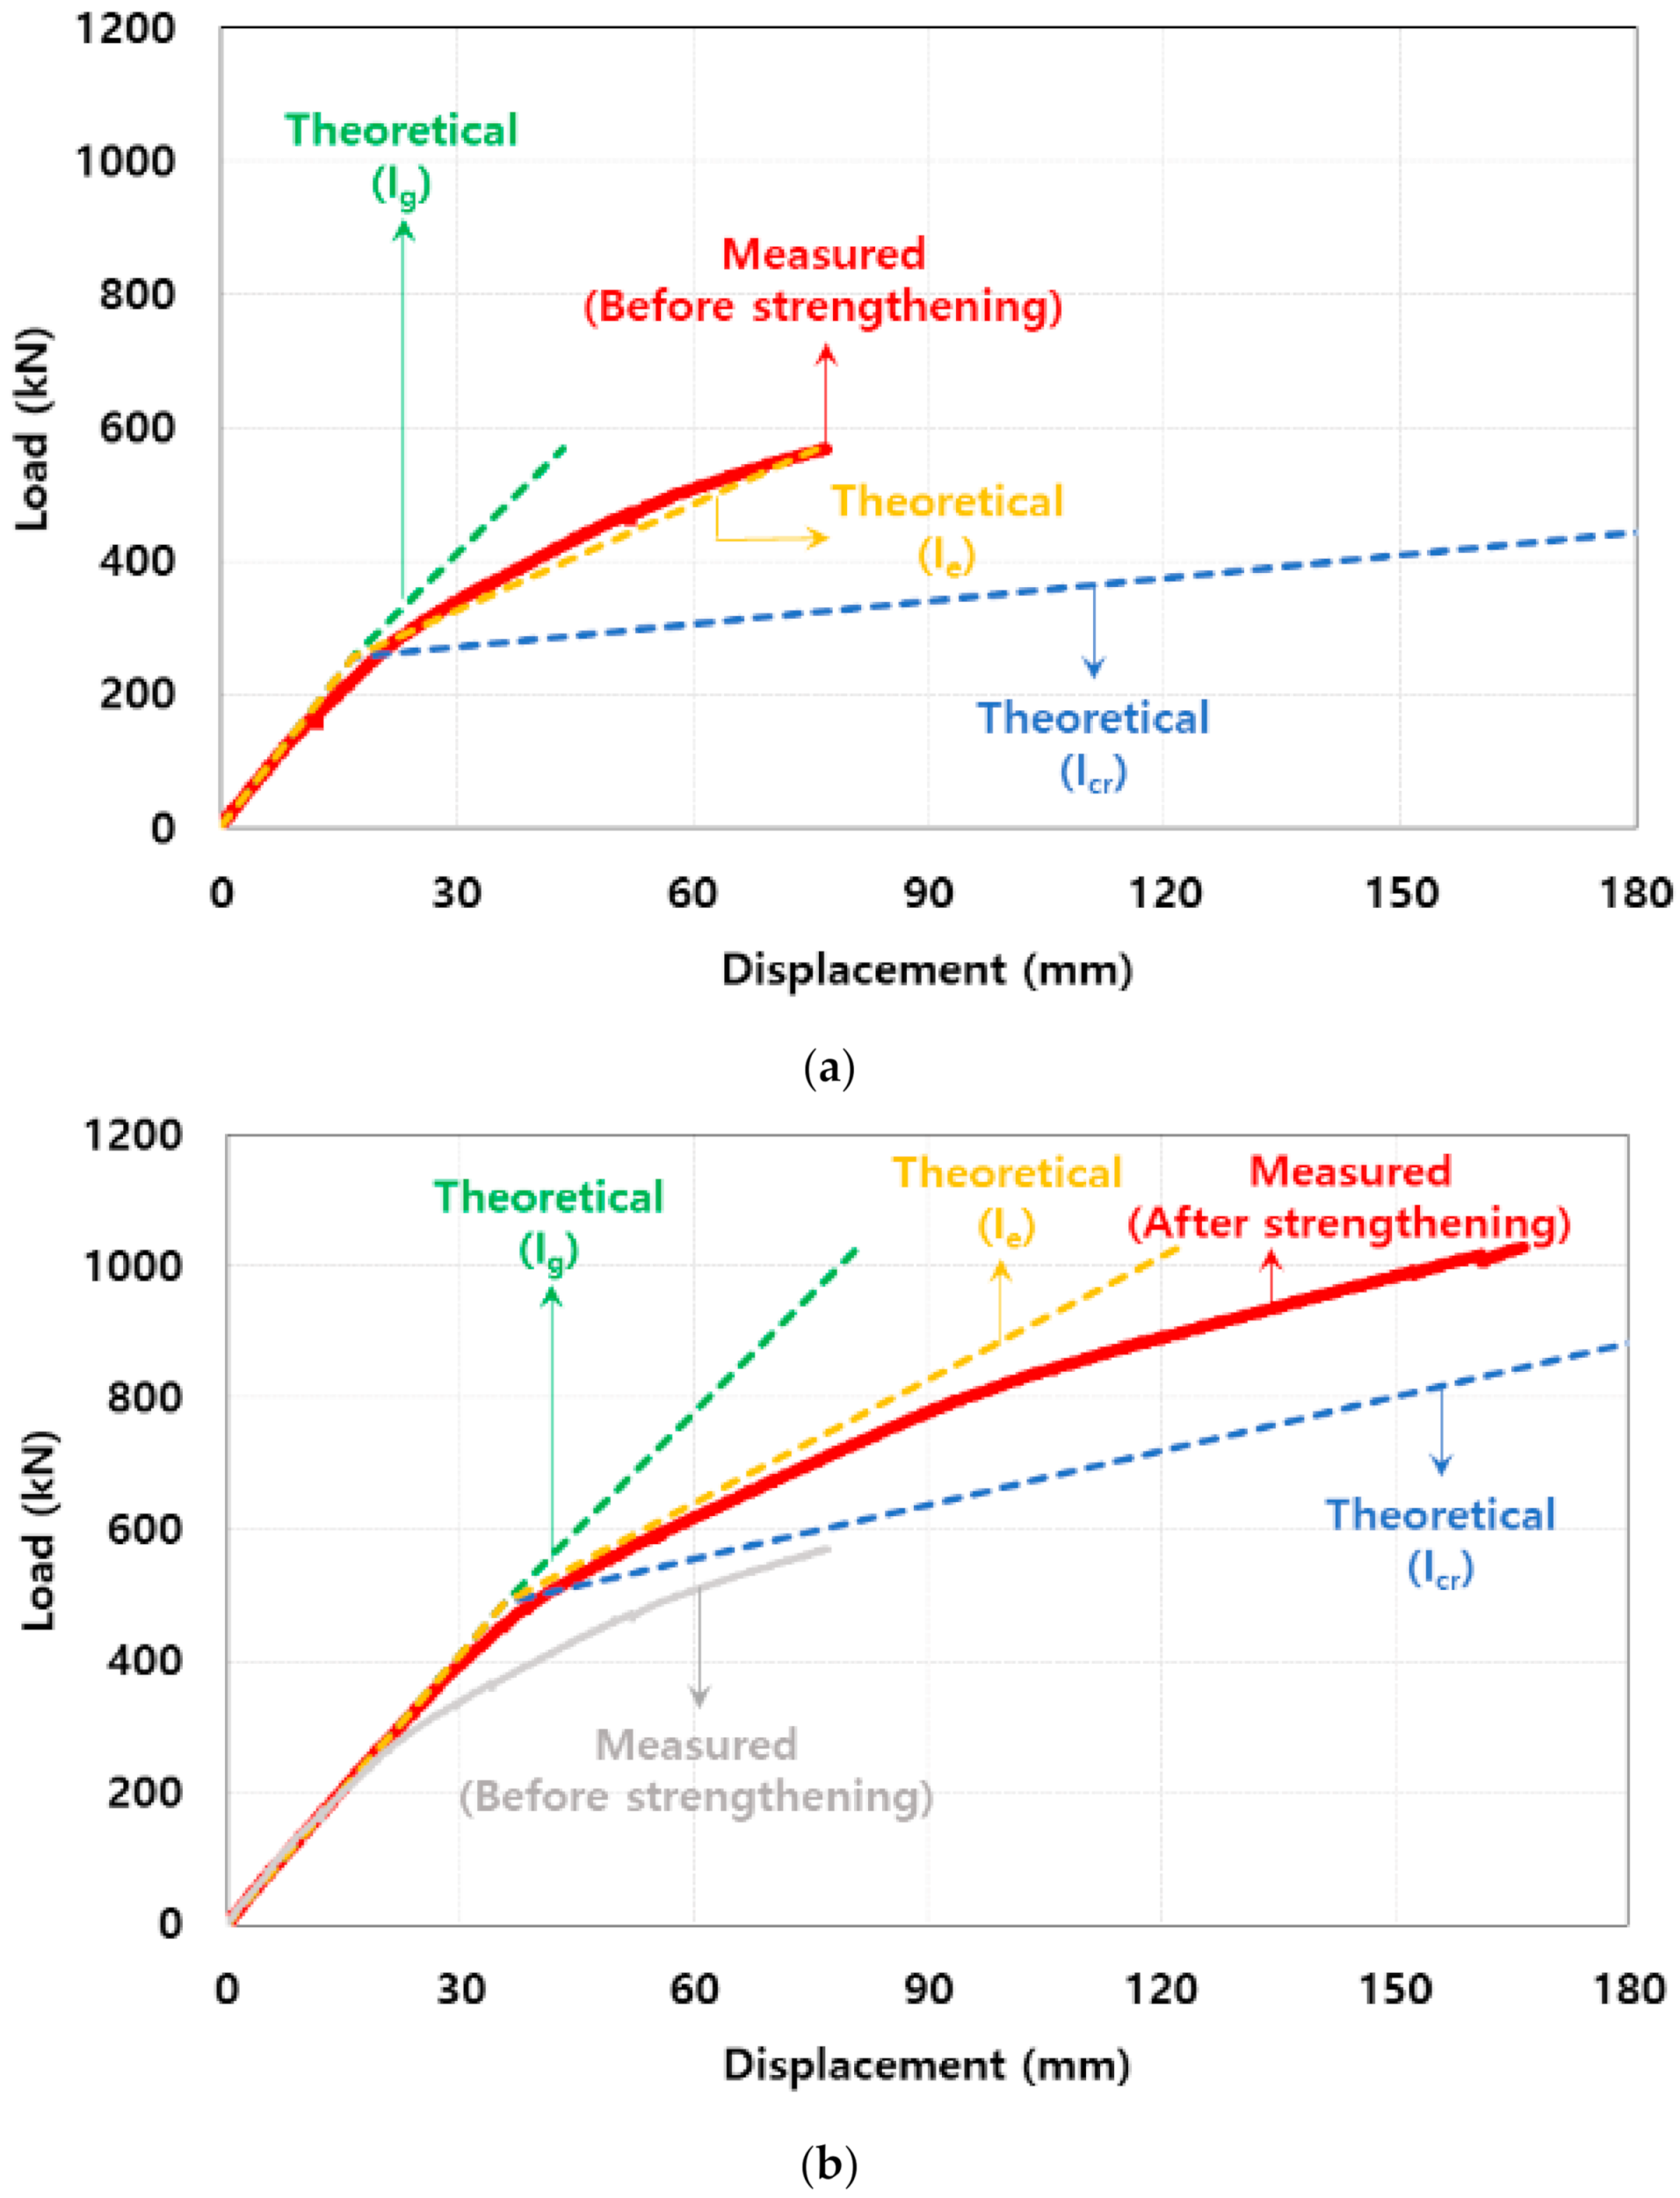
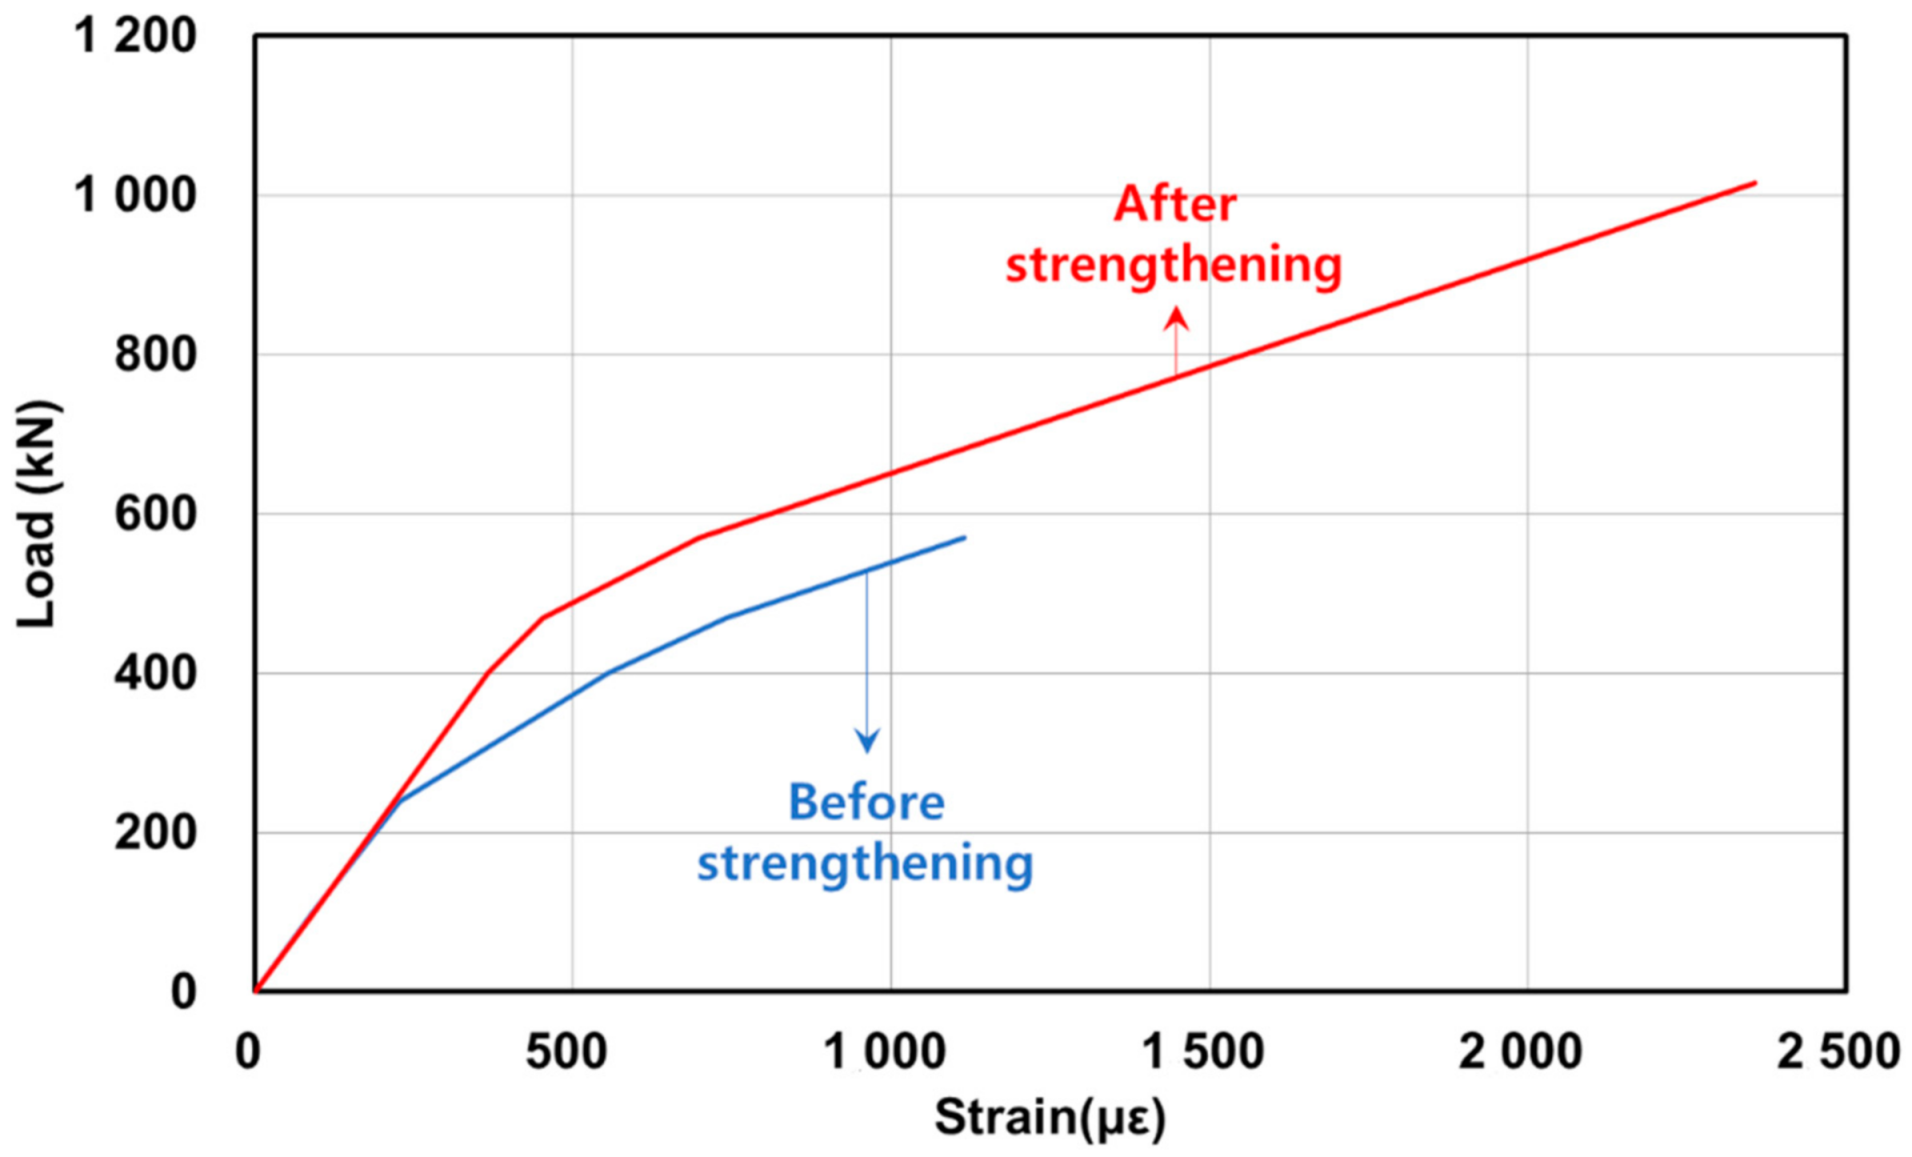
The four-point loading test before and after strengthening was performed, and the strengthening effect was determined through the increase in the measured crack load. Moreover, the behavior of the bridge was relatively accurately predicted by applying the effective moment of inertia. In addition, it was difficult to determine the strengthening effect before cracking because the external tensioning method had a minimal contributive effect on the stiffness before cracking.

Author Contributions

Conceptualization, S.-H.K. and J.-S.P.; methodology, S.-H.K. and J.-S.P.; software, S.-H.K. and T.-K.K.; validation, S.-H.K. and H.-B.P.; formal analysis, S.-H.K.; investigation, W.-T.J.; resources, S.-H.K. and W.-T.J.; data curation, S.-H.K.; writing—original draft preparation, S.-H.K.; writing—review and editing, S.-H.K. and J.-S.P.; visualization, S.-H.K.; supervision, J.-S.P.; project administration, J.-S.P.; funding acquisition, J.-S.P. All authors have read and agreed to the published version of the manuscript.

Funding

This research was funded by the Smart Civil Infrastructure Research Program for the Ministry of Land, Infrastructure and Transport of the Korean Government, grant number 17SCIP-B128496-01.

Institutional Review Board Statement

Not applicable.

Informed Consent Statement

Not applicable.

Data Availability Statement

The data presented in this study are available on request from the corresponding author.

Acknowledgments

This research was supported by a grant (17SCIP-B128496-01) from the Smart Civil Infrastructure Research Program funded by the Ministry of Land, Infrastructure and Transport of the Korean government.

Conflicts of Interest

The author declares no conflict of interest.

References

  1. Jung, W.T.; Park, J.S.; Kang, J.Y.; Park, H.B. Strengthening effect of prestressed near-surface-mounted CFRP tendon on reinforced concrete beam. Adv. Mater. Sci. Eng. 2018, 9210827. [Google Scholar] [CrossRef] [Green Version]
  2. Park, H.B.; Park, J.S.; Kang, J.Y.; Jung, W.T. Fatigue Behavior of Concrete Beam with Prestressed Near-Surface Mounted CFRP Reinforcement According to the Strength and Developed Length. Materials 2019, 12, 51. [Google Scholar] [CrossRef] [Green Version]
  3. Jung, W.T.; Park, J.S.; Kang, J.Y.; Keum, M.S. Flexural behavior of concrete beam strengthened by near-surface mounted CFRP reinforcement using equivalent section model. Adv. Mater. Sci. Eng. 2017, 2017, 1–16. [Google Scholar] [CrossRef] [Green Version]
  4. Kim, S.H.; Park, S.Y.; Park, Y.H.; Jeon, S.J. Friction characteristics of post-tensioning tendons in full-scale structures. Eng. Struct. 2019, 183, 389–397. [Google Scholar] [CrossRef]
  5. Kim, S.H.; Park, S.Y.; Jeon, S.J. Long-term characteristics of prestressing force in post-tensioned structures measured using smart strand. Appl. Sci. 2020, 10, 4084. [Google Scholar] [CrossRef]
  6. Potson, R.W.; Frank, K.H.; West, J.S. Enduring strength. Civ. Eng. ASCE 2003, 73, 58–63. [Google Scholar]
  7. Lee, H.Y.; Jung, W.T.; Chung, W.S. Field test of an old RC bridge before and after NSM strengthening. Comp. Struct. 2018, 202, 793–801. [Google Scholar] [CrossRef]
  8. Lee, H.Y.; Jung, W.T.; Chung, W.S. Flexural strengthening of reinforced concrete beams with pre-stressed near surface mounted CFRP systems. Comp. Struct. 2017, 163, 1–12. [Google Scholar] [CrossRef]
  9. Lee, H.Y.; Jung, W.T.; Chung, W.S. Post-tension near-surface-mounted strengthening systems of full-scale PSC girders. Constr. Build. Mater. 2017, 151, 71–82. [Google Scholar] [CrossRef]
  10. Lee, H.Y.; Jung, W.T.; Chung, W. Post-tension near-surface mounted strengthening system for reinforced concrete beams with changes in concrete condition. Compos. Part B Eng. 2019, 161, 514–529. [Google Scholar] [CrossRef]
  11. Jung, W.T.; Park, J.S.; Kang, J.Y.; Keum, M.S.; Park, Y.H. Flexural behaviour of RC beams strengthened with prestressed CFRP NSM tendon using new prestressing system. Int. J. Polym. Sci. 2017, 2017, 1–9. [Google Scholar] [CrossRef] [Green Version]
  12. Herbrand, M.; Classen, M. Shear tests on continuous prestressed concrete beams with external prestressing. Struct. Concr. 2015, 16, 428–437. [Google Scholar] [CrossRef]
  13. Pisani, M.A. Behaviour under long-term loading of externally prestressed concrete beams. Eng. Struct. 2018, 160, 24–33. [Google Scholar] [CrossRef]
  14. Senthil, R.; Manisekar, R. Ultimate flexural behaviour of externally prestressed new beams and distressed beams. J. Eng. Sci. Technol. 2015, 10, 461–484. [Google Scholar]
  15. Kaur, H.; Singh, J. A Review on external prestressing in concrete. Int. Res. J. Eng. Technol. 2017, 4, 1801–1805. [Google Scholar]
  16. Li, Y.Y.; Guo, B.; Liu, J. Research on reinforced concrete beam enlarged cross section method experiment and finite element simulation. Appl. Mech. Mater. 2014, 638, 208–213. [Google Scholar] [CrossRef]
  17. Lee, B.J.; Park, J.K.; Kim, M.Y.; Shin, H.M.; Park, C.H. Experimental study on flexural behavior of PSC I girder and the effect of external prestressing. J. Korea Concr. Inst. 2007, 19, 755–762. [Google Scholar]
  18. Xue, W.; Tan, Y.; Peng, F. Experimental study on damaged prestressed concrete beams using external post-tensioned tendons. ACI Struct. J. 2020, 117, 159–168. [Google Scholar] [CrossRef]
  19. Carin, L.; Jose, A.; John, E.; Michael, E. Field measurements of prestress losses in external tendons. ACI Struct. J. 1996, 93, 596–601. [Google Scholar]
  20. Carin, L.; Michael, E.; David, M.; John, E. Stresses in external tendons at ultimate. ACI Struct. J. 2005, 102, 206–213. [Google Scholar]
  21. Aparicio, A.C.; Ramos, G.; Casas, J.R. Testing of externally prestressed concrete beams. Eng. Struct. 2002, 24, 73–84. [Google Scholar] [CrossRef]
  22. Russell, B.W.; Burns, N.H. Measured transfer lengths of 0.5 and 0.6 in. strands in pretensioned concrete. PCI J. 1996, 41, 44–65. [Google Scholar] [CrossRef]
  23. Shenoy, C.V.; Gregory, C.F. Structural tests of 27-year-old prestressed concrete bridge beams. PCI J. 1991, 36, 80–90. [Google Scholar] [CrossRef]
  24. Pessiki, S.; Kaczinski, M.; Wescott, H.H. Evaluation of effective prestress force in 28-year-old prestressed concrete bridge beams. PCI J. 1996, 41, 78–89. [Google Scholar] [CrossRef]
  25. Tabatabai, H.; Dickson, T.J. Structural evaluation of a 34-year-old precast post-tensioned concrete girder. PCI J. 1993, 38, 50–63. [Google Scholar] [CrossRef]
  26. Naaman, A.E.; Burns, N.H.; French, C.; Gamble, W.L.; Mattock, A.H. Stresses in unbonded prestressing tendons at ultimate: Recommendation. ACI Struct. J. 2002, 99, 518–529. [Google Scholar]
  27. Saiidi, M.S.; Shields, J.; Oconnor, D.; Hutchens, E. Variation of prestress force in a prestressed concrete bridge during the first 30 months. PCI J. 1996, 41, 66–72. [Google Scholar] [CrossRef]
  28. Ramos, G. Flexural strength of externally prestressed concrete bridge. ACI Struct. J. 1996, 93, 512–523. [Google Scholar]
  29. Harajli, M.H.; Mabsout, M.E.; Al-Hajj, J.A. Response of externally post-tensioned continuous members. ACI Struct. J. 2002, 99, 671–680. [Google Scholar]
  30. Chun, S.C.; Mohsen, S. Understanding capacity rating of bridge from load tests. Pract. Period. Struct. Constr. 2003, 8, 209–216. [Google Scholar]
  31. Naaman, A.E.; Aldhairi, F.M. Stress at ultimate in unbonded post-tensioning tendon: Part 1-Evaluation of the state of the art. ACI Struct. J. 1991, 85, 641–650. [Google Scholar]
  32. Naaman, A.E.; Aldhairi, F.M. Stress at ultimate in unbonded post-tensioning tendon: Part 2-Proposed methodology. ACI Struct. J. 1991, 88, 683–690. [Google Scholar]
  33. Ozkul, O.; Nassif, H.; Tanchan, P.; Harajli, M.H. Rational approach for prediction stress in beams with unbonded tendons. ACI Struct. J. 2008, 105, 338–347. [Google Scholar]
  34. ACI Committee 318. Building Code Requirements for Structural Concrete; ACI 318-19; American Concrete Institute (ACI): Farmington Hills, MI, USA, 2019. [Google Scholar]
  35. Branson, D.E. Deformation of Concrete Structures, 1st ed.; McGraw Hill: New York, NY, USA, 1997; pp. 242–263. [Google Scholar]
Figure 1. Front view of the deteriorated bridge.
Applsci 11 02478 g001
Figure 2. Cross section of the deteriorated bridge (unit: mm).
Applsci 11 02478 g002
Figure 3. Core sampling.
Applsci 11 02478 g003
Figure 4. Evaluation of internal tendon force.
Applsci 11 02478 g004
Figure 5. Experimental setting.
Applsci 11 02478 g005
Figure 6. Anchorage sensor setting.
Applsci 11 02478 g006
Figure 7. Displacement according to prestressing.
Applsci 11 02478 g007
Figure 8. Anchorage displacement.
Applsci 11 02478 g008
Figure 9. External tendon force.
Applsci 11 02478 g009
Figure 10. Load-displacement relationship: (a) Before strengthening; (b) After strengthening.
Applsci 11 02478 g010
Figure 11. Load–strain relationship.
Applsci 11 02478 g011
Table 1. Result of internal tendon force measurement.
Duct No.Distance 1 (m)Tendon No.Measured
Force (kN)Stress (MPa)
15130.8613
232.7650
291Tension released
233.4664
325.1499
3231Tension released
2Tension released
1 Distance from left end.
Table 2. Tendon force and anchorage displacement.
Jacking OrderTendon Force (kN)Anchorage Displ. (mm)
Jacking ForceSetting LossElastic LossHorizontalVertical
T13184.8172.8172.00.060.05
T22180.0171.0168.30.030.01
T31179.5169.3164.50.020
T44181.5175.5175.50.020.02
Table 3. Comparison of slope.
Slope (kN/mm)
I g I e I c r
Before strengthening11.75.31.1
After strengthening11.96.22.7
Table 4. Comparison of displacement before and after strengthening.
Load (kN)Displacement (mm)Strengthening Effect 3 (%)Remark
Before 1After 2
1006.67.2-
24018.317.4-Before 1 crack
40039.730.323.7
47051.737.228.0After 2 crack
57077.151.333.0
1060-161.2-
1 Before strengthening; 2 After strengthening; 3 (Before strengthening–After strengthening)/Before strengthening.
Table 5. Comparison of internal tendon strain before and after strengthening.
Load (kN)Strain (με)Strengthening Effect 3 (%)remark
Before 1After 2
1009094-
240227220-Before 1 crack
40055536634.1
47074145239.0After 2 crack
570111569837.4
1060-2357-
1 Before strengthening; 2 After strengthening; 3 (Before strengthening−After strengthening)/Before strengthening.
Publisher’s Note: MDPI stays neutral with regard to jurisdictional claims in published maps and institutional affiliations.

