Article

R1234ze(E) Flow Boiling inside a 2.5 mm ID Smooth Tube and Comparison against an Equivalent Microfin Tube

Department of Industrial Engineering, University of Padova, Via Venezia 1, 35131 Padova, Italy
*
Author to whom correspondence should be addressed.
Appl. Sci. 2021, 11(6), 2627; https://doi.org/10.3390/app11062627
Submission received: 23 February 2021 / Revised: 9 March 2021 / Accepted: 12 March 2021 / Published: 16 March 2021
(This article belongs to the Special Issue Two-Phase Heat Transfer in Industrial Engineering)

Abstract

:
The air conditioning and refrigeration industry is now dealing with an imminent substitution of widely implemented refrigerants having a non-negligible global warming impact. Among the proposed hydrofluoroolefins, R1234ze(E) has thermodynamic and transport properties close to those of R134a, and thus it can be one of its substitutes. This paper experimentally analyzes R1234ze(E) flow boiling inside a smooth tube with an internal diameter of 2.5 mm. Mass velocity is investigated from 200 to 600 kg m−2 s−1, for vapor quality from 0.15 to 0.99. The test tube is electrically heated by the Joule effect, by supplying heat fluxes from 12 to 60 kW m−2. Heat transfer coefficients and frictional pressure drops were evaluated from the experimental tests, and compared against values estimated by empirical correlations. Additional experimental tests permitted the comparison between the thermal and hydraulic characteristics of the smooth tube and those of a microfin tube with an inner diameter at the fin tip of 2.4 mm. The comparison revealed the higher contribution of convective boiling for the microfin tube compared to the smooth tube for all of the investigated working conditions.

1. Introduction

Hydrofluoroolefins (HFOs) are a class of synthetic refrigerants that are derived from propane. Due to their chemical structure, they are chemically unstable once released in the atmosphere; therefore, they rapidly decompose, lowering their global warming impact. In addition, since they are not made by chlorine, they do not contribute to the ozone layer depletion, having a null ozone depletion potential (ODP). Among the first published works related to HFOs, Brown et al. [1] presented critical temperatures, critical pressures, critical densities, acentric factors, and ideal gas specific heats for eight fluorinated olefins: R225ye(E), R225ye(Z), R1225zc, R1234ye(E), R1234yf, R1234ze(E), R1234ze(Z), andR1243. Thermodynamic properties for these refrigerants were also estimated with the Peng–Robinson equation of state. Later on, numerous studies have followed, measuring the thermodynamic and transport properties of R1234ze(E). Thol and Lemmon [2] proposed an equation of state for the calculation of thermodynamic properties of R1234ze(E). Correlations for the estimation of R1234ze(E) liquid and vapor viscosities were validated by Huber and Assael [3], of thermal conductivity by Perkins and Huber [4], and of surface tension by Mulero and Cachadiña [5]. All of the aforementioned models are implemented in REFPROP 10 [6] for the estimation of R1234ze(E) properties.
R1234ze(E) is, among the proposed HFOs, one of the possible alternatives to R134a for medium/high temperature systems. Its major benefit, compared to R134a, is its extremely low global warming potential (GWP), which is below than 1, as stated by Hodnebrog et al. [7].
Considering works related to R1234ze(E) two-phase heat transfer inside tubes, one of the first experimental studies was conducted by Park et al. [8]. They studied R1234ze(E) condensation heat transfer inside a multiport tube with a hydraulic diameter of 1.45 mm, for mass velocity from 50 to 260 kg m−2 s−1, at saturation temperature from 30 °C to 70 °C. The condensation heat transfer coefficient showed a decrease as vapor quality decreased, as mass velocity decreased and as saturation temperature increased. The heat transfer performance of R1234ze(E) was about 15–25% lower than that of R134a and similar to that of R245fa under the same working conditions.
Del Col et al. [9] investigated the local heat transfer coefficient of R1234ze(E) during condensation inside a single minichannel with a hydraulic diameter of 0.96 mm. Mass velocity was varied from 100 to 800 kg m−2 s−1, at saturation temperature between 38.6 °C and 40.9 °C. The condensation heat transfer coefficients for R1234ze(E) resulted lower than those for R32, comparable to those for R134a and higher than those for R1234yf, under the same saturation temperature and mass flux. The frictional pressure drops of R1234ze(E) resulted higher than those of R134a and R1234yf under the same working conditions.
R1234ze(E) condensation inside minichannels was also studied by Liu et al. [10], whose minichannels had circular and squared section with hydraulic diameter of 1.085 mm and 0.952 mm, respectively. The saturation temperatures were 40 °C and 50 °C, mass velocities were from 200 to 800 kg m−2 s−1. The comparison against propane and R22 revealed that both the heat transfer coefficients and pressure drops of R1234ze(E) were in between the other two fluids. Other experimental research aimed at studying condensation of R1234ze(E) inside tubes can be found in [11,12,13].
Among the first works which studied flow boiling of R1234ze(E), Vakili-Farahani et al. [14] analyzed a multiport tube with a hydraulic diameter of 1.45 mm for mass velocity in the range 50–400 kg m−2 s−1, heat flux in the range 3–107 kW m−2, for saturation temperature from 30 °C to 70 °C. The experimental results showed that the heat transfer coefficient increased as saturation temperature, heat flux, and mass velocity increased. R1234ze(E) showed higher values of heat transfer coefficient compared to R245fa for all of the tested working conditions.
Another multiport microchannel with a hydraulic diameter of 0.643 mm was studied by Li and Hrnjak [15] during flow boiling of R1234ze(E) at mass velocity from 100 to 200 kg m−2 s−1, heat flux from 2 to 6 kW m−2, and saturation temperature from 20 °C to 40 °C. Compared to R134a, R1234ze(E) showed similar heat transfer coefficients and slightly higher pressure drops.
Flow boiling of R1234ze(E) inside larger diameter tubes were studied by Yang et al. [16], who considered a horizontal smooth tube with an inner diameter of 6 mm for mass velocity from 130 to 258 kg m−2 s−1 and heat flux from 10.6 to 74.8 kW m−2. A comparison with R600a revealed that R1234ze(E) had lower heat transfer coefficients and pressure drops. A commercial tube with an internal diameter of 4 mm was analyzed by Longo et al. [17], for mass flux from about 200 to 600 kg m−2 s−1, heat flux in the range 10–30 kW m−2, and saturation temperature from 10 °C to 20 °C. In the tested working conditions, R1234ze(E) showed heat transfer coefficients similar to those of R134a and frictional pressure drop 10–25% higher than those of R134a.
As it appears from this brief introduction, most of the works related to R1234ze(E) flow boiling are related either to microchannels or to macrochannels, whereas there is a lack of experimental data in the transition range of diameters. Regarding the transition criterion between microscale and macroscale, Ong and Thome [18] introduced threshold values based on the confinement number, Co: microscale flow for values of Co higher than 1.0, whilst macroscale flow for values of Co lower than 0.3–0.4. The region in between is referred as mesoscale.
This paper is aimed at presenting some experimental data during R1234ze(E) flow boiling inside a smooth tube with an internal diameter of 2.5 mm, in a wide range of working conditions: mass velocity from 200 to 600 kg m−2 s−1, heat flux from 12 to 60 kW m−2, and saturation temperature from 25 °C to 35 °C, which is suitable for high temperature heat pumps or for electronics cooling applications. These working conditions, coupled with the tube diameter, correspond to a confinement number equal to 0.34, which falls into the mesoscale flow as suggested by Ong and Thome [18]. These experimental data will permit to validate empirical correlations from the literature for the estimation of heat transfer coefficient and frictional pressure drop. Furthermore, additional experimental tests at different mass velocities have permitted a comparison among the smooth tube and a microfin tube with an inner diameter at the fin tip of 2.4 mm, whose experimental tests were previously carried out, in order to highlight the effect of the internal fins on R1234ze(E) flow boiling mechanism.

2. Experimental Facility and Test Section

The experimental flow boiling tests were run in a facility that was previously built in the Laboratory of Heat Transfer in Microgeometry located in the Department of Industrial Engineering of the University of Padova. The facility was developed with the aim of studying two phase heat transfer (flow boiling and/or condensation) of refrigerants in a wide range of operating conditions. The maximum allowable pressure is 30 bar with a maximum mass flow rate of 72 kg h−1. The facility is used in the present research in flow boiling configuration.
The facility, a schematic of which is shown in Figure 1, is composed of the main refrigerant loop whose heat exchangers are connected to auxiliary loops. It is a liquid pumped facility, where a magnetic coupled gear pump is aimed at circulating the refrigerant through the different heat exchangers. After passing through a Coriolis effect mass flow meter (accuracy ±0.1% of the reading), the refrigerant passes from subcooled liquid conditions to superheated vapor conditions in the heat exchanger called evaporator. This heat exchanger is a counter-current brazed plate heat exchanger, where the refrigerant is evaporated and superheated by hot water, supplied in the hot water loop by means of an electric boiler. Superheated conditions are guaranteed by a proportional integral derivative (PID) controller, which controls the electric power of the resistances of the electric boiler and sets the water temperature at the inlet of the heat exchanger at a fixed value of 60 °C.
The superheated refrigerant is then de-superheated and partially condensed in the heat exchanger called pre-condenser, which is connected to a cold water auxiliary loop. This heat exchanger is a double-passage tube-in-tube heat exchanger, where the refrigerant flows in the inner tube, and cold water flows counter-currently in the annulus between inner and outer tube. A stabilized water-cooled chiller, located in the cold water loop, permits to set the water temperature at the inlet of the pre-condenser, and a manually controlled valve permits to vary the water flow rate. Therefore, the heat flow rate in the pre-condenser can be adjusted to set the vapor quality conditions at the outlet of this heat exchanger, which coincide with the inlet of the test section. A magnetic volumetric flow meter (accuracy of ±0.25% of the reading) measures the water flow rate, and a T-type thermopile (accuracy of ±0.03 K) measures the temperature difference at the pre-condenser on the water side.
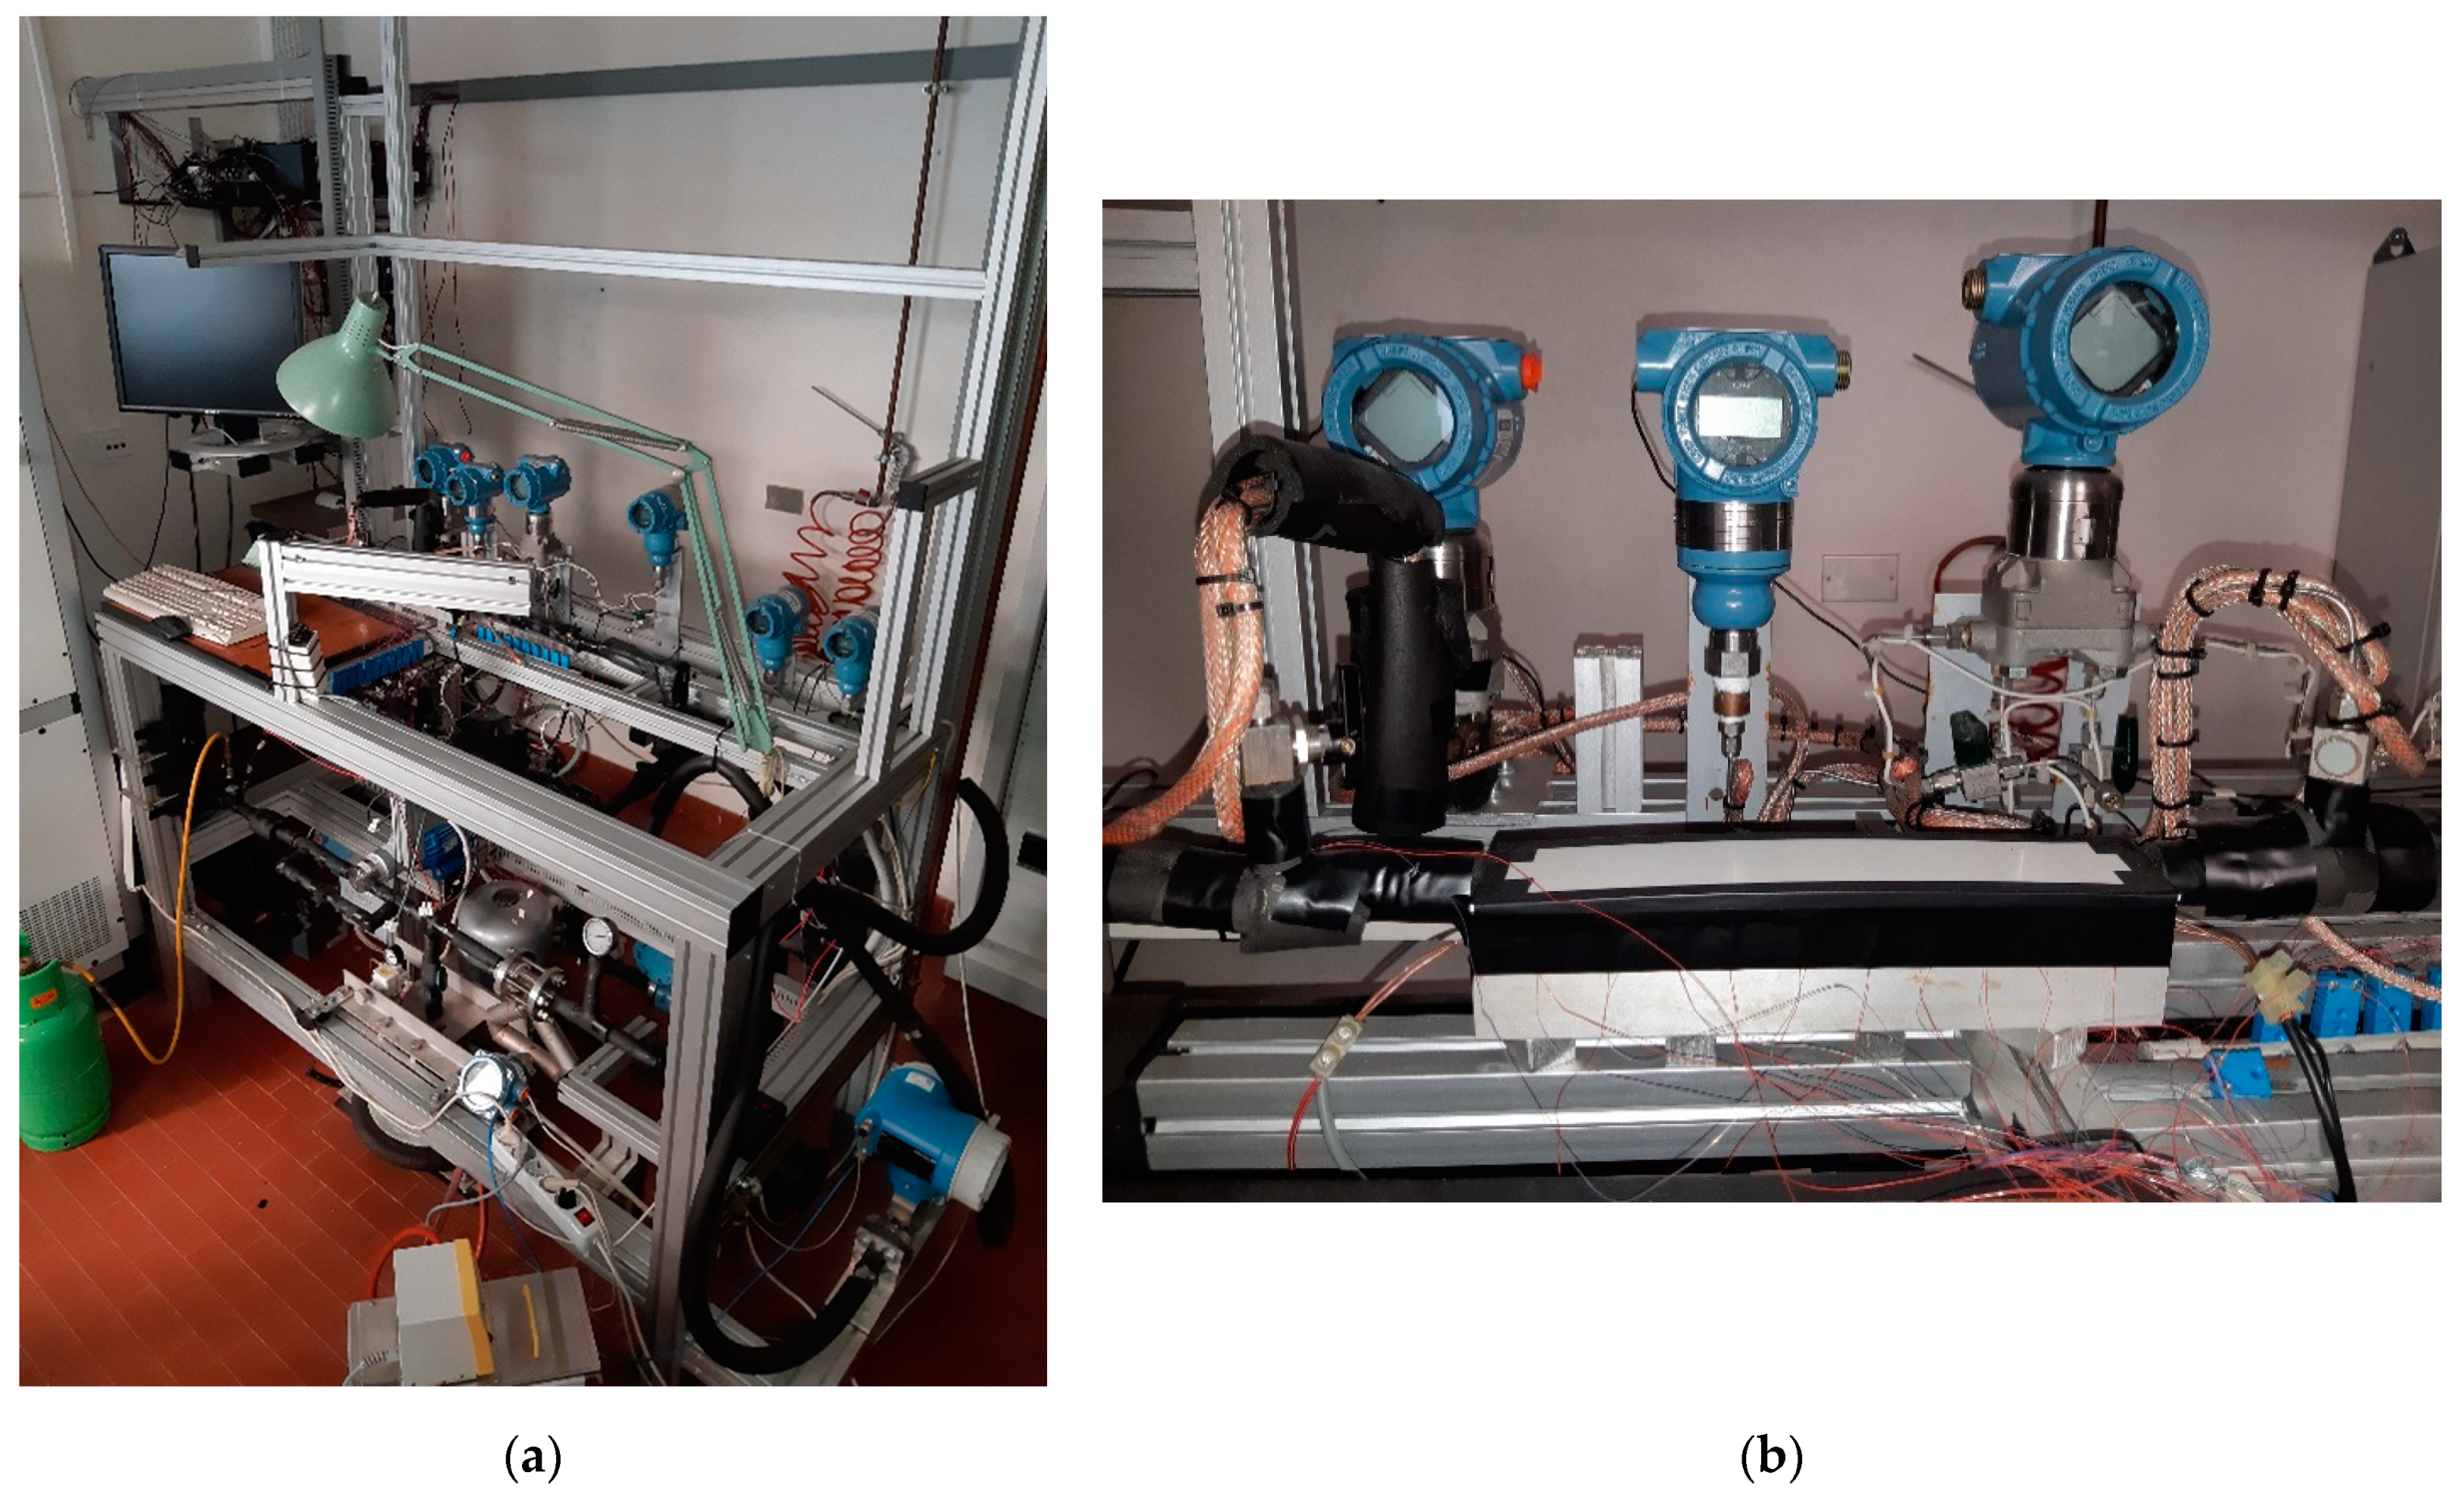
In the test section the refrigerant partially evaporates, and it is then condensed and subcooled in the heat exchanger called post-condenser, before being pumped by the pump. The brazed plate post-condenser is connected to another auxiliary cold water loop where a mixture of water-glycol (0.66/0.34 by mass) is supplied by a stabilized air-cooled chiller. A picture of the test facility, as well as a picture of the test section, are shown in Figure 2a,b, respectively.
Saturation conditions are controlled by means of a damper, which permits to vary the volume of a cylinder connected to the refrigerant loop, and so to vary the pressure of the refrigerant. The damper is connected to a compressed air line. Temperatures and pressures of the refrigerant are measured in several locations throughout the facility: pressures are measured by mean of absolute pressure transducers (accuracy ±1950 Pa), and temperatures by means of T-type calibrated thermocouples (accuracy ±0.05 K) connected to an ice point reference (K170-75C, Kaye Instruments).
The test section is composed of the smooth tube soldered inside a guide milled on the top surface of a copper plate. The copper plate is 240 mm long, 20 mm high, and 10 mm wide. The smooth tube has an inner diameter of 2.5 mm and a wall thickness of 1 mm, and the roughness parameter Sa is equal to 0.63 μm. Twenty holes were drilled 1 mm beneath the guide where the smooth tube is soldered. These holes host as many T-type thermocouples, which are connected to the ice point reference, and they allow the measurement of the wall temperature during the phase change process.
Two guides were milled on the bottom surface of the copper plate, and these guides host two nickel chrome wire resistances, connected in parallel to a Direct Current (DC) power supplier, i.e., the test tube is electrically heated by the Joule effect by means of an electrical heater. The supplied electrical power can be calculated as the product between the electrical differential potential across the electrical heater, made by the two wire resistances, and the current flowing in the circuit. A reference resistance shunt, connected in series with the heater and the DC power supplier, permits to calculate the current flowing in the circuit as the ratio between the measured electrical differential potential across the shunt and the resistance of the shunt itself, which is a known parameter.
Pressure ports were soldered to the test tube upstream and downstream of the copper plate. The upstream pressure port is connected to an absolute pressure transducer (accuracy of ±1950 Pa) to measure the pressure of the refrigerant at the inlet of the test section. Upstream and downstream pressure ports are connected to a differential pressure transducer (accuracy ±25 Pa), which measures the pressure drop. The length between the two pressure ports is 400 mm. Further details of the test section, as well as the thermal and hydraulic validation of the test section, can be found in Diani and Rossetto [19]. All of the uncertainties (type B) of the directly measured parameters are reported in Table 1.

3. Data Analysis

The experimental results will be given in the next paragraph in terms of heat transfer coefficient and frictional pressure gradient at the correspondent mean vapor quality. The heat transfer coefficient, HTC, is calculated as:
H T C = q T S A i · t ¯ w a l l t ¯ s a t
where qTS is the net heat flow rate exchanged in the test section, Ai is the inner surface area of the tube, t ¯ w a l l is the mean wall temperature, i.e., the arithmetic average between the twenty wall temperatures. t ¯ s a t is the mean saturation temperature, i.e., the arithmetic average between inlet and outlet saturation temperatures, calculated from inlet and outlet pressures with REFPROP 10 [6]. Preliminary tests were run in vacuum conditions with the aim of estimating the heat losses through the external ambient. Results showed that heat losses are linearly dependent on the difference between wall temperature and ambient temperature. Therefore, q T S can be calculated as the difference between the supplied electrical power and the heat loss, as:
q T S = P e l q l o s s = P e l 0.1399 · t ¯ w a l l t a m b 0.0832
where Pel is the electrical power supplied by the heater, qloss are the heat losses, and tamb is the ambient temperature.
The frictional pressure drop Δpf is calculated as:
Δ p f = Δ p t o t Δ p m
where Δptot is the total measured pressure drop, and Δpm is the momentum pressure drop. Δpm is calculated as:
Δ p m = G 2 · x 2 ρ V · ε + 1 x 2 ρ L · 1 ε o u t x 2 ρ V · ε + 1 x 2 ρ L · 1 ε i n
where G is the mass velocity, x the vapor quality, ρV and ρL are the saturated vapor and liquid densities, respectively, and “out” and “in” mean that the properties are evaluated at the outlet and at the inlet of the test section, respectively. The void fraction, ε, is calculated as suggested by Rouhani and Axelsson [20]. The refrigerant thermodynamic properties needed for the implementation of the model of Rouhani and Axelsson [20] are calculated with REFPROP 10 [6].
The mean thermodynamic vapor quality xmean is the arithmetic average between inlet and outlet vapor qualities. The inlet vapor xin is calculated as:
x i n = h T S , i n h L , i n h V , i n h L , i n
where hTS,in is the specific enthalpy of the refrigerant at the inlet at the test section, and hL,in and hV,in are specific enthalpies of saturated liquid and vapor, respectively, calculated with REFPROP 10 [6] from the knowledge of the inlet pressure. hTS,in derives from an energy balance at the pre-condenser:
h T S , i n = h v s m ˙ w , P C · c p , w · Δ T w , P C m ˙ r e f
where hvs is the specific enthalpy of the refrigerant at the inlet of the pre-condenser in superheated conditions calculated from the knowledge of temperature and pressure with REFPROP 10 [6], m ˙ w , P C is the water mass flow rate at the pre-condenser, cp,w is the water specific heat, ΔTw,PC is the water temperature difference across the pre-condenser, and m ˙ r e f is the refrigerant mass flow rate.
In a similar way, the outlet vapor quality xout is calculated as:
x o u t = h T S , o u t h L , o u t h V , o u t h L , o u t
where hTS,out is the specific enthalpy of the refrigerant at the outlet at the test section, and hL,out and hV,out are the specific enthalpies of saturated liquid and vapor, respectively, calculated with REFPROP 10 [6] from the knowledge of the outlet pressure. hTS,out derives from an energy balance at the test section:
h T S , o u t = h T S , i n + q T S m ˙ r e f
The calculated mean, minimum, and maximum uncertainties on the heat transfer coefficient are 4.6%, 1.8%, and 12.5%, respectively, whereas the mean uncertainty on the mean vapor quality is 0.029.

4. Experimental Results

4.1. Preliminary Considerations

In this section, some preliminary considerations, useful for the analysis of the experimental data reported in the next paragraph, are summed up. The flow boiling phenomenon is controlled by nucleate boiling and convective boiling. At low vapor quality, nucleate boiling affects the two-phase heat transfer mechanism at the wall and, depending on the mass velocity and vapor quality, the flow pattern is typically bubbly, slug, or low vapor quality annular flow. In this region, the two mechanisms of flow boiling exist: nucleate boiling and two-phase forced convection, and up today it is not possible to separate these two contributes. As vapor quality increases, a transition from boiling to evaporation occurs, with consequent transition to an annular flow regime, with liquid flowing at the wall and vapor in the core. The vapor shear stress may cause entrainment of liquid droplets in the vapor phase. The liquid film thickness at the wall gets thinner and thinner as vapor quality increases, with consequent augmentation of the heat transfer coefficient, until the liquid at the wall evaporates. Depending on the working conditions of vapor quality and heat flux, there may be a local dryout phenomenon, i.e., the liquid at the wall partly evaporates, and these hot spots at the wall are immediately rewetted by the liquid phase. As dryout goes on, a fully dryout condition occurs, i.e., the liquid film at the wall completely evaporates with consequent increase of the wall temperature. For high heat fluxes, local dryout may occur at lower vapor qualities.
The experimental results of heat transfer coefficient and frictional pressure drop will be presented in the next paragraph. Every single experimental datum, which will be later shown, comes from the average of 100 readings taken in steady state conditions at a frequency of 1 Hz. The tested mass velocities, G, i.e., the ratio between mass flow rate and cross section of the tested tube, are: 200, 300, 400, 500, and 600 kg m−2 s−1. The tested heat flux, HF, i.e., the ratio between the net heat flow rate and the inner surface of the tube, are: 12, 30, and 60 kW m−2. Standard tests are carried out with a constant saturation temperature at the inlet of the test section of 30 °C, which corresponds to a pressure of 5.783 bar. Some additional tests were carried out, for some combinations of mass velocity and heat flux, at 25 °C and 35 °C of saturation temperature, in order to catch its effect both on heat transfer coefficient and on frictional pressure drop.

4.2. Experimental Heat Transfer Coefficients and Frictional Pressure Drops

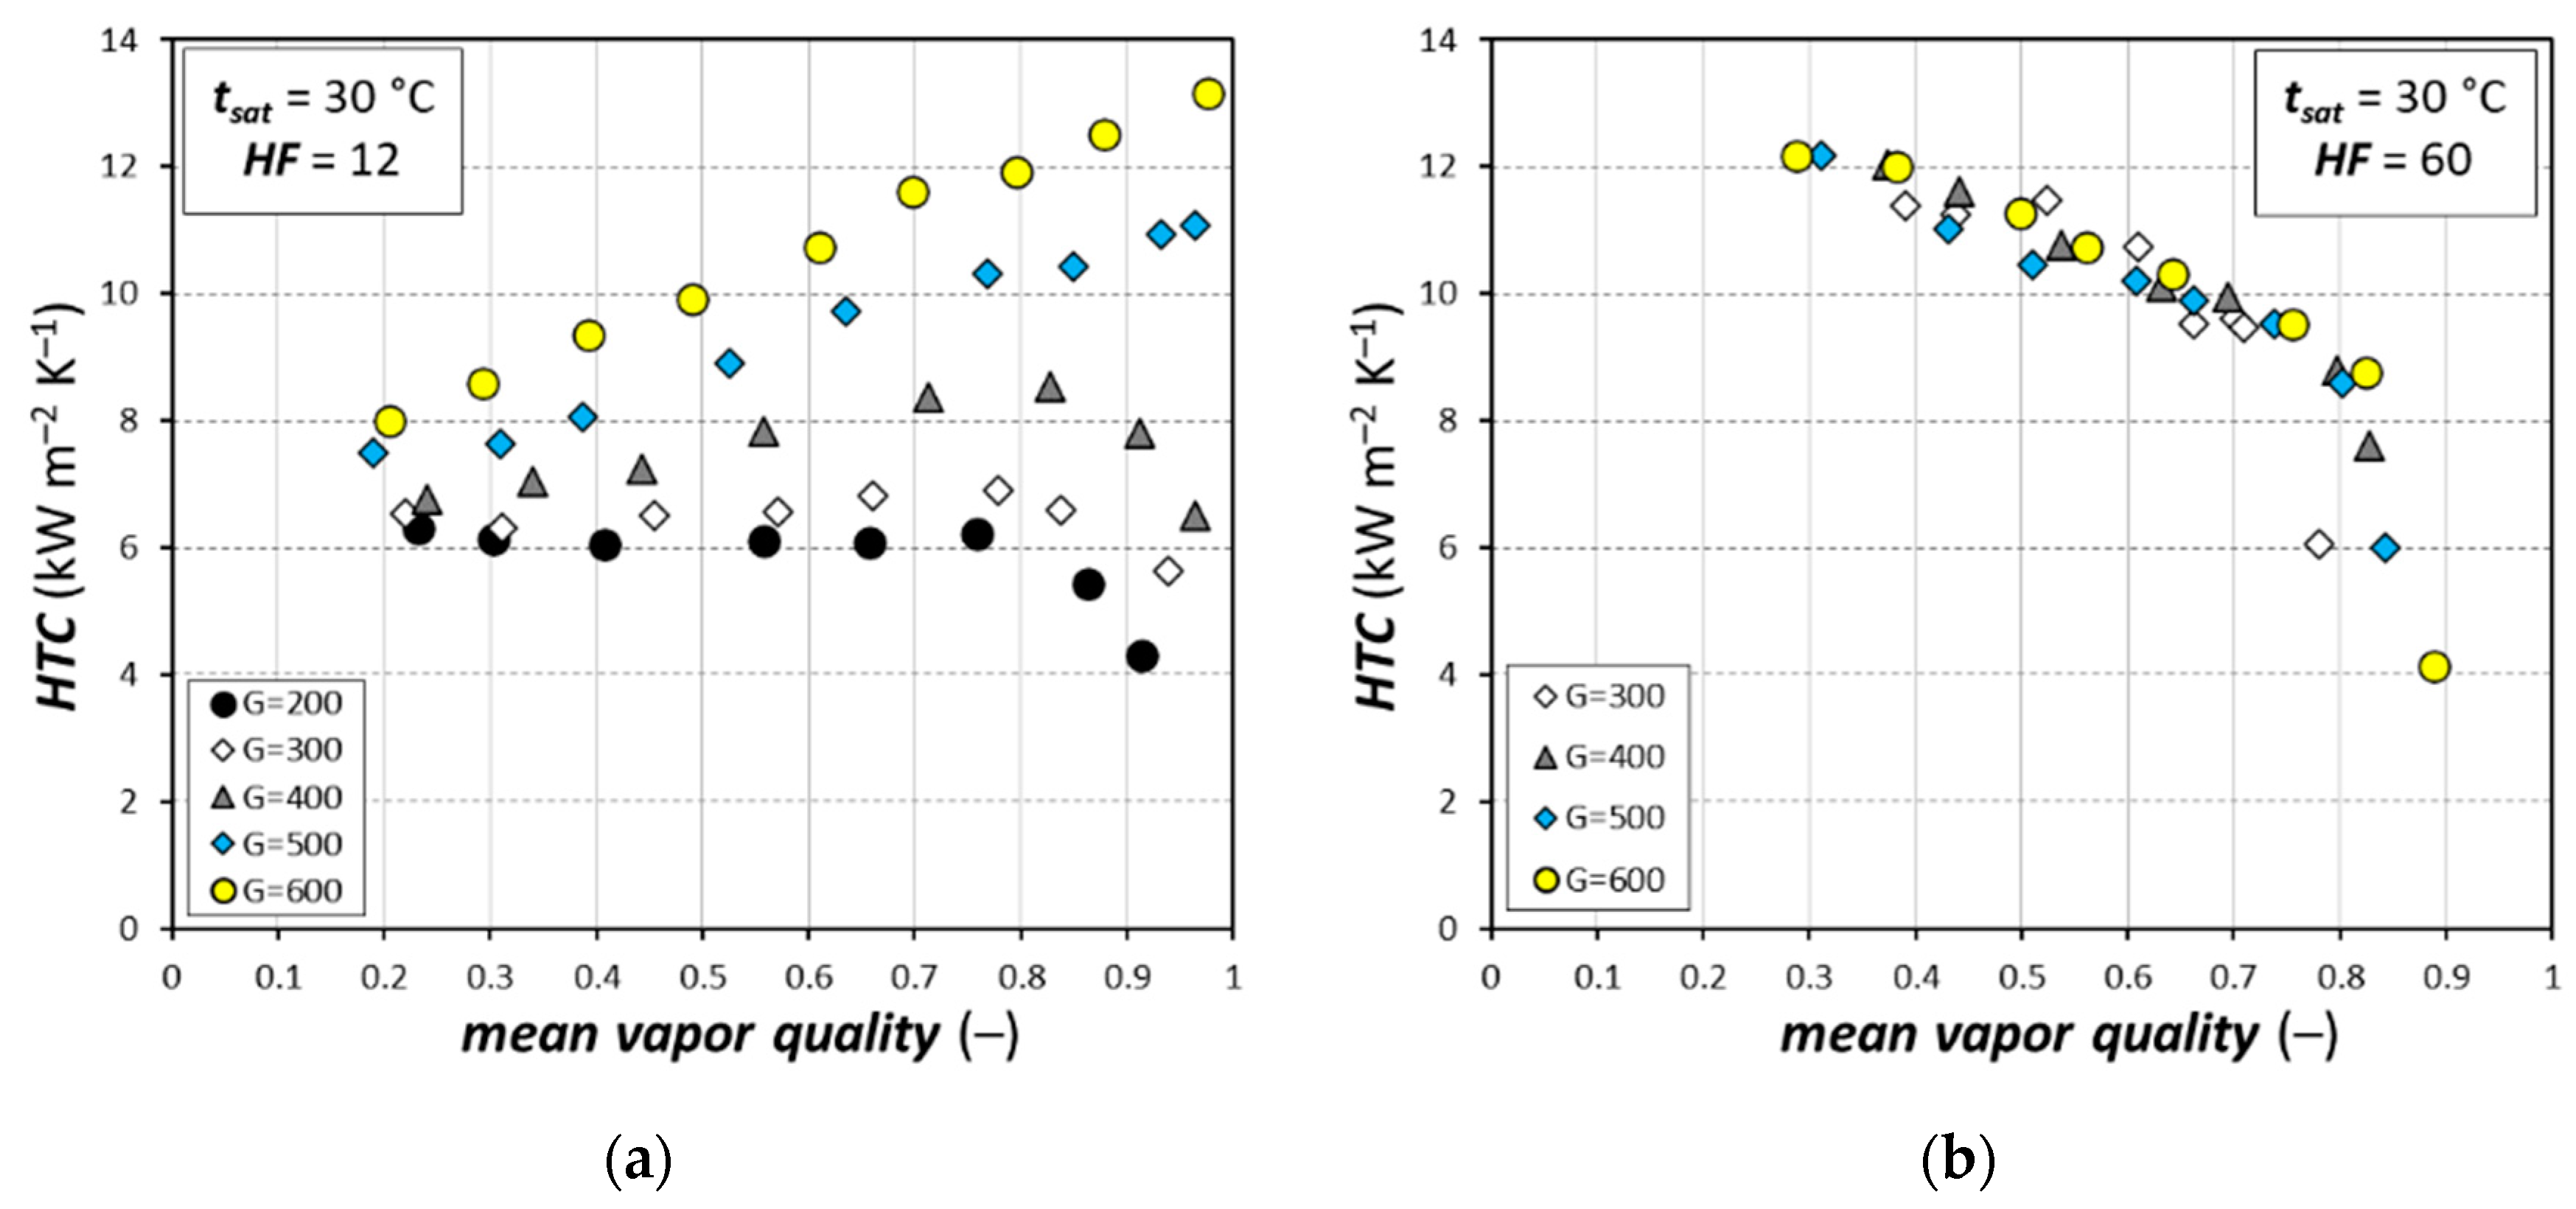
Figure 3 shows the collected R1234ze(E) flow boiling heat transfer coefficients plotted against the mean vapor quality with a constant saturation temperature at the inlet of the test section of 30 °C for two different imposed heat fluxes: 12 kW m−2 (Figure 3a) and 60 kW m−2 (Figure 3b). These figures permit to highlight the effect of both vapor quality and mass velocity. At the lowest heat flux, there is a strong effect of mass velocity. Mass velocity G = 200 kg m−2 s−1 shows almost no effect of vapor quality, with a constant heat transfer coefficient at a value of around 6000 W m−2 K−1, until dryout conditions are reached at a mean vapor quality of around 0.8. At a mass velocity G = 300 kg m−2 s−1, the heat transfer coefficients overlap with those at G = 200 kg m−2 s−1 at low vapor quality, but the heat transfer coefficient slightly increases as vapor quality increases, meaning that convective boiling starts to play its role in the flow boiling mechanism. As mass velocity further increases, there is a clear effect of mass velocity and of vapor quality on the heat transfer coefficient: the higher the vapor quality and mass velocity, the higher the heat transfer coefficient, meaning that convective boiling is affecting the phase change mechanism. Furthermore, the highest tested mass velocity shows the highest dependence on vapor quality, i.e., the slope of the heat transfer coefficients respect to vapor quality is the highest among the tested mass velocities.
The mean thermodynamic vapor quality where the heat transfer coefficient starts to decrease should not be intended as the local vapor quality at the onset of dryout, because data reported in the figure represent average conditions between inlet and outlet of the test section, not local conditions. The thermodynamic vapor quality difference between inlet and outlet of the test section varies from about 0.05 at G = 600 kg m−2 s−1 up to about 0.14 at G = 200 kg m−2 s−1 at HF = 12 kW m−2. It is also interesting to highlight that the dryout at G = 200 kg m−2 s−1 at HF = 12 kW m−2 leads to a temperature increase, along the test section, of about 1.5 K, with an almost negligible saturation temperature drop (lower than 0.2 K) due to pressure drop. Therefore, the heat transfer coefficient at G = 200 kg m−2 s−1 decreases at high mean thermodynamic vapor qualities. On the contrary, at high mass velocities, the saturation temperature drop is not negligible. Considering the mass velocity G = 600 kg m−2 s−1, at high vapor quality, the saturation temperature drop due to pressure drop is about 1.5 K, which tends to balance the temperature increase due to dryout. Therefore, dryout, intended as a drop of the heat transfer coefficient‘s trend, is not shown at high mass velocities at HF = 12 kW m−2.
When heat flux is increased to HF = 60 kW m−2 (Figure 3b), the situation completely changes. First of all, the heat transfer coefficients in the low vapor quality region are higher than those at HF = 12 kW m−2, meaning that a higher contribution of nucleate boiling affects the flow boiling mechanism, due to the higher heat flux. Another evidence of the higher nucleate boiling contribution, with almost negligible effect of convective boiling, is the absence of the effect of mass velocity, indeed the heat transfer coefficients are not affected by mass velocity, and the values almost overlap at different mass velocities. The heat transfer coefficients tend to decrease as vapor quality increases, until fully dryout conditions are reached. This trend can be attributed to the high applied heat flux, which tends to intermittently dry local sections of the tube, and these dried sections are almost instantly rewetted by the liquid phase. As vapor quality increases, these dried sections get larger and larger, with consequent deterioration of the thermal performance of the tube, until dryout conditions are reached, i.e., the liquid phase is no longer able to rewet the surface of the tube.
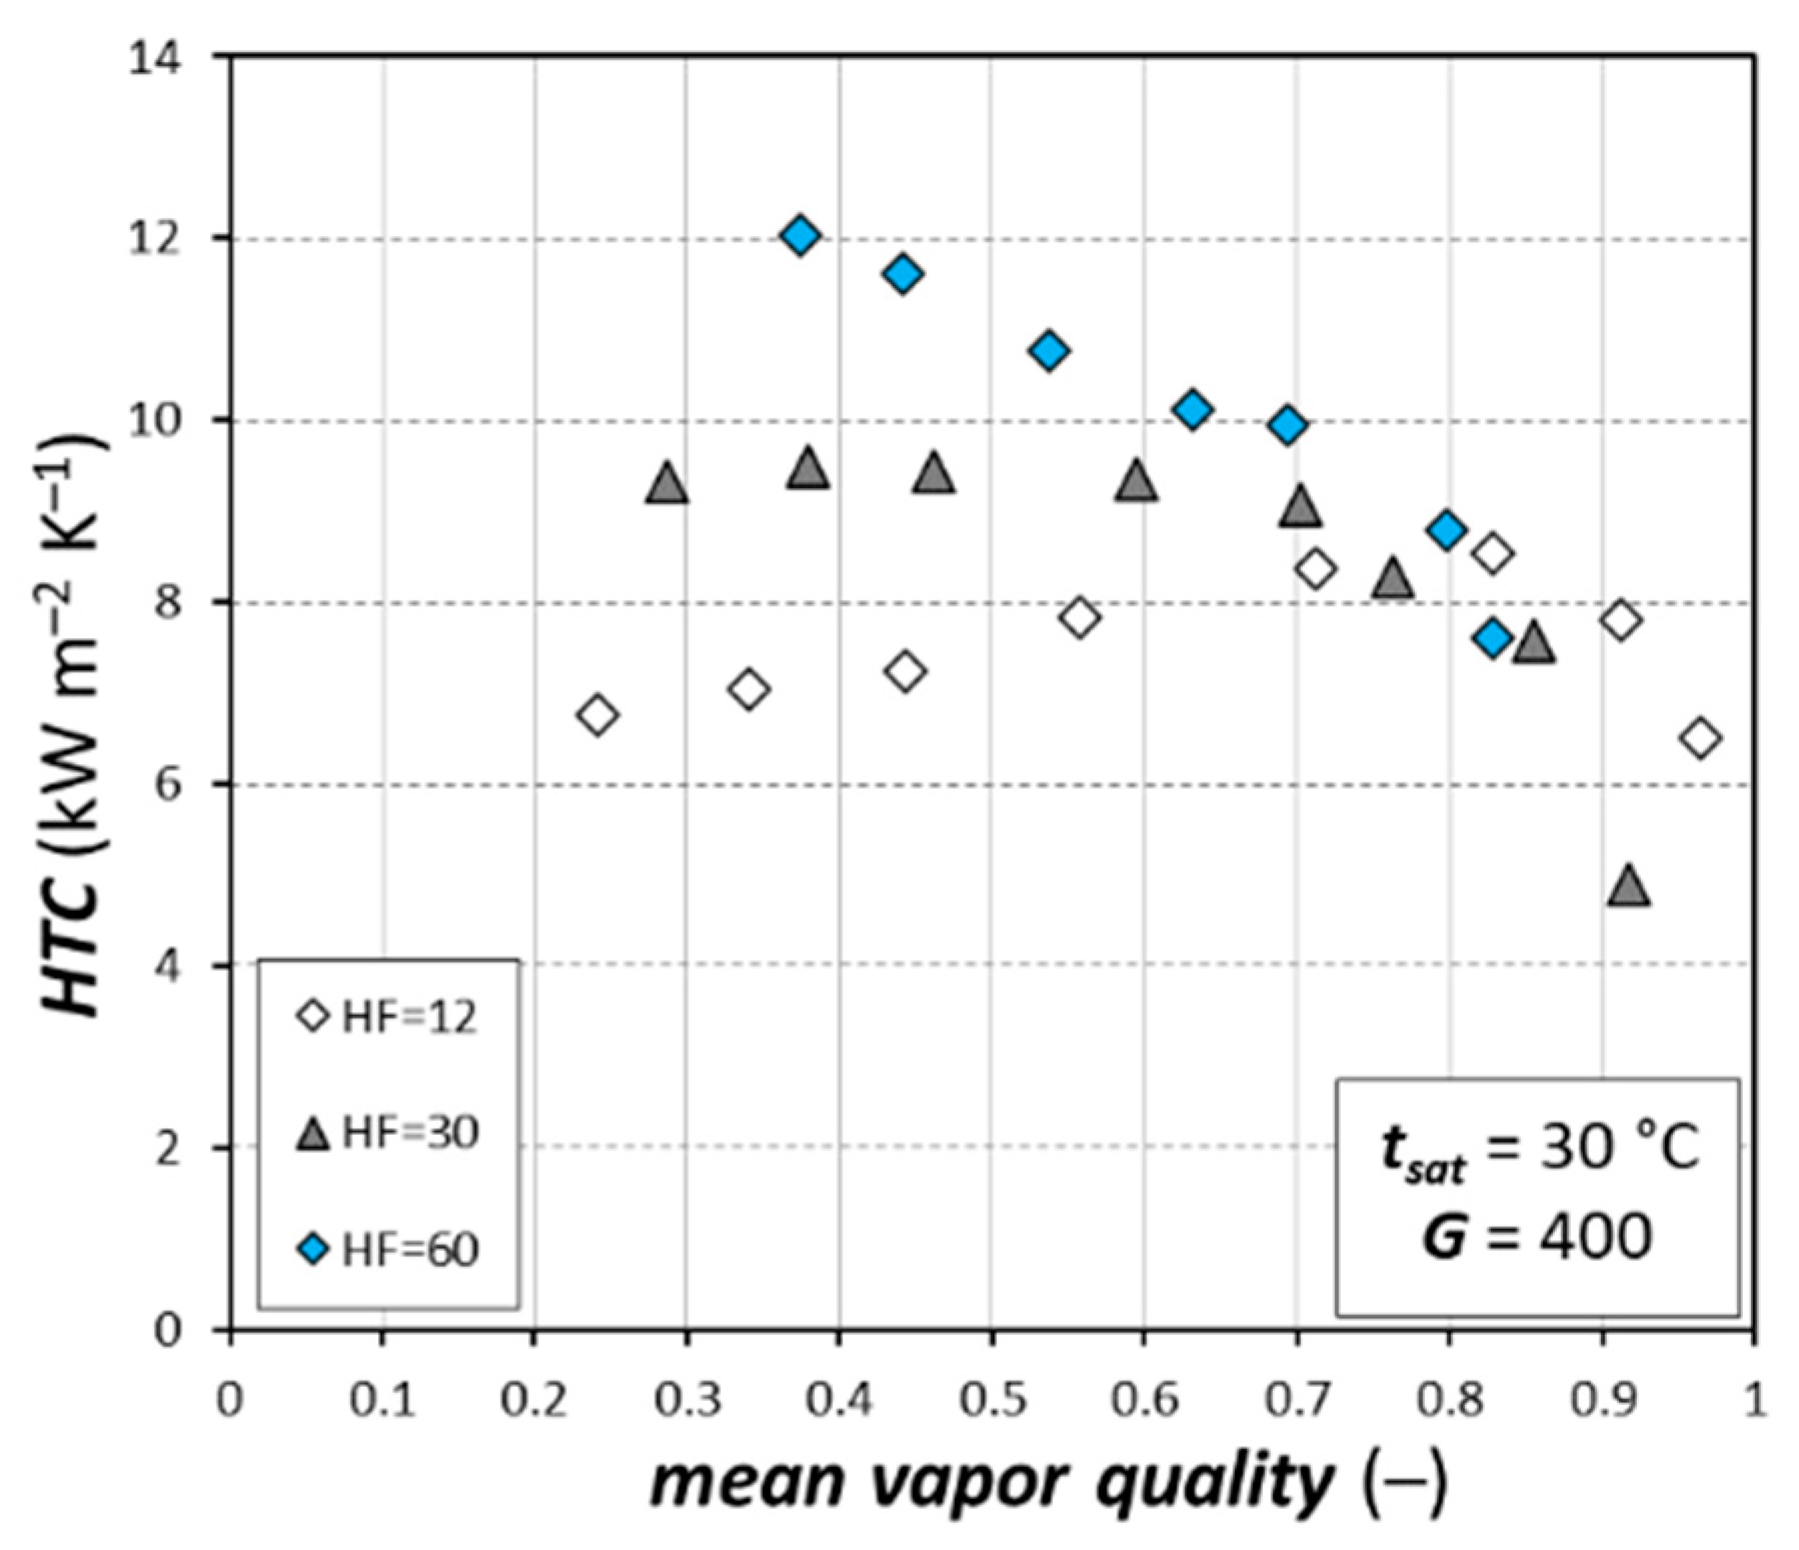
The effect of heat flux can be highlighted from Figure 4, which shows the heat transfer coefficients plotted versus the mean vapor quality for a saturation temperature at the inlet of the test section of 30 °C with a fixed mass velocity of 400 kg m−2 s−1. In the low vapor quality region, there is a clear effect of heat flux on the heat transfer coefficient: the higher the heat flux, the higher the heat transfer coefficient, due to the stronger contribution of nucleate boiling as heat flux increases. As vapor quality increases, the effect of vapor quality depends on the applied heat flux. At the lowest heat flux, as vapor quality increases, the heat transfer coefficient increases, meaning that the effect of convective boiling on the phase change process is gaining importance. When heat flux is increased at a value of 30 kW m−2, the heat transfer coefficient does not increase anymore as vapor quality increases, so it seems that the higher contribution of nucleate boiling at HF = 30 kW m−2, compared to the case at HF = 12 kW m−2, mitigates the effect of convective boiling. At the highest tested heat flux of 60 kW m−2, the heat transfer coefficient always decreases as vapor quality increases, due to the drying–rewetting process that appears on the wall surface of the tube until fully dryout conditions are reached. Similar trends were observed for the other mass velocities.
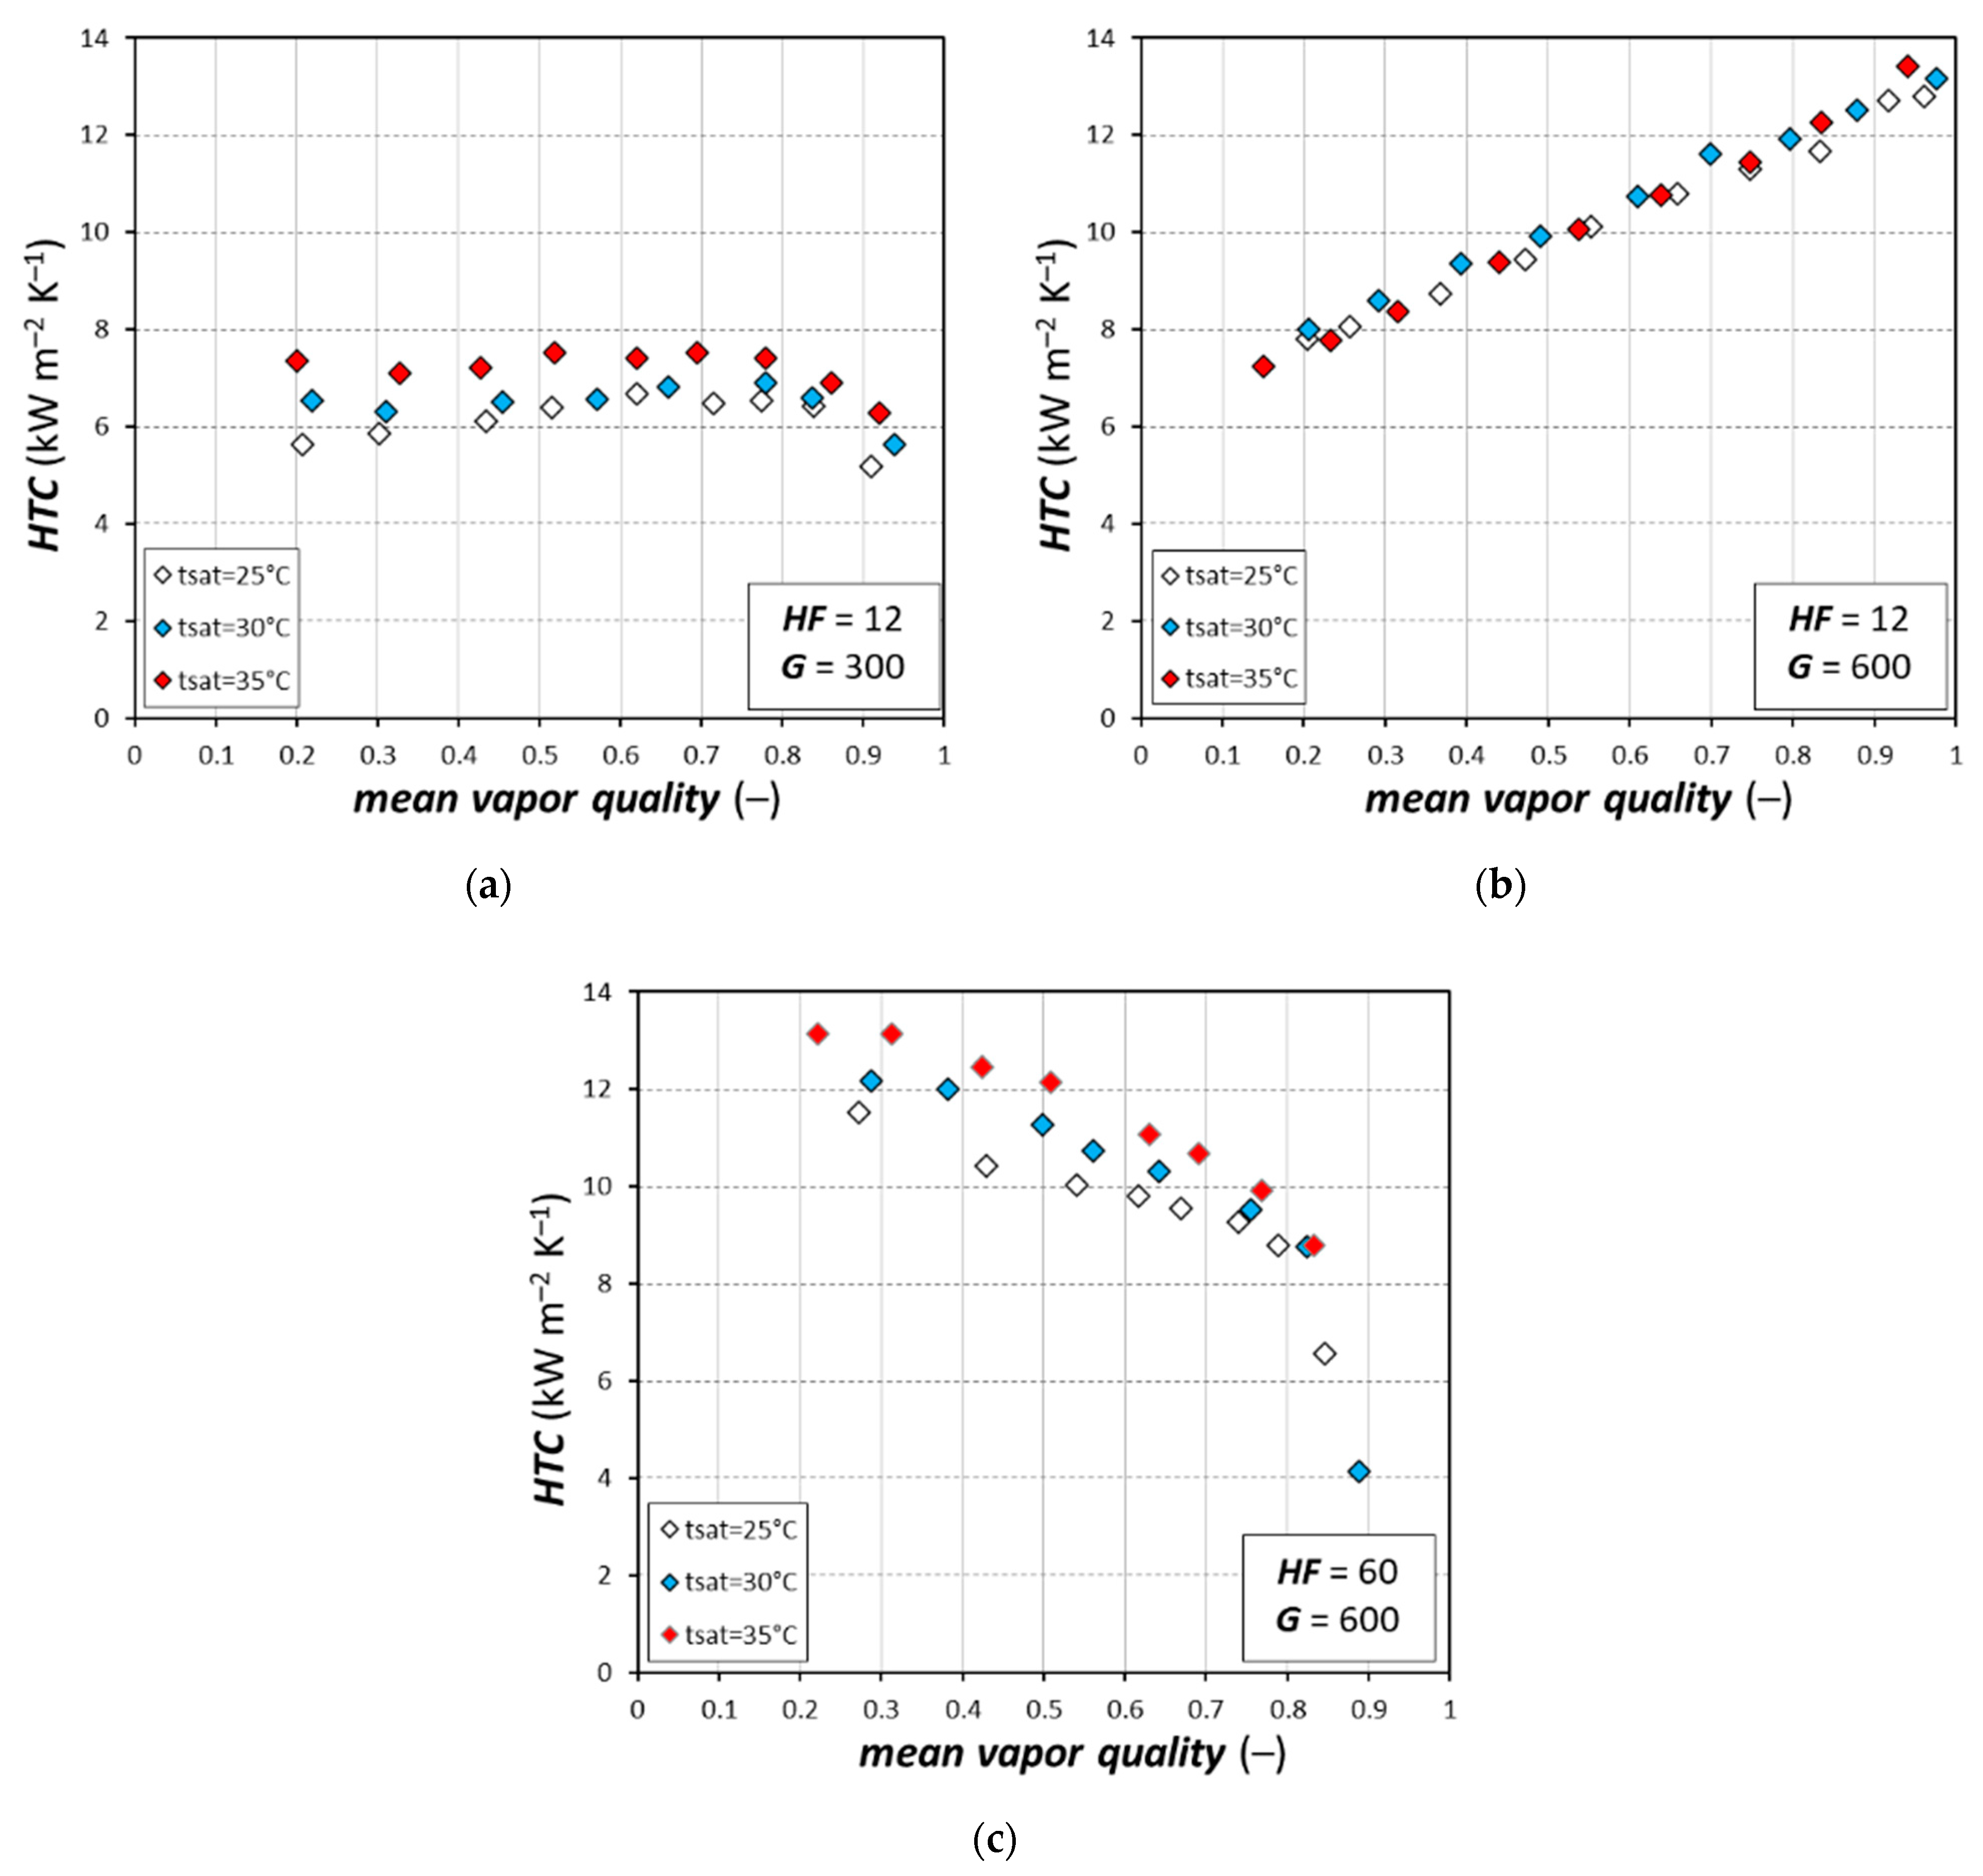
Further experimental tests were run at different saturation temperatures, in order to highlight the effect of this working parameter. Saturation temperatures of 25 °C and 35 °C were also investigated, and they correspond to pressures of 4.985 bar and 6.674 bar, respectively. Figure 4 reports the heat transfer coefficient plotted against the mean vapor quality at different working conditions. A higher saturation temperature implies a higher reduced pressure, with a consequent higher effect of nucleate boiling. At the same time, a higher saturation temperature implies a higher vapor density, i.e., a lower vapor velocity at constant mass velocity, with a consequent lower effect of convective boiling. These considerations will help to understand the trends of Figure 5. Data at a mass velocity of 300 kg m−2 s−1 with an imposed heat flux of 12 kW m−2 for three different saturation temperatures are reported in Figure 5a. In this case, as saturation temperature increases, the higher augmentation of nucleate boiling contribution is higher than the reduction of convective boiling due to a low mass velocity, and, as a result, the highest heat transfer coefficients are shown at tsat = 35 °C. At a higher mass velocity of 600 kg m−2 s−1 at the same imposed heat flux of 12 kW m−2 (Figure 5b), the trends are different. Due to the higher mass velocity, the effect of convective boiling is higher in the phase change process. In this case, the heat transfer coefficients seem to overlap between each other, and so the augmentation of nucleate boiling at the highest saturation temperature is somehow mitigated by the lower contribution of convective boiling at the highest saturation temperature. The situation changes at the highest heat flux, where the phase change mechanism is mainly dominated by nucleate boiling. Figure 5c reports the heat transfer coefficients at different saturation temperatures for a mass velocity of 600 kg m−2 s−1 with an imposed heat flux of 60 kW m−2. The strong contribution of nucleate boiling is highlighted considering the fact that the heat transfer coefficient always increases as saturation temperature increases, even at this high mass velocity.
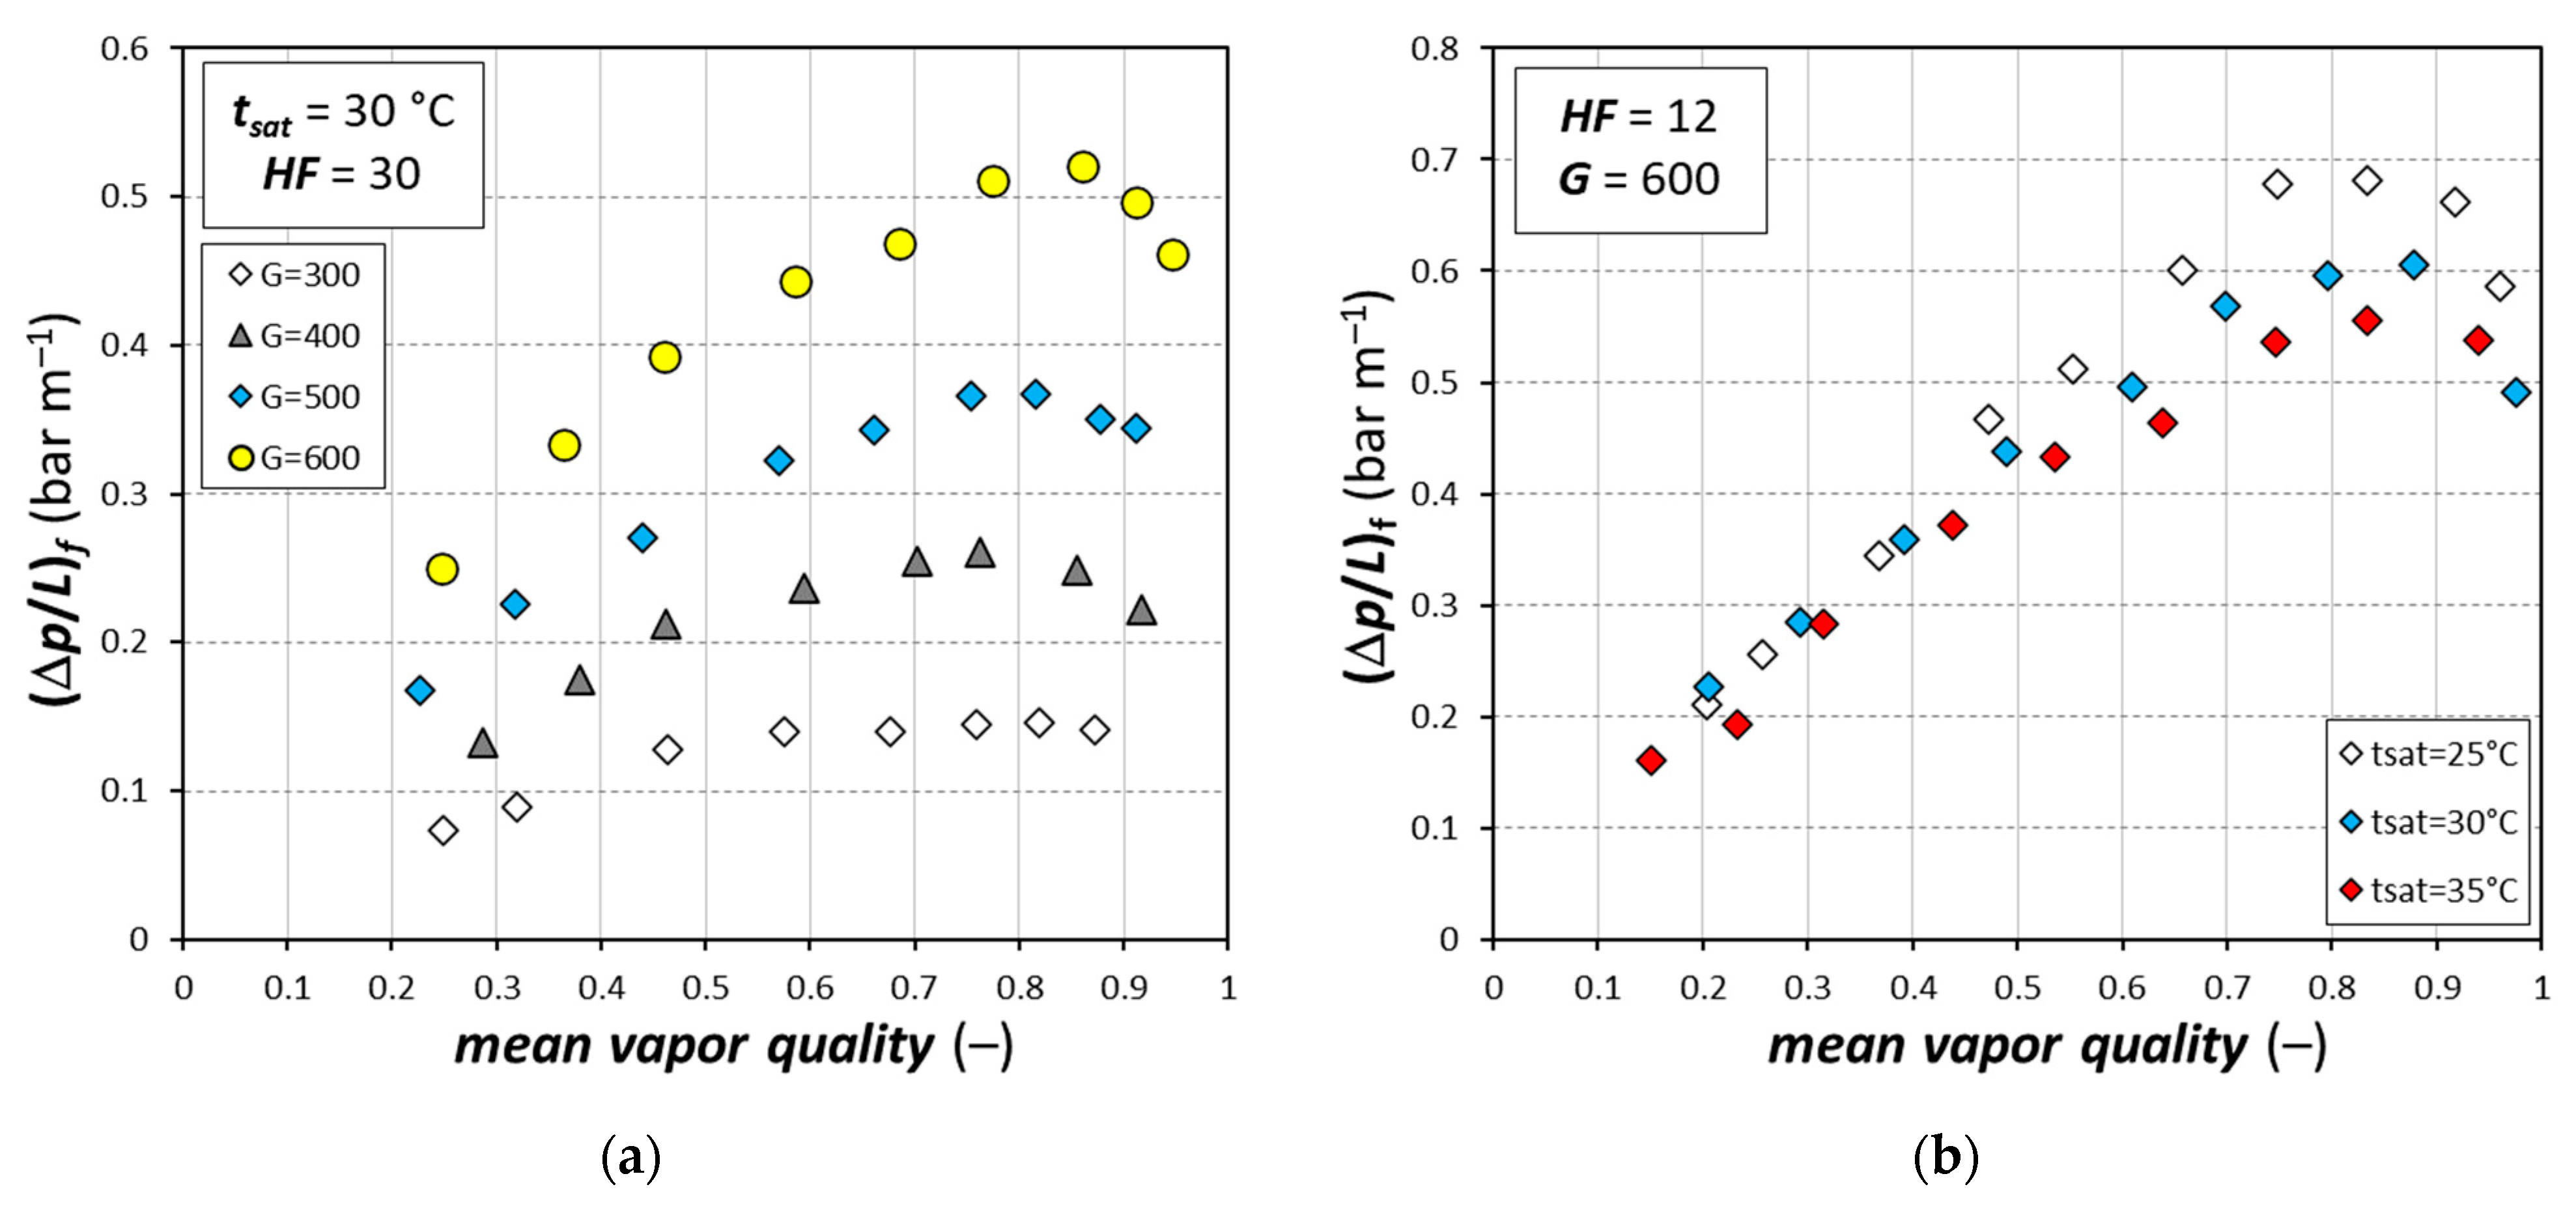
Besides heat transfer coefficients, pressure drops are another important parameter to be considered to develop heat exchangers. Frictional pressure gradients are plotted against the mean vapor quality in Figure 6 at different working conditions. Figure 6a shows the effect of both vapor quality and mass velocity for a constant saturation temperature at the inlet of the test section of 30 °C with an imposed heat flux of 30 kW m−2. Keeping constant the mean vapor quality, frictional pressure gradient increases as mass velocity increases. Keeping constant the mass velocity, the frictional pressure gradient shows the classical two-phase flow behavior: it increases as vapor quality increases up to xmean = 0.8–0.9, reaching a peak, and then it slightly decreases as vapor quality further increases. Similar trends can be observed for the other heat fluxes. The effect of saturation temperature on the hydraulic performance is shown in Figure 6b, which reports data for a mass velocity of 600 kg m−2 s−1 with an imposed heat flux of 12 kW m−2 for three different saturation temperatures. As previously explained, a higher saturation temperature implies a higher vapor density, with a consequent lower vapor velocity at constant mass velocity. This consideration can be observed in Figure 6b: for mean vapor qualities higher than 0.4, the frictional pressure gradient decreases as saturation temperature increases, due to the lower vapor velocity at constant mass velocity.

5. Comparisons

5.1. Comparison against an Equivalent Microfin Tube

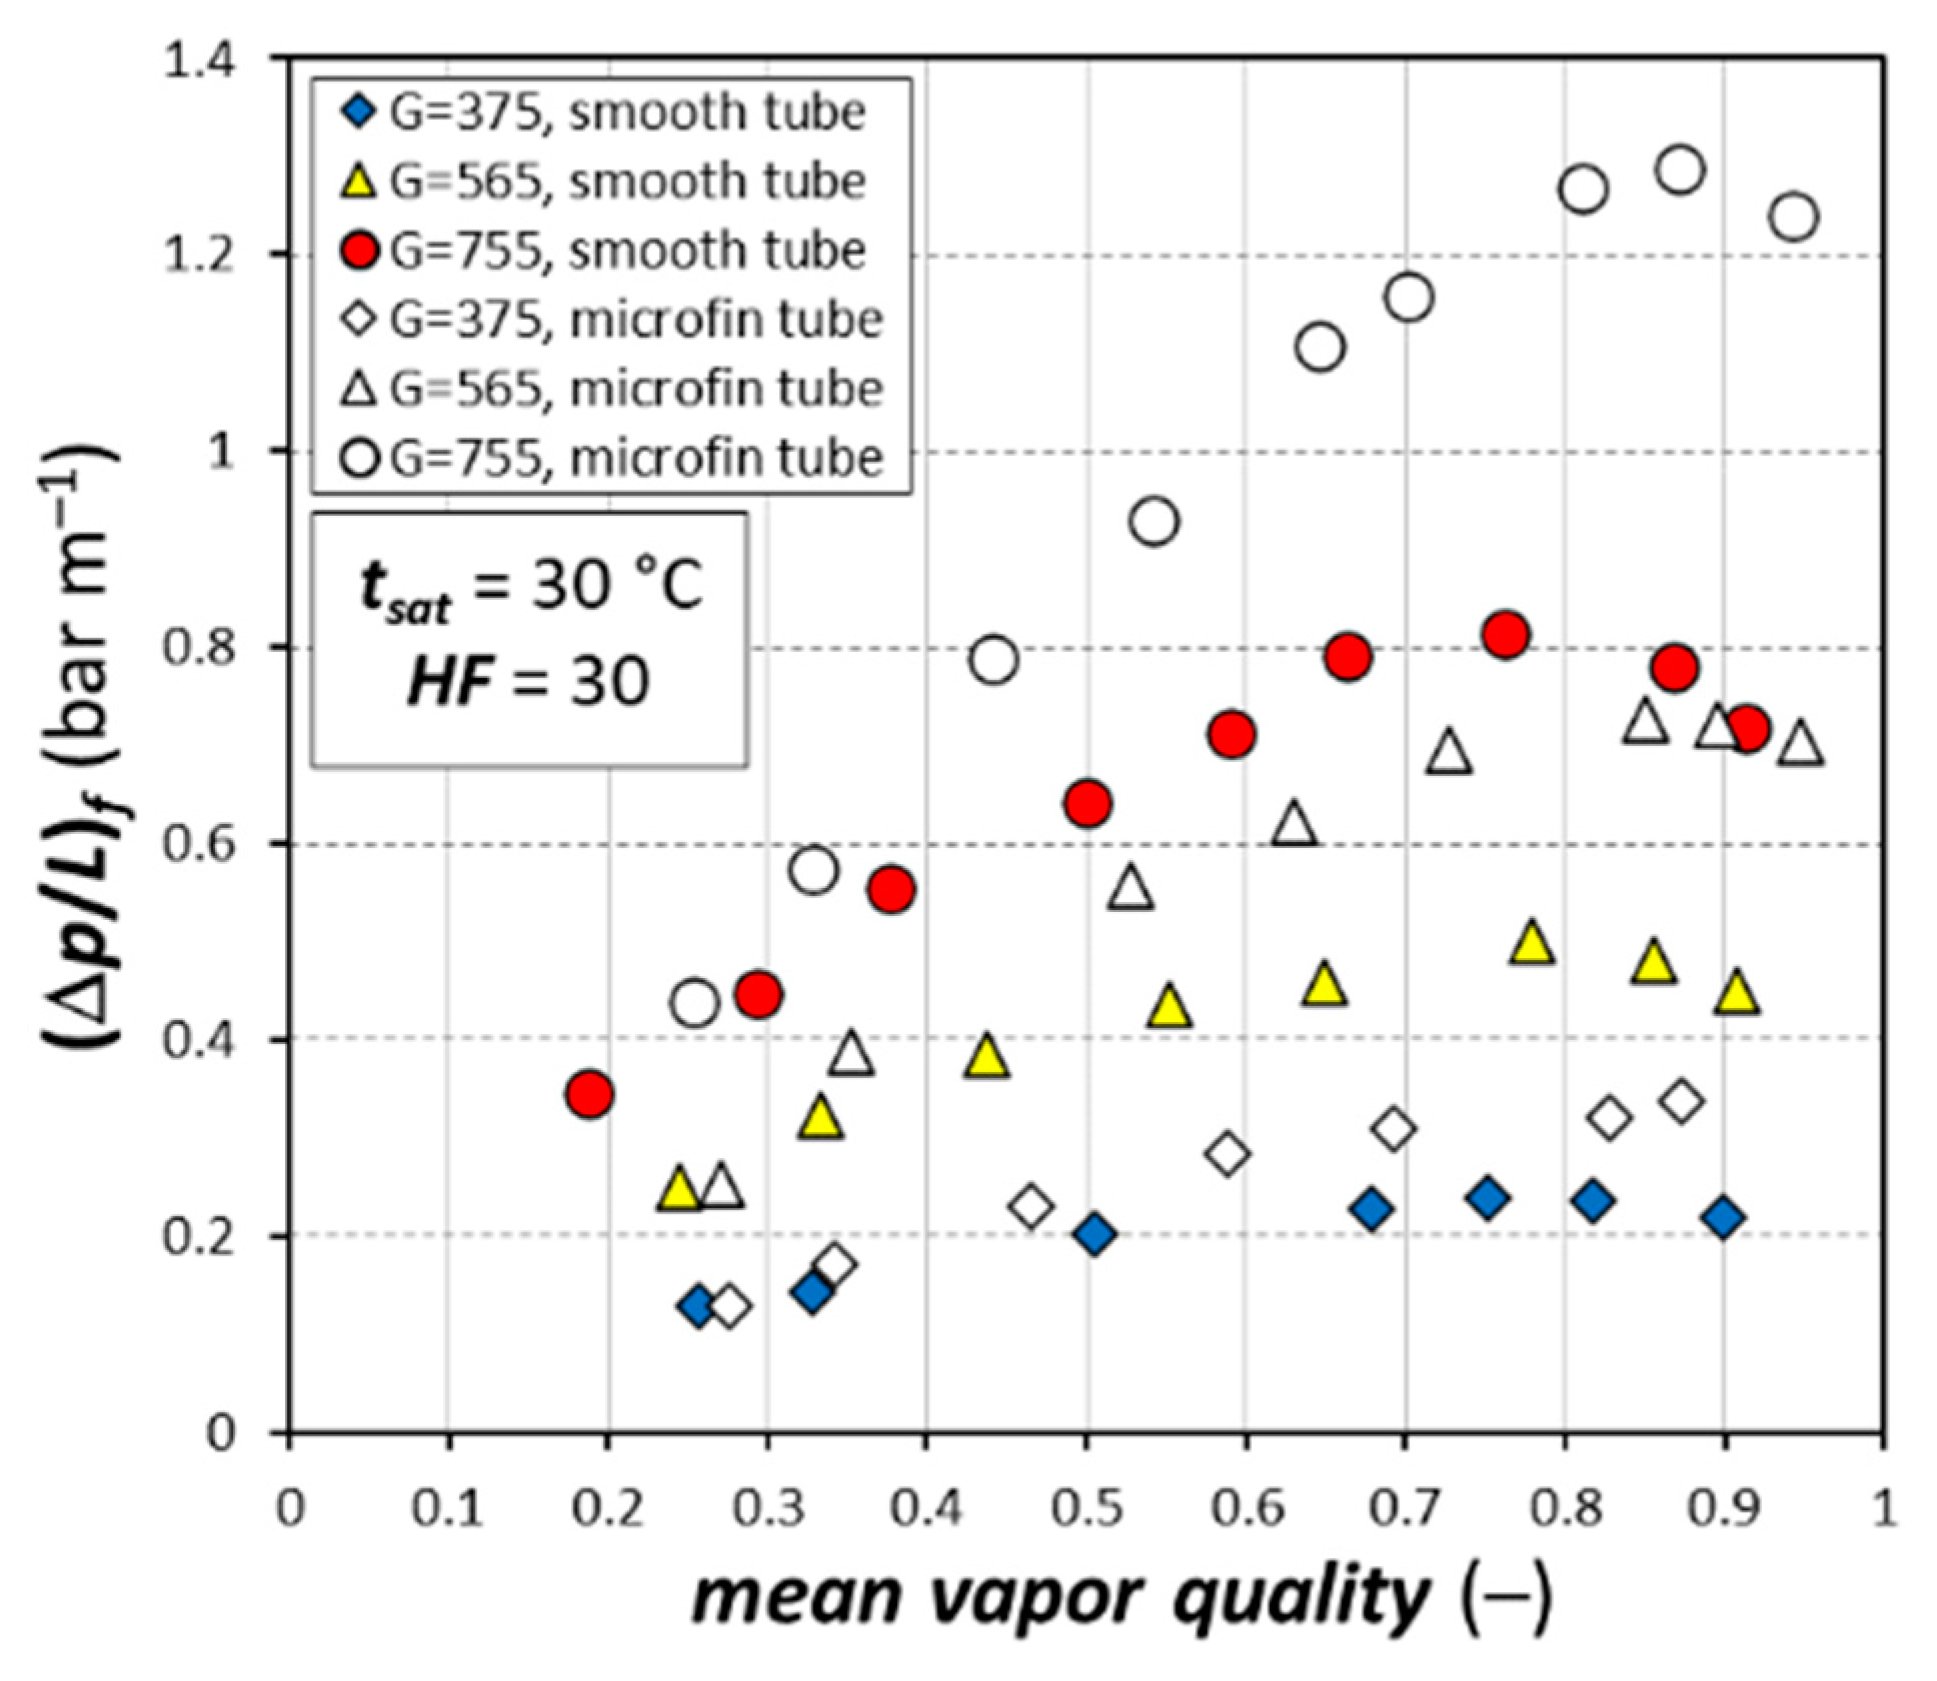
The thermal and hydraulic performances, i.e., heat transfer coefficient and frictional pressure gradient, of the 2.5 mm ID smooth tube are compared against those of a microfin tube under the same working conditions. The microfin tube has an inner diameter at the fin tip of 2.4 mm, the fin height is 0.12 mm (i.e., the fin root diameter is 2.64 mm), it has 40 fins with an apex angle of 43°, and the helix angle is 7°. The microfin tube is heated by Joule effect from the bottom by means of a nickel chrome wire resistance connected to a DC power supplier, similarly to the 2.5 mm ID smooth tube. Experimental data for the microfin tube, which are needed for the comparison, are borrowed by Diani et al. [21]. In order to match the experimental working conditions of the microfin tube, additional tests were run during R1234ze(E) flow boiling inside the smooth tube at mass velocities of 375, 565, and 755 kg m−2 s−1, allowing a direct comparison between the performances of the two tubes. Figure 7 reports the comparison between the thermal performances of the two tubes. The effect of mass velocity on the different characteristics of the two tubes is reported in Figure 7a, which shows the heat transfer coefficient plotted versus the mean vapor quality for a saturation temperature at the inlet of the test section of 30 °C with an imposed heat flux of 30 kW m−2. At first sight, the heat transfer coefficients of the microfin tube get higher and higher compared to the smooth tube as mean vapor quality increases, meaning that the microfin tube exhibits a higher contribution of convective boiling in the phase change process. The smooth tube shows almost no effect of vapor quality for mass velocity 375 and 565 kg m−2 s−1, whereas a weak effect can be seen with mass velocity of 755 kg m−2 s−1, i.e., convective boiling weakly affects the flow boiling mechanism only at high mass velocity in the case of the smooth tube at this heat flux. On the contrary, in case of the microfin tube, heat transfer coefficient always increases as vapor quality increases. The effect of mass velocity on the heat transfer coefficient is different among the two tubes. In the case of the smooth tube, the highest heat transfer coefficients are shown at the highest mass velocity of 755 kg m−2 s−1, whereas, in the case of the microfin tube, the highest heat transfer coefficients are shown at the lowest mass velocity of 375 kg m−2 s−1, probably due to a drying effect at the fin tips, which is more emphasized as mass velocity, i.e., shear stress, increases.
The effect of the heat flux is reported in Figure 7b, which shows the heat transfer coefficients plotted against the mean vapor quality for a saturation temperature at the inlet of the test section of 30 °C at a fixed mass velocity of 565 kg m−2 s−1. The heat transfer coefficients of the microfin tube always increase with vapor quality, even at the highest tested heat flux, meaning that convective boiling, besides nucleate boiling, plays its role in the flow boiling mechanism at 60 kW m−2. This consideration is no longer valid for the smooth tube, for which the heat transfer coefficient increases with vapor quality at HF = 12 kW m−2, it is almost not affected by vapor quality at HF = 30 kW m−2, and it decreases with vapor quality at HF = 60 kW m−2 due to the drying-rewetting process, i.e., the effect of convective boiling tends to be weakened as heat flux increases. It is worth to highlight that, in case of both the microfin tube and the smooth tube, the highest heat transfer coefficients at high mean vapor quality are shown at the lowest heat flux, meaning that there may be local hot spots on the inner surface of the tubes, which get larger and larger as heat flux increases, deteriorating the phase change process.
Another important aspect is related to dryout: microfin tube tends to delay the mean vapor quality at the onset of dryout at very high vapor qualities, which are not visible from the trend of the heat transfer coefficients.
The comparison between the hydraulic performances of the two tubes is shown in Figure 8, which reports the frictional pressure gradients for the smooth tube and microfin tube with a saturation temperature at the inlet of the test section of 30 °C with an imposed heat flux of 30 kW m−2. The trend is the same for the two tubes, i.e., frictional pressure gradient increases as mass velocity and vapor quality increase, showing a peak value at high mean vapor qualities. Smooth and microfin tubes show similar values of frictional pressure gradient only at vapor qualities lower than 0.3, whereas for higher vapor qualities the microfin tubes shows higher frictional pressure gradients at all of the investigated working conditions. Similar conclusions can be drawn for the other heat fluxes.

5.2. Comparison against Empirical Correlations

In this paragraph, the experimental heat transfer coefficients and frictional pressure drops for the smooth tube are compared against values estimated by empirical correlations available in the open literature.
Figure 9 shows a comparison between calculated and experimental heat transfer coefficients. The following empirical models were considered: Gungor and Winterton [22], Kim and Mudawar [23], and Yu et al. [24]. Only data prior to the onset of dryout were chosen for the comparison, since the correlations predict values of heat transfer coefficient in the pre-dryout region. The correlation of Gungor and Winterton [22] was developed from experimental data of a large data bank comprising data including the following fluids: water, R11, R12, R113, R114, R22 and ethylene glycol. The correlation of Kim and Mudawar [23] was validated with experimental data of refrigerants, water, CO2, and FC72 flow boiling for mass velocities between 19 and 1608 kg m−2 s−1 and reduced pressures between 0.005 and 0.69. The correlation of Yu et al. [24] was validated from experimental measurements carried out during flow boiling of the pure refrigerants R22, R123, R134a, R114, and R12 for mass velocities from 100 to 361 kg m−2 s−1 for reduced pressures in the range 0.06–0.22. The experimental data of the present research cover reduced pressures from 0.14 to 0.18.
The correlation, which shows the best prediction of the experimental heat transfer coefficients, is the one developed by Yu et al. [24], with a relative, absolute and standard deviation of −16.6%, 19.9%, and 15.6%, respectively. The model developed by Yu et al. [24] takes into account the surface roughness of the tube in a parameter called nucleation cavity size: the areal roughness parameter Sa is considered for the calculation as nucleation cavity size. The model of Gungor and Winterton [22] shows a relative, absolute, and standard deviation of −28.7%, 28.8%, and 12.3%, respectively, whereas the model of Kim and Mudawar [23] of −24.0%, 25.7%, and 16.8%, respectively.
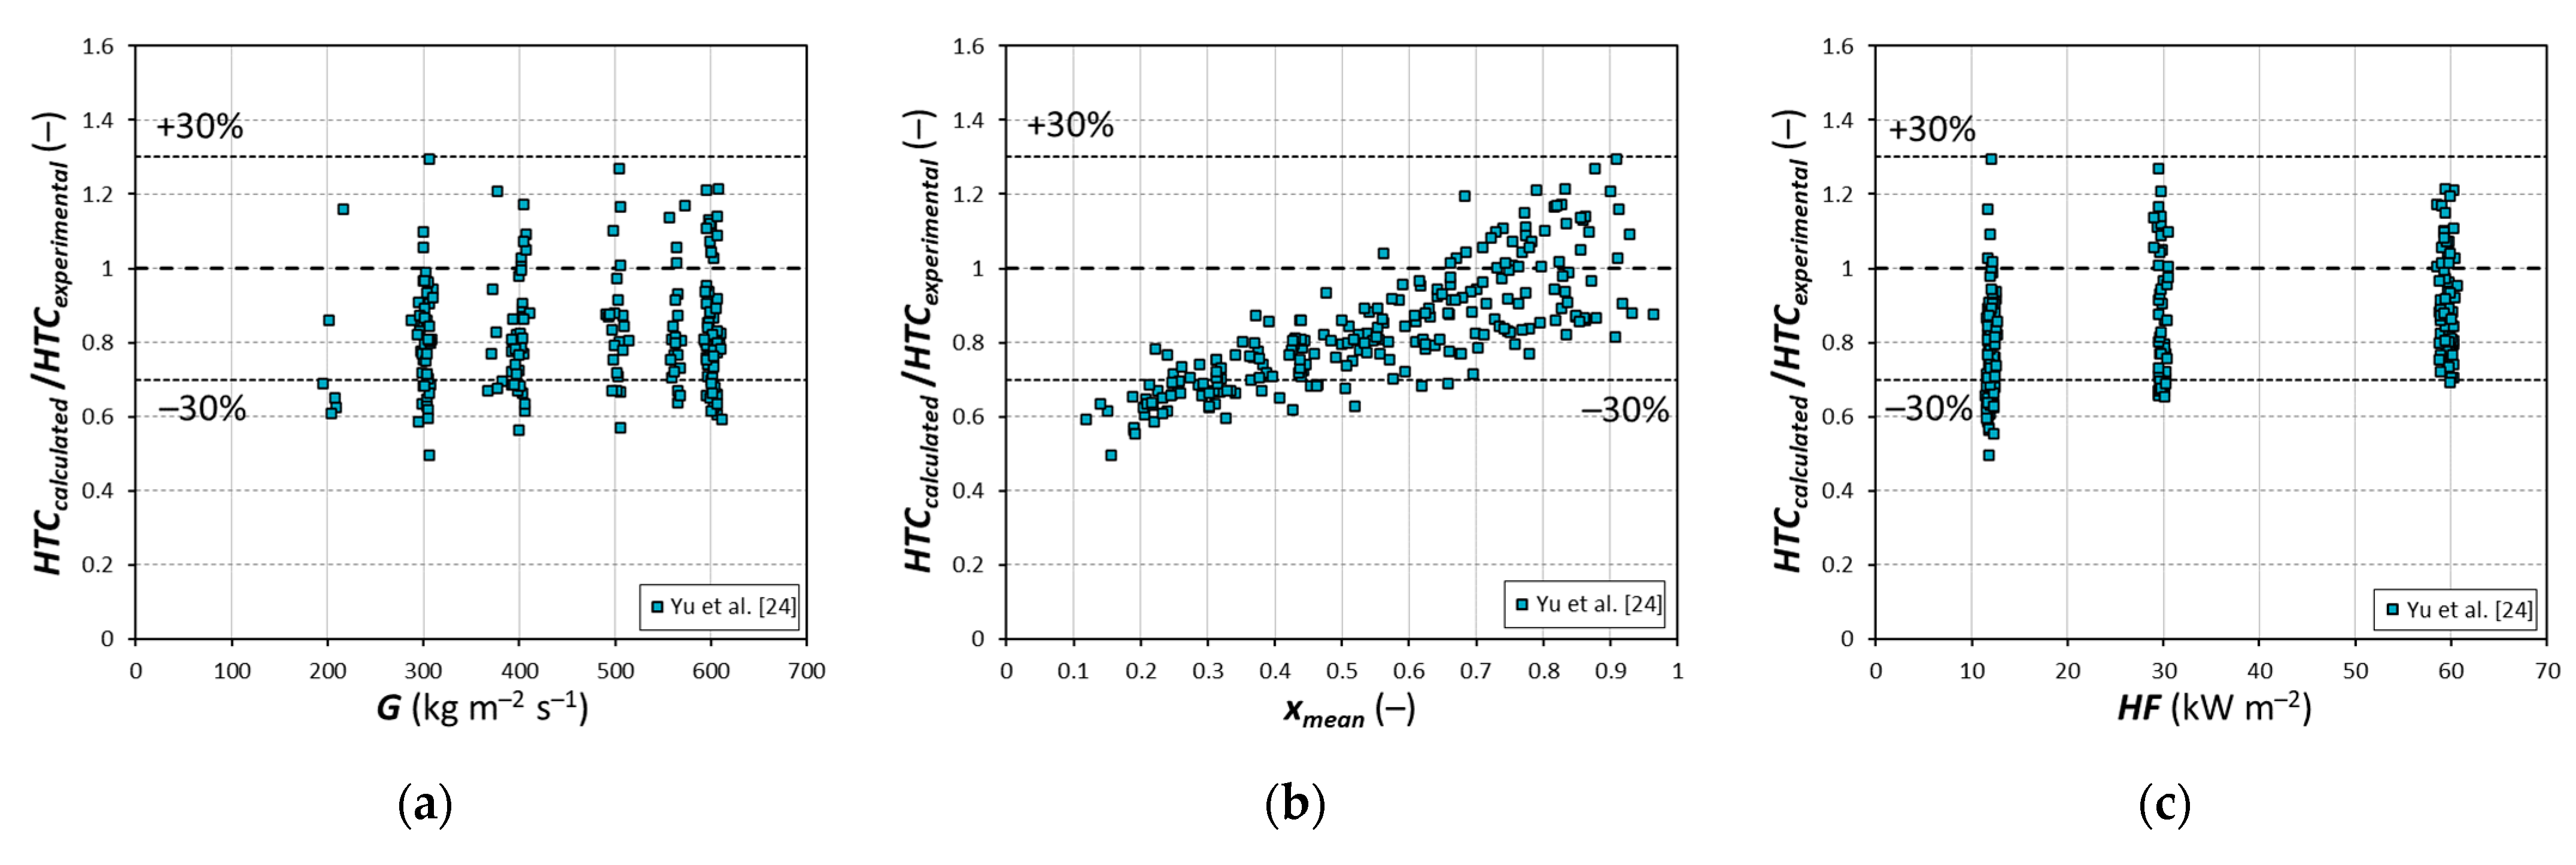
A further analysis on the correlation developed by Yu et al. [24], which is the correlation that better estimates the experimental heat transfer coefficients, is given in Figure 10, which reports the ratio between the calculated heat transfer coefficient and the experimental counterpart, plotted against mass velocity (Figure 10a), mean vapor quality (Figure 10b), and heat flux (Figure 10c). The underestimation of the correlation of Yu et al. [24] is mainly due to a not perfect effect of vapor quality on the calculated heat transfer coefficient: the correlation tends to underestimate the experimental heat transfer coefficient especially as vapor quality decreases.
The comparison between calculated and experimental frictional pressure drops is reported in Figure 11. The models of Cavallini et al. [25] and of Muller-Steinhagen and Heck [26] were considered. The correlation of Cavallini et al. [25] was validated against data of halogenated refrigerants with reduced pressures between 0.1 and 0.6 and mass velocities above 150 kg m−2 s−1. The correlation of Muller-Steinhagen and Heck [26] was developed from data including different fluids, such as refrigerants, water, argon, nitrogen, for mass velocities generally higher than 120 kg m−2 s−1.
Both models satisfactorily predict the experimental values: the model of Cavallini et al. [25] shows a relative, absolute, and standard deviation of 8.6%, 13.2%, and 15.6%, respectively, whereas the model of Muller-Steinhagen and Heck [26] of −3.5%, 16.3%, and 19.0%, respectively.

6. Conclusions

This paper dealt with R1234ze(E) flow boiling inside a 2.5 mm ID smooth tube, for the following working conditions: mass velocity in the range 200–600 kg m−2 s−1, heat flux in the range 12–60 kW m−2, for saturation temperature of 30 °C. At the lowest tested heat flux, the heat transfer coefficient increases as mass velocity increases and as vapor quality increases, until the thermal crisis occurs. The situation changes at high heat flux: there is no longer effect of mass velocity, and the heat transfer coefficient slightly decreases as vapor quality increases until dryout occurs. Frictional pressure drop increases as both mass velocity and vapor quality increase.
Additional tests were run at saturation temperatures of 25 °C and 35 °C to explore its effect on the flow boiling mechanism. The effect of saturation temperature, i.e., of saturation pressure, on the heat transfer coefficient and pressure drop, depends on the working conditions of mass velocity and heat flux: at low mass velocity and low heat flux, the higher the saturation temperature, the higher the heat transfer coefficient, but this consideration is no longer valid at high mass velocity and low heat flux. At high heat flux, the higher the saturation temperature, the higher the heat transfer coefficient. Frictional pressure drop decreases as saturation temperature increases.
Furthermore, other tests were run at mass velocities of 375, 565, and 755 kg m−2 s−1 to compare the thermal and hydraulic performance of the smooth tube against those of an equivalent microfin tube. The microfin tube showed a higher contribution of convective boiling, and, as a result, its heat transfer coefficient increases with vapor quality at all of the investigated working conditions.
Experimental heat transfer coefficients and frictional pressure drops were considered to verify empirical correlations from the literature. The correlation developed by Yu et al. [24] is the one which best predicts the experimental heat transfer coefficients. Both of the correlation of Cavallini et al. [25] and of Muller-Steinhagen and Heck [26] satisfactorily predict the frictional pressure drops.

Author Contributions

Conceptualization, A.D.; validation, A.D., investigation, A.D.; writing—original draft preparation, A.D.; visualization, A.D.; supervision, L.R.; funding acquisition, L.R. All authors have read and agreed to the published version of the manuscript.

Funding

This research was funded by MIUR through PRIN Project 2017F7KZWS_005 and by Università degli Studi di Padova through Project CPDA107382 and Project BIRD172935/17.

Institutional Review Board Statement

Not applicable.

Informed Consent Statement

Not applicable.

Data Availability Statement

Data are contained within the article.

Conflicts of Interest

The authors declare no conflict of interest. The funders had no role in the design of the study; in the collection, analyses, or interpretation of data; in the writing of the manuscript, or in the decision to publish the results.

References

  1. Brown, S.; Zilio, C.; Cavallini, A. Thermodynamic properties of eight fluorinated olefins. Int. J. Refrig. 2010, 33, 235–241. [Google Scholar] [CrossRef]
  2. Thol, M.; Lemmon, E.W. Equation of State for the Thermodynamic Properties of trans-1,3,3,3-Tetrafluoropropene [R-1234ze(E)]. Int. J. Thermophys. 2016, 37, 28. [Google Scholar] [CrossRef]
  3. Huber, M.L.; Assael, M.J. Correlations for the viscosity of 2,3,3,3-tetrafluoroprop-1-ene (R1234yf) and trans-1,3,3,3-tetrafluoropropene (R1234ze(E)). Int. J. Refrig. 2016, 71, 39–45. [Google Scholar] [CrossRef] [Green Version]
  4. Perkins, R.A.; Huber, M.L. Measurement and Correlation of the Thermal Conductivity of 2,3,3,3-Tetrafluoroprop-1-ene (R1234yf) and trans-1,3,3,3-tetrafluoropropene (R1234ze(E)). J. Chem. Eng. Data 2011, 56, 4868–4874. [Google Scholar] [CrossRef]
  5. Mulero, A.; Cachadina, I. Recommended Correlations for the Surface Tension of Several Fluids Included in the REFPROP Program. J. Phys. Chem. Ref. Data 2014, 43, 023104. [Google Scholar] [CrossRef]
  6. Lemmon, E.W.; Huber, M.L.; McLinden, M.O. NIST Standard Reference Database 23, NIST Reference Fluid Thermodynamic and Transport Properties, REFPROP, Version 10.0; Standard Reference Data Program; National Institute of Standards and Technology: Gaithersburg, MD, USA, 2018.
  7. Hodnebrog, O.; Etminan, M.; Fuglestvedt, J.S.; Marston, G.; Myhre, G.; Nielsen, C.J.; Shine, K.P.; Wallington, T.J. Global warming potentials and radiative efficiencies of halocarbons and related compounds: A comprehensive review. Rev. Geophys. 2013, 51, 300–378. [Google Scholar] [CrossRef] [Green Version]
  8. Park, J.E.; Vakili-Farahani, F.; Consolini, L.; Thome, J.R. Experimental study on condensation heat transfer in vertical minichannels for new refrigerant R1234ze(E) versus R134a and R245fa. Exp. Therm. Fluid Sci. 2011, 35, 442–454. [Google Scholar] [CrossRef]
  9. Del Col, D.; Bortolato, M.; Azzolin, M.; Bortolin, S. Condensation heat tranfer and two-phase frictional pressure drop in a single minichannel with R1234ze(E) and other refrigerants. Int. J. Refrig. 2015, 50, 87–103. [Google Scholar] [CrossRef]
  10. Liu, N.; Xiao, H.; Li, J. Experimental investigation of condensation heat transfer and pressure drop of propane, R1234ze(E) and R22 in minichannels. Appl. Therm. Eng. 2016, 102, 63–72. [Google Scholar] [CrossRef]
  11. Diani, A.; Campanale, M.; Cavallini, A.; Rossetto, L. Low GWP refrigerants condensation inside a 2.4 mm ID microfin tube. Int. J. Refrig. 2018, 86, 312–321. [Google Scholar] [CrossRef]
  12. Diani, A.; Camapanale, M.; Rossetto, L. Experimental study on heat transfer condensation of R1234ze(E) and R134a inside a 4.0 mm OD horizontal microfin tube. Int. J. Heat Mass Transf. 2018, 126, 1316–1325. [Google Scholar] [CrossRef]
  13. Yang, Y.; Li, M.; Wu, W.; Zhang, H.; Ma, Y. Condensation heat transfer characteristics of R1234ze(E) and R32 in a mini horizontal smooth tube. Sci. Tech. Built Env. 2019, 25, 889–904. [Google Scholar] [CrossRef]
  14. Vakili-Farahani, F.; Agostini, B.; Thome, J.R. Experimental study on flow boiling heat transfer of multiport tubes with R245fa and R1234ze(E). Int. J. Refrig. 2013, 36, 335–352. [Google Scholar] [CrossRef]
  15. Li, H.; Hrnjak, P. Heat transfer coefficient, pressure drop, and flow patterns of R1234ze(E) evaporating in microchannel tube. Int. J. Heat Mass Transf. 2019, 138, 1368–1386. [Google Scholar] [CrossRef]
  16. Yang, Z.Q.; Chen, G.F.; Yao, Y.; Song, Q.L.; Shen, J.; Gong, M.Q. Experimental study on flow boiling heat transfer and pressure drop in a horizontal tube for R1234ze(E) versus R600a. Int. J. Refrig. 2018, 85, 334–352. [Google Scholar] [CrossRef]
  17. Longo, G.A.; Mancin, S.; Righetti, G.; Zilio, C. Saturated flow boiling Of HFC134a and its low GWP substitute HFO1234ze(E) inside a 4 mm horizontal smooth tube. Int. J. Refrig. 2016, 64, 32–39. [Google Scholar] [CrossRef]
  18. Ong, C.L.; Thome, J.R. Macro-to-microchannel transition in two-phase flow: Part 1—Two phase flow patterns and film thickness measurements. Exp. Therm. Fluid Sci. 2011, 35, 37–47. [Google Scholar] [CrossRef]
  19. Diani, A.; Rossetto, L. Characteristics of R513A evaporation heat transfer inside small-diameter smooth and microfin tubes. Int. J. Heat Mass Transf. 2020, 162, 120402. [Google Scholar] [CrossRef]
  20. Rouhani, S.Z.; Axelsson, E. Calculation of void fraction in the subcooled and quality boiling region. Int. J. Heat Mass Transf. 1970, 13, 383–393. [Google Scholar] [CrossRef]
  21. Diani, A.; Mancin, S.; Cavallini, A.; Rossetto, L. Experimental investigation of R1234ze(E) flow boiling inside a 2.4 mm ID microfin tube. Int. J. Refrig. 2016, 69, 272–284. [Google Scholar] [CrossRef]
  22. Gungor, K.E.; Winterton, R.H.S. Simplified general corelation for saturated flow boiling and comparisons of correlations with data. Chem. Eng. Res. Des. 1987, 65, 148–156. [Google Scholar]
  23. Kim, S.M.; Mudawar, I. Universal approach to predicting saturated flow boiling heat transfer in mini/micro-channels—Part I. Two-phase heat transfer coefficient. Int. J. Heat Mass Transf. 2013, 64, 1239–1256. [Google Scholar] [CrossRef]
  24. Yu, J.; Momoki, S.; Koyama, S. Experimental study on surface effect on flow boiling heat transfer in horizontal tubes. Int. J. Heat Mass Transf. 1999, 42, 1909–1918. [Google Scholar] [CrossRef]
  25. Cavallini, A.; Del Col, D.; Matkovic, M.; Rossetto, L. Frictional pressure drop during vapor-liquid flow in minichannels: Modelling and experimental evaluation. Int. J. Heat Fluid Flow 2009, 30, 131–139. [Google Scholar] [CrossRef]
  26. Muller-Steinhagen, H.; Heck, K. A simple friction pressure drop correlation for two-phase flow in pipes. Chem. Eng. Proc. 1986, 20, 297–308. [Google Scholar] [CrossRef]
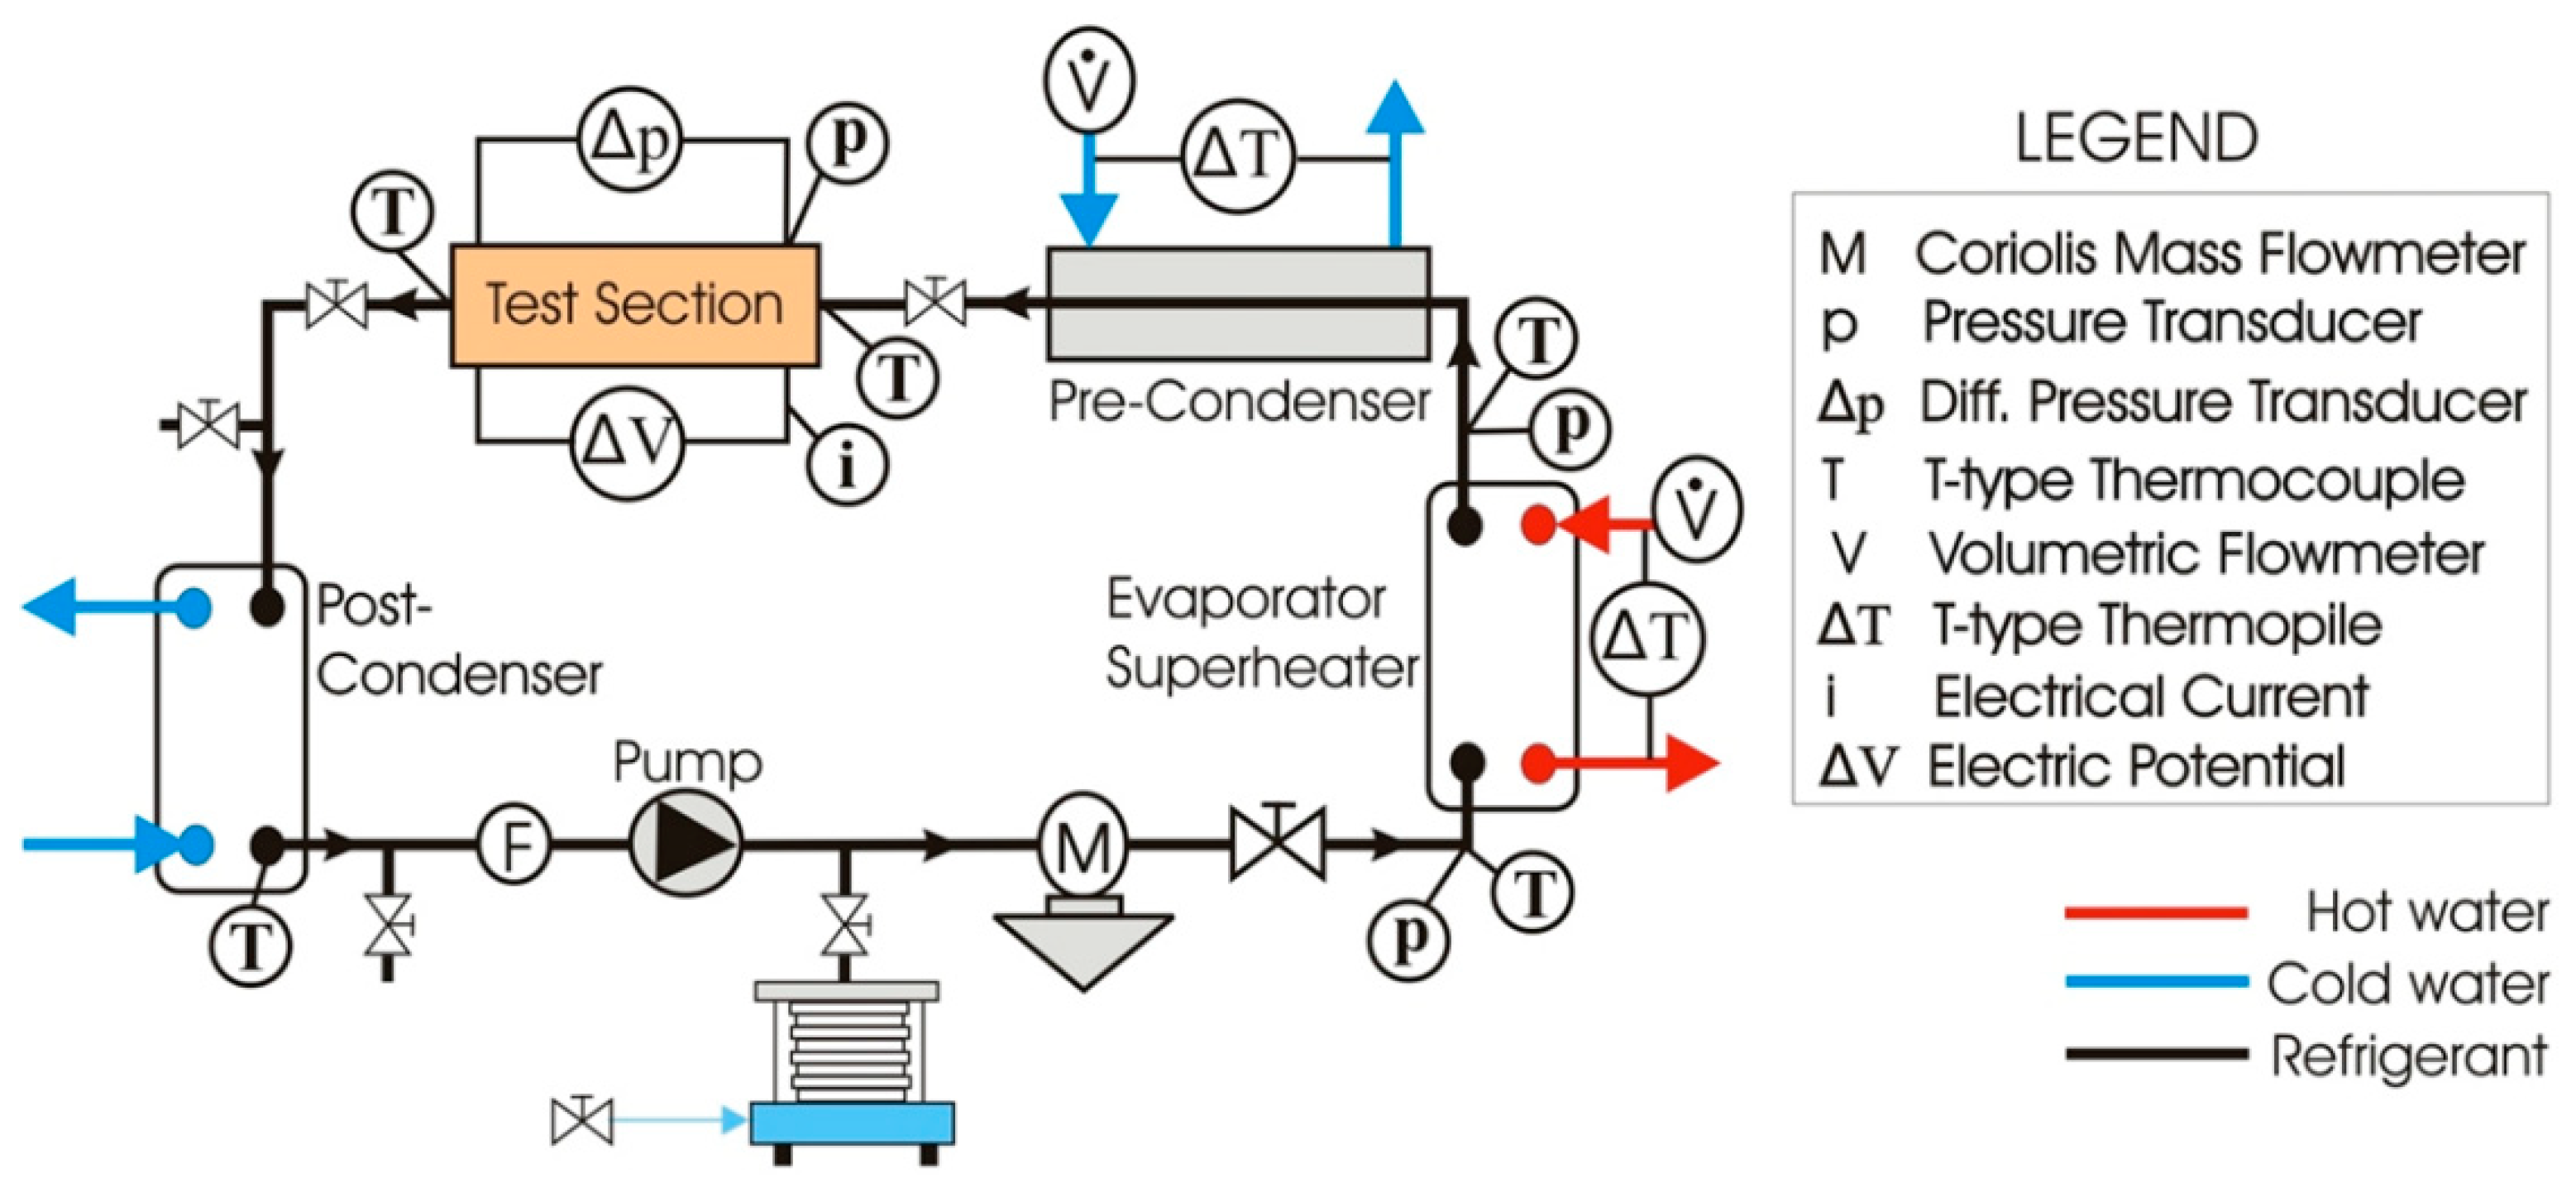
Figure 1. Schematic of the implemented facility.
Applsci 11 02627 g001
Figure 2. (a) Picture of the test facility; (b) picture of the test section.
Applsci 11 02627 g002
Figure 3. Heat transfer coefficient versus mean vapor quality at tsat = 30 °C for different mass velocities. (a) Data at HF = 12 kW m−2; (b) data at HF = 60 kW m−2. G expressed in (kg m−2 s−1).
Applsci 11 02627 g003
Figure 4. Heat transfer coefficient versus mean vapor quality at tsat = 30 °C and G = 400 kg m−2 s−1 at different heat fluxes. HF expressed in (kW m−2).
Applsci 11 02627 g004
Figure 5. Heat transfer coefficient versus mean vapor quality. (a) Data at G = 300 kg m−2 s−1, HF = 12 kW m−2; (b) data at G = 600 kg m−2 s−1, HF = 12 kW m−2; (c) data at G = 600 kg m−2 s−1, HF = 60 kW m−2.
Applsci 11 02627 g005
Figure 6. Frictional pressure gradient versus mean vapor quality. (a) Data at tsat = 30 °C and HF = 30 kW m−2 at different mass velocity; (b) data at HF = 12 kW m−2 and G = 600 kg m−2 s−1 at different saturation temperature.
Applsci 11 02627 g006
Figure 7. Comparison between heat transfer coefficient of smooth tube and microfin tube. (a) Data at tsat = 30 °C and HF = 30 kW m−2 at different mass velocity; (b) data at tsat = 30 °C and G = 565 kg m−2 s−1 at different heat flux. Data for the microfin tube are borrowed by Diani et al. [21].
Applsci 11 02627 g007
Figure 8. Comparison between frictional pressure gradient of smooth tube and microfin tube. Data at tsat = 30 °C and HF = 30 kW m−2 at different mass velocity. G expressed in (kg m−2 s−1). Data for the microfin tube are borrowed by Diani et al. [21].
Applsci 11 02627 g008
Figure 9. Comparison between calculated and experimental heat transfer coefficients.
Applsci 11 02627 g009
Figure 10. Ratio between calculated and experimental heat transfer coefficient versus: (a) mass velocity; (b) mean vapor quality; (c) heat flux. Model by Yu et al. [24].
Applsci 11 02627 g010
Figure 11. Comparison between calculated and experimental frictional pressure drops.
Applsci 11 02627 g011
Table 1. Type B experimental uncertainty of measured parameters.
ParameterType B Uncertainty
Refrigerant mass flow rate±0.1% of the reading
Water volumetric flow rate±0.25% of the reading
Temperature±0.05 K
Temperature difference±0.03 K
Electric power±0.13% of the reading
Absolute pressure±1950 Pa
Pressure drop±25 Pa
Publisher’s Note: MDPI stays neutral with regard to jurisdictional claims in published maps and institutional affiliations.