Article

Soft X-ray Transmission Microscopy on Lithium-Rich Layered-Oxide Cathode Materials

1
ALBA Synchrotron Light Source, Carrer de la Llum 2-26, 08290 Cerdanyola del Vallés, Spain
2
Helmholtz Institute Ulm (HIU), Electrochemistry I Helmholtzstraße 11, 89081 Ulm, Germany
3
Karlsruhe Institute of Technology (KIT), P.O. Box 3640, 76021 Karlsruhe, Germany
4
Department of Industrial Chemistry Toso Montanari, University of Bologna, Viale del Risorgimento 4, 40136 Bologna, Italy
5
Institute de Ciència de Materials de Barcelona, ICMAB-CSIC, Campus UAB, 08193 Bellaterra, Spain
*
Authors to whom correspondence should be addressed.
Appl. Sci. 2021, 11(6), 2791; https://doi.org/10.3390/app11062791
Submission received: 28 February 2021 / Revised: 16 March 2021 / Accepted: 18 March 2021 / Published: 21 March 2021
(This article belongs to the Special Issue Synchrotron- and FEL-Based X-ray Methods for Battery Studies)

Abstract

:

Featured Application

We present analysis strategies for soft X-ray transmission imaging data focused on the study of chemical and morphological properties of cathode material for lithium batteries.

Abstract

Energy-dependent full field transmission soft X-ray microscopy (TXM) is able to give a full picture at the nanometer scale of the chemical state and spatial distribution of oxygen and other elements relevant for battery materials, providing pixel-by-pixel absorption spectrum. We show different methods to localize chemical inhomogeneities in Li1.2Mn0.56Ni0.16Co0.08O2 particles with and without VOx coating extracted from electrodes at different states of charge. Considering the 3d(Mn,Ni)-2p(O) hybridization, it has been possible to discriminate the chemical state of Mn and Ni in addition to the one of O. Different oxidation states correspond to specific features in the O-K spectra. To localize sample regions with specific compositions we apply two different methods. In the first, the pixel-by-pixel ratios of images collected at different key energies clearly highlight local inhomogeneities. In the second, introduced here for the first time, we directly correlate corresponding pixels of the two images on a xy scatter plot that we call phase map, where we can visualize the distributions as function of thickness as well as absorption artifacts. We can select groups of pixels, and then map regions with similar spectral features. Core-shell distributions of composition are clearly shown in these samples. The coating appears in part to frustrate some of the usual chemical evolution. In addition, we could directly observe several further aspects, such as: distribution of conducting carbon; inhomogeneous state of charge within the electrode; molecular oxygen profiles within a particle. The latter suggests a surface loss with respect to the bulk but an accumulation layer at intermediate depth that could be assigned to retained O2.

1. Introduction

The full field transmission Soft X-ray microscopy (TXM) available at ALBA’s MISTRAL Beamline provides unique access to the chemical state, nanoscale spatial distribution, of light elements-containing materials. The practically accessible energy range (390–800 eV) permits to access among others, the O K-edge and the L-edges of several transition metals (TMs). The reported 2D X-ray imaging of electrochemically discharged Li- and Na/O2 battery cathodes probing the oxygen chemical state of the involved reaction products by a full XANES spectrum per pixel is a good example of the TXM capabilities [1,2,3,4,5].
Moreover, intensive investigation in the past few years has demonstrated that oxygen also has remarkable redox activity in many battery intercalation compounds [6,7,8,9,10,11,12], involving the production of trapped oxygen [13,14] and simultaneous TM migration to the lithium layer [15,16]. Oxygen is formally the anion in the host material and its oxidation is often referred to as anion redox, in contrast to the more established and understood redox chemistry of the TM cations. This supplemental activity from the anion provides additional capacity to cathode material, and therefore larger energy density, which explains the strong interest for these phenomena, beyond the fundamental point of view. The most studied group of this class of electrode active materials is the lithium-rich and cobalt poor nickel, manganese, cobalt oxide, with general formula Li[Li0.2M0.8]O2, where M represents one or a few TMs.
The presence and the distribution of higher valence oxygen in the active material is of critical relevance for a full understanding of the redox process in this system, and finally guides the design of more stable and effective materials. This could not be unquestionably achieved by diffraction techniques, while most X-ray Absorption Spectroscopy (XAS) beamlines use hard X-rays and are highly effective for TMs but cannot directly access oxygen. We have performed a combined hard and soft X-ray absorption study on uncoated and VOx-coated Li[Li0.2Ni0.16Mn0.56Co0.08]O2 electrode materials at different states of charge. This has allowed us to find evidence of an unexpected Mn reduction during charge with the formation of high- and low-spin Mn(III) that is partially reverted to Mn(IV) during discharge [17]. Quantification of the spinel environment formation and the average oxygen stoichiometry and oxidation state during charge-discharge has been also provided [18]. In these studies, TXM across the O K and Mn L3 edges provided bulk information on the different chemical species distributions on a particular Li[Li0.2M0.8]O2 cathode at the nanometer scale (40 nm of space resolution) by focusing over isolated nanoparticles of around 100–300 nm size. Herein, we present a focus on soft X-ray imaging, showing in detail novel analysis approaches for improving quantification and representation of large set of data represented by energy-dependent TXM images. This adds to the techniques we already presented previously with application to alkali-oxygen cathodes [1]. In particular, here we propose a data correction to extend the absorbance linearity range, and a phase map representation, a tool to precisely isolate pixels and regions of the sample with different spectral shape, where target spectral features are enhanced/suppressed. From them, 2D maps of different chemical environments or phases are obtained, which helps to visualize the electrode material and analyze its homogeneity.

2. Materials and Methods

2.1. Sample Preparation

Li[Li0.2Ni0.16Mn0.56Co0.08]O2 was prepared by a coprecipitation method and coated by a VOx layer as described in detail previously [19,20]. Electrodes were prepared by casting slurries of composition 85% active material, 10% conductive carbon black (C-Nergy, Super C 45, Imerys), and 5% binder (CMC; DOW Wolff Celulosics, Walocel CRT2000 PA12), onto 25 µm Al foil and assembled in electrochemical cells as detailed earlier. Several cells were driven to different states of charge along the galvanostatic cycle test at a charge/discharge rate of C/10 (Figure 1). The respective cells were dismantled inside an Ar filled glovebox, the cathodes were extracted and rinsed in dimethylcarbonate (Sigma-Aldrich, Germany). Samples were scratched off from the collector and deposited on carbon-coated Au TEM grids. Dimethylcarbonate was used to wet the sample powder and improve its adhesion on the TEM grid. The grids were then stored under Ar in cryogenic vials and transferred to the microscope in cryogenic condition (T < 110 K) under N2 vapor to avoid atmospheric contamination.

2.2. Data Acquisition and Treatment

Energy-resolved soft TXM was performed at the MISTRAL beamline of the ALBA Synchrotron. For full details on the acquisition and analysis, please refer to previous publications [17,18].
Inside the microscope, samples were kept at cryogenic temperature (T < 110 K) and under high vacuum conditions during all the measurements. The cryogenic temperature helps minimizing radiation damage [1]. Transmission images (2 s exposure time, effective pixel size 10 nm, field of view 10 μm × 10 μm) were collected in step mode, varying the energy across the O K-edge and Mn L-edge with a variable spectral sampling (0.5−0.1 eV), depending on the energy width of the investigated features. A preliminary calibration of the absolute value of the energy was performed before the experiment using standard references samples at different energies along the available energy range of the beamline (CaCO3, N2, TiO2, Mn2O3, and Fe2O3). The objective zone plate lens (outermost zone width of 25 nm, 1500 zones) and the back-illuminated CCD detector (Pixis XO by Princeton Instruments with 1024 × 1024 pixels and 13 nm pixel size) positions were automatically adjusted to maintain the sample in focus and constant magnification (1300×). To obtain transmittance, two images are acquired at each energy, the transmitted intensity I and the incident intensity I0, which we call Flat Field. The obtained energy stack images are aligned taking as reference the first image.

2.3. Stray Light Correction and Normalization

A full field X-ray microscope presents a significant level of background light (stray light) from higher-order diffraction originated by the used zone plate. The consequence is a significant damping of absorbance, with an underestimation of absorbance larger than 7% and a saturation below absorbance =1.2 at the O K-edge. This leads to significant deformation of spectra with compression in the intensity direction and a limitation to more quantitative determinations. To correct for this effect, we determined a procedure that considerably improves the absorbance linearity by determining the stray light and introducing it to a general formula that we apply to calculate absorbance from I and I0 on the O-K region:
A = l o g ( 1.0733 ( I / I 0 ) 0.0733 )
The hypothesis and the determination of this equation are described in detail in Appendix A.
In order to easily compare the peak intensities in the same absorption edge corresponding to a different thickness in the sample and hence to a different scale in the absorbance values, a further normalization is performed with respect to the total absorbance variation across the selected edge. In addition, the contribution of the pre-edge absorption is subtracted. The following total formula is generally used:
A n o r m ( E ) = A m ( E ) A p r e ( E ) A p o s t ( E ) A p r e ( E )
where A p r e ( E ) and A p o s t ( E ) are the line fit in the pre- and post-energy range respectively and the pixels coordinates x, y were omitted.

3. Results

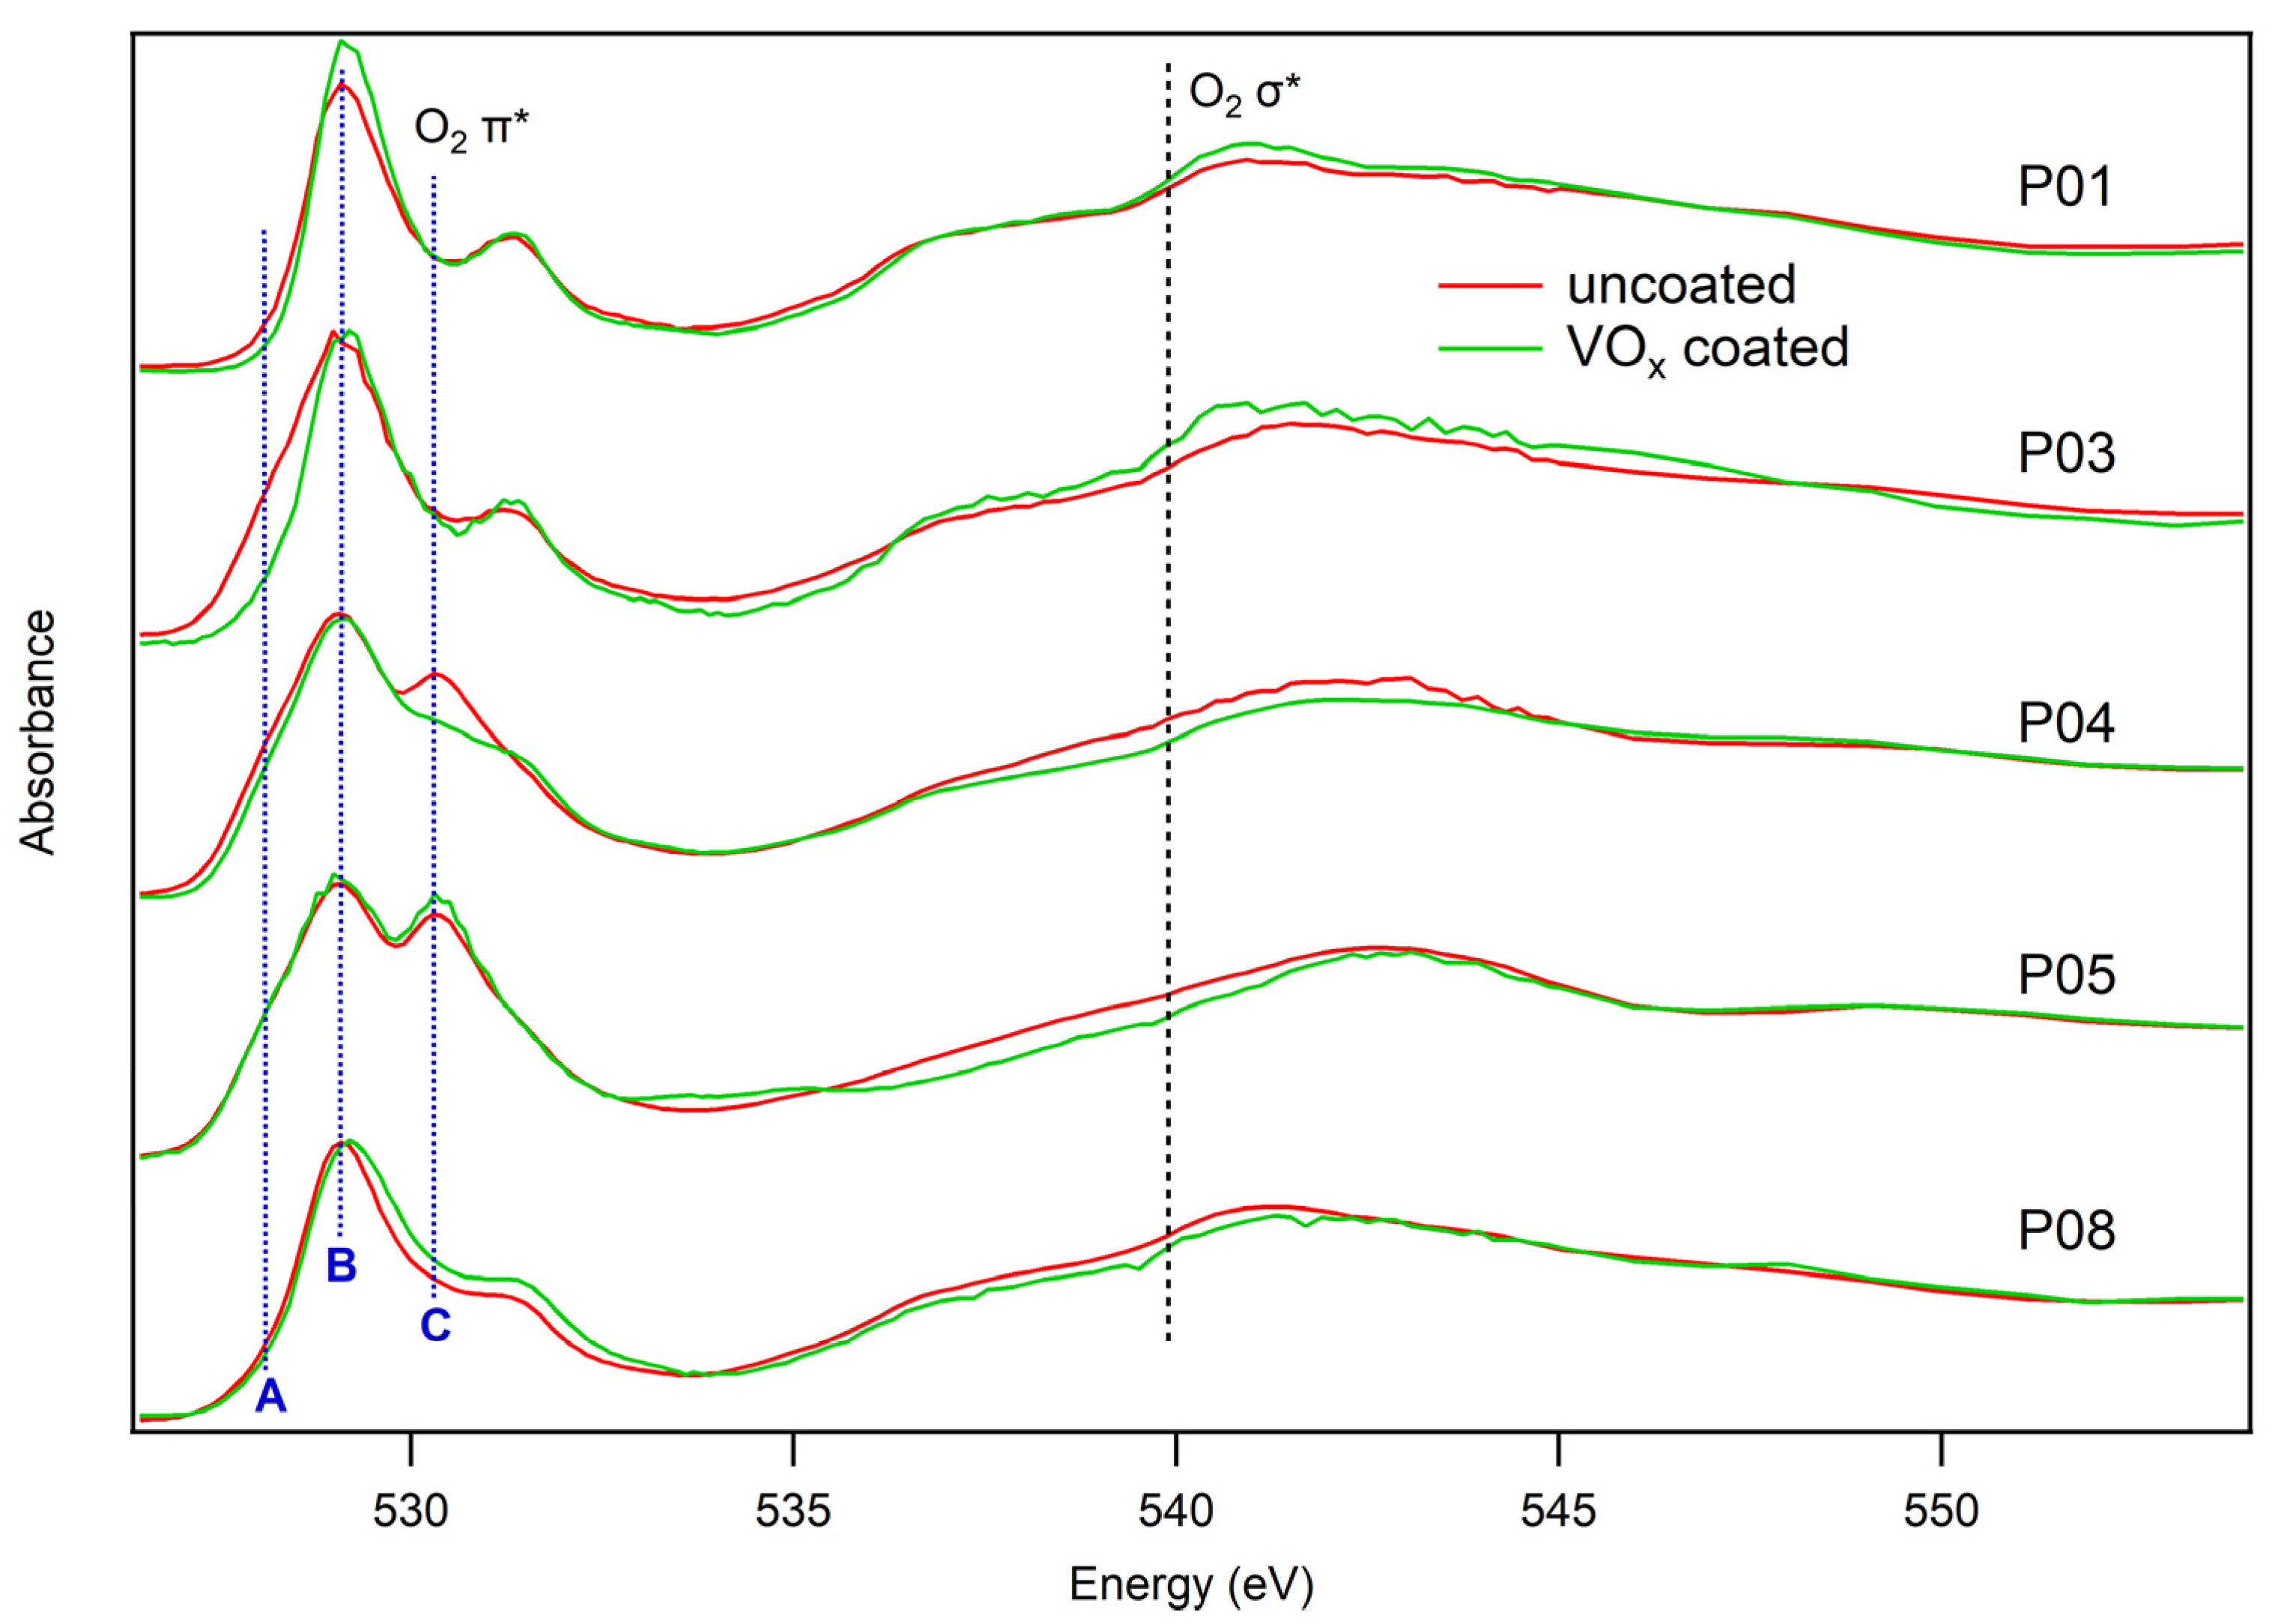
Spectra integrated over the whole field of view for the set of samples are reported in Figure 2. To only consider reliable absorbance we selected valid pixels with absorbance at the measured maximum B between 0.15 and 1.08, i.e., from image regions with sample and with an expected error below 10%; therefore, we consider their shape highly accurate. A measurement without spatial resolution would require a thin and highly homogeneous sample to warrant the same quality. The prepeaks in O-K spectra include transitions to empty oxygen 2p states that in the case of bonding with a TM are hybridized with its d-states. These peaks result as the most intense and sharp feature, and as shown previously their envelope reproduces closely the shape of Mn 3d states, which indeed is the most abundant TM in the active material [17]. To describe their evolution along the first charge-discharge we identified three main components: A, B, and C, centered at 528.1 eV, 529.1 eV, and 530.3 eV, respectively. A is attributed to Ni(IV), formed upon initial Li deintercalation, before P03. B corresponds to the main Mn(IV) peak, while C emerges during the oxidation plateau at 4.5 V and has been attributed to both the formation of Mn(III), as evidenced by Mn-K edge XAS [17] and trapped molecular O2, as recently discovered [14]. Intensities of molecular oxygen mainly overlap with other features, but the observed evolution between P03 and P05 is compatible with its presence. In fact, if corrected to our energy scale, peak C overlaps perfectly with transitions to O2 π* states, and the increased intensity around 540 eV corresponds well to O2 σ* reported in literature [21]. We suggested that Mn(III) is stabilized by the interaction with molecular O2 [18], so that the two components are spatially highly associated in feature C within our resolution. The coating introduces a remarkable delay in the spectra evolution by charging, particularly in the Ni oxidation at P03 and in the growth of peak C at P04.
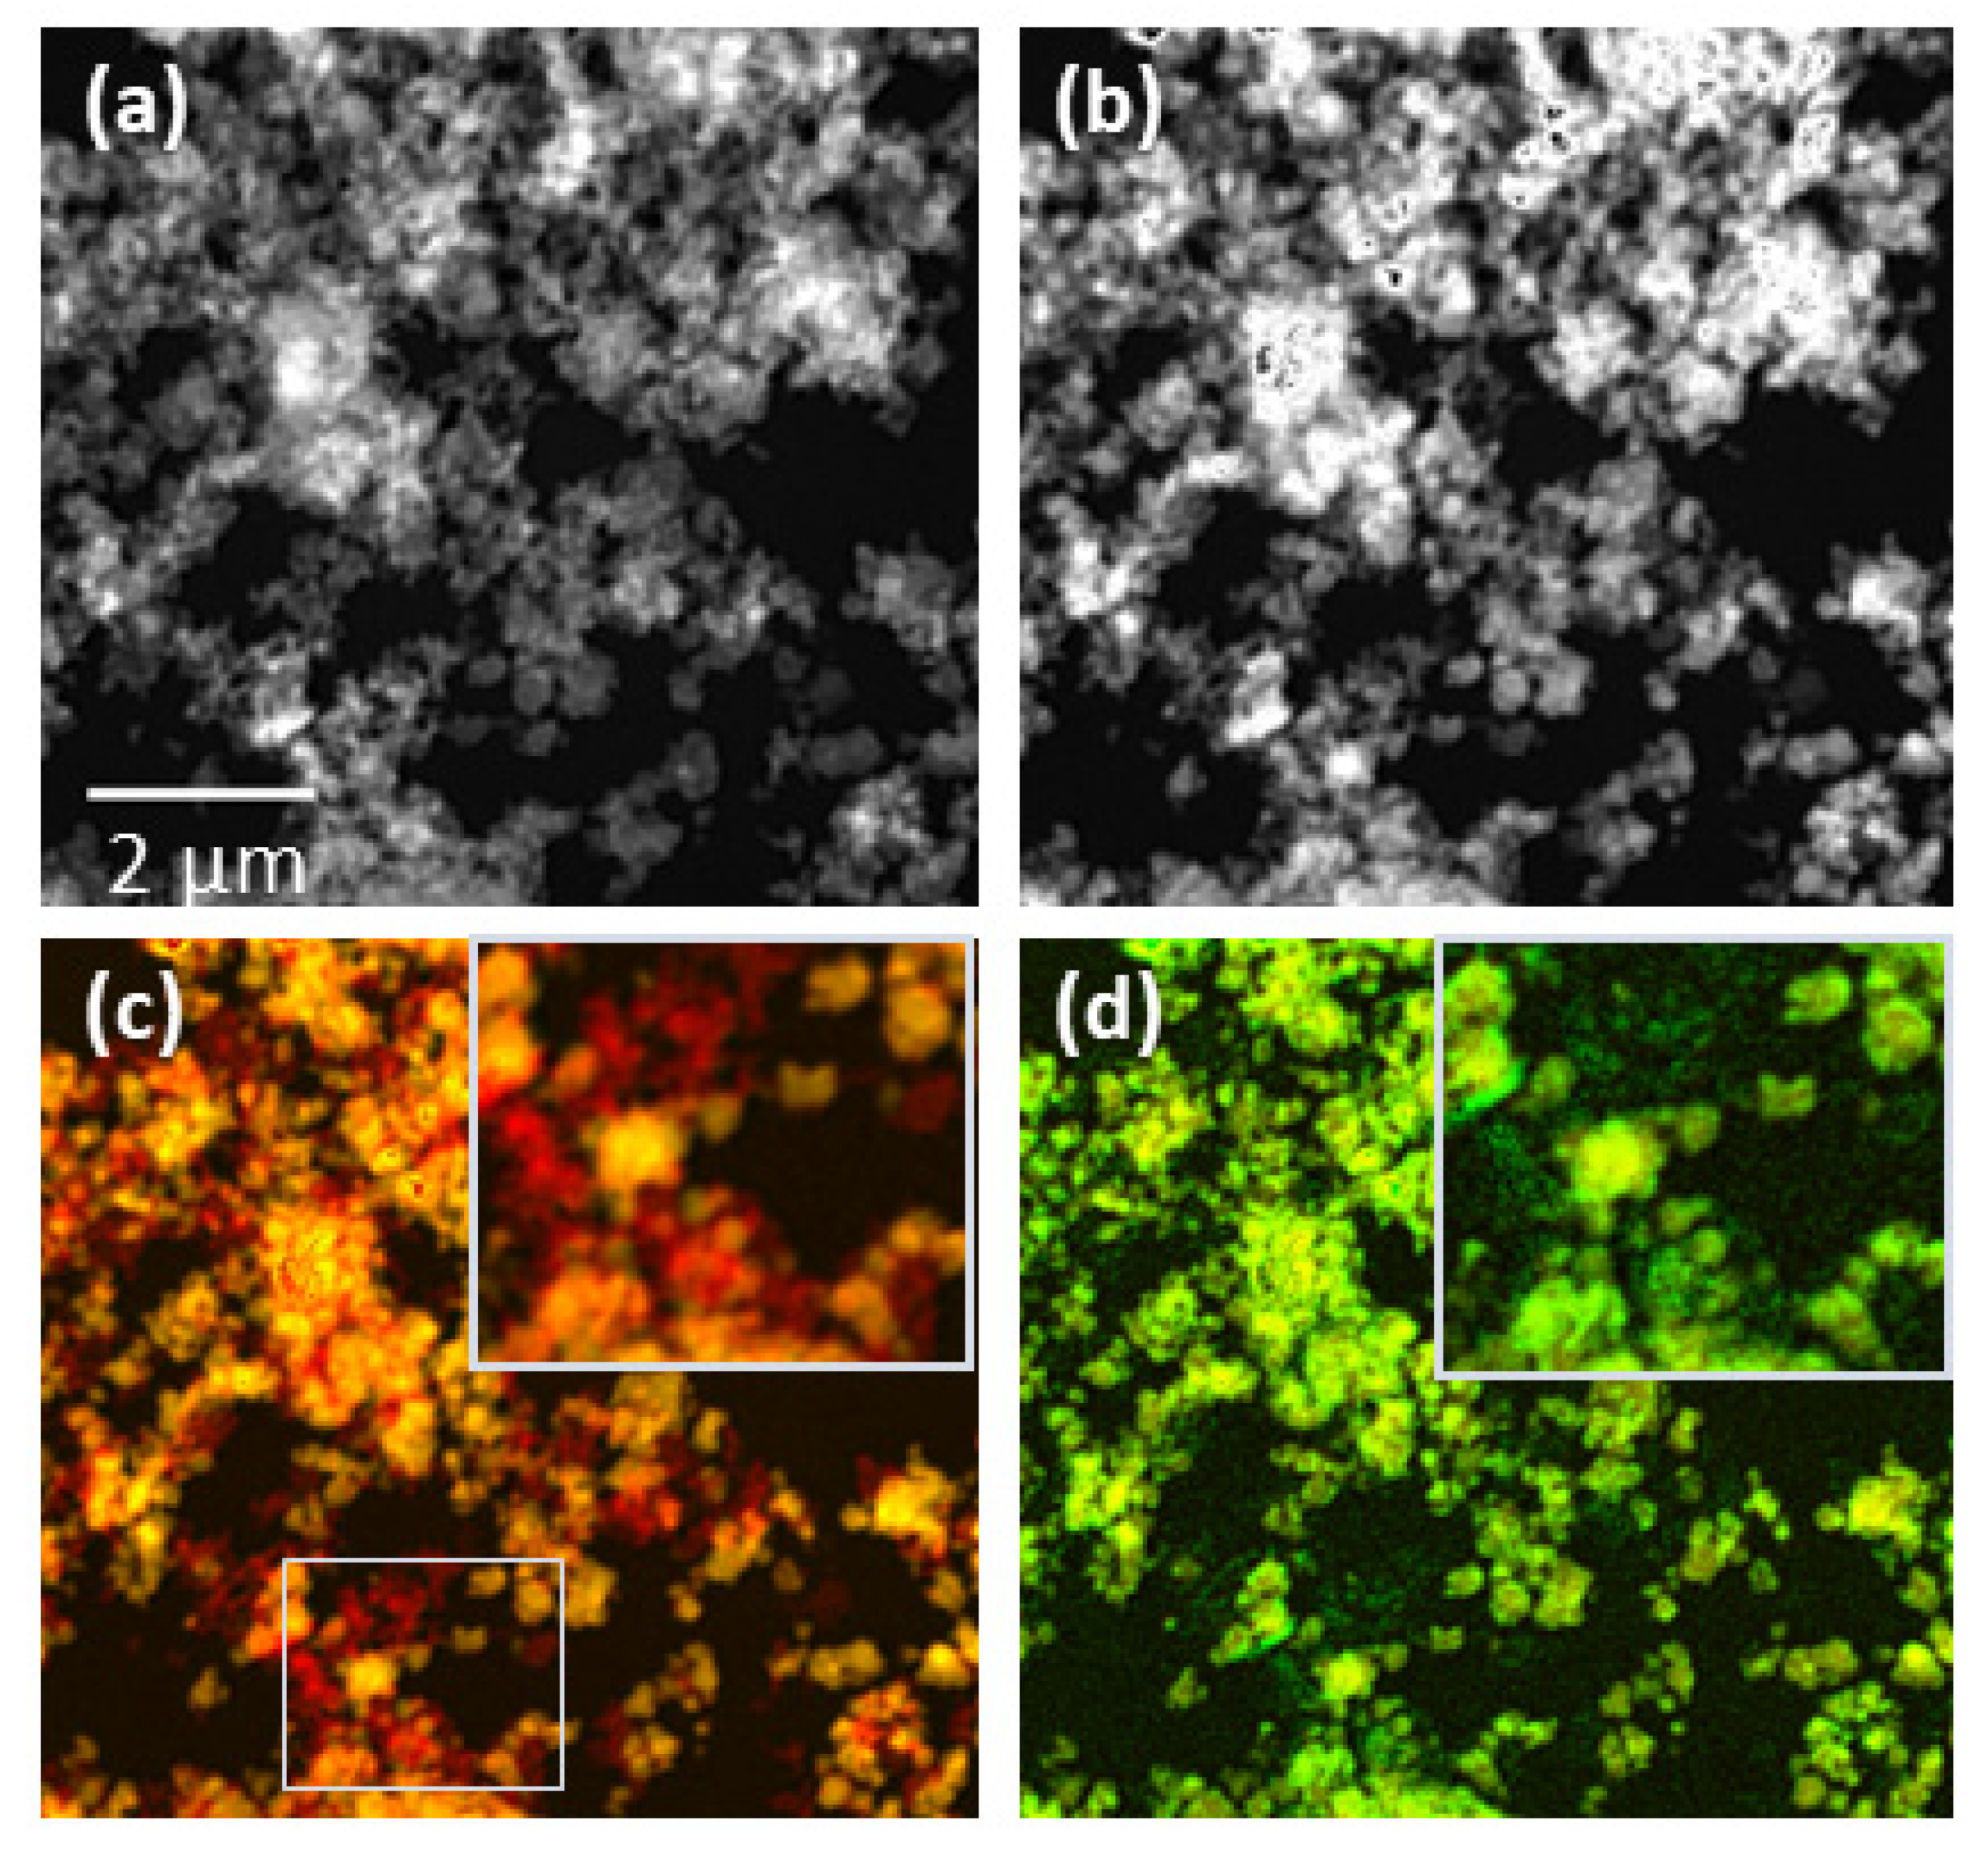
An example of the transmission images relative to the spectra is reported in Figure 3 for the pristine VOx-coated sample. Figure 3a,b represent respectively the absorbance averaged in the flat O-K pre-edge region (i.e., immediately before the absorption prepeaks) and in the C region, where an absorption jump higher than one is present only in a minor fraction of the sample area. All components absorb similarly before the edge, but at the O prepeaks energy, the absorbance is much stronger only for the active material, which contains oxygen-transition metal bonds. The point-by-point difference is more obvious in Figure 3c, where these two maps are overlapped in a dual channel image, with red (pre-edge) and yellow (prepeak) colors. The red color prevails where only super C carbon black is present, in a finer texture, while most of the area has different orange tonalities that can be attributed to carbon mixed with coarser oxide particles. Figure 3d is the combination of the oxide (Figure 3b, yellow) with the V signal (green) of the coating. Indeed, smaller and isolated particles show more vivid green tonalities than larger aggregates where (surface) vanadium contribution is smaller. The fine red colored particles do not contain vanadium and are more difficult to recognize in Figure 3d.
A full-field transmission spectromicroscopy measurement consists in acquiring several transmission images varying the energy across the absorption edge of interest, the oxygen K edge in the present case. After normalization, alignment, and conversion to absorbance, a full X-ray absorption spectrum (XAS) can be extracted at each image pixel, usually resulting in ~ 1 × 10 6 single pixel XAS (a typical field of view contains 1024 × 1024 pixels). This large number of spectra complicates the extraction of scientifically meaningful information and efficient and reproducible data processing requires some level of automatization. To localize sample regions with specific compositions we apply two different methods. In the first, we produce maps of ratios between the components that clearly highlight local inhomogeneities. In the second method, we produce phase maps, consisting of the scatter plot obtained by directly correlating these components pixel by pixel on a xy graph, and then mapping regions with comparable spectral features. With this second approach absorption artifacts are more easily recognized. Core-shell distributions are clearly shown in these samples.
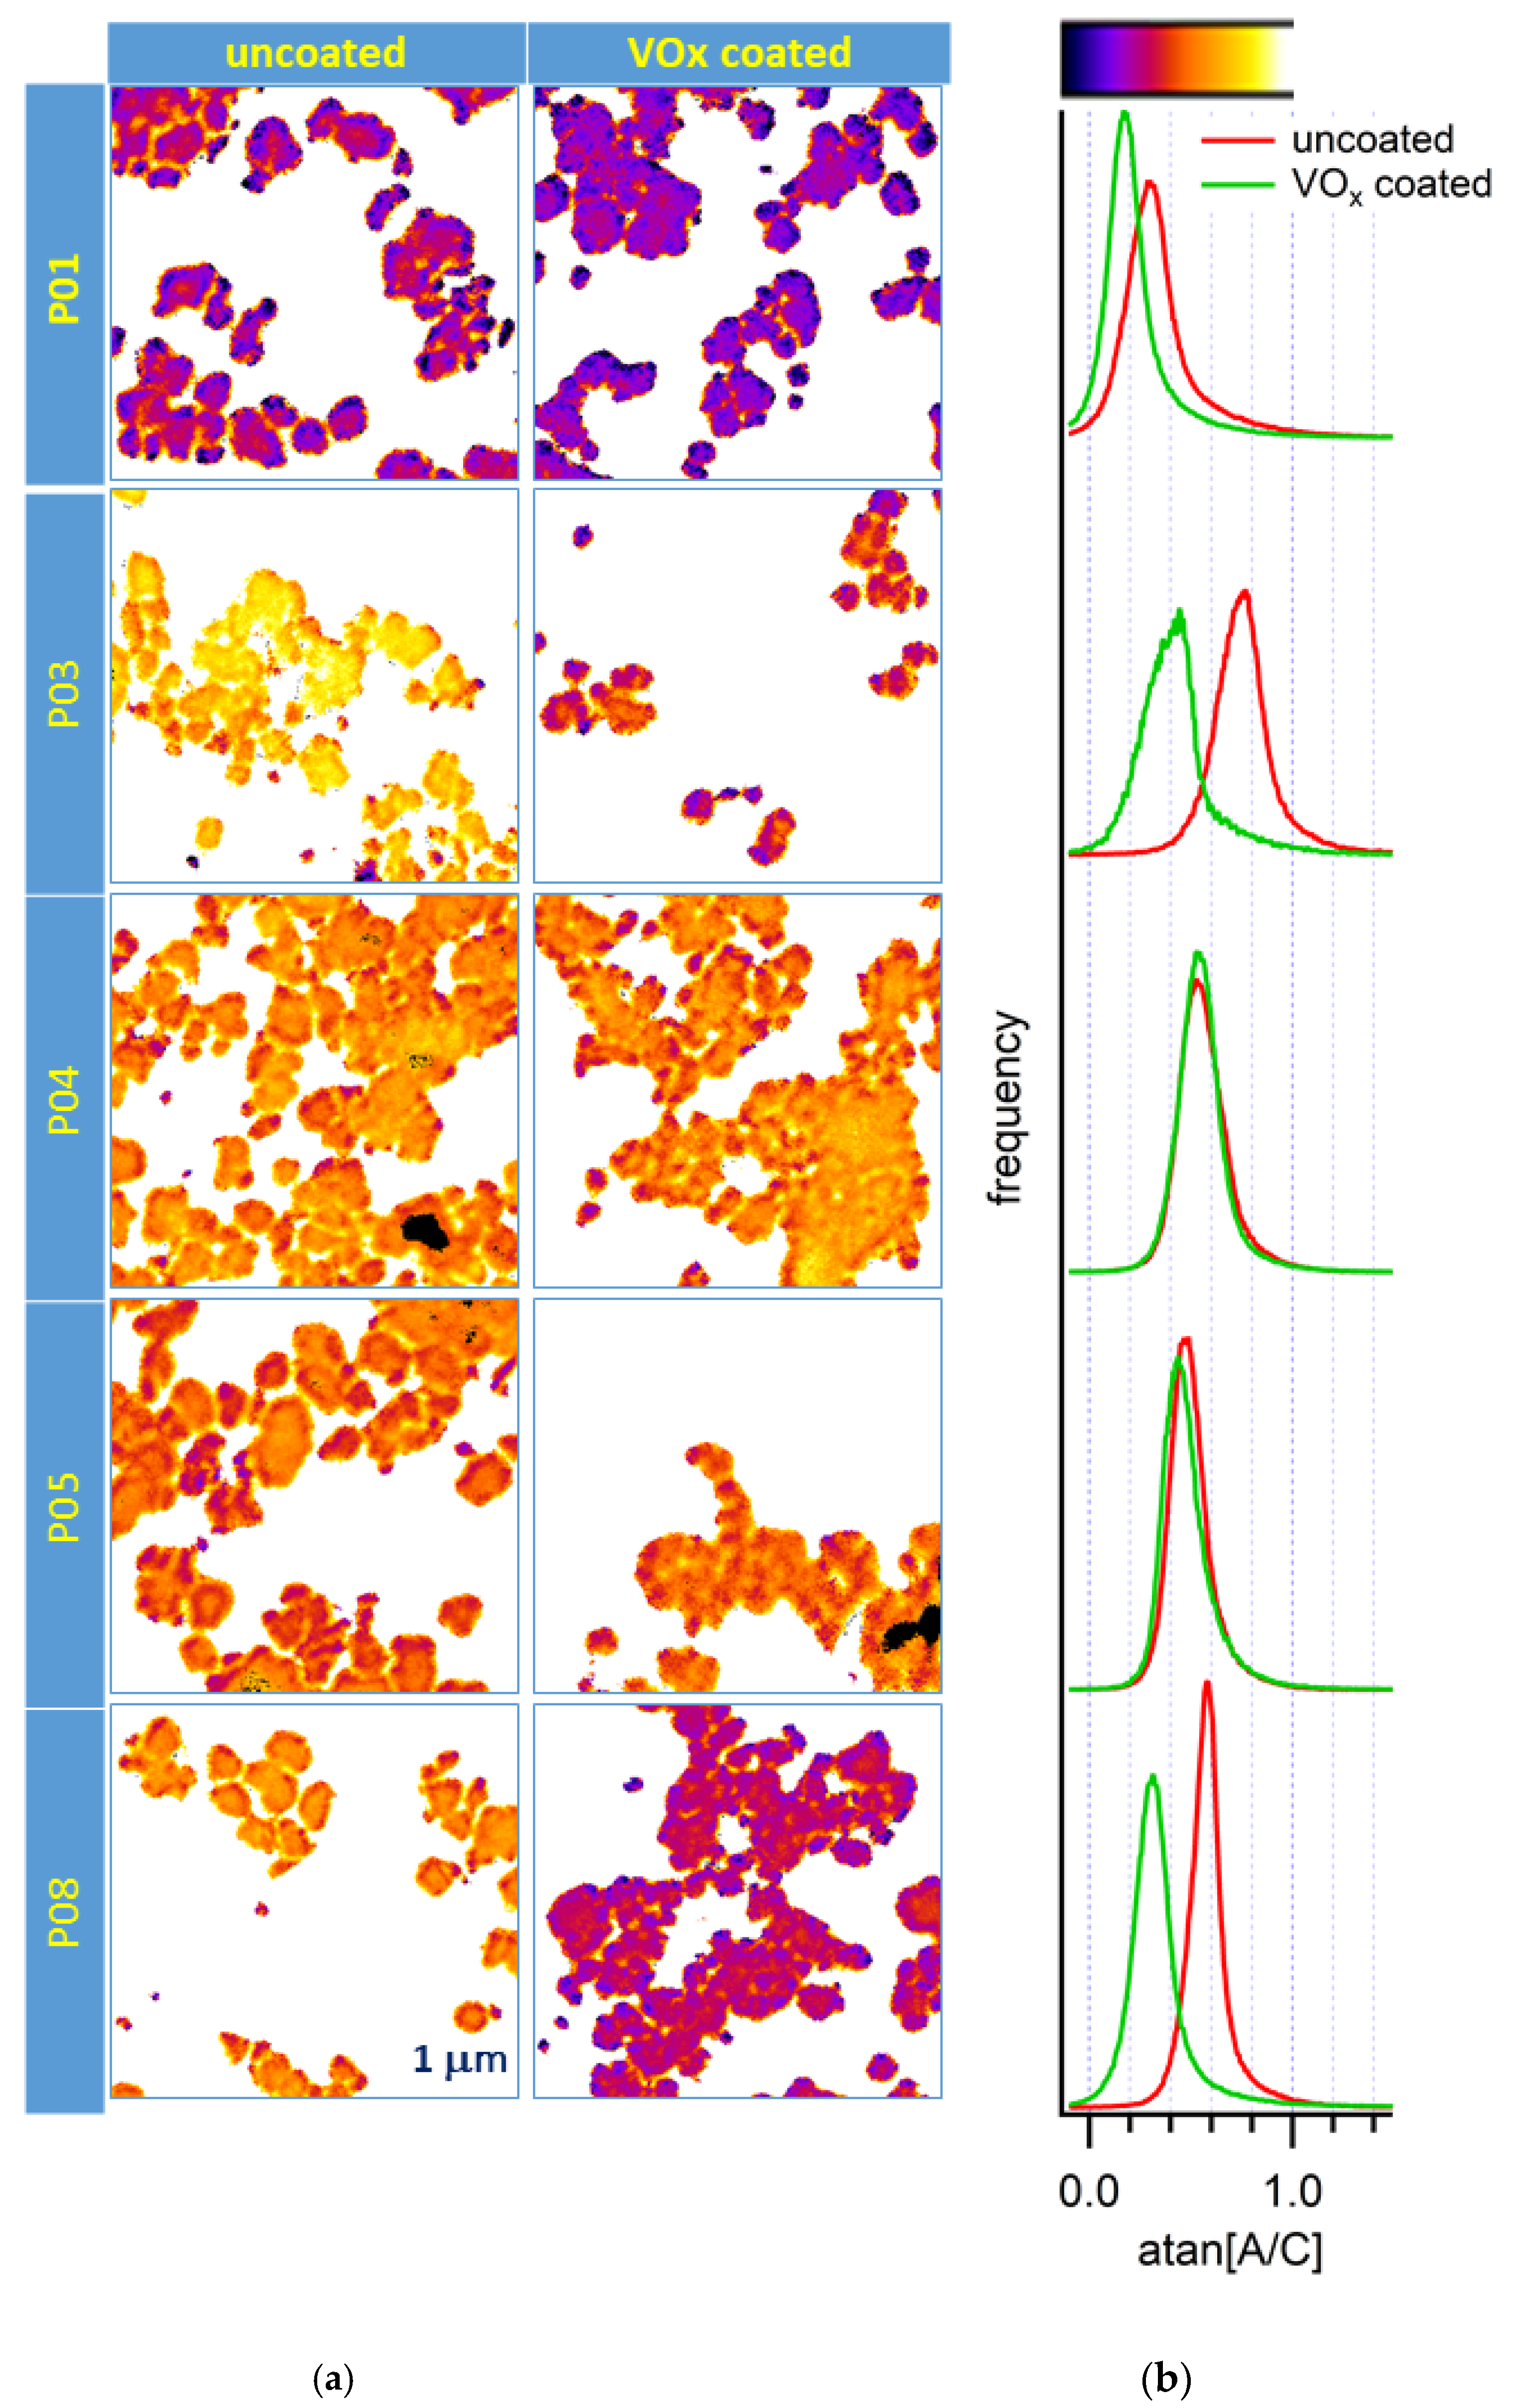
A statistically more proper representation of component ratio is using the arctangent of the ratio, as explained in Appendix B. When plotting distributions of ratio values, skewed shapes are obtained in general, while the arctangent allows avoiding intrinsically asymmetric representations of distributions and better discrimination of compositional heterogeneities that are reflected in deviations from the normal Gaussian shape. Figure 4 shows the detail of C vs. B maps and corresponding histograms that allow analyzing the spectra heterogeneity on the sample. As B is the most intense and dominant component of the sample, we use it to normalize changes in C and remove thickness effects. The choice of a nearby component for normalization reduces the impact of small misalignments and possible sample contractions that may then produce artifacts. The spectral variations along the charge-discharge cycle are reflected by the shifts in the average value, which increases slightly from P01 to P03, corresponding to the sloping part of the profile, where the main process is the Ni oxidation, and more strongly with P04 and further at P05, where the anion redox is expected to contribute in overlap to the partial Mn reduction, and component C emerges. With discharge the component C withdraws partially, leading to the decreased ratio. The delay caused by the VOx coating indeed is also evident at P04, because C does not move before this stage. The peak width also increases considerably at P04, particularly with the uncoated sample. This looks not related to the value of the ratio, because the distribution becomes sharper again at P05. Not only can we infer an increased composition heterogeneity in this sample. At a closer look, the uncoated P04 distribution also becomes quite asymmetric, with increased intensity on the side of lower C/B ratios. This seems related to a larger relative number of regions with lower O2 content, in some regions of the bulk, and generally at particle edges, which could be seen as a possible confirmation of the escape of molecular oxygen from macroscopic cracks or damages in the particles. The smaller width for the corresponding coated sample corresponds to a more homogenous composition, which could be mainly attributed to the delayed delithiation of the active material. In fact, both distributions are quite similar at the fully deintercalated sample P05. Nevertheless, looking at P08 the coated sample seems to show slightly poorer reversibility and a more irregular distribution of areas with different colors. The uncoated sample instead shows a more ordered arrangement, from the edge to the bulk, of lower-higher-lower ratio, which seems to correspond to concentric layers with different thickness. As proposed by House et al. the surface layer could correspond to a densified, oxygen-poor region [14], while the bulk should have an evenly distributed concentration of trapped oxygen. However, we notice also a layer of high concentration of oxygen that may accumulate at the interior of the densified shell, confirming that the shell may act as a barrier for further oxygen release.
It is interesting also to follow the evolution of the A/C ratio (Figure 5). This is more complex than the previous because of the asynchronous evolution of A and C components. The larger width indicates the heterogeneity of the metal oxidation, already present in the pristine P01, which becomes substantial at P03, particularly in the coated sample, where A and C are still both low, in contrast to the uncoated where A is already high. However, the following distributions are remarkably sharp, indicating that increases in oxygen content are spatially correlated with a higher Ni oxidation.
We propose an alternative representation as phase maps, based on the comparison of the pixel-by-pixel absorbance collected at two particular energy values. The distributions expressed as ratios can be resolved by plotting one component vs. the other, obtaining scatter plots, where different ratios or a different thickness can be systematically selected in the field of view. Pixels with different absorbance ratios of the two selected peaks will be easily identified. For instance, in Figure 6, the phase map for P05 is reported for peak C (~530.3 eV) versus the absorbance value in the pre-edge region (~523.0 eV). Because of the great number of pixels (≈106) the density of point is reported using different colors. The scatter plot has a characteristic plume shape, with the spot at the origin corresponds to background pixels outside any object. Larger sample thickness will correspond to points more distant from the origin. Two populations of pixels distributed along two lines with different slope are clearly visible (Figure 6a). Selecting the pixels corresponding to the small slope line (Figure 6b), i.e., small oxygen content, we are able to select regions in the sample where instead the carbon additive is abundant (Figure 6c).
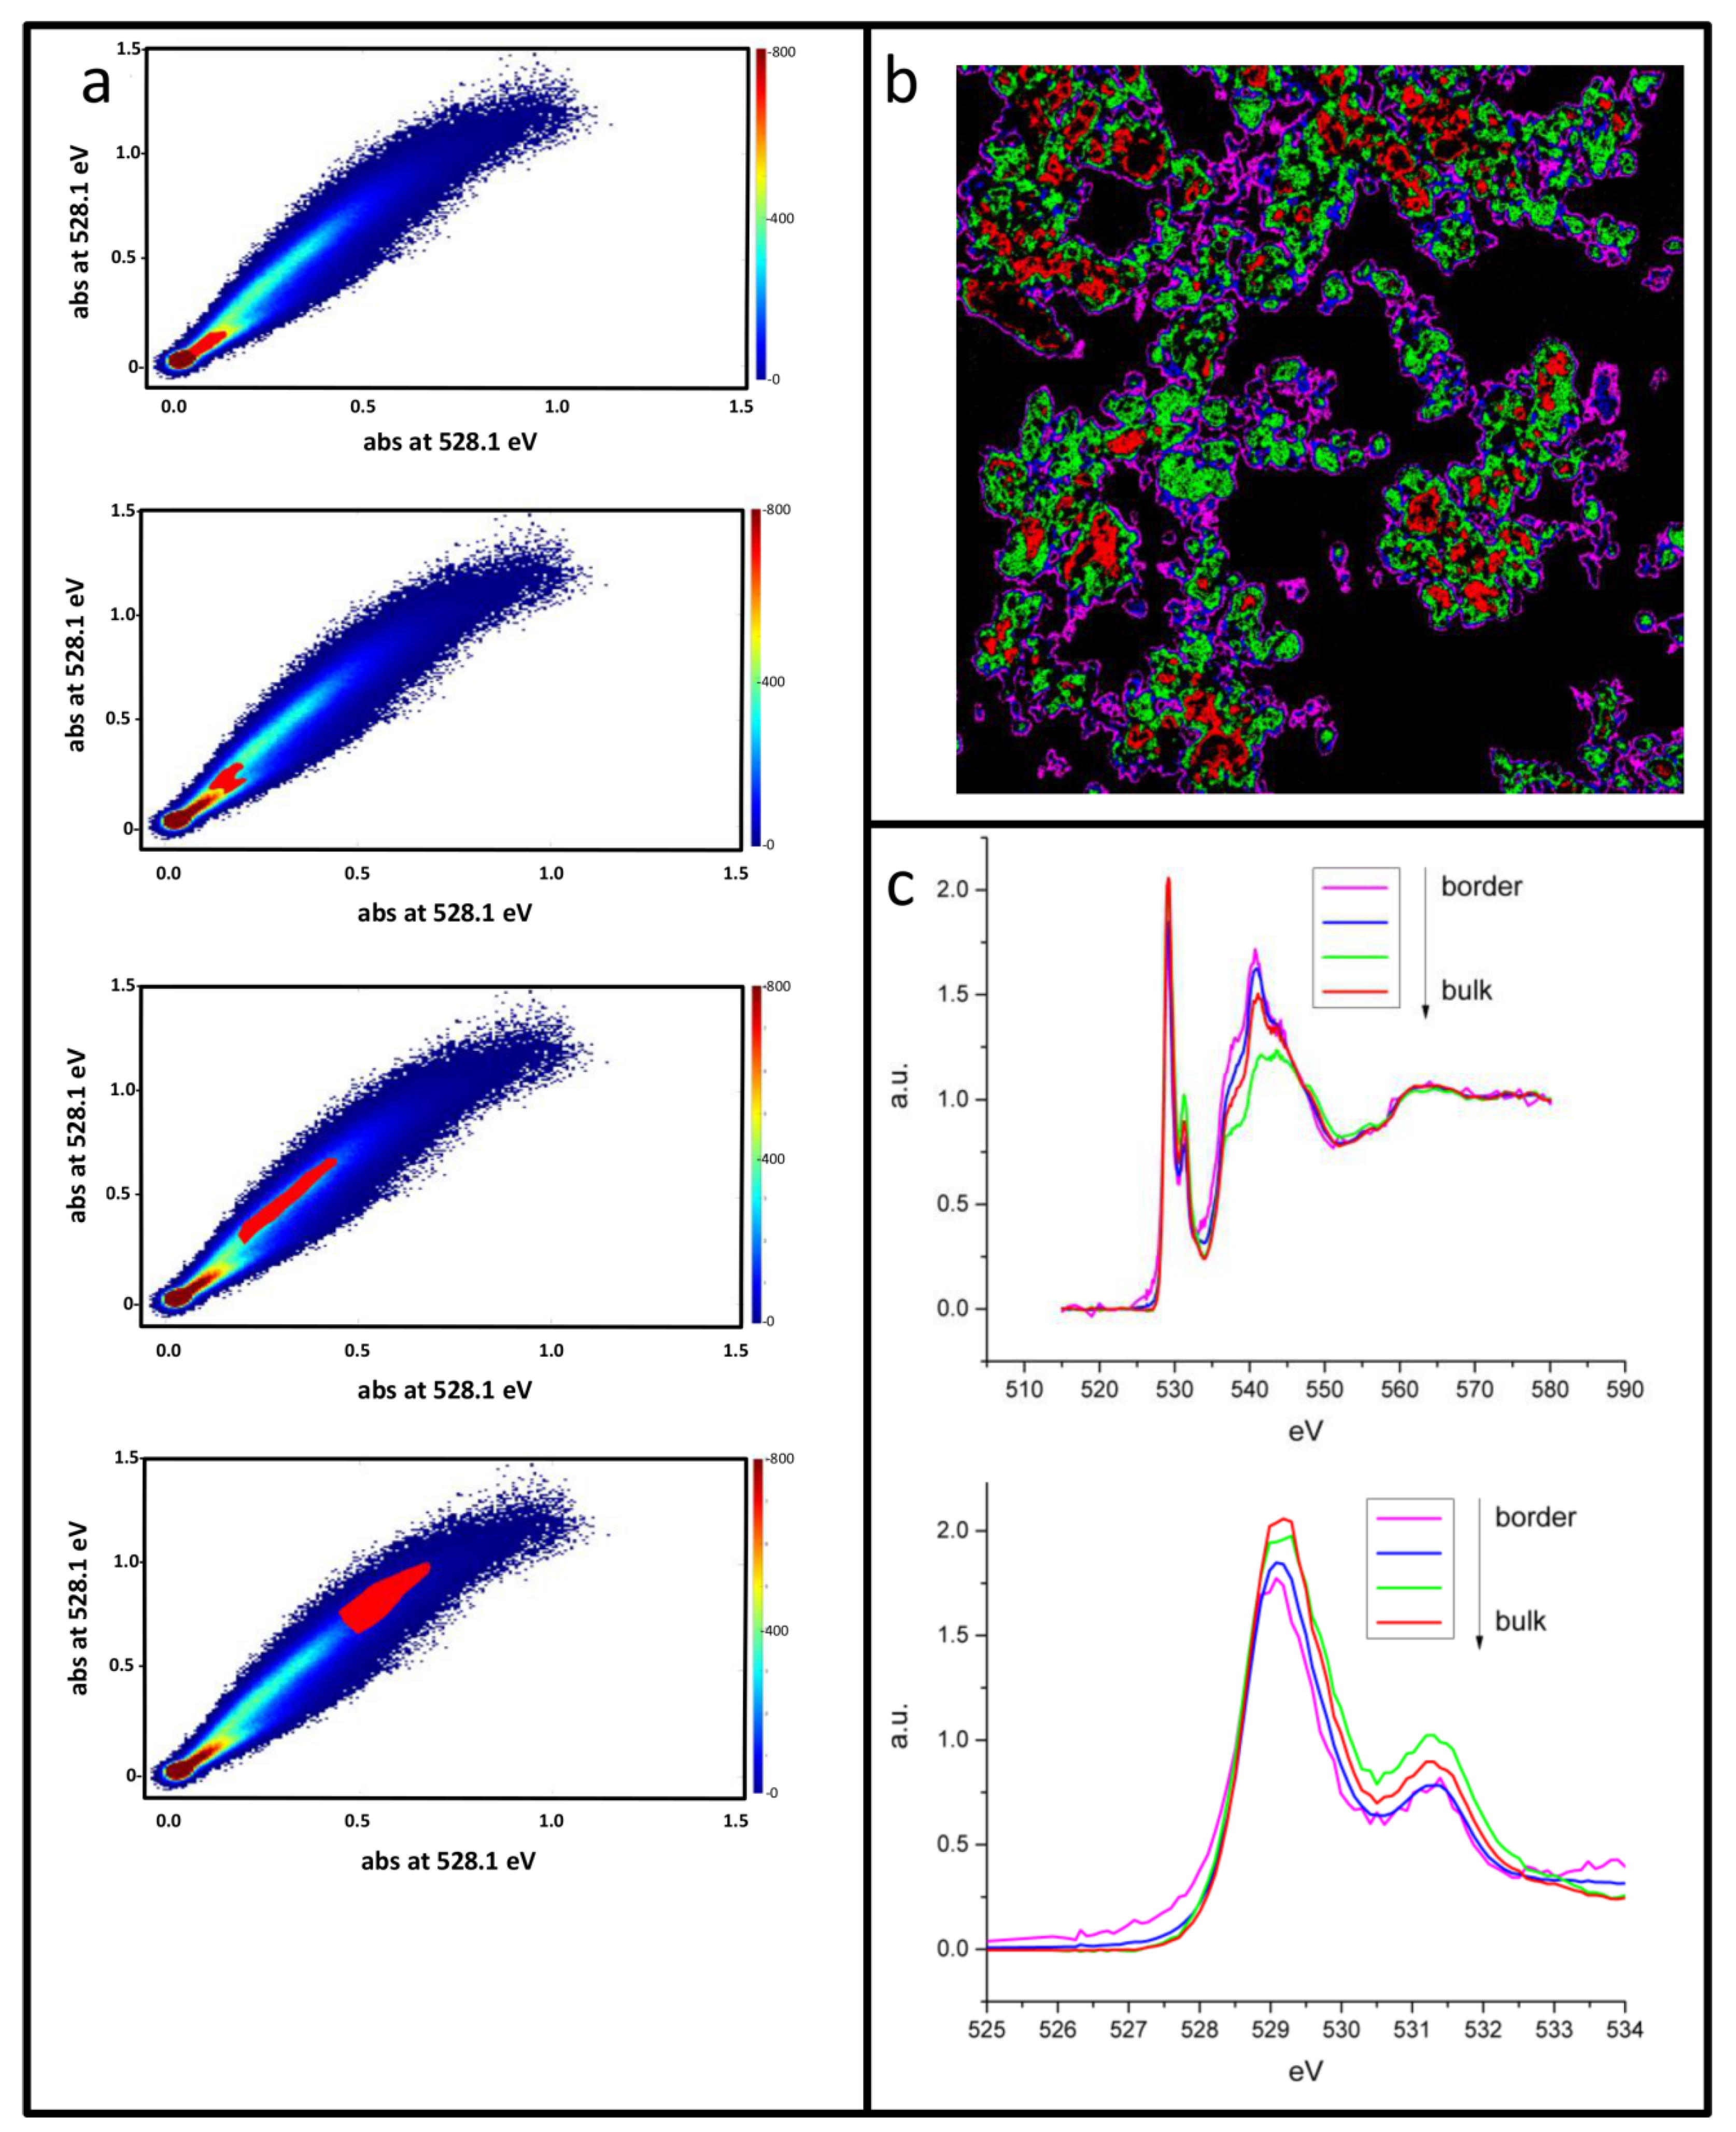
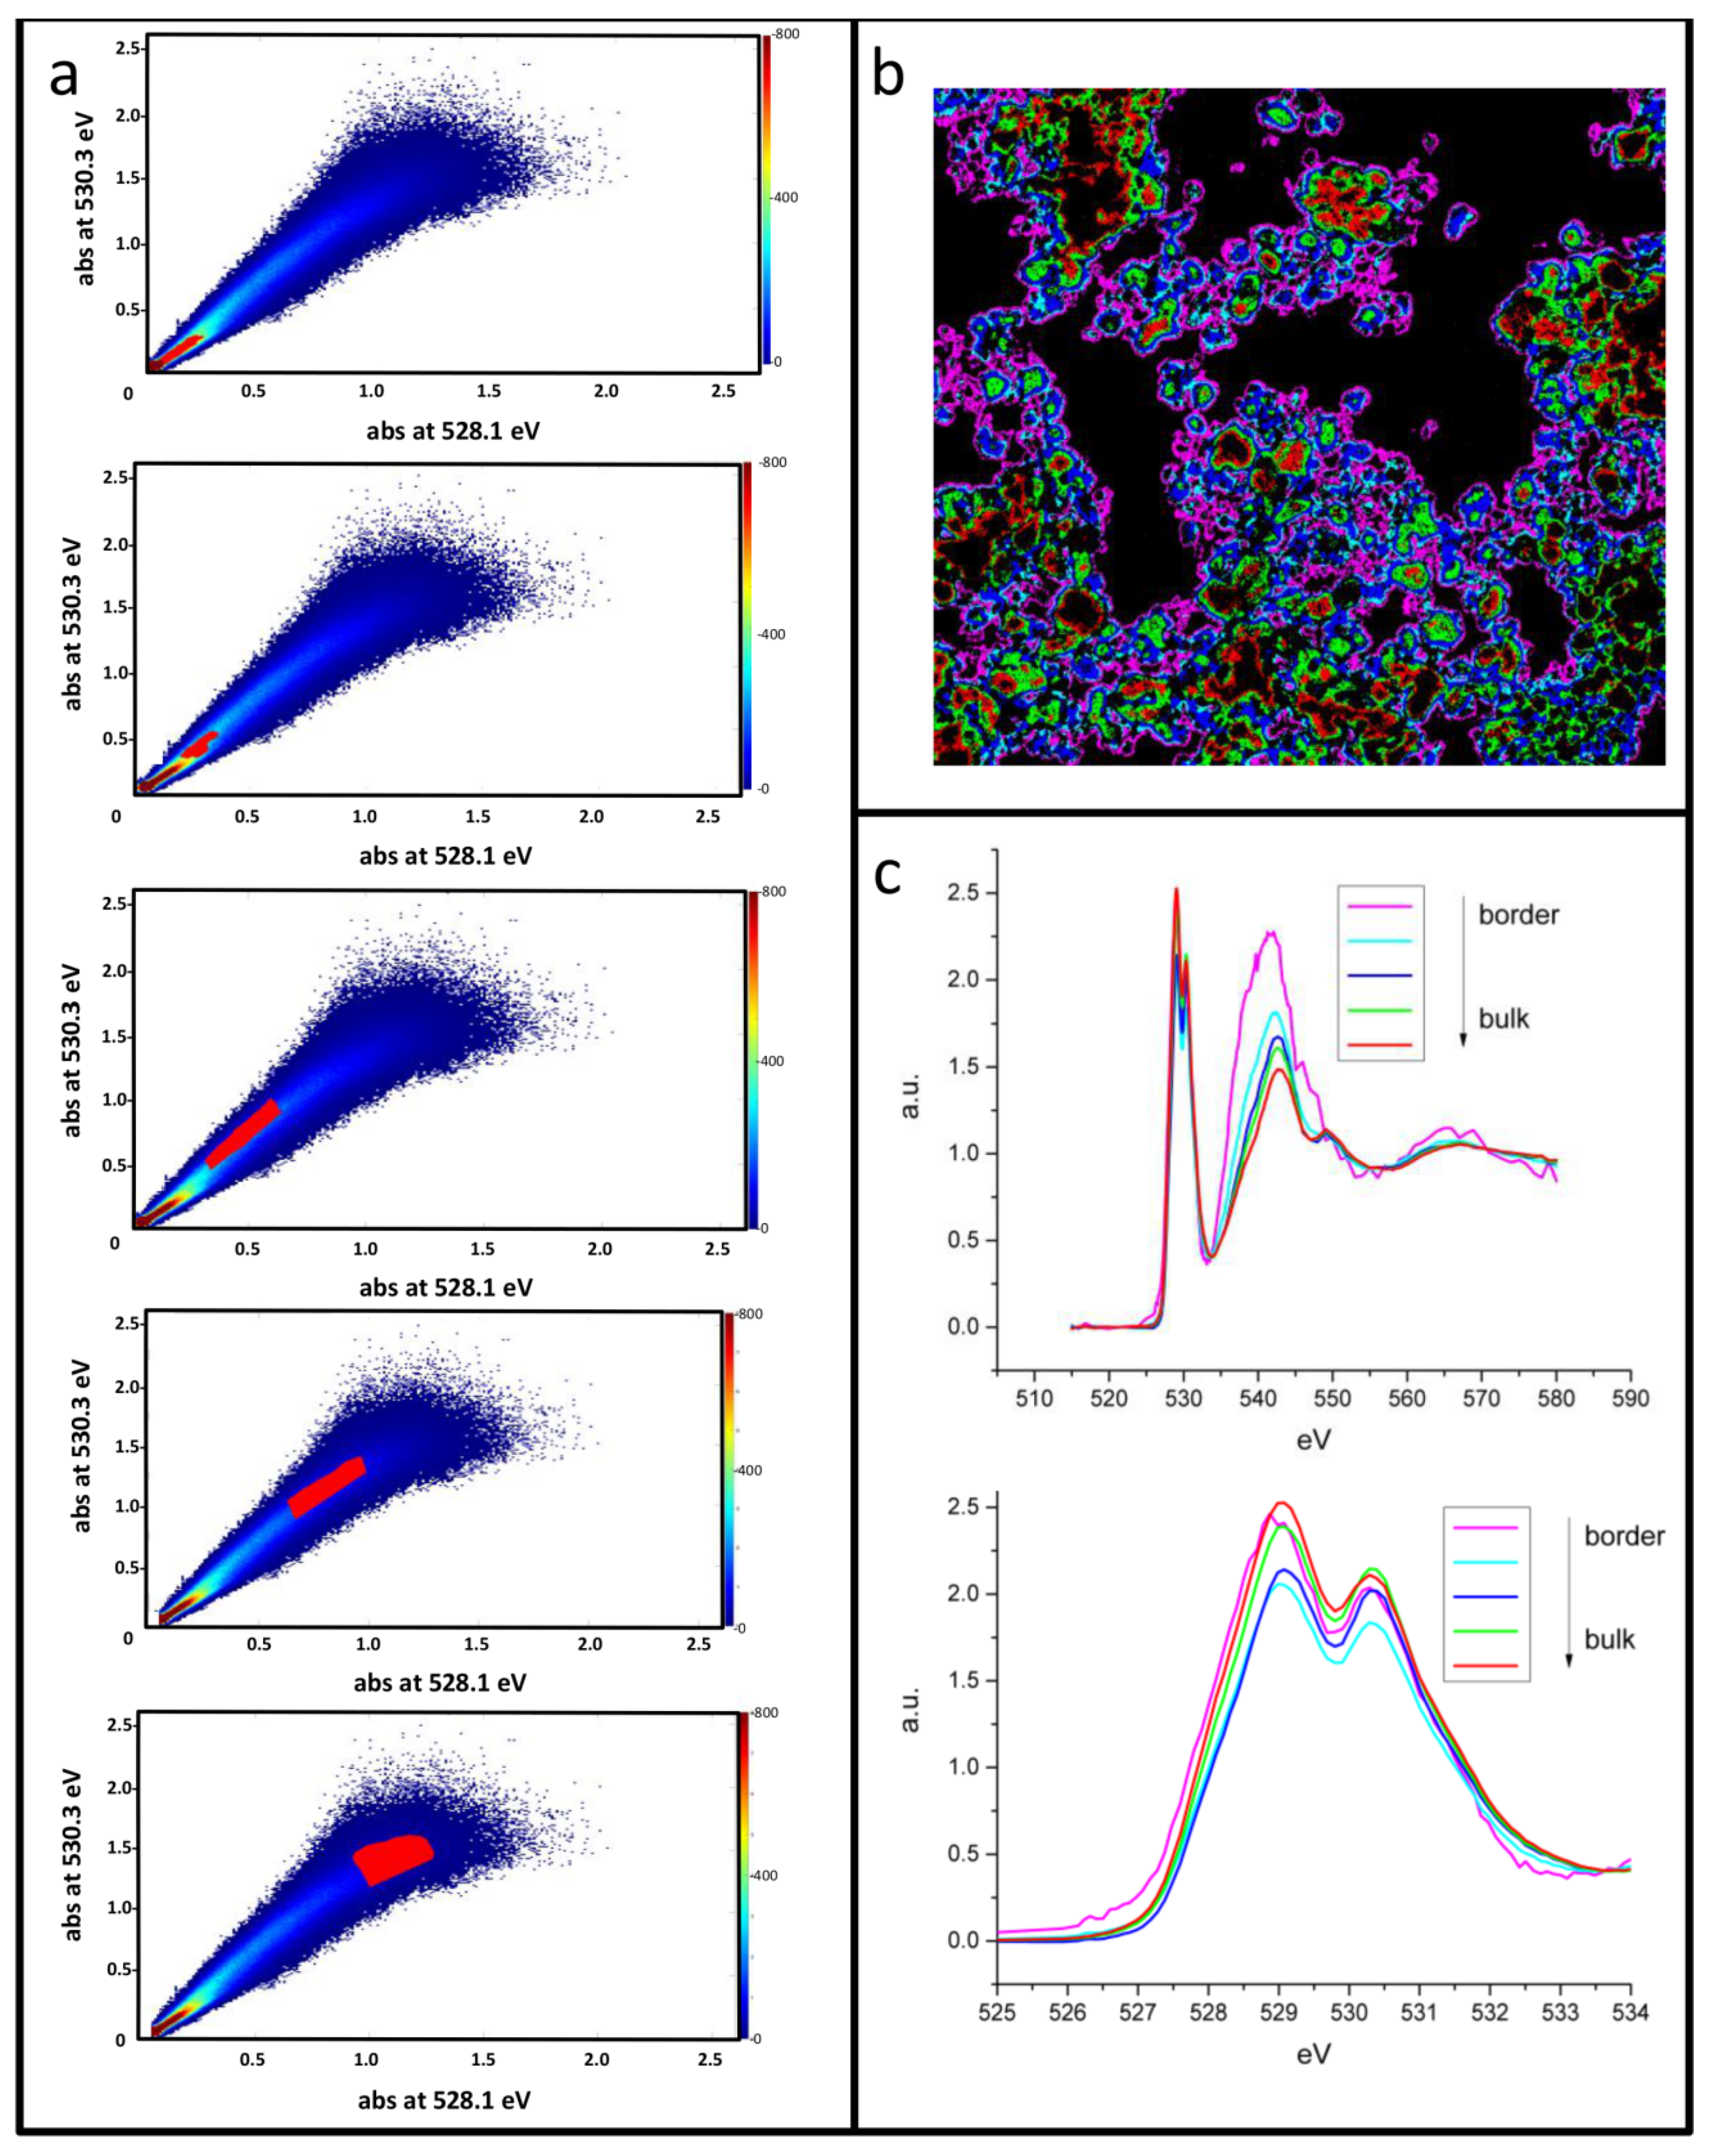
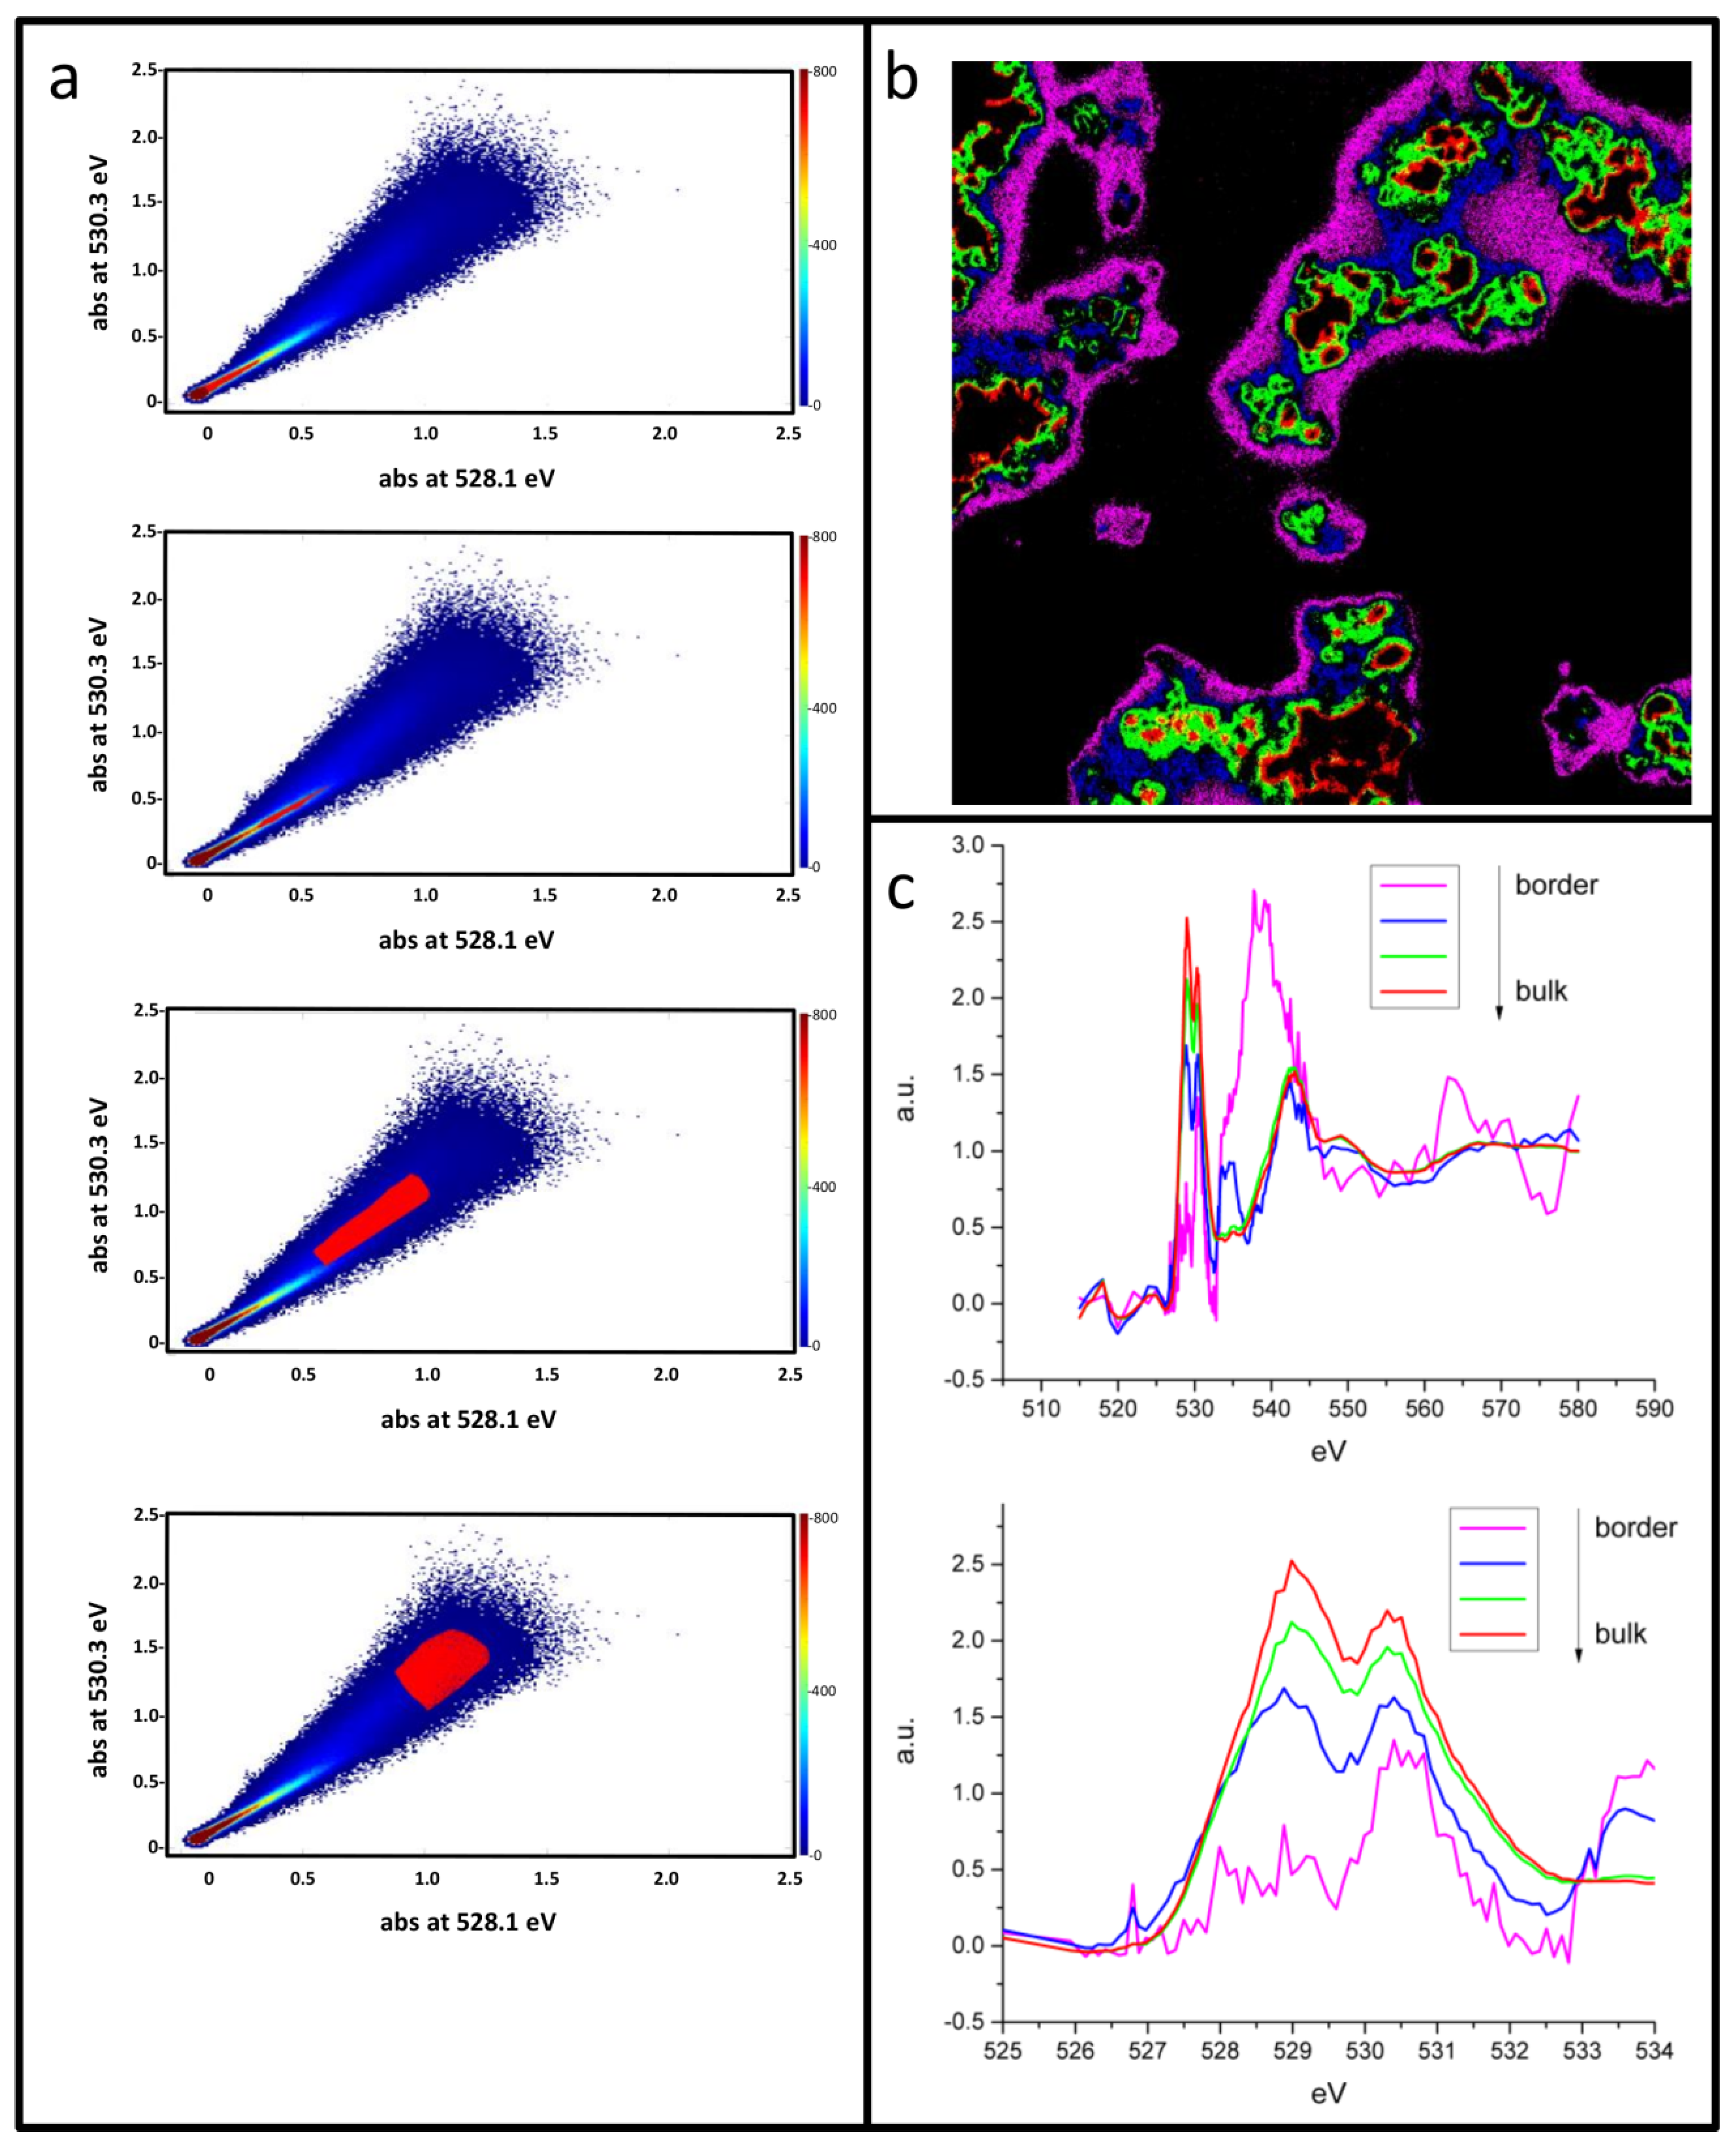
Alternatively, pixels selection on the phase map itself will allow the reproducible and automatic selection of pixels corresponding to a different thickness as reported for P01, P05 (uncoated), and P05VC (coated) measures in Figure 7, Figure 8 and Figure 9, respectively. Scatter representation of ratio between main spectral components C and A (a) is cut at zones of different thickness. The spatial localization of each zone is then represented in (b), with different colors, while in (c) the corresponding normalized spectra are shown, including a zoom on the prepeaks O-K edge region. With the previous method we compared spectral component ratios that indirectly reflect spectral changes but cannot detect possible local deviations from the general variants observed at a first inspection. In this case, we instead directly obtain average spectra that can be compared entirely. For P01 the progression of the concentric zones from border to bulk shows a slight shift towards higher energy but no significant change in the peak ratio. Instead, P05 has an evolution that more clearly demonstrates indications of Figure 4. Peak C is relatively low at the edge, increases in the intermediate zone, and then decreases again towards the bulk. The zone of component A (~528.0 eV) also reflects this less/more/less charged evolution, appearing more like a shoulder in the intermediate spectra, and in agreement with the correlation A vs. C suggested by Figure 5 above. The evolution at corresponding coated P05VC (Figure 9) instead suggests the highest accumulation of molecular oxygen at the edge, decreasing towards the bulk.

4. Discussion

In this report, we presented different strategies to analyze and represent data obtained from energy-dependent full-field transmission microscopy at the O-K edge on intercalation oxides. Given the substantial amount of stray light present in the MISTRAL microscope (above 7% of the incident light), it is important to apply a correction as the one explained in Appendix A and establish appropriate intervals of sufficient absorbance reliability if quantitative analysis is needed. This is particularly relevant with TM oxides, where the hybridization of metal d- and oxygen p- states generates strongly absorbing prepeaks that practically limit the observable thickness to a few hundred nm, easily surpassed by typical secondary particles of practical electrode materials. Nevertheless, in the present case a significant percentage of the field of view could be optimally imaged from LRNMC without the need for specific sample preparation. From differential images it is possible to filter off components such as background or nonactive material but not active material components as previously done with lithium and sodium oxides discharged on cathodes of aprotic metal air batteries [2,3]. In this case, the components do not appear as steps on an increasing absorption edge like a cumulative curve but are close to each other and localized in the preabsorption peak as shoulders or individual peaks. Without a proper deconvolution, the components are not strictly independent, but we use them for a qualitative rapid detection of spectral changes over the sample field of view. We presented here two alternative methods to make use of these components. In the first, their ratio (once the pre-edge background is subtracted from each of them) is mapped directly. If absorbance linearity is ensured the map is thickness-independent and is essentially sensitive to changes of the chemical environment. To ensure a linear distribution of points an arctangent function has been proposed, as detailed in Appendix B. This allows extracting unskewed representations of the chemical distributions, and widths between different combinations of components or different samples can be compared. In the second method, presented here for the first time, phase maps in the form of scatter plots directly represent one component vs. the other. Composition and thickness are disentangled, so that it is possible to recognize saturations, select specific thickness or composition ranges, and localize them on the field of view, so that full spectra can be extracted from those sample regions. It is important to remark that this selection method for regions of interest may bias the resulting spectrum, particularly in presence of random deviations from the average spectrum, as in the case of noisy, weak absorbing pixels. It is therefore always important to check that the selected regions of interest have meaningful shape.
By applying these methods on our sample set we could highlight a possible uneven distribution of trapped oxygen molecules in the primary particles, confirming recent suggestions [14] of oxygen release from a surface shell that is eventually densified and retains further oxygen escape. In addition, between these two regions we detect a layer of increased oxygen concentration that may represent a front of these molecules in face of the proposed surface barrier. These gradients are less evident with a VOx coating, which might be considered a confirmation of the improved retention capability of the coating. However, chemical distributions are more irregular and reversibility is actually poorer. This suggests that a fine control of the coating morphology is necessary to obtain a substantially improved reversibility and cycle life.

Author Contributions

Conceptualization, A.S. and D.T.; methodology, E.P., A.S., L.S. and D.T.; software, A.S. and D.T.; validation, L.S., M.G. and S.P.; formal analysis, A.S. and D.T.; investigation, A.S., N.L., A.B., A.M. and D.T.; resources, A.K., N.L., and A.B.; writing—original draft preparation, A.S. and D.T.; writing—review and editing, A.S., D.T., L.S. A.M., and M.G.; visualization, A.S. and D.T.; supervision, D.T., S.P., and M.G.; funding acquisition, D.T., S.P., and M.G. All authors have read and agreed to the published version of the manuscript.

Funding

This research was funded by Spanish Government, through the “Severo Ochoa” Programme for Centers of Excellence in R&D (FUNFUTURE CEX2019-000917-S), and the projects MAT2017-91404-EXP, RTI2018-096273-B-I00 and RTI2018-097753-B-I00 with FEDER cofunding. D.T. participates in the FLOWBAT 2021 platforms promoted by the Spanish National Research Council (CSIC). The HIU authors acknowledge the basic funding from the Helmholtz Association.

Institutional Review Board Statement

Not applicable.

Informed Consent Statement

Not applicable.

Data Availability Statement

The datasets generated during and/or analysed during the current study are available from the corresponding author on reasonable request.

Conflicts of Interest

The authors declare no conflict of interest.

Appendix A. Stray Light Correction

A transmission microscopy measurement consists in acquiring the incident intensity on sample I0 and the transmitted intensity I emerging from the sample on a two dimensional detector, typically a CCD camera. The transmission T at each pixel is then calculated as their ratio:
T ( x , y ) = I ( x , y ) I 0 ( x , y )
It is generally considered that a transmission measurement is quantitative because it can be directly related to the properties of the sample via the Beer–Lambert law [22,23]:
T ( x , y ,   E ) = I ( x , y , E ) I 0 ( x , y , E ) = e ( µ ( x , y , E ) d t ) = e ( σ ( x , y , E ) n ( x , y ) d t )
where μ is the linear absorption coefficient and the integral is extended over the sample thickness t . From Equation (A2) the absorbance for each pixel can be calculated from the measured transmission as
A ( x , y , E ) l n ( 10 ) = l n ( T ) = μ t = σ n t
where μ was rewritten as the product of the photoelectric absorption cross section σ and the number of atoms or molecules per unit volume n . Depending on the sample chemical composition, σ and therefore A will have peaks maxima around specific energy values, which can be predicted using various different theoretical approaches [24,25] and that allow in principle to define the sample chemical state with spatial resolution.
This information is available at MISTRAL, a state-of-the-art Fresnel Zone Plate (FZP) based full field transmission soft X-ray microscope installed at one of the bending magnet of the Alba Light Source [26], where the energy can be moved across the absorption edges of various interesting elements between 300 eV and 800 eV and chemical maps with a spatial resolution of few tents of nanometers can be obtained, both for biological and nonbiological samples [2,27,28,29]. The main limit of the technique is the small range of accessible sample thickness and concentration, due to the small X-ray penetration depths in the soft energy range and the resulting failure of the Beer–Lambert law. This limitation is even stronger if we consider the instrumental deviations from Equation (A2), due to the way the transmission is acquired in any real full field soft X-ray transmission microscope. Indeed, at each intensity acquisition, also an unknown background, originating mainly from the unused -1 order of the FZP lens [30] is acquired. In the following, we will use the base 10 both for the exponential and the logarithm operations. The measured transmission Tm and the measured absorbance Am taking the background B into account have to be rewritten as:
T m ( x , y ) = I ( x , y ) + B ( x , y ) I 0 ( x , y ) + B ( x , y ) T ( x , y )
A m ( x , y ) = log ( T ) A ( x , y )
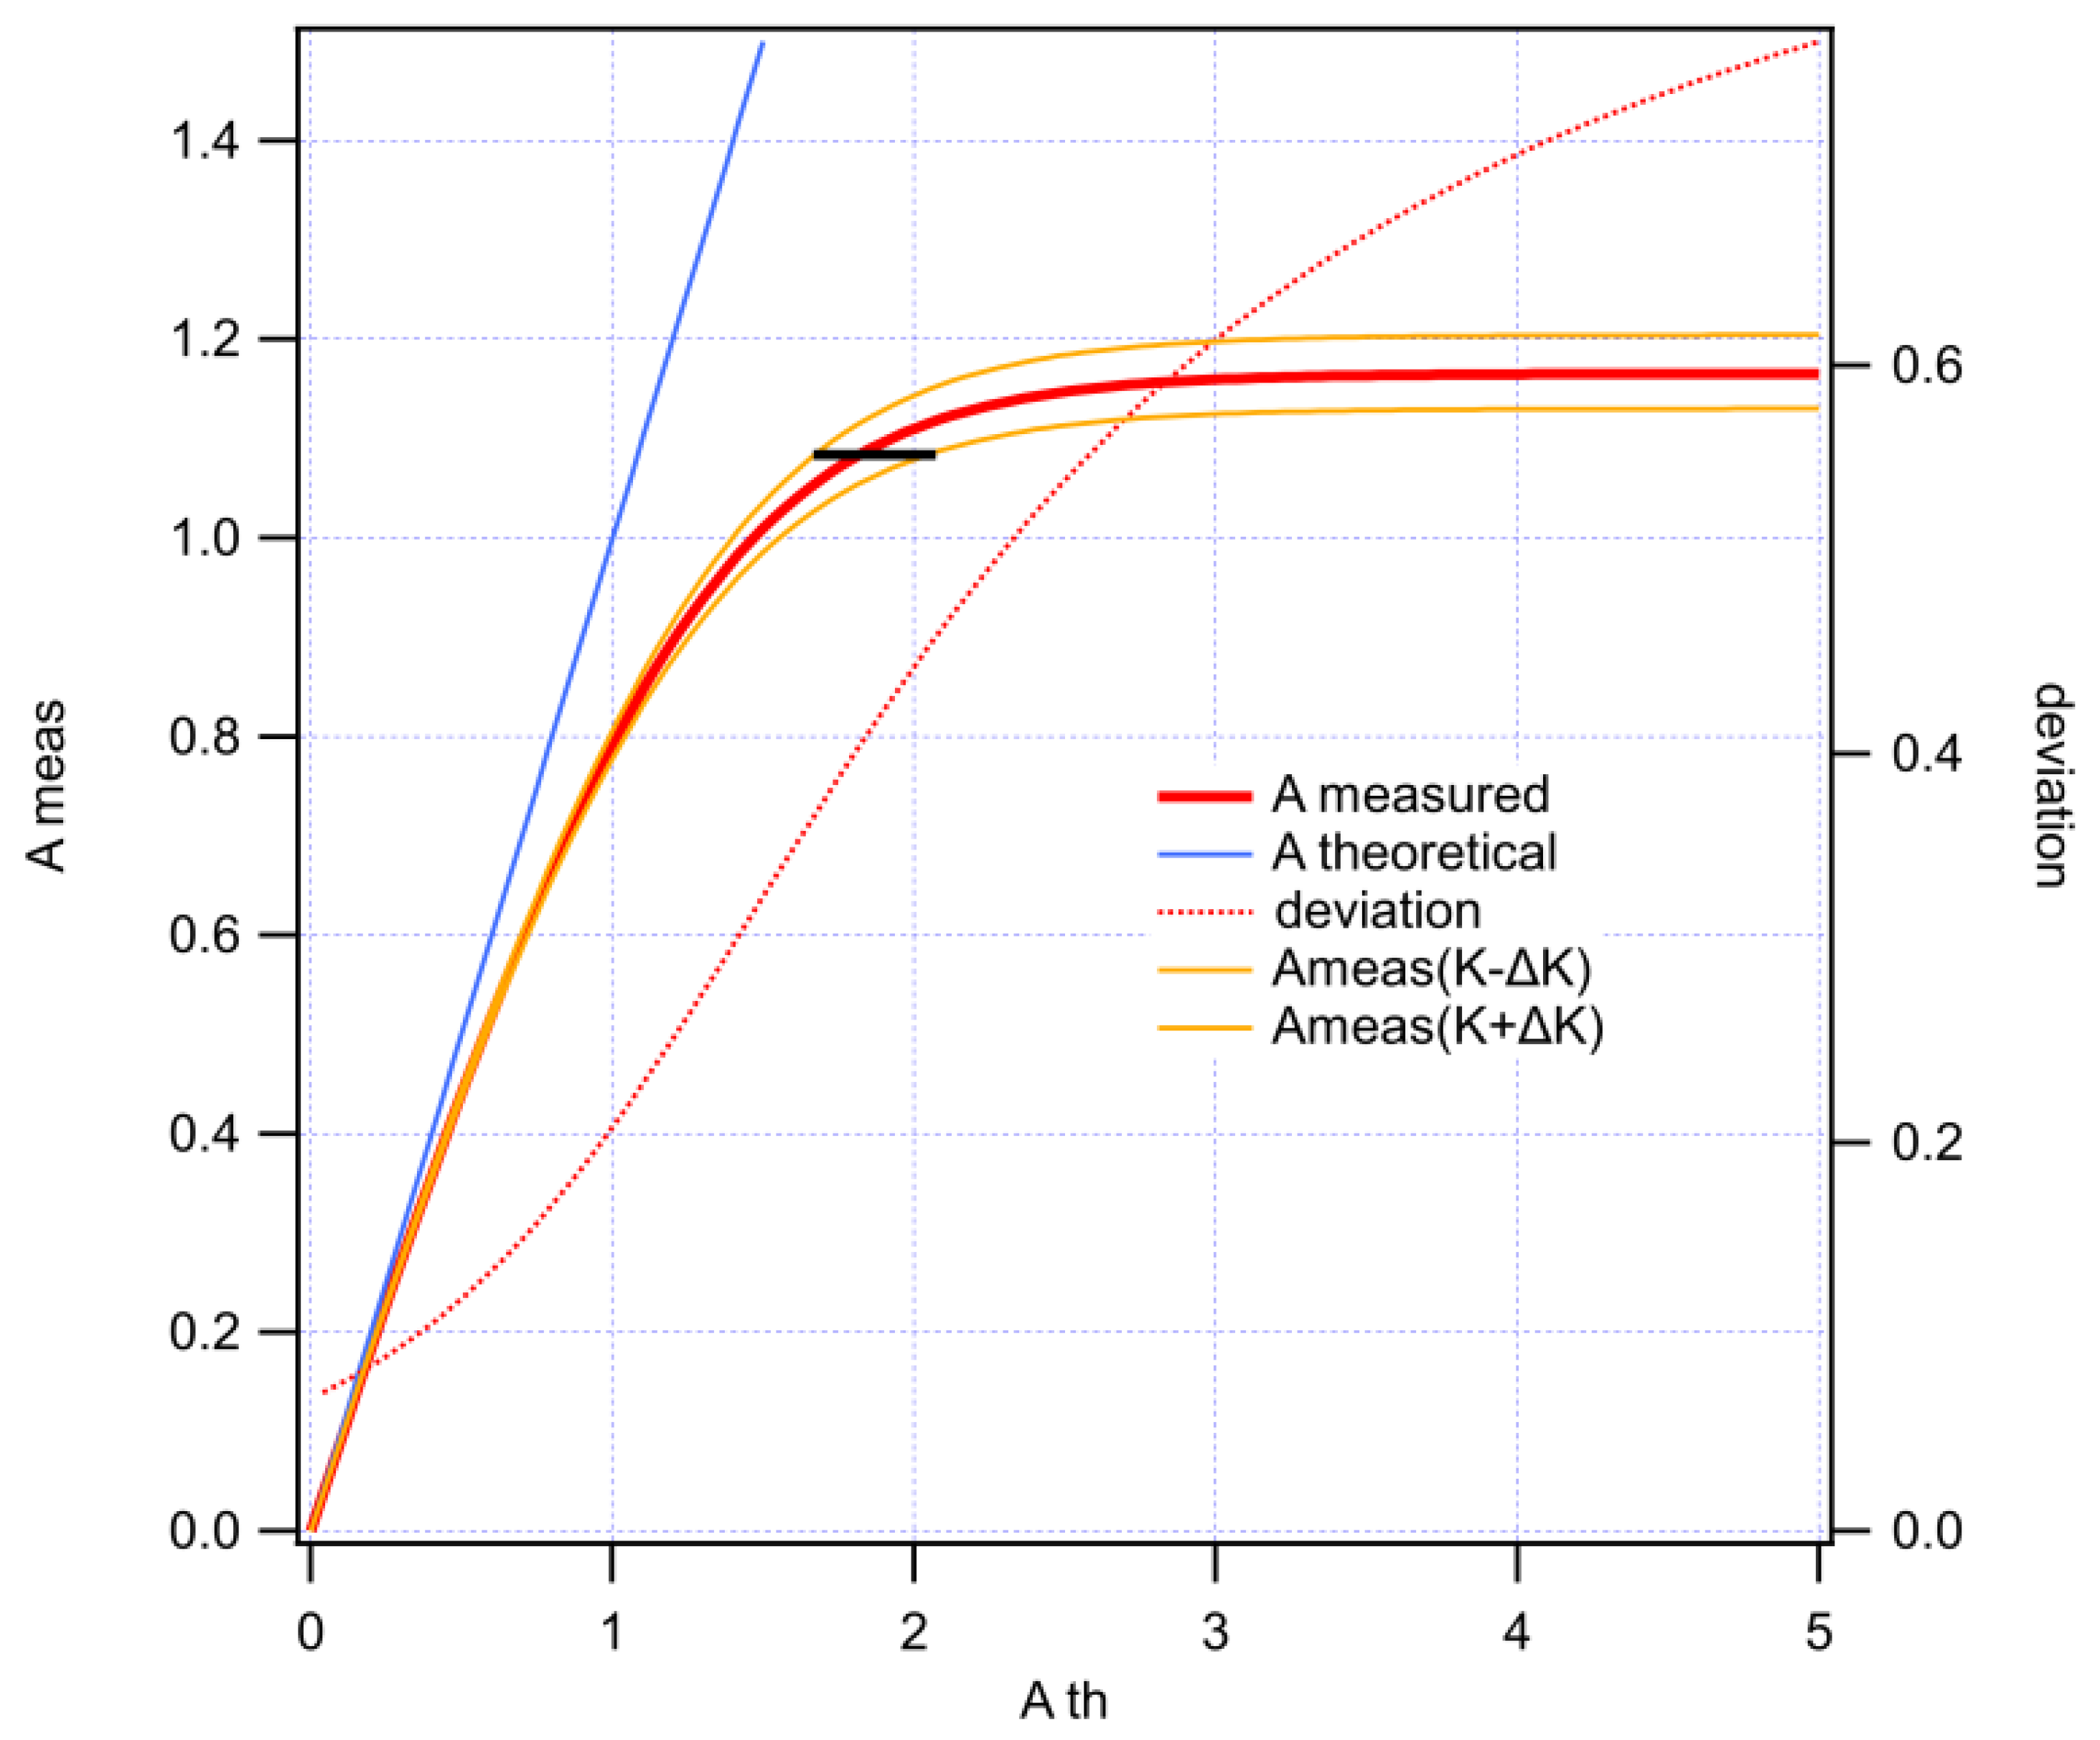
The presence of the background further limits the accessible range of thickness because only if it is fully negligible with respect to the measured intensities the validity of Equation (A1) is kept. If it is not the case, the spectral shape will appear distorted with essentially the high-intensity peaks appearing flattened [31] (see Figure A1). This could be a problem when quantitative estimation based on the spectral shape has to be performed. Here we focus on oxygen K-edge measurements realized on Li-rich cathodes particles at various states of charge and propose a method, based on some simplifications, that allow us to estimate the background in Equation (A4) and hence recover the real spectral shape A(E).
Figure A1. Calculated measured absorbance (red line) in the presence of a background equal to 7.3% of the incident intensity as a function of the ideal absorbance (i.e., K = 0, blue line). The underestimation increases for higher values of the absorbance, i.e., for smaller values of the transmitted intensity. The corresponding deviation (difference theoretical absorbance—measured absorbance) is reported as dot orange line. The variation of the measured absorbance using the maximum and minimum value of K within the error bar is also reported in yellow.
Applsci 11 02791 g0a1
Assuming a background proportional to the incident intensity:
B ( x , y ) = κ I 0
we can rewrite (4) as:
T m ( x , y ) = I ( x , y ) + B ( x , y ) I 0 ( x , y ) + B ( x , y ) = T ( x , y ) + κ 1 + κ
In a reference sample, i.e., a sample with a known absorption spectrum, in absence of effects related to the beam polarization and the crystals orientations [32], the absorption has to be the same everywhere except for a constant factor depending on the thickness (see Equation (A1)):
T m t h i c k ( x , y ) T t h i n ( x , y )   ;   A m t h i c k ( x , y ) A t h i n ( x , y )
Let us rewrite then Equation (A5) explicitly for a thick region on the reference sample:
T m t h i c k ( x , y ) = T t h i c k ( x , y ) + κ 1 + κ = c × T t h i n ( x , y ) + κ 1 + κ
In a thin region I ( x , y ) B ( x , y ) and therefore     A t h i n ( x , y )   A m t h i n ( x , y ) . This allows us to write:
A m t h i c k = l o g ( T m t h i c k ) = l o g ( c × 10 A t h i n ( x , y ) + κ 1 + κ ) l o g ( c × 10 A m t h i n ( x , y ) + κ 1 + κ )
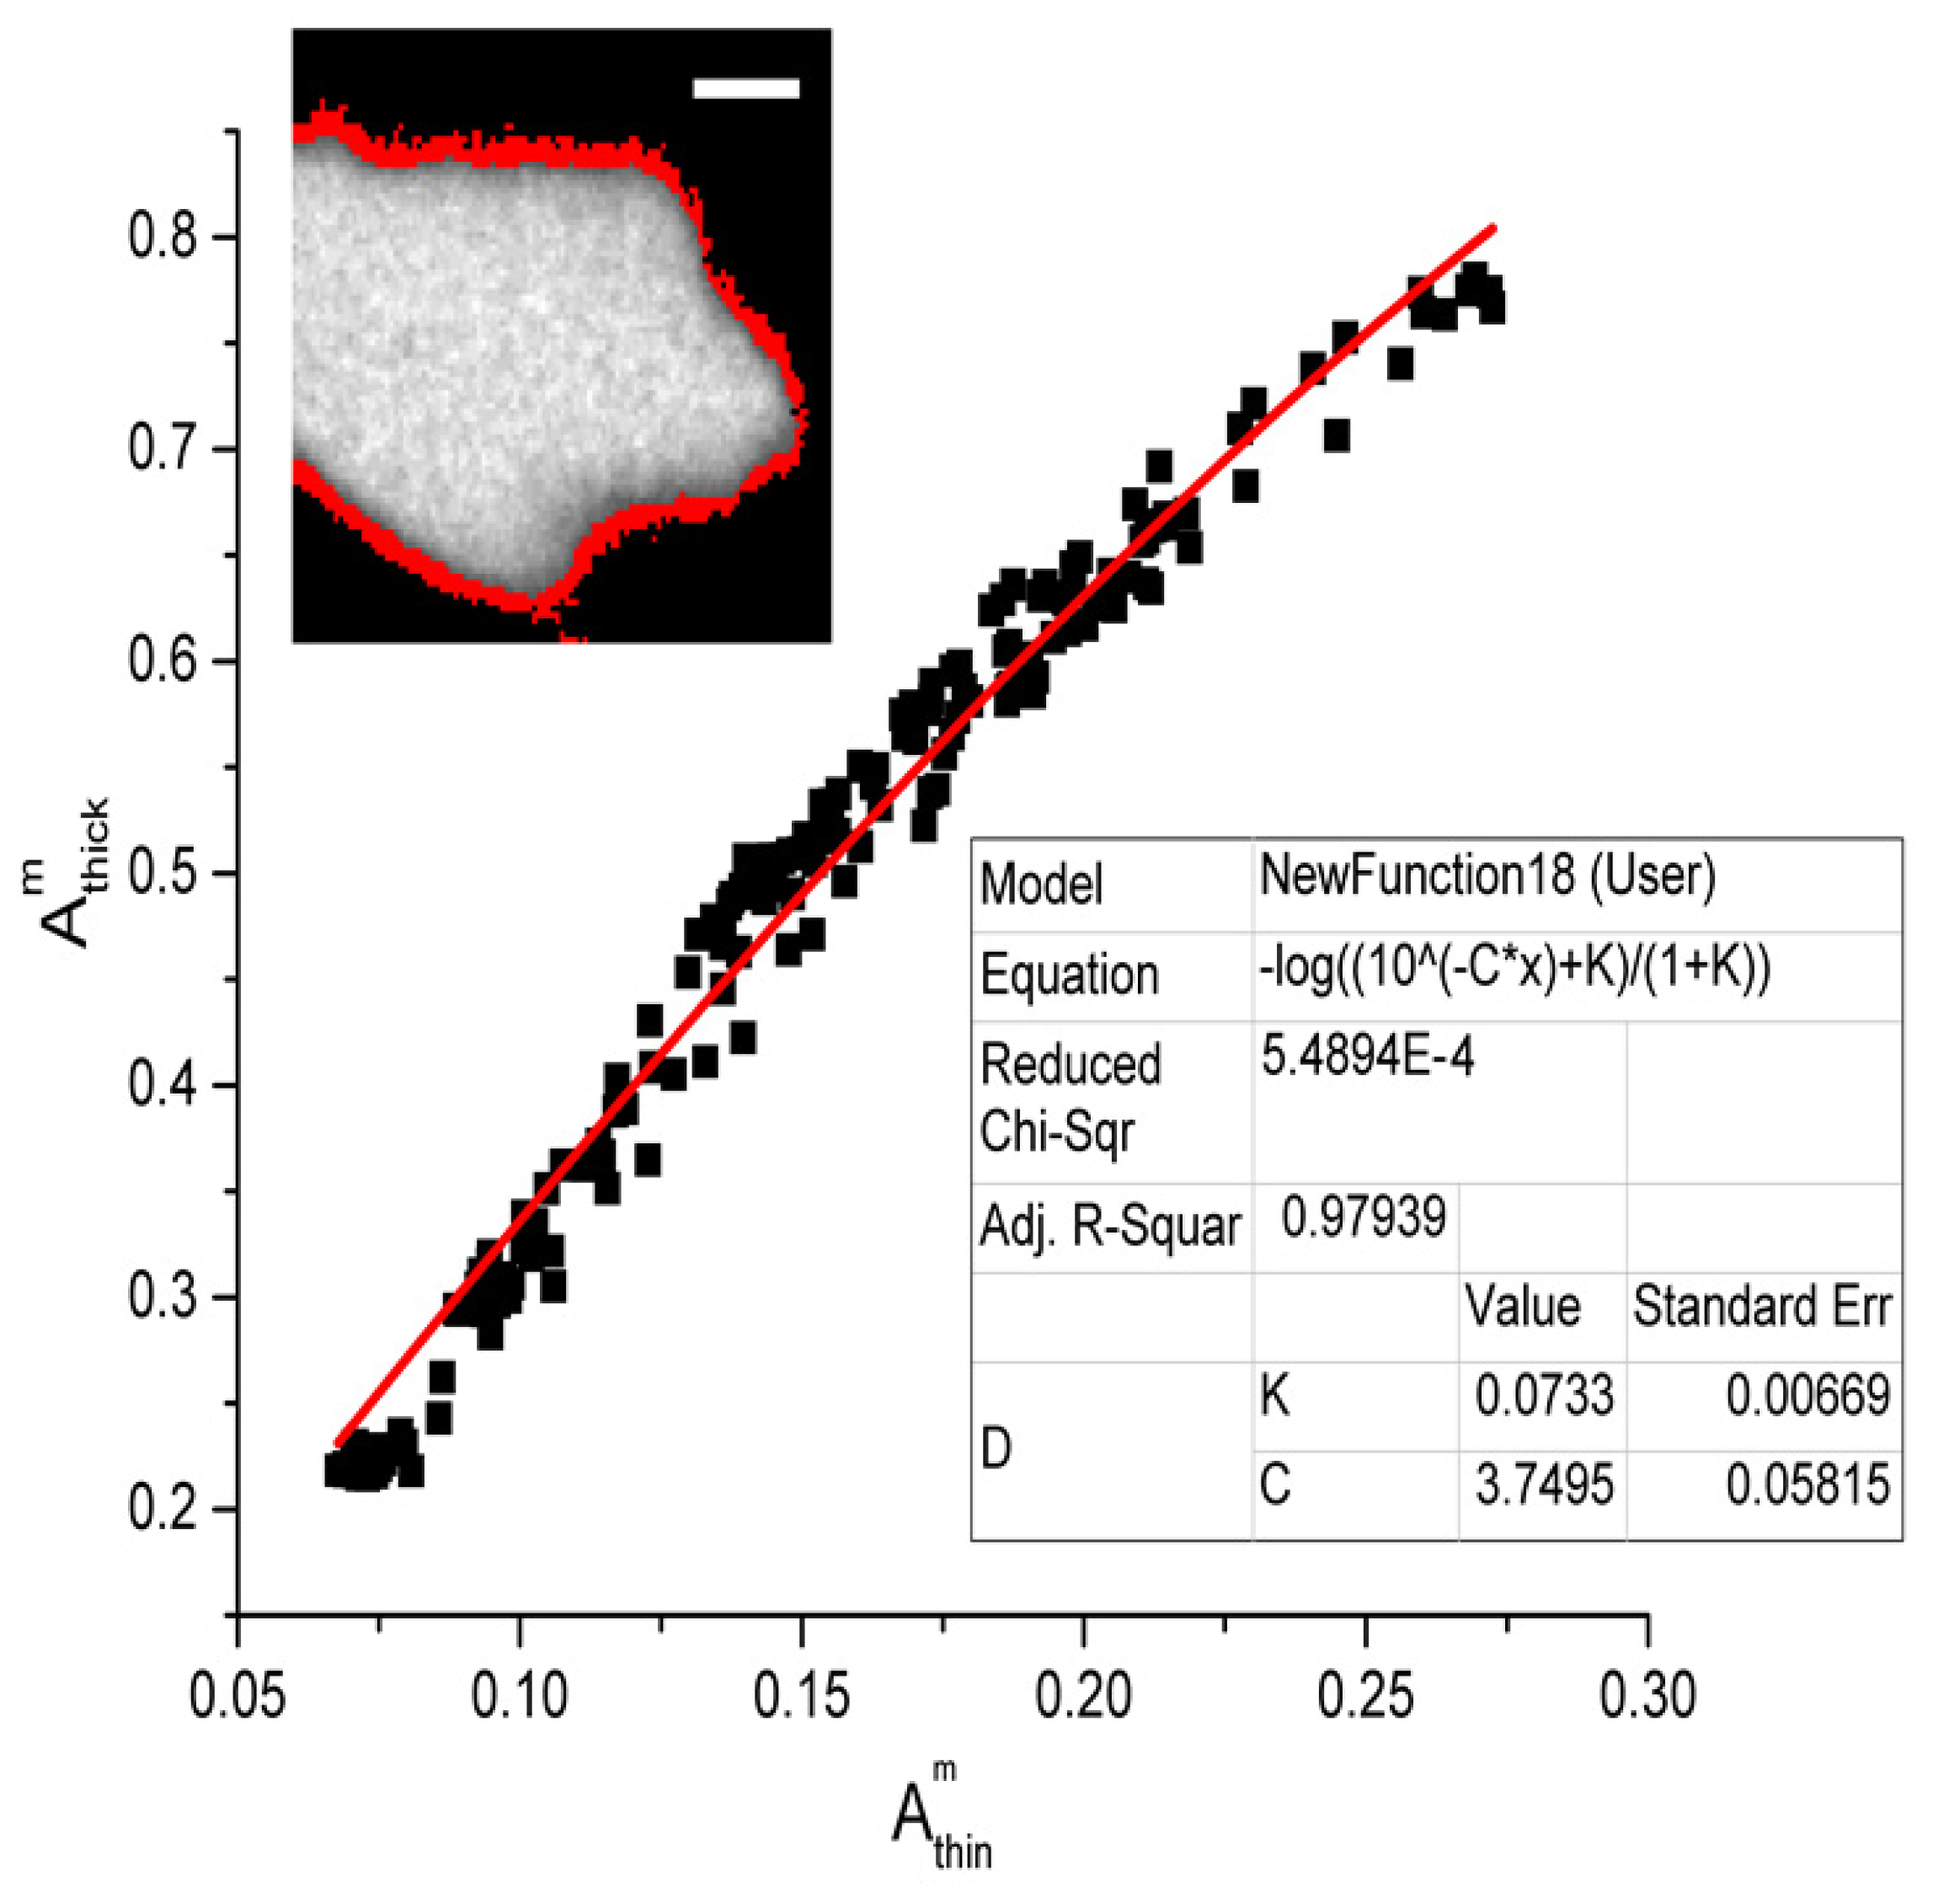
Measuring the absorbance both in a thick and in a thin region of a reference sample we can then estimate the two parameters c and κ fitting A m t h i c k as a function of A m t h i n . This has been done on a MnO2 reference sample particle. The fit and its result are reported in Figure A2. In the inset, the selected MnO2 particle with the thin region in red is also reported. The thin region of the particle was selected using a measured absorbance threshold <0.43 on the maximum absorbance peak (≈529.1 eV). At this value of the measured absorbance (0.43), the deviation with respect to the theoretical one was assumed to be small enough to be neglected (see Figure A2).
Figure A2. Measured thick absorbance as a function of the measured thin absorbance. The fitted curve is shown with a red line. Fit parameters and corresponding results are also reported. In the inset in the upper right corner, the MnO2 particle from which the absorbances were extracted is shown with the thin region in red. The scale bar is 200 nm.
Applsci 11 02791 g0a2
Following this simple model, the background in the measured intensities is about 7.3% the incident intensity on the sample. Using this estimation, we have corrected all the measures reported in this work. The comparison of the phase map with and without background correction is reported in Figure A3 for P05 data. The absorbance peak value at ~530.3 eV versus the one at ~528.1 eV is plotted using a color-coded scale to represent the corresponding density of points in different regions of the plot. It is clear that the background correction redistributes the plot values along an almost straight line and expands towards bigger values the accessible measurable absorbance, as expected. Looking at Figure A3, we could speculate that if the linearity between the two components is maintained up to absorbance ~1 without the background correction, this linearity is maintained at least up absorbance ~1.5 after the correction is applied. It is easy to verify that this corresponds to expanding the accessible thickness by 30%.
Figure A3. Effect of the background correction on the phase map for P05 data where the absorbance peak value at ~530.3 eV versus the one at ~528.1 eV is plotted. (a) Phase map for the noncorrected spectrum and (b) for the background corrected one. In (b) plot values are redistributed on an almost straight line and on a bigger absorbance values range.
Applsci 11 02791 g0a3

Appendix B. Ratio Correction

When representing the correlation between two values that are assumed proportional, such as two components of spectra from the same compound in different thicknesses, the simple ratio between these two components has a complex distribution [33] with skewed shape. This can be understood graphically in Figure A4a, because A/C can be represented as the projection of the data point on the vertical line of the Cartesian diagram at unity x value. The projection of a normally scattered distribution will result skewed. If we instead project the points on the unit circumference, the distribution will retain its Gaussian shape. An example of this simple transformation is shown in Figure A4b, comparing the histograms of A/C and of atan(A/C) ratio maps. Symmetry has significantly improved after applying the arctangent to the ratio. In this way, a real compositional heterogeneity will be easier to appreciate in the distribution.
Figure A4. (a) Visual comparison between the use of the simple ratio A/C between components A and C, with its arctangent, atan(A/C). The radial projection is linear on the circumference and distorted on its tangential line that represents the A/C ratio; (b) comparison of the histogram of the A/C and atan(A/C) for P04.
Applsci 11 02791 g0a4

References

  1. Tonti, D.; Olivares-Marín, M.; Sorrentino, A.; Pereiro, E. Studies of Lithium-Oxygen Battery Electrodes by Energy- Dependent Full-Field Transmission Soft X-ray Microscopy. In X-ray Characterization of Nanostructured Energy Materials by Synchrotron Radiation; Petaccia, L., Ed.; IntechOpen: London, UK, 2017. [Google Scholar]
  2. Olivares-Marin, M.; Sorrentino, A.; Lee, R.C.; Pereiro, E.; Wu, N.L.; Tonti, D. Spatial Distributions of Discharged Products of Lithium-Oxygen Batteries Revealed by Synchrotron X-ray Transmission Microscopy. Nano Lett. 2015, 15, 6932–6938. [Google Scholar] [CrossRef]
  3. Olivares-Marín, M.; Sorrentino, A.; Pereiro, E.; Tonti, D. Discharge products of ionic liquid-based Li-O2 batteries observed by energy dependent soft X-ray transmission microscopy. J. Power Sources 2017, 359, 234–241. [Google Scholar] [CrossRef]
  4. Landa-Medrano, I.; Olivares-Marín, M.; Bergner, B.; Pinedo, R.; Sorrentino, A.; Pereiro, E.; Ruiz De Larramendi, I.; Janek, J.; Rojo, T.; Tonti, D. Potassium Salts as Electrolyte Additives in Lithium-Oxygen Batteries. J. Phys. Chem. C 2017, 121, 3822–3829. [Google Scholar] [CrossRef] [Green Version]
  5. Landa-Medrano, I.; Sorrentino, A.; Stievano, L.; Ruiz de Larramendi, I.; Pereiro, E.; Lezama, L.; Rojo, T.; Tonti, D. Architecture of Na-O2 battery deposits revealed by transmission X-ray microscopy. Nano Energy 2017, 37, 224–231. [Google Scholar] [CrossRef]
  6. Sathiya, M.; Rousse, G.; Ramesha, K.; Laisa, C.P.; Vezin, H.; Sougrati, M.T.; Doublet, M.L.; Foix, D.; Gonbeau, D.; Walker, W.; et al. Reversible anionic redox chemistry in high-capacity layered-oxide electrodes. Nat Mater 2013, 12, 827–835. [Google Scholar] [CrossRef] [PubMed]
  7. McCalla, E.; Sougrati, M.T.; Rousse, G.; Berg, E.J.; Abakumov, A.; Recham, N.; Ramesha, K.; Sathiya, M.; Dominko, R.; Van Tendeloo, G.; et al. Understanding the Roles of Anionic Redox and Oxygen Release during Electrochemical Cycling of Lithium-Rich Layered Li4FeSbO6. J. Am. Chem. Soc. 2015, 137, 4804–4814. [Google Scholar] [CrossRef] [PubMed]
  8. Assat, G.; Delacourt, C.; Corte, D.A.D.; Tarascon, J.M. Practical assessment of anionic redox in Li-rich layered oxide cathodes: A mixed blessing for high energy Li-ion batteries. J. Electrochem. Soc. 2016, 163, A2965–A2976. [Google Scholar] [CrossRef]
  9. Grimaud, A.; Hong, W.T.; Shao-Horn, Y.; Tarascon, J.M. Anionic redox processes for electrochemical devices. Nat. Mater. 2016, 15, 121–126. [Google Scholar] [CrossRef]
  10. Seo, D.H.; Lee, J.; Urban, A.; Malik, R.; Kang, S.; Ceder, G. The structural and chemical origin of the oxygen redox activity in layered and cation-disordered Li-excess cathode materials. Nat. Chem. 2016, 8, 692–697. [Google Scholar] [CrossRef]
  11. Luo, K.; Roberts, M.R.; Guerrini, N.; Tapia-Ruiz, N.; Hao, R.; Massel, F.; Pickup, D.M.; Ramos, S.; Liu, Y.S.; Guo, J.; et al. Anion Redox Chemistry in the Cobalt Free 3d Transition Metal Oxide Intercalation Electrode Li[Li0.2Ni0.2Mn0.6]O2. J. Am. Chem. Soc. 2016, 138, 11211–11218. [Google Scholar] [CrossRef] [Green Version]
  12. Ben Yahia, M.; Vergnet, J.; Saubanère, M.; Doublet, M.L. Unified picture of anionic redox in Li/Na-ion batteries. Nat. Mater. 2019, 18, 496–502. [Google Scholar] [CrossRef] [Green Version]
  13. House, R.A.; Maitra, U.; Pérez-Osorio, M.A.; Lozano, J.G.; Jin, L.; Somerville, J.W.; Duda, L.C.; Nag, A.; Walters, A.; Zhou, K.J.; et al. Superstructure control of first-cycle voltage hysteresis in oxygen-redox cathodes. Nature 2020, 577, 502–508. [Google Scholar] [CrossRef] [PubMed]
  14. House, R.A.; Rees, G.J.; Pérez-Osorio, M.A.; Marie, J.J.; Boivin, E.; Robertson, A.W.; Nag, A.; Garcia-Fernandez, M.; Zhou, K.J.; Bruce, P.G. First-cycle voltage hysteresis in Li-rich 3d cathodes associated with molecular O2 trapped in the bulk. Nat. Energy 2020, 5, 777–785. [Google Scholar] [CrossRef]
  15. Eum, D.; Kim, B.; Kim, S.J.; Park, H.; Wu, J.; Cho, S.P.; Yoon, G.; Lee, M.H.; Jung, S.K.; Yang, W.; et al. Voltage decay and redox asymmetry mitigation by reversible cation migration in lithium-rich layered oxide electrodes. Nat. Mater. 2020, 19, 419–427. [Google Scholar] [CrossRef] [Green Version]
  16. Kleiner, K.; Strehle, B.; Baker, A.R.; Day, S.J.; Tang, C.C.; Buchberger, I.; Chesneau, F.F.; Gasteiger, H.A.; Piana, M. Origin of High Capacity and Poor Cycling Stability of Li-Rich Layered Oxides: A Long-Duration in Situ Synchrotron Powder Diffraction Study. Chem. Mater. 2018, 30, 3656–3667. [Google Scholar] [CrossRef]
  17. Simonelli, L.; Sorrentino, A.; Marini, C.; Ramanan, N.; Heinis, D.; Olszewski, W.; Mullaliu, A.; Birrozzi, A.; Laszczynski, N.; Giorgetti, M.; et al. Role of Manganese in Lithium- and Manganese-Rich Layered Oxides Cathodes. J. Phys. Chem. Lett. 2019, 10, 3359–3368. [Google Scholar] [CrossRef]
  18. Ali, S.E.; Olszewski, W.; Sorrentino, A.; Marini, C.; Kazzazi, A.; Laszczynski, N.; Birrozzi, A.; Mullaliu, A.; Passerini, S.; Tonti, D.; et al. Local Interactions Governing the Performances of Lithium- and Manganese-Rich Cathodes. J. Phys. Chem. Lett. 2021, 1195–1201. [Google Scholar] [CrossRef] [PubMed]
  19. Buchholz, D.; Li, J.; Passerini, S.; Aquilanti, G.; Wang, D.; Giorgetti, M. X-ray Absorption Spectroscopy Investigation of Lithium-Rich, Cobalt-Poor Layered-Oxide Cathode Material with High Capacity. ChemElectroChem 2015, 2, 85–97. [Google Scholar] [CrossRef]
  20. Laszczynski, N.; von Zamory, J.; Kalhoff, J.; Loeffler, N.; Chakravadhanula, V.S.K.; Passerini, S. Improved Performance of VOx-Coated Li-Rich NMC Electrodes. ChemElectroChem 2015, 2, 1768–1773. [Google Scholar] [CrossRef]
  21. Ruckman, M.W.; Chen, J.; Qiu, S.L.; Kuiper, P.; Strongin, M.; Dunlap, B.I. Interpreting the near edges of O2 and O2- in alkali-metal superoxides. Phys. Rev. Lett. 1991, 67, 2533–2536. [Google Scholar] [CrossRef]
  22. Beer, A. Bestimmung der Absorption des rothen Lichts in farbigen Flüssigkeiten. Ann. Phys. 1852, 162, 78–88. [Google Scholar] [CrossRef] [Green Version]
  23. Agarwal, B.K. X-ray Spectroscopy, 2nd ed.; Springer Series in Optical Sciences; Springer: Berlin/Heidelberg, Germany, 1991; ISBN 978-3540507192. [Google Scholar]
  24. de Groot, F.; Kotani, A. Core Level Spectroscopy of Solids; Springer: Berlin, Germany, 2008; ISBN 9781420008425. [Google Scholar]
  25. Stöhr, J. NEXAFS Spectroscopy; Springer: Berlin/Heidelberg, Germany, 1992; Volume 25, ISBN 9783540544227. [Google Scholar]
  26. Sorrentino, A.; Nicolás, J.; Valcárcel, R.; Chichón, F.J.; Rosanes, M.; Avila, J.; Tkachuk, A.; Irwin, J.; Ferrer, S.; Pereiro, E. MISTRAL: A transmission soft X-ray microscopy beamline for cryo nano-tomography of biological samples and magnetic domains imaging. J. Synchrotron Radiat. 2015, 22, 1112–1117. [Google Scholar] [CrossRef]
  27. Kahil, K.; Varsano, N.; Sorrentino, A.; Pereiro, E.; Rez, P.; Weiner, S.; Addadi, L. Cellular pathways of calcium transport and concentration toward mineral formation in sea urchin larvae. Proc. Natl. Acad. Sci. USA 2020, 117, 30957–30965. [Google Scholar] [CrossRef]
  28. Sviben, S.; Gal, A.; Hood, M.A.; Bertinetti, L.; Politi, Y.; Bennet, M.; Krishnamoorthy, P.; Schertel, A.; Wirth, R.; Sorrentino, A.; et al. A vacuole-like compartment concentrates a disordered calcium phase in a key coccolithophorid alga. Nat. Commun. 2016, 7. [Google Scholar] [CrossRef]
  29. Gal, A.; Sorrentino, A.; Kahil, K.; Pereiro, E.; Faivre, D.; Scheffel, A. Native-state imaging of calcifying and noncalcifying microalgae reveals similarities in their calcium storage organelles. Proc. Natl. Acad. Sci. USA 2018, 115, 11000–11005. [Google Scholar] [CrossRef] [PubMed] [Green Version]
  30. Bertilson, M.; von Hofsten, O.; Hertz, H.M.; Vogt, U. Numerical model for tomographic image formation in transmission X-ray microscopy. Opt. Express 2011, 19, 11578–11583. [Google Scholar] [CrossRef] [PubMed]
  31. Frati, F.; Hunault, M.O.J.Y.; De Groot, F.M.F. Oxygen K-edge X-ray Absorption Spectra. Chem. Rev. 2020, 120, 4056–4110. [Google Scholar] [CrossRef] [PubMed] [Green Version]
  32. DeVol, R.T.; Metzler, R.A.; Kabalah-Amitai, L.; Pokroy, B.; Politi, Y.; Gal, A.; Addadi, L.; Weiner, S.; Fernandez-Martinez, A.; Demichelis, R.; et al. Oxygen spectroscopy and polarization-dependent imaging contrast (PIC)-mapping of calcium carbonate minerals and biominerals. J. Phys. Chem. B 2014, 118, 8449–8457. [Google Scholar] [CrossRef] [PubMed]
  33. Hinkley, D.V. On the ratio of two correlated normal random variables. Biometrika 1969, 56, 635–639. [Google Scholar] [CrossRef]
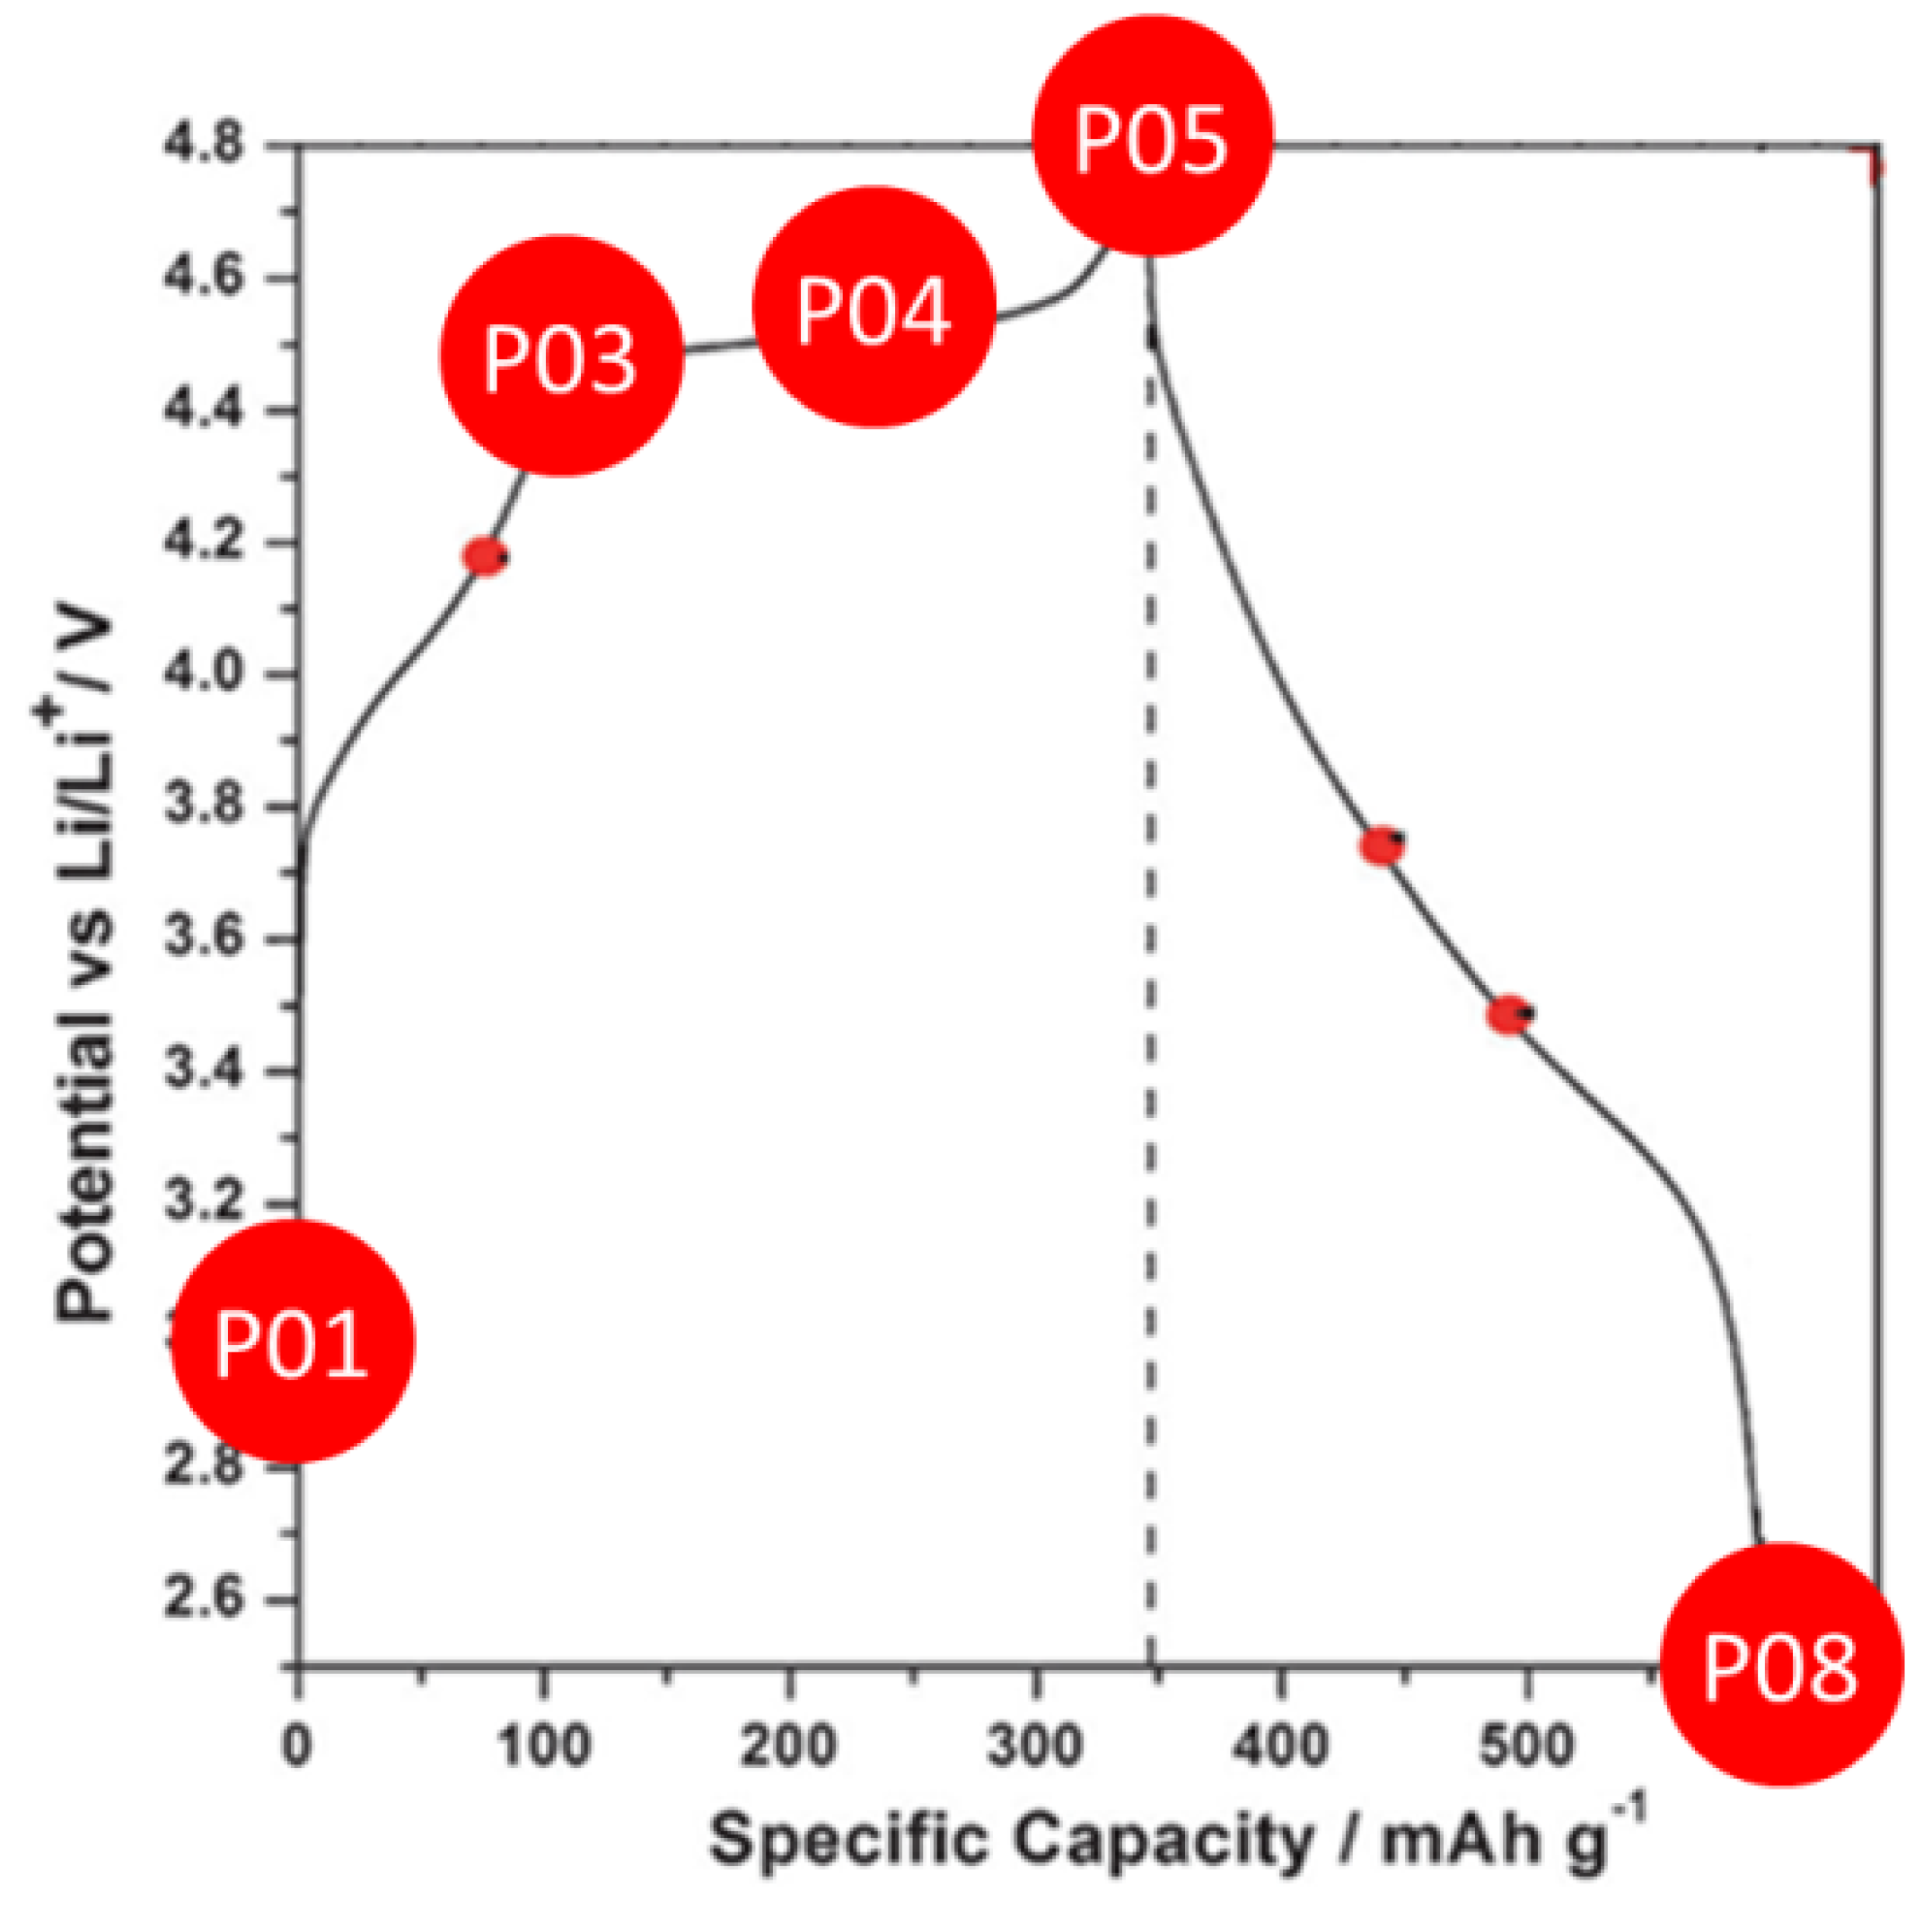
Figure 1. Labeling of the set of samples used in this study, represented as charge points in the corresponding galvanostatic charge-discharge cycle. Each point corresponds to an uncoated sample (e.g., P01) and a VOx-coated one (e.g., P01VC).
Applsci 11 02791 g001
Figure 2. Normalized O-K spectra obtained from the average intensity of valid pixels in the field of view. Coated and noncoated samples of the same point of charge have been grouped to favor comparison. Vertical blue bars mark the position of the three components A, B, C considered in our analysis, while the “O2” labels denote the position of the main features of molecular oxygen according to Ruckman et al. [21]. Note that the O2 π* feature overlaps with component C.
Applsci 11 02791 g002
Figure 3. Images obtained from the pristine Vanadium-coated sample. (a) absorbance map averaged in the O-K pre-edge energy range (526.3–527.2 eV); (b) absorbance map averaged in the O-K prepeak energy range (C peak region, 530.3–530.1 eV); (c) composite image with following channels: red (a), and yellow (difference b-a); (d) composite image from the V-L region (516.8–525.9 eV), green channel, and (b), yellow channel. The background from the pre-edge has been subtracted from both oxide and vanadium components. Insets in (c,d) show a detail at increased magnification.
Applsci 11 02791 g003
Figure 4. Distributions of C vs. B components, represented as arctan(C/B), in the O-K absorption of (a) 2D-maps; (b) corresponding area-normalized histograms. Regions of high absorbance have been masked in black to avoid consideration of possible artifacts. Insets in P04 show a detail at increased magnification.
Applsci 11 02791 g004
Figure 5. Distributions of A vs. C components, represented as arctan(C/B), in the O-K absorption of the studied sample set: (a) 2D-maps; (b) corresponding area-normalized histograms. Regions of high absorbance have been masked in black to avoid consideration of possible artifacts.
Applsci 11 02791 g005
Figure 6. (a) Phase map where the absorbance peak value at ~530.3 eV versus the absorbance pre-edge values (~522.9 eV) is plotted. Two populations of pixels with different oxygen abundance with respect to the total material thickness are clearly distributed on two lines with different slopes. The selection of the pixels on the smaller slope line corresponding to lack of oxygen or abundance of carbon is shown in red in (b) and the corresponding distribution in the field of view is reported in pink in (c). The scale bar corresponds to 1 μm.
Applsci 11 02791 g006
Figure 7. Data extracted at the O-K edge of the pristine Li1.2Mn0.56Ni0.16Co0.08O2 electrode material (P01): (a) Scatter representation of ratio between main spectral components C and A (at 530.3 eV and 528.1 eV), each point representing a pixel with a specific ratio value. Because of the great number of pixels (≈106) the density of point is reported using different colors. Using the scatter plot, different ratios can be systematically selected in the field of view. Their spatial localization is then represented in (b), while in (c) the corresponding normalized spectra are reported, including a zoom on the prepeaks O-K edge region is shown with clear different peak intensities features.
Applsci 11 02791 g007
Figure 8. Same as Figure 7 on the fully charged Li1.2Mn0.56Ni0.16Co0.08O2 electrode material (P05).
Applsci 11 02791 g008
Figure 9. Same as Figure 7 on the fully charged VOx-coated Li1.2Mn0.56Ni0.16Co0.08O2 electrode material (P05VC).
Applsci 11 02791 g009
Publisher’s Note: MDPI stays neutral with regard to jurisdictional claims in published maps and institutional affiliations.