Abstract
The study takes into account different classes of tunnel boring machines (TBM), with the aim of identifying correlation models which are meant to estimate, at a preliminary design phase, the construction time of a tunnel and to evaluate the mechanical and operational parameters of the TBMs, starting from the knowledge of the tunnel length and the excavation diameter. To achieve this goal, first of all a database was created, thanks to the collection of the most meaningful technical parameters from a large number of tunnels; afterwards, it was statistically analyzed through Microsoft Excel. In a first phase, forecasting models were identified for the three types of machines investigated, separately for compact rocks (open TBM) and fractured rocks (single and double shield TBM). Then, the mechanical parameters collected through the database were analyzed, with the aim of obtaining models that take into account, in addition to the type of TBM, the geological aspect and the type of rock characterizing the rock mass. Finally, the validation of the study was proposed in a real case, represented by the Moncenisio base tunnel, a work included in the new Turin–Lyon connection line. The estimated values were compared with the real ones, in order to verify the accuracy of the experimental models identified.
1. Introduction
It is known that hard rock excavation by means of tunnel boring machines (TBM) brings many benefits in terms of productivity and safety, but at the same time the tunnel geometry is limited to a circular shape [1], so the method is more appropriate for projects with constant shapes [2]; moreover, it is not recommended for tunnels shorter than 1 km, as the installation times would be of the same order of magnitude as the excavation times [3,4].
TBMs are classified into large families based on the type of material being excavated. Open TBMs are suitable for hard and compact rocks, single shield machines offer more protection in fractured rock [5,6] while the double shields generally allow a higher advancement speed compared to the single shield.
Regardless of the kind of machine, it is crucial for tunnelling stockholders to predict the performance of the excavation. This issue has been addressed differently by many authors. Empirical and analytical models aimed to predict both the cutting depth of the tools and their wear have been studied by [7,8,9,10,11,12,13,14,15,16,17,18,19,20,21,22,23].
Together with the aforementioned studies, three important research schools have drawn the attention of the scientific community to their prediction models, capable of successfully predicting the penetration rate (mm/rev) considering both the parameters of the machine and those of the rock. More in details, pertaining to the machine, total thrust [N], thrust/tool (which depends on cutter diameter), cutterhead diameter, cutter geometry, spacing between tools, and tools numbers are required while, as for the rock parameters, the uniaxial compressive strength (UCS), Brazilian tensile strength (BTS), and drilling rate index (DRI) are needed.
The contribution of the Turkish school (Istanbul Technical University) in this field is very relevant [24,25,26,27,28]; take into account the presence of discontinuities to better describe the properties of the rock mass. The authors investigated in depth the influence of joint orientation, spacing, and persistence on the extent of tool penetration and wear.
The Norwegian University of Science and Technology (NTNU) prediction model for hard rock TBMs combines rock boreability properties and TBM parameters in order to determine the main factors influencing the penetration rate predictions [29]. Predictions of advancement rate, cutter wear, and excavation costs are also achieved using the NTNU model. The first version of the model was proposed by [30], and it has been continuously updated with parameters derived from new projects.
The analytical model proposed by the Colorado School of Mines (CSM) is able to predict excavation performance based on a “full-scale” laboratory test, i.e., the so-called linear cutting test. The conditions of the rock–tool interaction during excavation by TBM are well reconstructed with this test, which allows to estimate the cutting force, the normal force and the tangential force acting on a disk that performs linear paths on a rock specimen with dimensions 1 × 1 × 0.6 m. For a given case study, the test is commonly repeated several times, evaluating different spacing and penetrations. The first version of the model was developed in 1977 [31,32] and was later revised [33,34,35]. The input parameters are both geotechnical and TBM parameters; based on the physical model coming from the laboratory, a penetration value p (mm/rev) can be assumed and, since the tool radius R (mm) is known, the contact angle is settled, which defines the rock region affected by the stress related to the interaction with the tool. Once this value is known, the tool contact pressure is calculated and the thrust/tool Ft (kN/tool) is assessed. The main goal of the CSM model is to estimate the total thrust, the torque and the power of the TBM; these values are then compared with the machine design parameters; through iterative calculation, assuming each time a different value of p, the maximum penetration p achievable in a given rock mass with a given TBM can be evaluated.
All the references above belong to research that can differ from each other, but that are commonly based on a direct approach to the problem (information about the productivity of the machine is provided taking into account the parameters of both the machine and the rock). However, it is worth mentioning another type of approach, which could be defined indirect, capable of deriving predictive models based on the statistical analysis of real excavation cases [30,36,37,38,39,40,41], developed predicting models based on that approach. The equations obtained, resulting from the statistical treatment of real data, also take into account the characteristic parameters of the TBMs, such as diameter, thrust, torque, and power. The equations are useful for leading engineers to choose the best machine in a given geological context. Unfortunately, the weakness of the indirect approach cannot be overlooked, databases must be constantly updated according to new construction sites.
Ref. [42] conducted a statistical analysis on a database consisting of design parameters of 262 TBMs (72 open, 24 single shield, 41 double shield, 86 Earth Pressure Balance EPB, and 39 slurry TBM) that refer to projects implemented since 1985 around the world. The study analyzes potential correlations between TBM diameter, thrust, torque, total machine weight, head rotation speed, and number of tools on the cutterhead. Some parameters are well correlated, then forecasts for design purposes could be made. To this end, the authors validated their models by comparing the estimated parameters with the TBM data used to carry out 30 projects in Turkey in different geological contexts. The statistical treatment of the data was carried out, and different regression functions were evaluated to find the best fitting. The function with the highest correlation value was selected and chosen as the forecast equation.
Ref. [43] conducted a study whose goal was to evaluate the correlations between TBM diameter and design parameters (thrust, torque, power, rotational speed) to obtain prediction equations for different types of TBM and in different geological conditions.
Studies by [42,43] are the most recent but still not updated to the present day. In addition to this drawback, the need for tools capable of guiding tunnel construction companies to the choice of the right machine for a given excavation work becomes crucial, since a wrong choice could lead to a reduction in excavation performance and consequently an increase in time and construction costs. In light of these needs, this paper analyzes a larger and more updated database. In total, 270 TBM data, with a diameter greater than 6 m, used to carry out tunnel projects in various parts of the world were analyzed. Regression analysis was also done in cases where less than 10 data were available, although being understood that the significance of the model needs to be refined with further research. A total of three different geological conditions were also considered: soft ground, mixed ground, and rock. As for the correlation between diameter and thrust, 90 data were analyzed. Open and single shield machines were not part of the analysis due to lack of data. The results show a strong link between diameter and thrust, mainly for soft ground conditions. The studies by [42,43] were adopted for comparison purposes while the validation of the study was proposed in a real case, represented by the Moncenisio base tunnel. Finally, the authors want to underline that this research is not intended for the final choice of a TBM in the execution phase of a project, but it can be a valid tool in the design phase.
2. Data Collection for Performing Statistical Analysis
The purpose of the experimental analysis was to identify and evaluate the correlations between the mechanical parameters of the TBMs and any links between them and the speed of advancement, also according to the geological characteristics of the rock mass. For this purpose, a robust database was built to perform statistical analyses [12,15,16,18,20,21,22,23,26,31,32,37,42,43,44,45,46,47,48,49,50,51,52,53,54,55,56,57]; it includes information from 302 tunnels excavated by TBM (open, single shield, and double shield), with a total length of 2200 km. It was structured by assigning to each tunnel the following information: name of the project; country where the project was carried out; contractor of the work; purpose; geological context; overburden material; Rock Mass Rating (RMR) and UCS; excavation diameter; length; construction period; feed rate; machine manufacturer and type of machine; number of tools on the excavation head; tools diameter; installed power; thrust; cutterhead rotation speed; and torque. It is pointed out that, for many tunnels, only a few data were available. As for the geological characteristics of the rock mass encountered, only qualitative descriptions were found, and almost no parameters characterizing the rock mass from a geomechanical point of view were found; this partially limited the work. In addition, the average advancement rate was found only in very few cases since, most of the time, TBM manufacturers only provide the peak speeds recorded during the excavation. In this regard, since the utilization coefficient was not available, the feed rate was tentatively calculated as the ratio between the tunnel length and the construction time. Obviously, the data contain all the downtimes related to possible machine stoppages due to the replacement of the tools and to different organizations of the work shifts. Because of this, the results of the processing are not provided in this work, as the information obtained was too scattered and unreliable. Once the database was completed, the statistical analysis was carried out. First, based on the type of machine examined (open, single shield, double shield TBM) the following correlations were analyzed: diameter—power; diameter—thrust; diameter—torque; diameter—cutterhead rotation speed; thrust—torque; power—torque; power—thrust.
For each of the pairs of parameters, different regression functions were evaluated, and the one that returned the highest value of R2 (coefficient of determination) was chosen as a statistical measure of how close the data are to the fitted regression line. Admissible values of R2 range between 1 and 0 but only high R2 values indicated that the model explains all the variability of the response data around its mean. So, the higher the R2, the better the model fits the data.
Correlation equations that took into account the geological aspect were sought, albeit not in detail, due to the lack of geomechanical parameters. In this context, a series of filters was applied, and the behavior in five different rock types was examined for each type of machine. The statistical analysis was carried out in the same way as in the previous cases, considering only the correlations where the number of available data was greater than 10. Finally, in the last phase of the study, links were sought between the machine parameters and the forward speed, according to the type of rock and machine.
2.1. Analysis of the Correlations Identified on the Basis of the TBM Type
For the three types of machine selected (open, single shield, and double shield TBM), the cases found in the literature (whose number is summarized in Table 1) were analyzed in detail. As for the correlation between the diameter and the power supplied to the cutterhead (Figure 1), the trend identified is linear for open TBMs, with R2 = 0.766. The graph shows that, with the same diameter, the power values vary in a more or less extended range. This is due to the different characteristics of rock masses crossed. Good correlations have also been found for single shield TBMs, through a power function where R2 is 0.7833. It has to be noticed that large diameters were used in very different rock masses, so that their variation range is greater compared to smaller diameters. For each pair of parameters investigated, the number of experimental data analyzed was greater than 30. This made it possible to get more reliable models. As for the double shield TBMs, the relationship identified is linear, and the power supplied to the cutterhead increases with the diameter; R2 is 0.7903. The number of data analyzed is, also in this case, consistent; the power varies between 200 and 6500 kW. However, most of data is in the range 200 to 3000 kW, with diameters between 2 and 9 m. Diameters smaller than 3 m did not provide enough experimental data to make a meaningful comparison; diameters between 3 and 5 m provided similar values for both open and double shield TBM; with a diameter greater than 5 m, the double shield TBMs are on average supplied with a power greater than the other types of TBM.

Table 1.
Number of cases found in the literature to compare the main parameters of the Tunnel Boring Machines (TBM) analyzed. S.S.: single shield; D.S.: double shield.
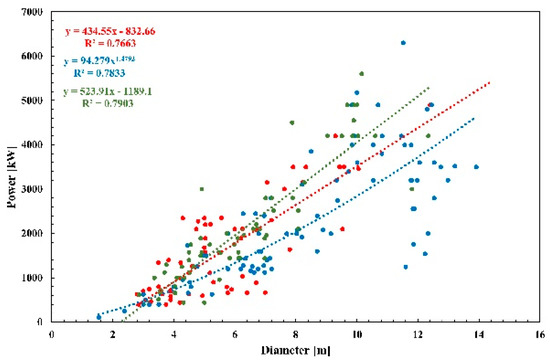
Figure 1.
Correlation between the diameter and the power at the cutterhead for the three classes of TBM analyzed. Red: open TBM; blue: single shield TBM; green: double shield TBM.
Similar results were obtained from the previously quoted study, carried out by [43]. They observed linear trends for open and double shield TBM, with R2 = 0.6 in both cases and noticed that, the diameter being the same, the double shield machines are characterized by higher power; single shield TBMs could not be evaluated, due to lack of data.
The trend of the torque vs. the diameter is given in Figure 2. The correlations are represented by a linear function in the case of open TBMs and by power functions for single and double shield TBMs. The results are in line with those obtained by [42]. It can also be noticed that in the whole domain, with the same diameter, single shield machines operate with a larger torque. In the range of diameters between 3 and 7 m, the performance of open TBMs and that of double shield TBMs are very similar. Over 7 m, the gap increases progressively as the diameter increases, and, for the same diameter, the open TBMs work with a lower torque compared to the other two types of machines. A higher concentration of data in the range of diameters between 2 and 9 m is also noticeable. Furthermore, in the same range, the range of the torque is small, and the model approximates the experimental points very well.
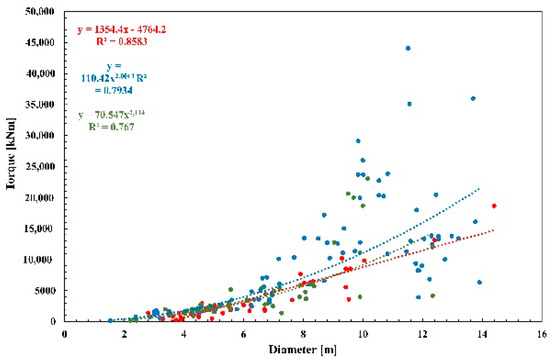
Figure 2.
Correlation between diameter and torque. Red: open TBM; blue: single shield TBM; green: double shield TBM.
A kind of correlation, expressed by a logarithmic trend, is observed in open TBM between the diameter and the thrust (Figure 3), characterized by R2 = 0.6417. In general, these two parameters are not very well correlated, as the thrust depends only in part on the diameter, whereas it is mainly conditioned by the geomechanical characteristics of the rock mass. On the other hand, the correlation (R2 < 0.5) in the single shield TBM is poor. Considering the intersection of the domains of the three functions and examining, therefore, a range of diameters between 2 and 12.5 m, the trend represented by single shield TBMs is always above the other two functions. As for the double shield TBMs, also in this case the correlation is low. However, a model consisting of a power function was considered, with R2 = 0.4089. The processed data (n = 77), are correctly distributed along the function up to a diameter of 5 m; in the range 2 to 6 m, the trends of the open and double shield TBMs are very similar. Over 6 m, with the same diameter, the thrust exerted by the double shield TBM is greater than that exerted by the open TBM; however, starting from these values, the dispersion of the experimental points increases considerably. Ref. [43] stated that the trend of the thrust vs. the diameter is linear for double shield machines. This difference, compared to the model described in Figure 3, is linked to the small number of data processed (8) by [43], in addition to the probable difference in geomechanical characteristics of the rock masses analyzed.
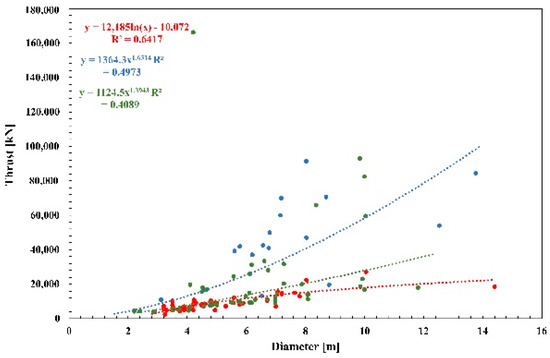
Figure 3.
Correlation between diameter and thrust. Red: open TBM; blue: single shield TBM; green: double shield TBM.
Thrust and torque in the open TBM are linked by a relationship described by a power function with a high R2 coefficient, equal to 0.8682. The range of thrust values is 4–28 MN, while the torque is in the range 0–10 MNm. Figure 4 shows that most thrust data are between 4 and 13 MN, distributed with a very small deviation along the regression function.
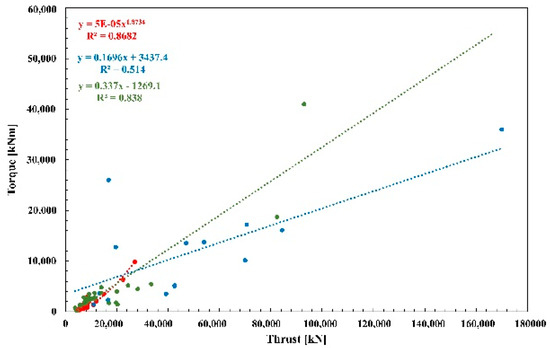
Figure 4.
Correlation between thrust and torque. Red: open TBM; blue: single shield TBM; green: double shield TBM.
As for the single shield TBM, the data fitting was done with a linear function; in this case R2 is slightly greater than 0.5, as the available cases were limited to 14. In the double shield TBM, on the contrary, a good correlation is observed. The experimental points (37) are mainly distributed in a thrust range between 3500 and 34,000 kN, with a maximum peak torque of 5200 kNm. In total, two isolated points with thrusts equal to 82,500 and 93,000 kN can be identified, which correspond to torques of 18,700 and 41,000 kNm, respectively. The linear regression function, with R2 = 0.838, could be more precise if more data were available for thrusts greater than 34,000 kN. The comparison between the three regression functions can only be carried out for thrusts lower than 20 MN. In this range, with the same thrust, it can be noticed that single shield TBMs require a higher torque than the other two types of machines, whose trends overlap. From the study of [42], the correlation between thrust and torque is linear for single and double shield TBM and is instead expressed by a power for open TBM. Figure 5 provides the power–torque trends. The correlation is expressed by a power function for open TBM and single shield TBM and by an exponential for double shield TBM. Open TBMs exhibit a strong correlation between power and torque. A total of 44 data were analyzed, and R2 is 0.8809. It is also noticeable that single shield TBMs operate with higher torques than the other two. The model approximates the experimental data very well, especially up to 2000 kW. For higher values, the dispersion partially increases, and the torque variation interval increases too. Furthermore, in the power range between 400 and 3000 kW, the curves referring to the open TBM and double shield TBM overlap. In this interval, the power being the same, the gap between single shield TBM and open and double shield TBM increases in terms of torque. Over the threshold of 3000 kW, double shield TBMs show higher torque values than open TBMs; moreover, the gap between single shield and double shield TBM decreases.
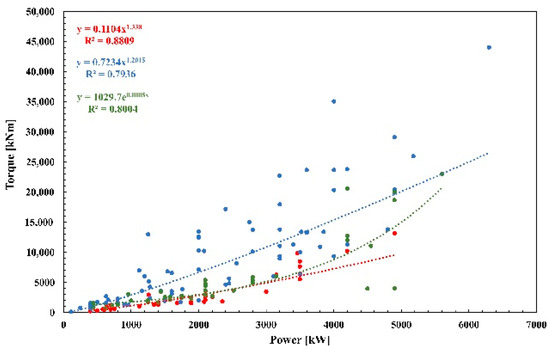
Figure 5.
Correlation between the power supplied to the excavation head and the torque. Red: open TBM; blue: single shield TBM; green: double shield TBM.
As for the correlation between power and thrust (Figure 6), the open TBMs provide an R2 of 0.6805. The limited number of data available for single shield TBMs (<10) did not allow to extrapolate a reliable trend, while, for double shield TBMs, 55 data were processed, with R2 = 0.5003. In the power range 400 to 1400 kW, the two regression functions overlap. Beyond the 1400 kW threshold, double shield machines operate on average with higher thrusts than open TBMs; the dispersion is anyhow high, as the case studies analyzed came from projects realized in rock masses with different geomechanical characteristics.
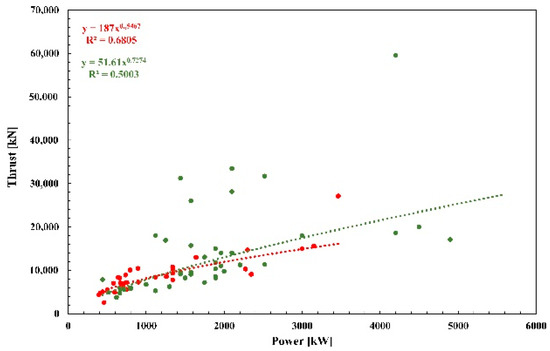
Figure 6.
Correlation between the power supplied to the excavation head and the thrust. Red: open TBM; blue: single shield TBM; green: double shield TBM.
The trend of the rotation speed of the head as a function of the diameter is shown in Figure 7. The regression functions are, for all cases, expressed by powers with negative exponent, so the rotation speed decreases with increasing diameter, and vice versa. Furthermore, with the same diameter, the double shields show higher rotation speeds than the others; open TBMs follow, then single shield TBMs. The correlation coefficients are, in all cases, relatively low.
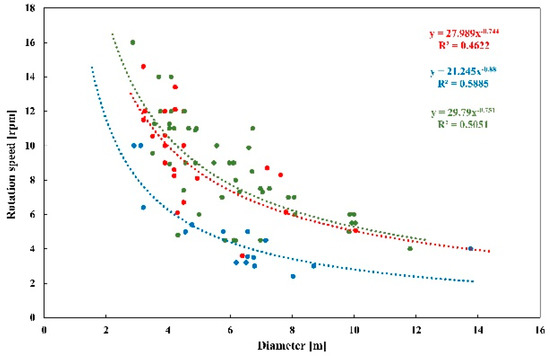
Figure 7.
Correlation between the diameter and the rotation speed of the head. Red: open TBM open; blue: single shield TBM; green: double shield TBM.
Reference [42], in accordance with Figure 7, showed that single shield TBM work at lower rotation speeds compared to the others; however, they found that open TBMs are characterized by higher rotation speeds. This difference could be partly due to the different amount of data analyzed.
2.2. Analysis of Correlations Based on the Type of Rock Crossed
As mentioned, the information obtained from the research in terms of geomechanical parameters is unfortunately rough and not very detailed (Table 2). Only very few complete cases were found, and therefore it was not possible to use them as input for the models. An attempt was made of using the available geological data, with the aim of obtaining reliable and representative results of a given type of rock mass. In this regard, the correlations between the mechanical parameters of the three categories of machines were analyzed, dividing them into groups, and using five types of rocks (where available) as discriminants: granite, gneiss, sandstone, limestone, and shale; however, for some of these types, not enough cases where available (at least 10 are needed to identify a reliable correlation), and therefore it was not possible to carry out the analyses.
Table 2.
Number of cases found in the literature to compare the main parameters of the TBM analyzed as a function of the rock mass crosse.
2.2.1. Open TBM
Data relating to the excavation in granite and gneiss were available for open TBMs. The diameter of the machines examined varies between 3 and 10 m. For both types of rocks, the correlation between the diameter and the power supplied to the head is linear (Figure 8). In the case of gneiss, the number of data analyzed is higher (30) and the dispersion is greater; in fact, a given diameter often corresponds to several power values, showing that gneisses have mechanical properties different from each other. The regression equations identified have, in both cases, a medium–high correlation coefficient. The data available about the trend of the thrust as a function of the diameter refer to case studies carried out in granite, gneiss, and shale, and the trends obtained are shown in Figure 9. As for granite, the regression function identified is logarithmic with a very high R2, greater than 0.9. The experimental data are perfectly approximated by the function, and this suggests that the geomechanical properties of the granite are very similar in the different cases analyzed (n. 13). The TBM diameter varied from 3 to 8 m, which corresponds to thrusts between 5 and 17 MN. As for the gneisses, the regression function is an exponential, with R2 greater than 0.8. Additionally, in this case, the experimental data are represented very well by the function, with a very small deviation.
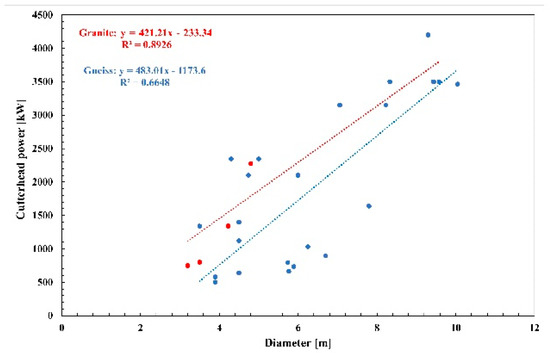
Figure 8.
Correlation between the diameter and the power supplied to the head due to the excavation in granites and gneisses by open TBMs.
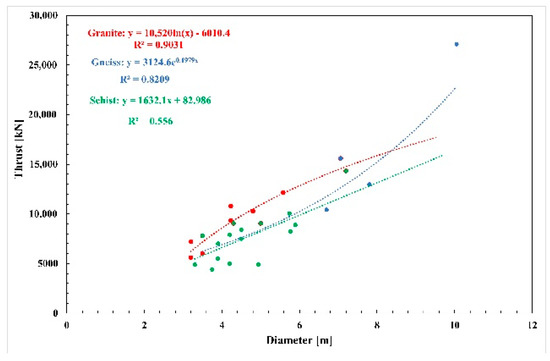
Figure 9.
Correlation between the diameter and the thrust due to the excavation in granites, gneisses and schists by open TBMs.
The diameter of the machines examined varies between 3 and 10 m, with thrusts in the range between 5 and 28 MN. As for shale rocks, low correlations were almost always obtained in the case studies examined. The equation is linear and was taken from 24 pairs of parameters. R2 coefficient, slightly higher than 0.5, is low compared to expectations, since almost all the data available fall within a very small diameter range, between 3 and 6 m. Therefore, several thrust values correspond to a given diameter, which implies that the excavations have been performed in rocks with variable mechanical characteristics. The diameter and the torque are also very well correlated in granites. the experimental points can be represented by an exponential function with a coefficient R2 greater than 0.9 (Figure 10). The correlation is also very high in gneisses, except for a diameter of about 10 m, where four different torque values can be observed. In all other cases, the torque increases linearly as the diameter increases. The equation that expresses the correlation between the diameter and the torque in the shale is logarithmic. The R2 coefficient is very low compared to expectations, since almost all the available data fall within a very small range of diameters, between 3 and 5 m. Therefore, for the same diameter, more torque values are noticeable, which derive from having carried out the excavation in rock masses with variable mechanical characteristics. The last correlation analyzed in granite rocks is between the power at the excavation head and the torque (Figure 11). The 11 experimental points are approximated by an exponential function with an R2 coefficient greater than 0.9. The head power varies between 700 and 4400 kW, which corresponds to torque values between 400 and 11,000 kNm. About the behavior in gneisses, the data fitting was carried out with a power function that approximates very well the experimental data, with a correlation coefficient R2 = 0.968.
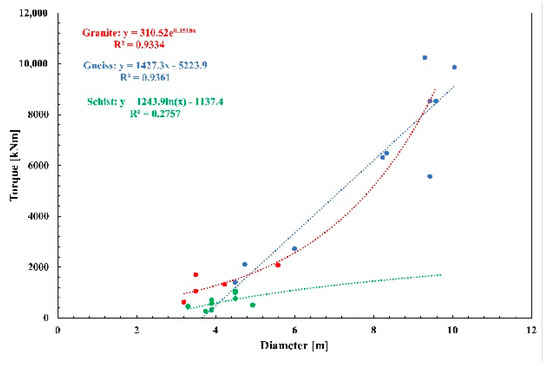
Figure 10.
Correlation between the diameter and the torque due to the excavation in granites, gneisses and shales by open TBMs.
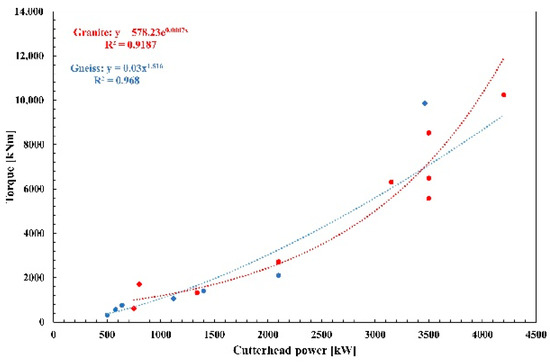
Figure 11.
Correlation between the power and the torque due to the excavation in granites and gneisses by open TBMs.
The correlations between power and thrust were also analyzed in the gneisses (Figure 12), where an exponential equation was obtained, with R2 = 0.6524.
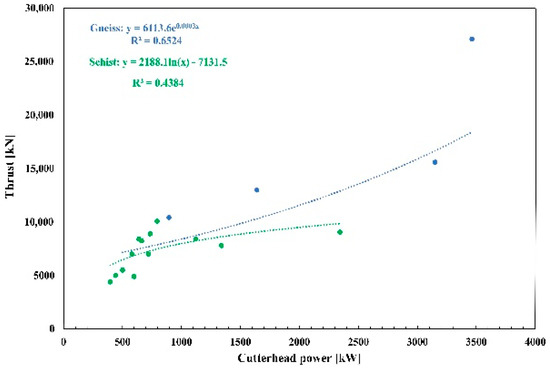
Figure 12.
Correlation between the power and the thrust due to the excavation in gneisses and schists by open TBMs.
In shales, the correlation is rather low (R2 = 0.4384), but many pairs of data have been found very close to each other for powers less than 1000 kW, while few very scattered data are observed for higher power values.
2.2.2. Single Shield TBM
For this type of machine, data on the excavation in sandstone, limestone, and schist were available. The correlation between the diameter and the power supplied to the head is expressed for the first two cases by a power function (Figure 13). The number of pairs of parameters available for the sandstone was 20, and the R2 coefficient was greater than 0.8. With diameters smaller than 8 m, the deviation from the average is very small, and it increases for larger diameters. Additionally, for limestone, the correlation between diameter and power was good, with R2 = 0.78.
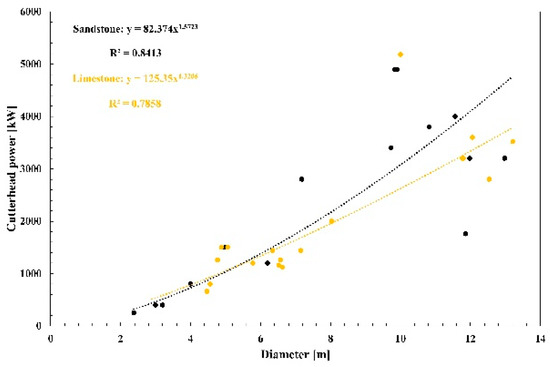
Figure 13.
Correlation between the power and the diameter due to the excavation in sandstone and limestone by single shield TBMs.
As for the excavation in the sandstone, the correlation between the diameter and the thrust is very weak (Figure 14), whereas the one between the diameter and the torque (Figure 15) and between the power supplied to the head and the torque are quite high (Figure 16). Both are described by a power function with R2 greater than 0.7.
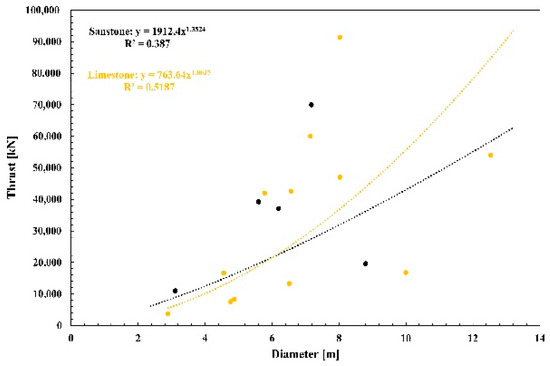
Figure 14.
Correlation between the diameter and the thrust due to the excavation in sandstone and limestone by single shield TBMs.
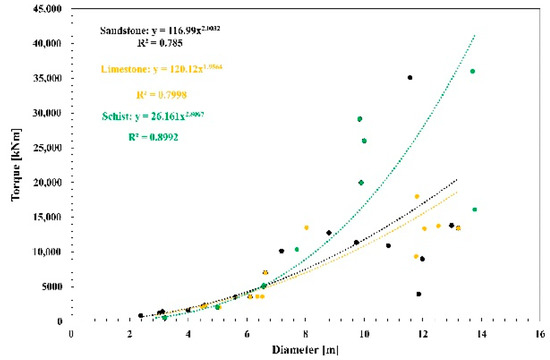
Figure 15.
Correlation between the diameter and the torque due to the excavation in sandstone, limestone and schist by single shield TBMs.
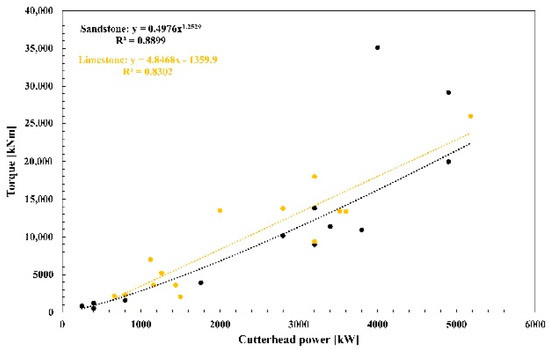
Figure 16.
Correlation between the power and the torque due to the excavation in sandstone and limestone by single shield TBMs.
In the first case, there is a very small deviation from the average for diameters less than 8 m, which grows as they increase. In the second case, the function approximates the experimental data very well in the whole power range, between 200 and 5200 kW. As for the excavation in limestone, both diameter and thrust (Figure 14) are poorly correlated, and the experimental data are scattered, showing the variability of the rocks crossed in the cases examined. The fitting of the experimental points corresponds to a power function with R2 = 0.5187. Finally, there are high correlations between the diameter and the torque (Figure 15) and between the power supplied to the excavation head and the torque (Figure 16). As for the excavation in shale rock, only the correlation between the diameter and the torque (Figure 15) was assessed, expressed by a power function with R2 of 0.8992.
2.2.3. Double Shield TBM
For this type of machine, data coming from the excavation in four kinds of rocks were available: granite, sandstone, limestone, and schist. From the analysis performed in granite, the correlations between the diameter and the power supplied to the excavation head (Figure 17) and between the diameter and the torque (Figure 18) were analyzed. In the first case, the 13 experimental data are approximated by a linear function (R2 = 0.9114), whereas in the second case the regression function is a power (R2 = 0.7645).
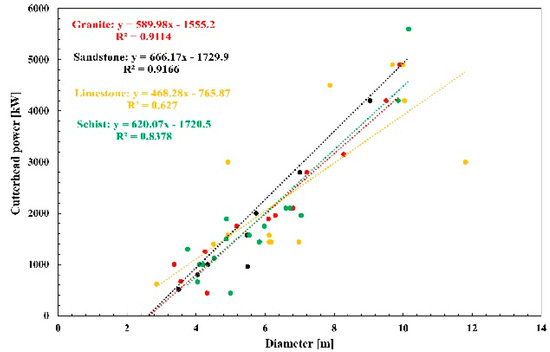
Figure 17.
Correlation between the diameter and the power due to the excavation in granite, sandstone, limestone, and schist by double shield TBMs.
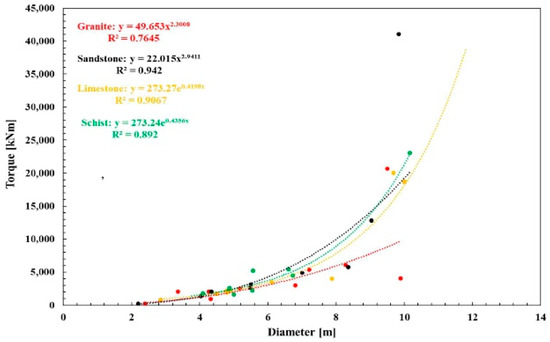
Figure 18.
Correlation between the diameter and the torque due to the excavation in granite, sandstone, limestone, and schist by double shield TBMs.
In both cases, the low data dispersion suggests that the excavation was performed in rock formations having a similar geomechanical behavior. Correlations in sandstone are very high. Figure 17 shows the trend of the power supplied to the excavation head vs. the diameter, represented by a linear equation with coefficient R2 equal to 0.9166. The function that correlates the diameter and the thrust is an exponential (Figure 19), which approximates very well the experimental points for diameters between 2 and 6 m; with a diameter of 10 m, three very different thrust values are evident.
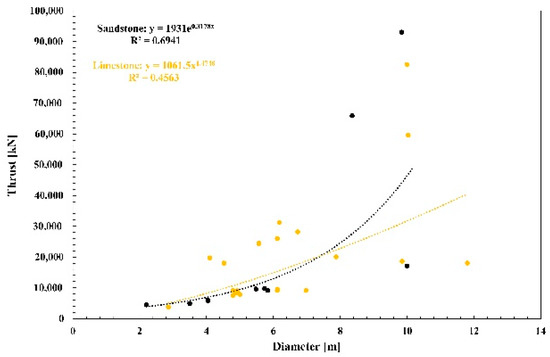
Figure 19.
Correlation between the diameter and the thrust due to the excavation in sandstone and limestone by double shield TBMs.
Figure 19 shows the torque trend vs. the diameter. The two parameters are well correlated, and the experimental points are perfectly represented by a power function (R2 = 0.942). The range of diameters is between 2 and 10 m, while the torque varies between 200 and 23,000 kNm. A single “anomalous” experimental point is evident, represented by a machine with a diameter of 10 m and a torque greater than 40,000 kNm.
Additionally, in the limestones there are good correlations between the mechanical parameters of this type of machine: The exceptions are represented by the diameter vs. the cutterhead power (R2 = 0.627, Figure 17) and the diameter vs. the thrust (R2 = 0.4563, Figure 18). There are, instead, excellent correlations between the diameter and the torque, with R2 equal to 0.9067 (Figure 19).
As for the shales, the correlations between diameter and power (Figure 17) and diameter and torque (Figure 19) were analyzed. In the first case, the regression function is linear, with R2 = 0.8378; the experimental data are mainly concentrated in a range of diameters between 3 and 8 m, corresponding to power values between 200 and 2500 kW. In addition, two isolated points with a 10 m diameter are identified, which are associated with two power values greater than 4 MW. In the second case (Figure 19), the exponential trend of the torque vs. the diameter is given (R2 = 0.892). In both cases, the deviation from the average is small.
3. Validation of the Experimental Models
The predictive models of the parameters, obtained by type of machine, have been validated graphically by direct comparison with the equations obtained from two similar studies, which have previously been quoted [42,43]. The database on which the research was based covered in fact a large number of cases, as specified in the previous chapters, and it seemed, then, appropriate to make a comparison between the equations obtained from [42,43] and those developed in the present study.
As for the open TBM models, from the analysis of the graphs in Figure 20 and Figure 21, it appears that the trends of the power supplied to the excavation head vs. the diameter and those of the torque vs. the diameter are linear for all the case studies analyzed. On the other hand, a difference (Figure 22) is noticeable between the shape of the function which expresses the trend of the thrust vs. the diameter (logarithmic), obtained in the present study, and the experimental, linear equation obtained from [42].
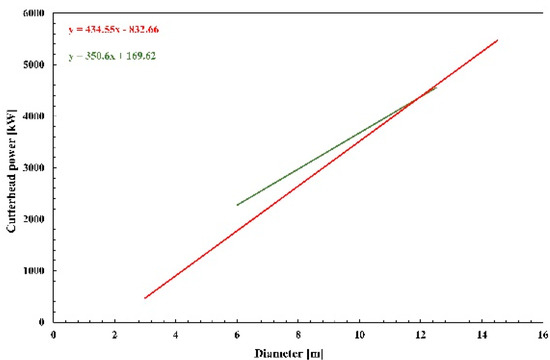
Figure 20.
Trend of the power vs. the diameter based on data collected from the analysis of open TBMs. In red, the experimental model proposed in this study; in green, the model proposed by [43].
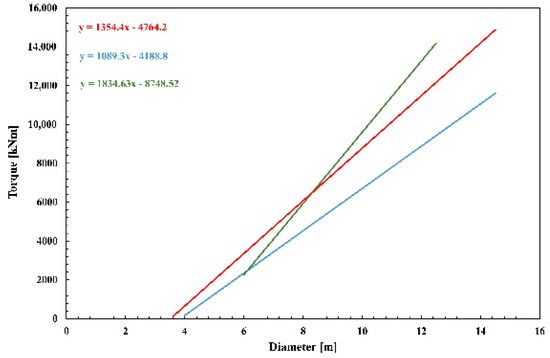
Figure 21.
Trend of the torque vs. the diameter based on data collected from the analysis of open TBMs. In red, the experimental model proposed in this study; in blue, the model proposed by [42]; and in green, the model proposed by [43].
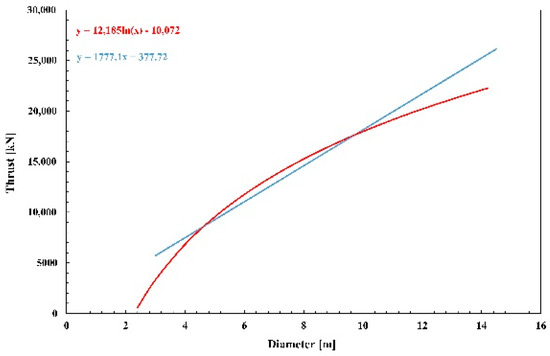
Figure 22.
Trend of the thrust vs. the diameter based on data collected from the analysis of open TBMs. In red, the experimental model proposed in this study; in blue, the model proposed by [42].
However, with the same diameter, the thrust values are very similar, and the discrepancy is probably related to the different amount of data analyzed.
In case of single shield TBMs, it was not possible to validate the forecast model expressing the correlation between the diameter and the power supplied to the excavation head. The correlations between torque and diameter (Figure 23) and between thrust and diameter (Figure 24) are represented by power functions. Finally, validation was sought for double shield TBMs. The trends of the power supplied to the excavation head as a function of the diameter are linear (Figure 25). Regarding the trend between torque and diameter, the function obtained during the experimental analysis is a power (Figure 26), in line with the results of [42]. The experimental model proposed by [43] is instead linear. However, in the latter case, the authors analyzed a small number of experimental data.
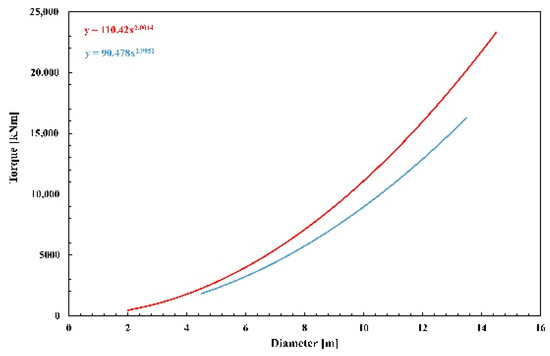
Figure 23.
Trend of the torque vs. the diameter based on data collected from the analysis of single shield TBMs. In red, the experimental model proposed in this study; in blue, the model proposed by [42].
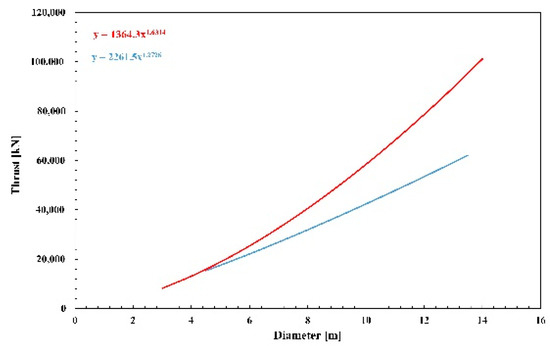
Figure 24.
Trend of the thrust vs. the diameter based on data collected from the analysis of single shield TBMs. In red, the experimental model proposed in this study; in blue, the model proposed by [42].
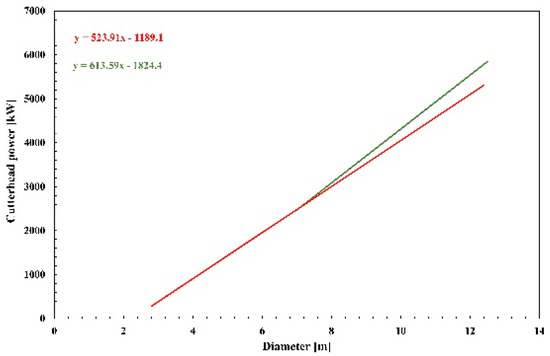
Figure 25.
Trend of the power vs. the diameter based on data collected from the analysis of double shield TBMs. In red, the experimental model proposed in this study; in green, the model proposed by [43].
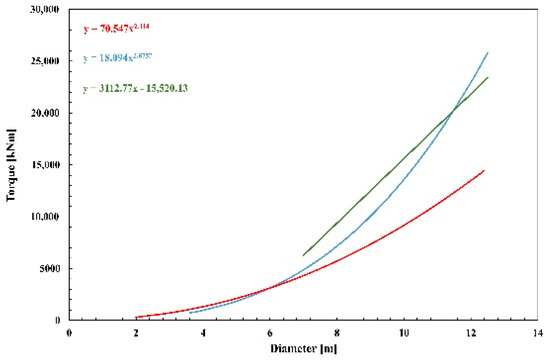
Figure 26.
Trend of the torque vs. the diameter based on data collected from the analysis of double shield TBMs. In red, the experimental model proposed in this study; in blue, the model proposed by [42] and in green, the model proposed by [43].
In Figure 27, the experimental models of thrust as a function of diameter, obtained from the three case studies, are shown. It should be noted that [42] made a distinction between main thrust (application as double shield TBM) and auxiliary thrust (application as single shield TBM). There are several differences between the shapes of the experimental functions, showing that the geomechanical properties play a fundamental role in the determination of the thrust. Finally, it should be noted that the linear trend proposed by [43] is the result of the experimental processing of few data.
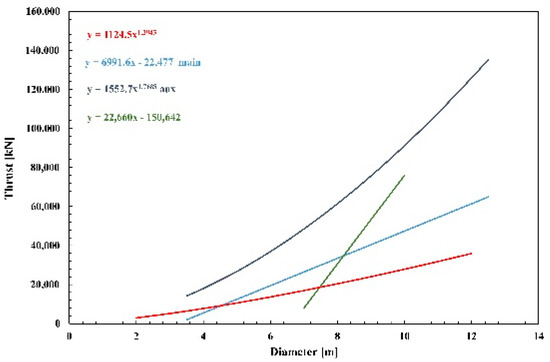
Figure 27.
Trend of the thrust vs. the diameter based on data collected from the analysis of double shield TBMs. In red, the experimental model proposed in this study; in light blue main thrust, in dark blue auxiliary thrust representing the experimental model of [42]; and in green, the model proposed by [43].
4. Case Study: The Moncenisio Base Tunnel
The forecast models identified were applied to the real case of Moncenisio base tunnel, a work included in the set of infrastructures that will be part of the new Turin–Lyon line. The main objective was to evaluate the performance of the open TBM “GEA” and the single shield TBM “Federica”. The use of the models found in this study represents a preliminary approach to a very current, important topic on which there are few complete and exhaustive references.
The Moncenisio base tunnel, 57.5 km long (45 km in France, 12.5 km in Italy), consists of two single-track tubes. It connects the international stations of Saint-Jean de Maurienne (France) and Susa (Italy), crossing the mountain range of the Alps. The work represents the fundamental part of the new Turin–Lyon railway connection, which is located at the intersection of the two major axes of communication between the North and the South and between the East and the West of Europe. It is a line for goods and passengers that extends for about 270 km, of which 70% is in France and 30% is in Italy. Tunnel Euralpin Lyon Turin (TELT) is the public promoter responsible for the construction and management of the cross-border section of the future freight and passenger line. The project also involves the construction of four exploratory and access tunnels (most of which have already been built), with the aim of investigating the characteristics of the geological formations. In total, three of these tunnels are located on the French side and are: Saint Martin La Porte, La Praz, and Modane, while the fourth is located on the Italian side in La Maddalena, Susa Valley.
The geological context along the longitudinal profile of the tunnel can be summarized as follows: along the first stretch, from Saint Martin La Porte (pk 11 + 725) to La Praz (pk 20 + 133), the prevalent presence of sandstones, shales, and conglomerates is noticeable; along the second stretch, which develops from La Praz (pk 21 + 048) to Modane (pk 29 + 920), schists, sandstones, gneiss, and quartz conglomerates with pink quartz and shales, limestones, dolomites, chalks and anhydrites are observed; the third stretch, from Modane (pk 33 + 341) to La Maddalena (pk 51 + 640), is the most heterogeneous from a geological point of view, as it is characterized by the presence of many formations: quartzites and quartzite conglomerates, limestones and dolomites, chalks and anhydrites, with intercalations of schist and dolomite, limestone, chalks and anhydrites, chlorite marbles, quartzites, quartzite mica schists, albitic gneisses passing through quartz mica schists, mica schists, and minutes gneisses with prevalence of glaucophane; the last stretch, from La Maddalena (pk 53 + 650) to Susa (pk 61 + 076), is characterized by mica schists and minute gneiss, albitic gneiss passing through quartz mica schists, quartzite, carbonatic schists, prasinites and prasynitic schists.
4.1. Application of Correlation Models between the Mechanical Parameters of TBMs to the Case Study
The application of the correlation models between the mechanical parameters of the TBM, previously validated (§3.1), to the case study under examination, has the purpose of estimating the power of the excavation head, the torque and the thrust of the “GEA” open TBM (6.3 m diameter), used in the construction of the Maddalena access tunnel, and the “Federica” single shield TBM (11.26 m diameter), used in the excavation of the first section of the future Moncenisio base tunnel.
4.1.1. “GEA” Open TBM
Table 3 shows the equations that correlate the diameter D with the three mechanical parameters (power (P), torque (C), thrust (S)), in the case of open TBMs. Through these equations, by entering a diameter of 6.3 m, the minimum values of P, C, and S are obtained. The results are then compared with the real TBM values (Table 4).
Table 3.
Equations that link the diameter D to the power supplied to the excavation head (P), to the torque (C) and to the thrust (S) for the open TBMs.
Table 4.
P, C, S values estimated with the experimental models and real values.
From the analysis of the results of Table 3, it is clear that the power supplied to the excavation head and the thrust are perfectly estimated by the experimental prediction models obtained in the present study. Particularly noteworthy is the forecasted value of the thrust that underestimates the real value of only 3.6%.
Pertaining to the cutterhead power, the discrepancy is slightly higher but, however, it is aligned with the prediction value proposed by [43]. Finally, an overestimation of the torque of about 45% with respect to the real value is observed. However, even references from [42,43] provided overestimated torque values with a discrepancy greater than 20%. This greater gap between the real value of the torque and the outcomes of the prediction models probably denotes the influence of the variability of the mechanical characteristics of the rock mass crossed on the performance of the machine.
4.1.2. “Federica” Single Shield TBM
The equations that correlate the diameter D to the three mechanical parameters power (P), torque (C), and thrust (S) in case of single shield TBM are shown in Table 5. Through these equations, by entering a diameter of 11.26 m, the values of power, torque, and thrust for single shield TBM are estimated. The results are compared with the real machine values (Table 6).
Table 5.
Correlation equations, obtained for single shield TBMs, between the power supplied to the excavation head (P), the torque (C) and the thrust (S) as a function of the diameter.
Table 6.
P, C, S values estimated with the experimental models and real values.
By analyzing the results of Table 5, the differences between estimated values and real values are noticeable. As for the comparison of references, only the data of [42] are available. In particular, he highest gap between the forecasted and the real values can be spotted for the thrust. The proposed prediction model provides a value about 75% lower than the real one, but this discrepancy is halved compared to [42]. The cutterhead power is also underestimated (44%) while for the torque an overestimation of more than 20% is obtained both in the proposed and in the reference model. These divergences are due to the peculiarity of the geological formation (carboniferous) where the tunnel is built. During the excavation of the winze with the conventional method, strong convergences were found, up to 1 m in 12 h, which required an appropriate study of the TBM to be used. Specifically, there was no demand for high torque due to the low strength of the material. On the other hand, in order to avoid the shield clamping due to the strong convergences, it was preferred to equip the machine with a thrust capacity able to reduce the risk. Therefore, the atypical real values, compared to the experimental theoretical models, are linked to the peculiar characteristics of the geological formation.
4.2. Application of Models Taking into Account the Geological Aspect
The geological context along the longitudinal profile of the Moncenisio base tunnel is characterized, as already observed, mainly by schists and gneiss, especially along the third and fourth stretches. The correlation models previously obtained between the mechanical parameters of TBMs are applied below, which take into account the geological aspect. The aim is always to evaluate the power, the torque and the thrust, according to the available equations, for the different types of machines operating in schists and gneiss. For calculations, a diameter of 11 m is considered.
The models that correlate the diameter of the TBM (D) to the power supplied to the excavation head (P) and to the torque (C) in case of single and double shield TBMs, in shale formations, are listed below:
Through Equations (1)–(3), considering a diameter D of 11 m, the minimum head power and torque values necessary for the two types of TBM are calculated (Table 7).
Table 7.
Minimum values of P and C with which the two types of TBM must work in rock formations with the presence of schists, having chosen a diameter of 11 m.
The models that link the diameter D of the TBM to the power of the excavation head (P), the torque (C) and the thrust (S) in the case of open TBM operating in rock formations with a prevalence of gneiss are shown below:
By inserting in the Equations (4)–(6) a diameter of 11 m, the minimum values of P, C, and S with which the open TBMs must operate (Table 8) are obtained.
Table 8.
Minimum values of P, C, and S with which open TBMs must work in rock formations with the presence of gneiss, having chosen a diameter of 11 m.
5. Discussion
The present work has been developed with the purpose of identifying correlation models among mechanical and operational parameters of the TBMs, taking into account different classes of tunnel boring machines.
It should be pointed out that the work represents an improvement over the research currently available in the scientific literature, although some gaps and shortcomings are still present. In general, missing information can be identified in geological and operational issues.
As for the geological aspects, the necessary information was only partially available (Uniaxial Compressive Strength UCS, Rock Mass Rating RMR, and Geological Strength Index GSI, in fact, were only available in few cases). Furthermore, the lack of information on the geomechanical characterization of rock masses has influenced the efficiency in the evaluation of the models, as the state of fracturing has a great influence on the speed of advancement.
As regards the analysis of the correlations between the machine parameters and the advancement speeds of the TBMs, various difficulties were encountered: it was not possible to obtain information of this type from the literature, as only the length of the tunnels and the total duration of their construction were available, and this could be a drawback. In fact, by estimating an average advancement value in m/month, it was found that the speeds varied, for the same diameter and type of machine, from less than 200 to about 1000 m/month, and, therefore, it was not possible to provide an accurate evaluation for the individual cases examined.
In light of the above considerations, this research can be considered significant for a preliminary assessment of the most suitable machine in a given geological context. Certainly, further implementations of data about geological and operational conditions are needed to better calibrate the models, as well as the addition of further construction data could be an important step to improve the quality of model outcomes.
6. Conclusions
The prediction of excavation performance is a fundamental element for tunnel design. The optimization of mechanized excavation using full-face machines also requires continuous insights into the mechanisms of interaction between rock and tools; therefore, a targeted analysis of the geological and geomechanical context where the work must be located is essential.
In the literature, there are many models for predicting the machine parameters that affect the excavation performance, which however have a series of limitations, linked both to the knowledge of the parameters required as input and to the validity of the hypotheses on which they are based.
In the present study, correlation models between the mechanical parameters of the TBMs and between the latter and the rates of advancement (m/month) were researched, with the aim of obtaining equations that can be used to carry out a first assessment of the construction times of a work and to estimate as a first approximation the mechanical parameters (essentially power, torque, thrust) suitable for optimizing the excavation process using TBM.
As for the first phase of the study, i.e., the analysis of the correlations between the TBM machine parameters, the models were analyzed by distinguishing, at first, by type of TBM (open, single shield, and double shield). The results emerged are in line with those reported in two similar experimental studies, which have been used for comparison purposes.
Subsequently, the models between the machine parameters were researched and compared, taking into account the geological aspect.
In the final phase of the study, following the validation of the experimental study, the forecast models by type of machine were used, with the aim of estimating the mechanical parameters of the single shield TBM “Federica” and the open TBM “GEA”, used in the construction of the new Turin–Lyon rail link. In this regard, the minimum power, torque and thrust values for the two types of TBM have been assessed, based on the diameter.
The estimated values were compared with the real values of the two TBMs to evaluate the accuracy of the forecast models; it was found that the estimated values for the TBM “GEA” are in line with real parameters as for cutterhead power and thrust, while an overestimation of the torque of about 45% with respect to the real value was observed. This discrepancy may be due to the variability of the mechanical characteristics of the rock mass crossed, which allowed better performance of the machine compared to the results of the experimental models. On the other hand, there are discrepancies between the estimated and real values as regards the “Federica” TBM, justified by the typical features found during the excavation.
Finally, the equations coming from the experimental phase were used, according to the different types of rock, with the aim of obtaining results that are as reliable and representative of reality as possible.
The results were expressed in the form of models for the predictive analysis of the mechanical parameters of rock TBMs. For further developments, it will be necessary to expand the database, that at presents contains the technical characteristics of 2200 km of tunnels excavated in rock by TBM, with other case histories and to complete the database with geomechanical information. In fact, access to the parameters characterizing the rock masses, from a structural point of view, would allow to obtain very precise and specific forecasting models.
Author Contributions
Conceptualization, M.C., A.F.; methodology, M.C., A.F.; software, E.C.; validation, E.C.; formal analysis, M.C., E.C.; data curation, C.T., D.M.; writing—original draft preparation, M.C., C.T.; writing—review and editing, M.C.; supervision, M.C., C.T. All authors have read and agreed to the published version of the manuscript.
Funding
This research received no external funding.
Institutional Review Board Statement
Not applicable.
Informed Consent Statement
Not applicable.
Data Availability Statement
Not applicable.
Conflicts of Interest
The authors declare no conflict of interest.
References
- Macias, F.J.; Bruland, A. D&B Versus TBM: Review of the Parameters for a Right Choice of the Excavation Method. In Rock Engi-neering and Rock Mechanics: Structures in and on Rock Masses; CRC: Boca Raton, FL, USA, 2014; pp. 823–828. [Google Scholar]
- Ehrbar, H. Gotthard Base Tunnel, Switzerland. Experiences with different tunnelling methods. In Proceedings of the 2nd Brazilian Congress of Tunnels and Underground Structures, São Paulo, Brazil, 21–24 August 2008; pp. 154–196. [Google Scholar]
- Innaurato, N.; Mancini, R.; Cardu, M. Horizontal and inclined tunnels excavated by TBMs: Analysis and comparison of the TBM performances for some cases in Italy. In Proceedings of the International Congress Mining Science and Technology, Beijing, China, 29–31 August 1999; pp. 411–414. [Google Scholar]
- Brox, D. Technical considerations for TBM tunnelling for mining projects. Trans. Soc. Min. Metall. Explor. 2013, 334, 498–505. [Google Scholar]
- Brabant, J.D.; Duhme, R. Hard rock TBM tunnelling—Technical developments and recent experience. In Proceedings of the 2017 World Congress on Advances in Structural Engineering and Mechanics (ASEM17), Ilsan, Seoul, Korea, 28 August–1 September 2017. [Google Scholar]
- Maidl, B.; Schmid, L.; Ritz, W.; Herrenknecht, M. Hardrock Tunnel Boring Machines; Wiley: Hoboken, NJ, USA, 2008. [Google Scholar]
- Sapigni, M.; Berti, M.; Bethaz, E.; Busillo, A.; Cardone, G. TBM performance estimation using rock mass classifications. Int. J. Rock Mech. Min. Sci. 2002, 39, 771–788. [Google Scholar] [CrossRef]
- Yagiz, S. TBM Performance Prediction Based on Rock Properties. In Eurock 2006: Multiphysics Coupling and Long Term Behaviour in Rock Mechanics, Proceedings of the International Symposium of the International Society for Rock Mechanics, Eurock 2006, Liege, Belgium, 9–12 May 2006; Van Cotthem, A., Charlier, R., Thimus, J.-F., Tshibangu, J.-P., Eds.; Taylor & Francis Group: London, UK, 2006; pp. 663–670. [Google Scholar]
- Acaroglu, O. Prediction of thrust and torque requirements of TBMs with fuzzy logic models. Tunn. Undergr. Space Technol. 2011, 26, 267–275. [Google Scholar] [CrossRef]
- Farrokh, E.; Rostami, J.; Laughton, C. Study of various models for estimation of penetration rate of hard rock TBMs. Tunn. Undergr. Space Technol. 2012, 30, 110–123. [Google Scholar] [CrossRef]
- Benato, A.; Oreste, P. Prediction of penetration per revolution in TBM tunneling as a function of intact rock and rock mass characteristics. Int. J. Rock Mech. Min. Sci. 2015, 74, 119–127. [Google Scholar] [CrossRef]
- Hassanpour, J.; Rostami, J.; Zhao, J.; Azali, S.T. TBM performance and disc cutter wear prediction based on ten years’ expe-rience of TBM tunnelling in Iran. Geomech. Tunn. 2015, 8, 239–247. [Google Scholar] [CrossRef]
- Macias, F.J.; Wilfing, L.; Andersson, T. Performance and cutter life assessments in hard rock tunnelling. In Proceedings of the ISRM Regional Symposium—Eurock 2015, Salzburg, Austria, 7–10 October 2015; pp. 267–272. [Google Scholar]
- Mohammadi, S.D.; Torabi-Kaveh, M.; Bayati, M. Prediction of TBM penetration rate using intact and mass rock properties (case study: Zagros long tunnel, Iran). Arab. J. Geosci. 2015, 8, 3893–3904. [Google Scholar] [CrossRef]
- Rostami, J. Performance prediction of hard rock Tunnel Boring Machines (TBMs) in difficult ground. Tunn. Undergr. Space Technol. 2016, 57, 173–182. [Google Scholar] [CrossRef]
- Wilfing, F. The Influence of Geotechnical Parameters on Penetration Prediction in TBM Tunnelling in Hard Rock—Special Focus on the Parameter of Rock Toughness and Discontinuity Pattern in Rock Mass. Ph.D. Thesis, School of Geo Environmental Engineering, Technological University Munich, Munich, Germany, 2016; p. 191. [Google Scholar]
- Naghadehi, M.Z.; Ramezanzadeh, A. Models for estimation of TBM performance in granitic and mica gneiss hard rocks in a hydropower tunnel. Bull. Int. Assoc. Eng. Geol. 2016, 76, 1627–1641. [Google Scholar] [CrossRef]
- Salimi, A.; Faradonbeh, R.S.; Monjezi, M.; Moormann, C. TBM performance estimation using a classification and regression tree (CART) technique. Bull. Int. Assoc. Eng. Geol. 2016, 77, 429–440. [Google Scholar] [CrossRef]
- Entacher, M.; Rostami, J. TBM performance prediction model with a linear base function and adjustment factors obtained from rock cutting and indentation tests. Tunn. Undergr. Space Technol. 2019, 93, 103085. [Google Scholar] [CrossRef]
- Salimi, A.; Rostami, J.; Moormann, C. Application of rock mass classification systems for performance estimation of rock TBMs using regression tree and artificial intelligence algorithms. Tunn. Undergr. Space Technol. 2019, 92, 103046. [Google Scholar] [CrossRef]
- Zhang, Q.; Qu, C.; Kang, Y.; Huang, G.; Cai, Z. Identification and optimization of energy consumption by shield tunnel ma-chines using a combined mechanical and regression analysis. Tunn. Undergr. Space Technol. 2012, 28, 350–354. [Google Scholar] [CrossRef]
- Zhang, Q.; Kang, Y.; Zheng, Z.; Wang, L. Inverse Analysis and Modeling for Tunneling Thrust on Shield Machine. Math. Probl. Eng. 2013, 2013, 1–9. [Google Scholar] [CrossRef]
- Zheng, Y.-L.; He, L. TBM tunneling in extremely hard and abrasive rocks: Problems, solutions and assisting methods. J. Cent. South Univ. 2021, 28, 454–480. [Google Scholar] [CrossRef]
- Balci, C. Correlation of rock cutting tests with field performance of a TBM in a highly fractured rock formation: A case study in Kozyatagi-Kadikoy metro tunnel, Turkey. Tunn. Undergr. Space Technol. 2009, 24, 423–435. [Google Scholar] [CrossRef]
- Balci, C.; Tumac, D. Investigation into the effects of different rocks on rock cuttability by a V-type disc cutter. Tunn. Undergr. Space Technol. 2012, 30, 183–193. [Google Scholar] [CrossRef]
- Bilgin, N.; Copur, H.; Balci, C. Effect of replacing disc cutters with chisel tools on performance of a TBM in difficult ground conditions. Tunn. Undergr. Space Technol. 2012, 27, 41–51. [Google Scholar] [CrossRef]
- Bilgin, N. An appraisal of TBM performances in Turkey in difficult ground conditions and some recommendations. Tunn. Undergr. Space Technol. 2016, 57, 265–276. [Google Scholar] [CrossRef]
- Tuncdemir, H.; Bilgin, N.; Copur, H.; Balci, C. Control of rock cutting efficiency by muck size. Int. J. Rock Mech. Min. Sci. 2008, 45, 278–288. [Google Scholar] [CrossRef]
- Macias, F.J.; Jakobsen, P.D.; Bruland, A.; Log, S.; Grov, E. The NTNU prediction model: A tool for planning and risk man-agement in hard rock TBM tunnelling. In Proceedings of the World Tunnel Congress 2014—Tunnels for a better Life, Foz do Iguaçu, Brazil, 9–14 May 2014. [Google Scholar]
- Bruland, A. Prediction Model for Performance and Costs. Ph.D. Thesis, Norwegian University of Science and Technology of Trondheim (NTNU), Trondheim, Norway, 2000. [Google Scholar]
- Ozdemir, L. Development of Theoretical Equations for Predicting Tunnel Boreability; Colorado School of Mines: Golden, CO, USA, 1977. [Google Scholar]
- Ozdemir, L.; Miller, R.; Wang, F.D. Mechanical Tunnel Boring Prediction and Machine Design; NSF APR73-07776-A; Colorado School of Mines, National Science Foundation: Golden, CO, USA, 1978. [Google Scholar]
- Friant, J.E.; Ozdemir, L. Tunnel Boring Technology-Present and Future. In Proceedings of the Rapid Excavation and Tunnelling Conference, Boston, MA, USA, 13–17 June 1993; p. 869. [Google Scholar]
- Rostami, J.; Ozdemir, L. A new model for performance prediction of hard rock TBMs. In Proceedings of the Rapid Excavation and Tunnelling Conference, Boston, MA, USA, 13–17 June 1993; pp. 794–809. [Google Scholar]
- Rostami, J.; Ozdemir, L.; Nilson, B. Comparison between CSM and NTH hard rock TBM performance prediction models. In Proceedings of the Annual Technical Meeting of the Institute of Shaft Drilling Technology (ISDT), Las Vegas, NV, USA, 1–3 May 1996; pp. 1–10. [Google Scholar]
- Hansen, A.M. The History of TBM Tunnelling in Norway; Norwegian TBM Tunnelling Publication No. 11; Norwegian Tunnelling Society: Oslo, Norway, 1998; pp. 11–19. [Google Scholar]
- Bilgin, N.; Balci, C.; Acaroglu, O.; Tuncdemir, H.; Eskikaya, S.; Akgul, M.; Algan, M. The performance prediction of a TBM in Tuzla–Dragos sewerage tunnel. In Proceedings of the 1999 World Tunnel Congress, Oslo, Norway, 29 May–2 June 1999; pp. 817–822. [Google Scholar]
- Yagiz, S. A model for prediction of Tunnel Boring Machine performance. In Proceedings of the IAEG 2006, Nottingham, UK, 6–10 September 2006; p. 10. [Google Scholar]
- Gertsch, R.; Rostami, J. Disc cutting tests in Colorado Red Granite: Implications for TBM performance prediction. Int. J. Rock Mech. Min. Sci. 2007, 44, 238–246. [Google Scholar] [CrossRef]
- Hamidi, J.K.; Shahriar, K.; Rezai, B.; Rostami, J. Performance prediction of hard rock TBM using Rock Mass Rating (RMR) system. Tunn. Undergr. Space Technol. 2010, 25, 333–345. [Google Scholar] [CrossRef]
- Hassanpour, J.; Rostami, J.; Zhao, J. A new hard rock TBM performance prediction model for project planning. Tunn. Undergr. Space Technol. 2011, 26, 595–603. [Google Scholar] [CrossRef]
- Ates, U.; Bilgin, N.; Copur, H. Estimating torque, thrust and other design parameters of different type TBMs with some criticism to TBMs used in Turkish tunneling projects. Tunn. Undergr. Space Technol. 2014, 40, 46–63. [Google Scholar] [CrossRef]
- Park, B.; Lee, C.; Choi, S.; Kang, T.; Chang, S. Statistical analysis of TBM database to estimate technical specifications of TBMs. In Proceedings of the 2018 World Congress on Advances in Civil, Environmental, & Materials Research (ACEM18), Songdo Convensia, Incheon, Korea, 27–31 August 2018. [Google Scholar]
- Chang, S.-H.; Choi, S.-W.; Bae, G.-J.; Jeon, S. Performance prediction of TBM disc cutting on granitic rock by the linear cutting test. Tunn. Undergr. Space Technol. 2006, 21, 271. [Google Scholar] [CrossRef]
- Cho, J.-W.; Jeon, S.; Jeong, H.-Y.; Chang, S.-H. Evaluation of cutting efficiency during TBM disc cutter excavation within a Korean granitic rock using linear-cutting-machine testing and photogrammetric measurement. Tunn. Undergr. Space Technol. 2013, 35, 37–54. [Google Scholar] [CrossRef]
- Moon, T.; Oh, J. A Study of Optimal Rock-Cutting Conditions for Hard Rock TBM Using the Discrete Element Method. Rock Mech. Rock Eng. 2011, 45, 837–849. [Google Scholar] [CrossRef]
- Rostami, J.; Farrokh, E.; Laughton, C.; Eslambolchi, S.S. Advance rate simulation for hard rock TBMs. KSCE J. Civ. Eng. 2014, 18, 837–852. [Google Scholar] [CrossRef]
- Annex 13–Case Study on Tunnels. Available online: https://ec.europa.eu/regional_policy/sources/docgener/studies/pdf/assess_unit_cost_rail/annex_13_case_study_tunneling.pdf (accessed on 18 November 2014).
- Keiper, K.; Crapp, R.; Amberg, F. Assessment of the interaction of TBM and rock mass in rock tunnelling based on geomechanical calculations. [Bewertung der Interaktion von TBM und Gebirge im Felstunnelbau auf der Basis von geomechanischen Berechnungen]. Géoméch. Tunnelbau 2010, 3, 534–546. [Google Scholar] [CrossRef]
- Chapuis, A.; Yiu, D. De Tuen Mun à Tsz Wan Shan, les tribulations d’un tunnelier français au service de China Light & Power Hong Kong. Travaux 2006, 835, 37–41. [Google Scholar]
- Sun, W.; Shi, M.; Zhang, C.; Zhao, J.; Song, X. Dynamic load prediction of tunnel boring machine (TBM) based on heterogeneous in-situ data. Autom. Constr. 2018, 92, 23–34. [Google Scholar] [CrossRef]
- Qi, G.; Zhengying, W.; Hao, M. An experimental research on the rock cutting process of the gage cutters for rock tunnel boring machine (TBM). Tunn. Undergr. Space Technol. 2016, 52, 182–191. [Google Scholar] [CrossRef]
- Garshol, K.F.; Melbye, T.A.; Woldmo, O. Ground Water Control and Rock Support in TBM-Tunnelling in Hong Kong. In Proceedings of the IABSE Congress, Lucerne 2000: Structural Engineering for Meeting Urban Transportation Challenges, International Association for Bridge and Structural Engineering (IABSE), Lucerne, Switzerland, 18–21 September 2000; pp. 823–830. [Google Scholar]
- Okano, N.; Watabe, Y.; Kokubo, H.; Takagi, K. Railway Tunnels Excavated by TBM and Deep Bore Blasting Method in Japan. In Proceedings of the IABSE Congress, Lucerne 2000: Structural Engineering for Meeting Urban Transportation Challenges, International Association for Bridge and Structural Engineering (IABSE), Lucerne, Switzerland, 18–21 September 2000; pp. 808–815. [Google Scholar]
- Partov, D.; Ivanov, R.; Petkov, M. Survey of the Design of Back Anchors for Tunnel Boring Machines (TBM), Used in the Excavation of Metro Tunnels in Sofia. Procedia Eng. 2012, 40, 351–356. [Google Scholar] [CrossRef]
- Yazdani-Chamzini, A.; Yakhchali, S.H. Tunnel Boring Machine (TBM) selection using fuzzy multicriteria decision making methods. Tunn. Undergr. Space Technol. 2012, 30, 194–204. [Google Scholar] [CrossRef]
- Pompeu-Santos, S. Tunnels for Large Crossings: Challenges and Innovations. In Proceedings of the IABSE/IASS/Symposium Taller, Longer, Lighter, Zurich, Switzerland, 20–23 September 2011; p. 593. [Google Scholar]


Publisher’s Note: MDPI stays neutral with regard to jurisdictional claims in published maps and institutional affiliations. |
© 2021 by the authors. Licensee MDPI, Basel, Switzerland. This article is an open access article distributed under the terms and conditions of the Creative Commons Attribution (CC BY) license (http://creativecommons.org/licenses/by/4.0/).