Article

Effect of the Interfacial Dzyaloshinskii–Moriya Interaction on the Spin Waves Eigenmodes of Isolated Stripes and Dots Magnetized In-Plane: A Micromagnetic Study

1
Dipartimento di Fisica e Geologia, Università di Perugia, I-06123 Perugia, Italy
2
Istituto Nazionale di Ricerca Metrologica, Str. delle Cacce, 91, 10135 Torino, Italy
3
Istituto Officina dei Materiali del CNR (CNR-IOM), Sede Secondaria di Perugia, c/o Dipartimento di Fisica e Geologia, Università di Perugia, I-06123 Perugia, Italy
*
Author to whom correspondence should be addressed.
Appl. Sci. 2021, 11(7), 2929; https://doi.org/10.3390/app11072929
Submission received: 15 February 2021 / Revised: 11 March 2021 / Accepted: 19 March 2021 / Published: 25 March 2021
(This article belongs to the Section Applied Physics General)

Abstract

:
The influence of the Dzyaloshinskii–Moriya interaction (DMI) on the eigenmodes of magnetic nanostructures is attracting interest for both fundamental reasons and prospects in applications. In this study, the characteristics of spin waves eigenmodes in either long stripes or elliptical dots magnetized in-plane, with lateral dimensions of the order of 100 nm, are analyzed by micromagnetic simulations in presence of a sizeable DMI. Using the GPU-accelerated software MuMax3, we show that the eigenmodes spectrum is appreciably modified by the DMI-induced non-reciprocity in spin-waves propagation: the frequencies of the eigenmodes are red-shifted and their spatial profiles appreciable altered due to the lack of stationary character in the direction orthogonal to the magnetization direction. As a consequence, one finds a modification of the expected cross-section of the different modes in either ferromagnetic resonance or Brillouin light scattering experiments, enabling one to detect modes that would remain invisible without DMI. In this respect, the modifications of the spectrum can be directly connected to a quantitative estimation of the DMI constant. Moreover, it is seen that for sufficiently large values of the DMI constant, the low-frequency odd eigenmode changes its profile and becomes soft, reflecting the transition of the ground state from uniform to chiral.

1. Introduction

The study of chiral magnetism is attracting more and more attention in recent years, thanks to the discovery of the interfacial Dzyaloshinskii–Moriya interaction (DMI) [1,2] in magnetic thin films and multilayers. This interaction is an antisymmetric exchange coupling between two nearest spin electrons mediated by an heavy metal under- or over-layer [3,4,5]. For future applications, an accurate measurement of its strength is indispensable, so that different methods have been developed to evaluate it, such as the study of the domain walls motion [6,7,8,9] and the detection of spin waves (SW) by Brillouin light scattering (BLS) [10,11,12,13,14,15,16,17]. Several investigations have been published in the last seven years concerning plain films and multilayers [18,19], while there are only a few investigations concerning patterned nanostructures [20,21,22,23,24,25]. In particular, it is important to achieve a detailed understanding of the modifications of the dynamics of isolated magnetic nanoelements, which are usually realized by e-beam lithography and can be exploited in magnetic memories [26].
In a pioneering micromagnetic study, Garcia-Sanchez et al. [21] showed theoretically that Neel domain walls driven by the DMI can modify spin-wave propagation by an inducing nonreciprocal channeling along the center of the wall. Such channeling also occurs at the edges of perpendicularly magnetized wires and dots, where partial walls appear as a result of twisted boundary conditions.
Subsequently, M. Mruczkiewicz et al. [22] exploited both the frequency-domain method and micromagnetic simulations to investigate the impact of DMI on the ferromagnetic resonance (FMR) spectrum of isolated stripes magnetized in-plane, where DMI causes a red-shift of some peaks in the simulated FMR spectrum, as well as the appearance of new peaks.
More recently, the first theoretical investigation of nanodots magnetized in-plane was performed by Zingsem et al. [23] who proposed a model for quantized traveling waves in a confined geometry for the case of nonreciprocal propagation wherein waves at a given frequency have wavelengths that depend upon the direction of travel. They put in evidence that confinement in a nonreciprocal energy landscape produces a fixed nodal structure with wave amplitudes modulated in time and a phase velocity determined by the difference in wave- lengths between opposite propagation directions.
In this work we aim at deepening the analysis of the effect of interfacial DMI on nanomagnetic elements, considering both isolated stripes of width 100 nm and elliptical nanodots with lateral dimensions 100 × 50, 200 × 100 and 300 × 150 nm2. All the nanostructures are magnetized in-plane along the easy direction and have a thickness of 1.5 nm. We systematically vary the DMI strength D between 0 and 4 mJ/m2, analyzing the variation of both the eigenmodes spectrum and the spatial profile of the excited eigenmodes.
Please note that the results that we find in this paper correspond to what is expected in a possible experiment of ferromagnetic resonance o of Brillouin light scattering (at perpendicular incidence) on real magnetic wires or dots with sizeable DMI, which are still lacking in the literature.

2. Theoretical Framework and Micromagnetic Simulations

The dynamics of the considered magnetic systems, it is governed by the well-known Landau-Lifshitz-Gilbert equation (LLG):
m t = γ   ( m × H e f f ) + α   ( m × m t )
where m ( r , t ) = M M s is the unit vector along the local magnetization, γ is the gyromagnetic ratio, α is the Gilbert damping constant. Heff is the effective field acting on the processing spins, which can be derived from the energy functional according to:
H e f f = 1 μ 0 E t o t m
Therefore, it consists of different contributions, reflecting the energy terms recalled above:
H e f f = H 0 + H e x c h + H a n i + H m s + H D M I = = H 0 + 2 A μ 0 M s 2 m + 2 K u μ 0 M s m z e z + H m s + 2 D μ 0 M s [ m z x e x + m z y e y ( m x x + m y y ) e z ]
where H0 is the external applied field, A is the exchange stiffness constant, Ku is the uniaxial perpendicular anisotropy constant, and D the DMI constant. ex, ey and ez are the unitary vectors of the reference frame, chosen such that the z axis is perpendicular to the sample plane, as in Figure 1. The magnetostatic dipolar field Hms would be uniform in the case of an ellipsoidal body, only, so that for planar nanostructures it is usually calculated numerically, accounting for its non-uniformity and non-locality. The most general method to solve the LLG equation above are based on proper numerical techniques where it is spatially discretized using finite differences or finite elements methods. As a result, a discretized version of the effective field is obtained and the corresponding system of differential equations are solved within suitable time-stepping schemes.
The Micromagnetic simulations were performed by the GPU-accelerated software Mumax3 [27]. For the isolated stripe of width w = 100 nm and thickness t = 1.5 nm, the simulated area was divided in 8 × 20 × 1 cells with a dimension of 5 × 5 × 1.5 nm3. The periodic boundary conditions were applied in the x-direction, which represent the easy axis along which it is magnetized, to reproduce the infinite length of the stripe, taking into account that we are looking for stationary eigenmodes, with a uniform profile along the stripe length. (Please note that use of the periodic boundary conditions in the x-direction insures that the static internal field is uniform, avoiding the inhomogeneity that would originate by edges orthogonal to the magnetization. In second place, this is important to reduce the number of cells in the simulation, reducing the computation power and the time of the simulations.) For the elliptical magnetic dots, we kept a thickness t =1.5 nm, but considered three different lateral sizes a × b, namely 100 × 50 nm2, 200 × 100 nm2 and 300 × 150 nm2, as sketched in Figure 1. Moreover, in order to better mimic the round shape of the dot borders, the size of the discrete cells was reduced to 2 × 2 × 1.5 nm3. Both stripes and dots were saturated along their long axis (coincident with the x-direction) by an external field B0 = μ0H0 = 0.1 T. Then, spin waves were excited using a spatially uniform sinc-shaped field pulse, with an amplitude bz = 10 mT directed along the z axis, able to activate modes up 50 GHz. The fast Fourier-transform (FFT) of the temporal evolution of the out of plane average magnetization of the discrete cells was then performed to obtain the spectrum of the dynamic eigenmodes. In a second step of our simulations, a spatially uniform external field, oscillating at the frequency of each mode of the spectrum, was applied to visualize the spatial profile of each eigenmode. Please note that using this procedure, the observed modes are those whose average dynamical magnetization is different from zero, i.e., those that would be revealed in either a ferromagnetic resonance or a Brillouin light scattering experiment, while odd modes, having a negligible average value of the dynamical magnetization, are not included in our results. For both stripes and dots, magnetic parameters typical of CoB were assumed, i.e., saturation magnetization Ms = 1.2 MA/m, exchange stiffness A = 10 pJ/m, which lead to a value of the exchange correlation length of about 3.3 nm. The Gilbert damping was fixed to α = 0.001, to obtain a narrow linewidth of the peaks in the eigenmodes spectra.

3. Results

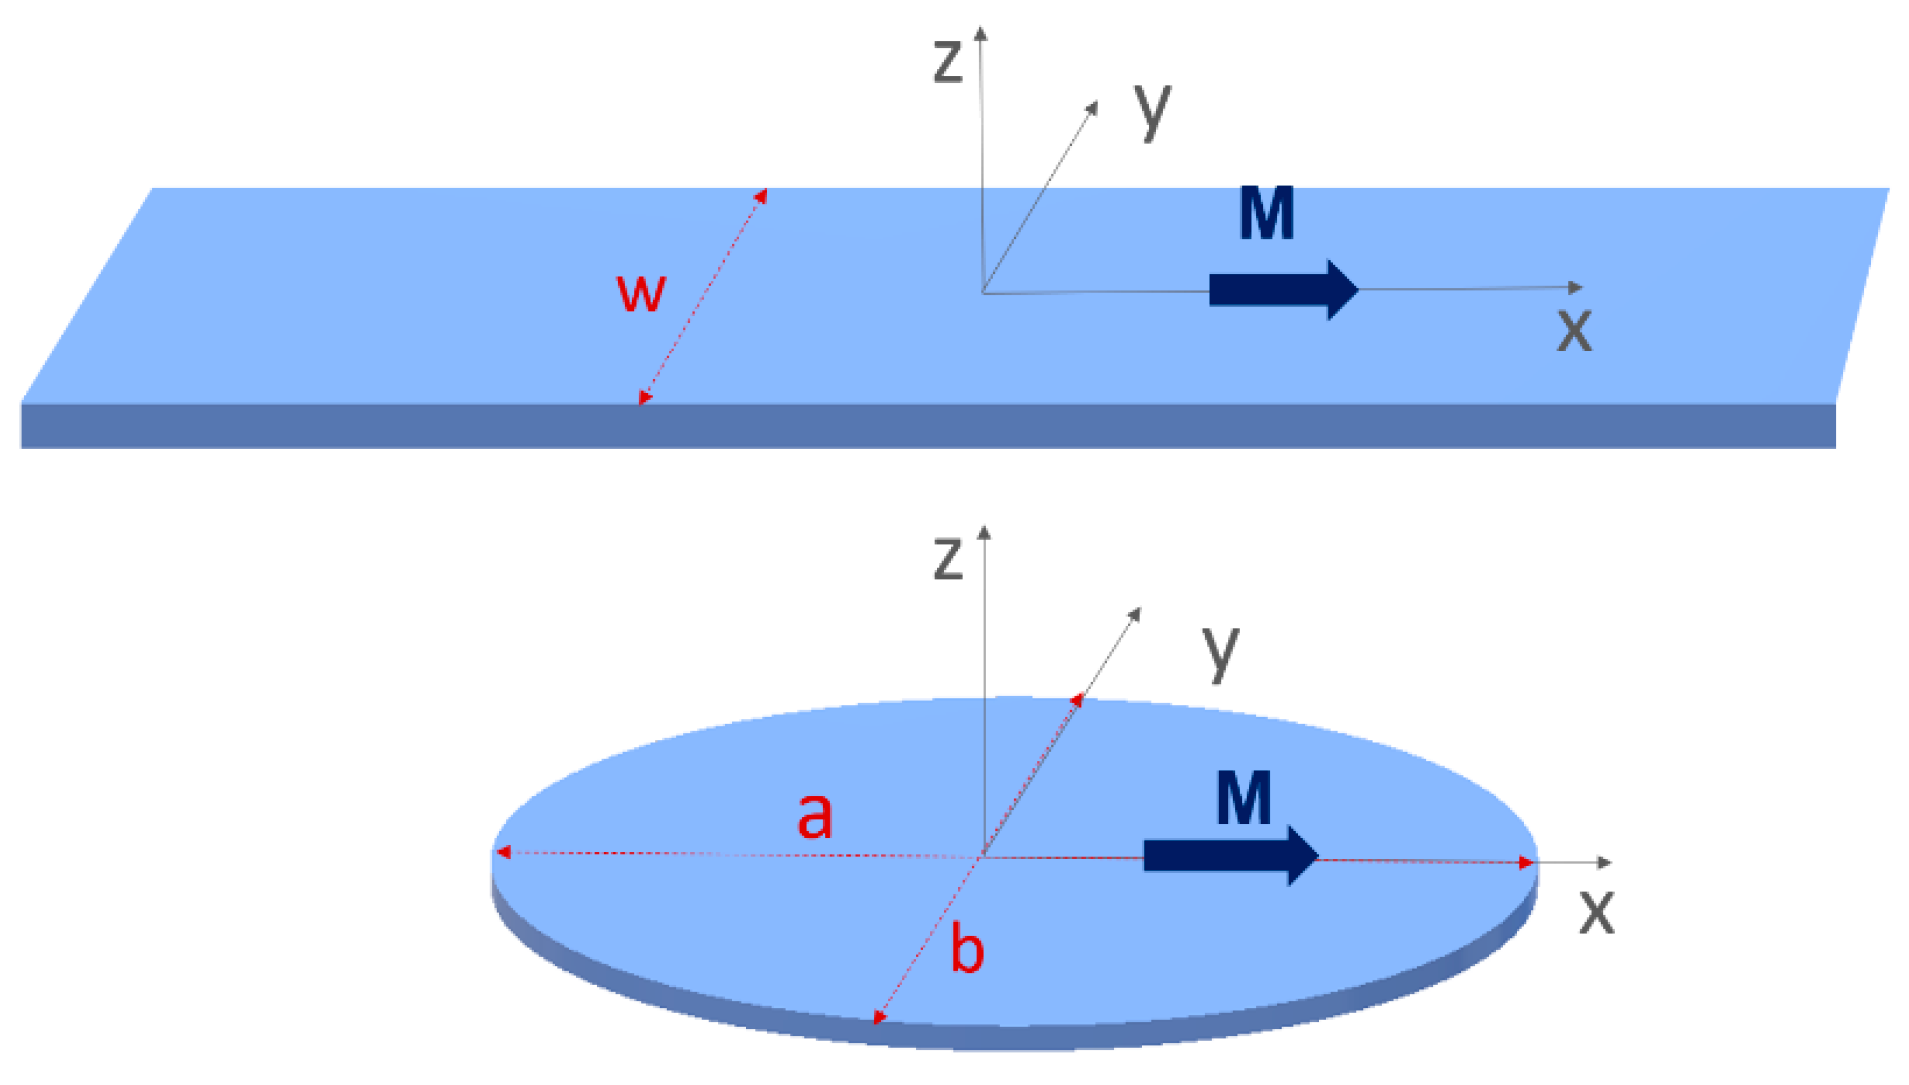
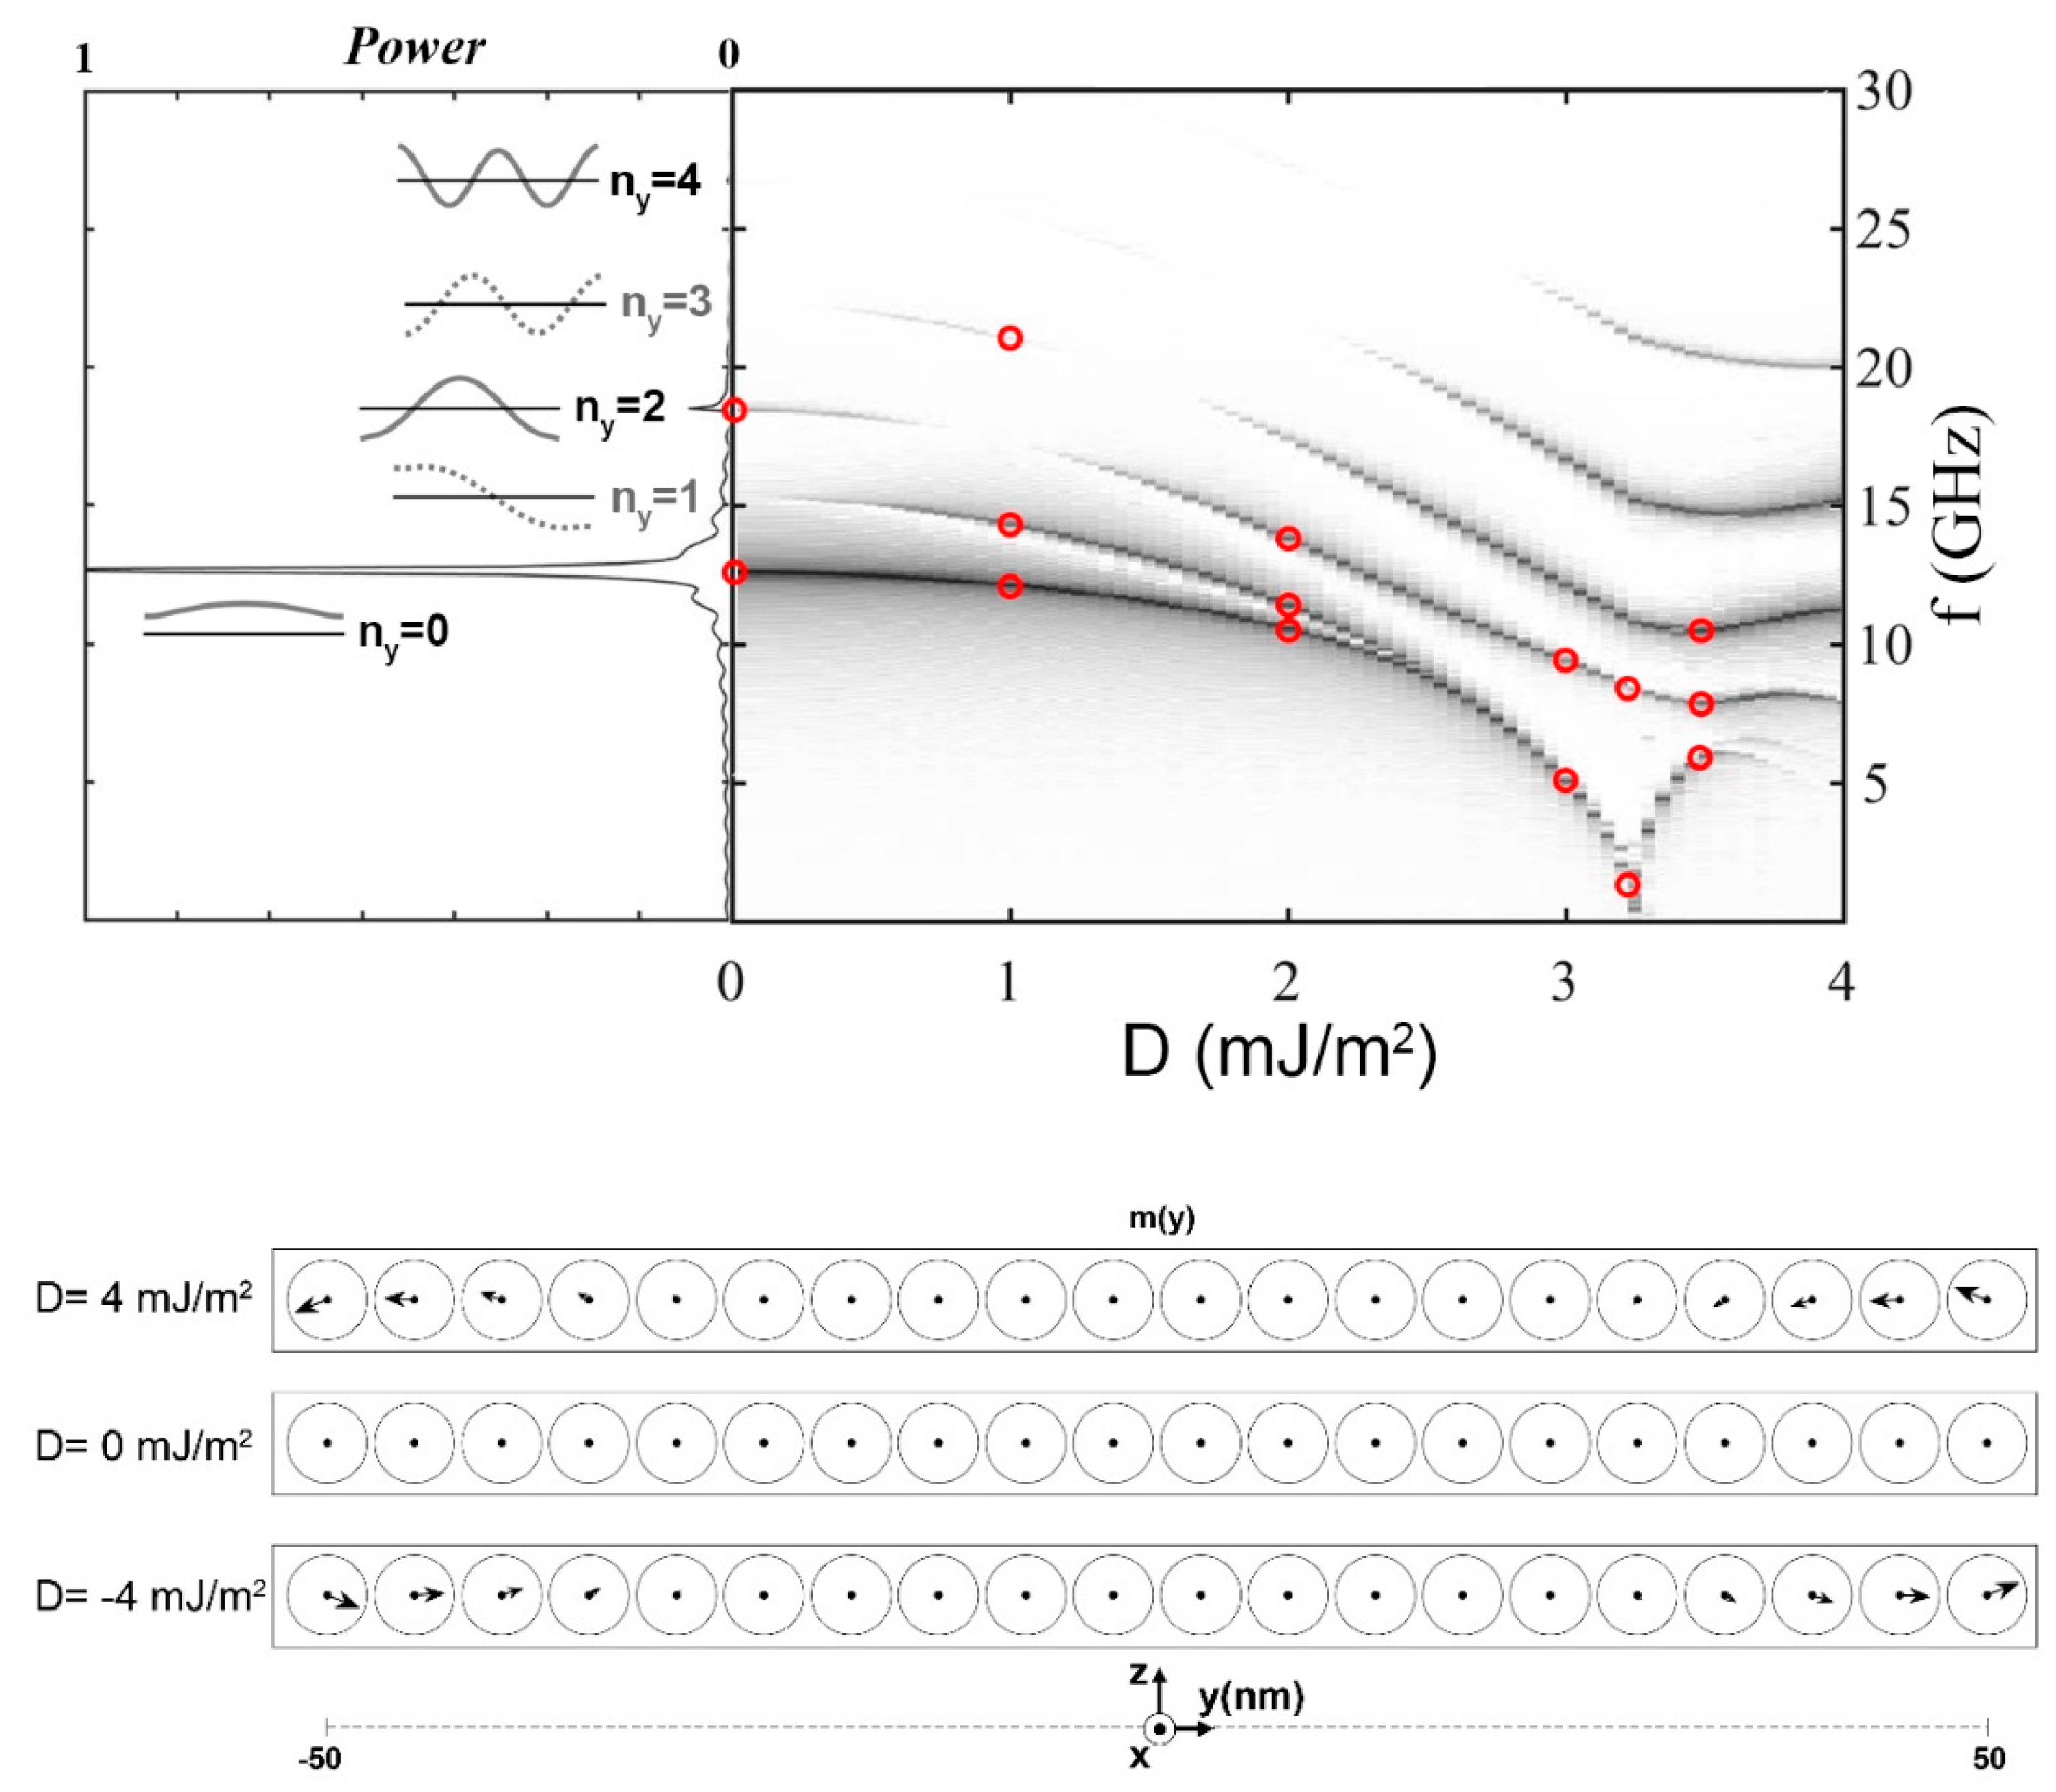
3.1. Eigenmodes of Isolated Stripes

In Figure 2 we show how the modes of the stripe decrease in frequency and modify their intensity upon increasing the strength D of the DMI from 0 to 4 mJ/m2. On the left side of the main panel, we show an intensity spectrum corresponding to D = 0, together with insets that show the spatial profile of the amplitude of each mode across the stripe width (y axis). The modes are labelled by an index ny that corresponds to the number of nodal lines parallel to the stripe axis (x-direction), so that one can estimate the quantized transverse wavenumber of the discrete modes as k y = n y π w (while in the x-direction the modes are uniform, i.e., they correspond to kx = 0).
It can be seen that for D = 0 only the even modes have a finite cross section in the spectrum, while odd modes are absent, as anticipated in the previous section. However, as D is lifted from zero, also odd modes become visible, since they progressively lose their stationary character along the y direction, reflecting the fact that the DMI introduces an energy shift proportional to ±Dky for each of the two partial waves, travelling in opposite directions, whose superposition gives rise to the stationary mode at D = 0. The detailed time evolution of the spatial profile of all the modes and their evolution with the value of D can be found in the animations (MP4 video files) that are available in the Supplementary Material. These animations clearly show that for finite values of D the modes assume a propagative character along the y-direction and the position of the nodes is not fixed at specific positions anymore, but it shifts to the right with time. As a consequence, also for those odd modes that were absent in the spectrum at D = 0 there is net magnetic moment oscillating that can be resonantly coupled to the spatially uniform oscillating magnetic field. This is the reason why, for instance, the intensity of the first two odd modes (ny = 1 and ny = 3) is zero for D = 0 but becomes relatively large as D is lifted to 1 or 2 mJ/m2, as seen in Figure 2. Another interesting point is that the frequency of all the modes decreases on increasing D, but the slope of the ny = 1 mode is larger than that of the fundamental mode (ny = 0), so the two modes merge for D ≈ 2 mJ/m2 and become soft for D = 3.25 mJ/m2, driving the transition from the uniform ground state to a chiral one, similarly to what happens in magnetic dots when there is a transition in the ground state [28,29]. To this respect, we verify also in the present case a characteristic that was previously observed for magnetization reversal of magnetic dots: whenever there is a change in the symmetry of the equilibrium state, which change is consistent with the symmetry of the mode that becomes soft and that drives the transition to a new ground state. The change of the ground state after the mode softening is illustrated in the bottom panel of Figure 2, where we have plotted the static magnetization across the stripe for D = 0 and for D = ±4 mJ/m2. One can easily see that for D = 0 the magnetization of all the discrete cells is aligned along the x direction, while for D = ±4 mJ/m2 the magnetization of the cells that are close the edges of the stripe deviate from the x direction and assumes a chiral configuration, with opposite chirality for positive or negative D. Remarkably, one sees that the z-component of the corresponding cells located at either the left or the right side of the stripe is opposite, resembling the antisymmetric nature of the ny = 1 mode, which is, in fact, the mode undergoing softening. Notice that if the magnetic system would be made more rigid by a larger applied field, then the value of D for which the mode softening occurs (D = 3.25 mJ/m2 in the present case) would be larger. For instance, it would be lifted to D = 3.65 mJ/m2 by doubling the intensity of the external field (B0 = 0.2 T rather than 0.1 T). Another interesting characteristic of the modes evolution with D is that only the modes with indices ny larger than 1 do not soften, because the presence of more than one node in their transverse profile implies a relatively large cost in terms of exchange energy and this prevents their frequency to approach zero.

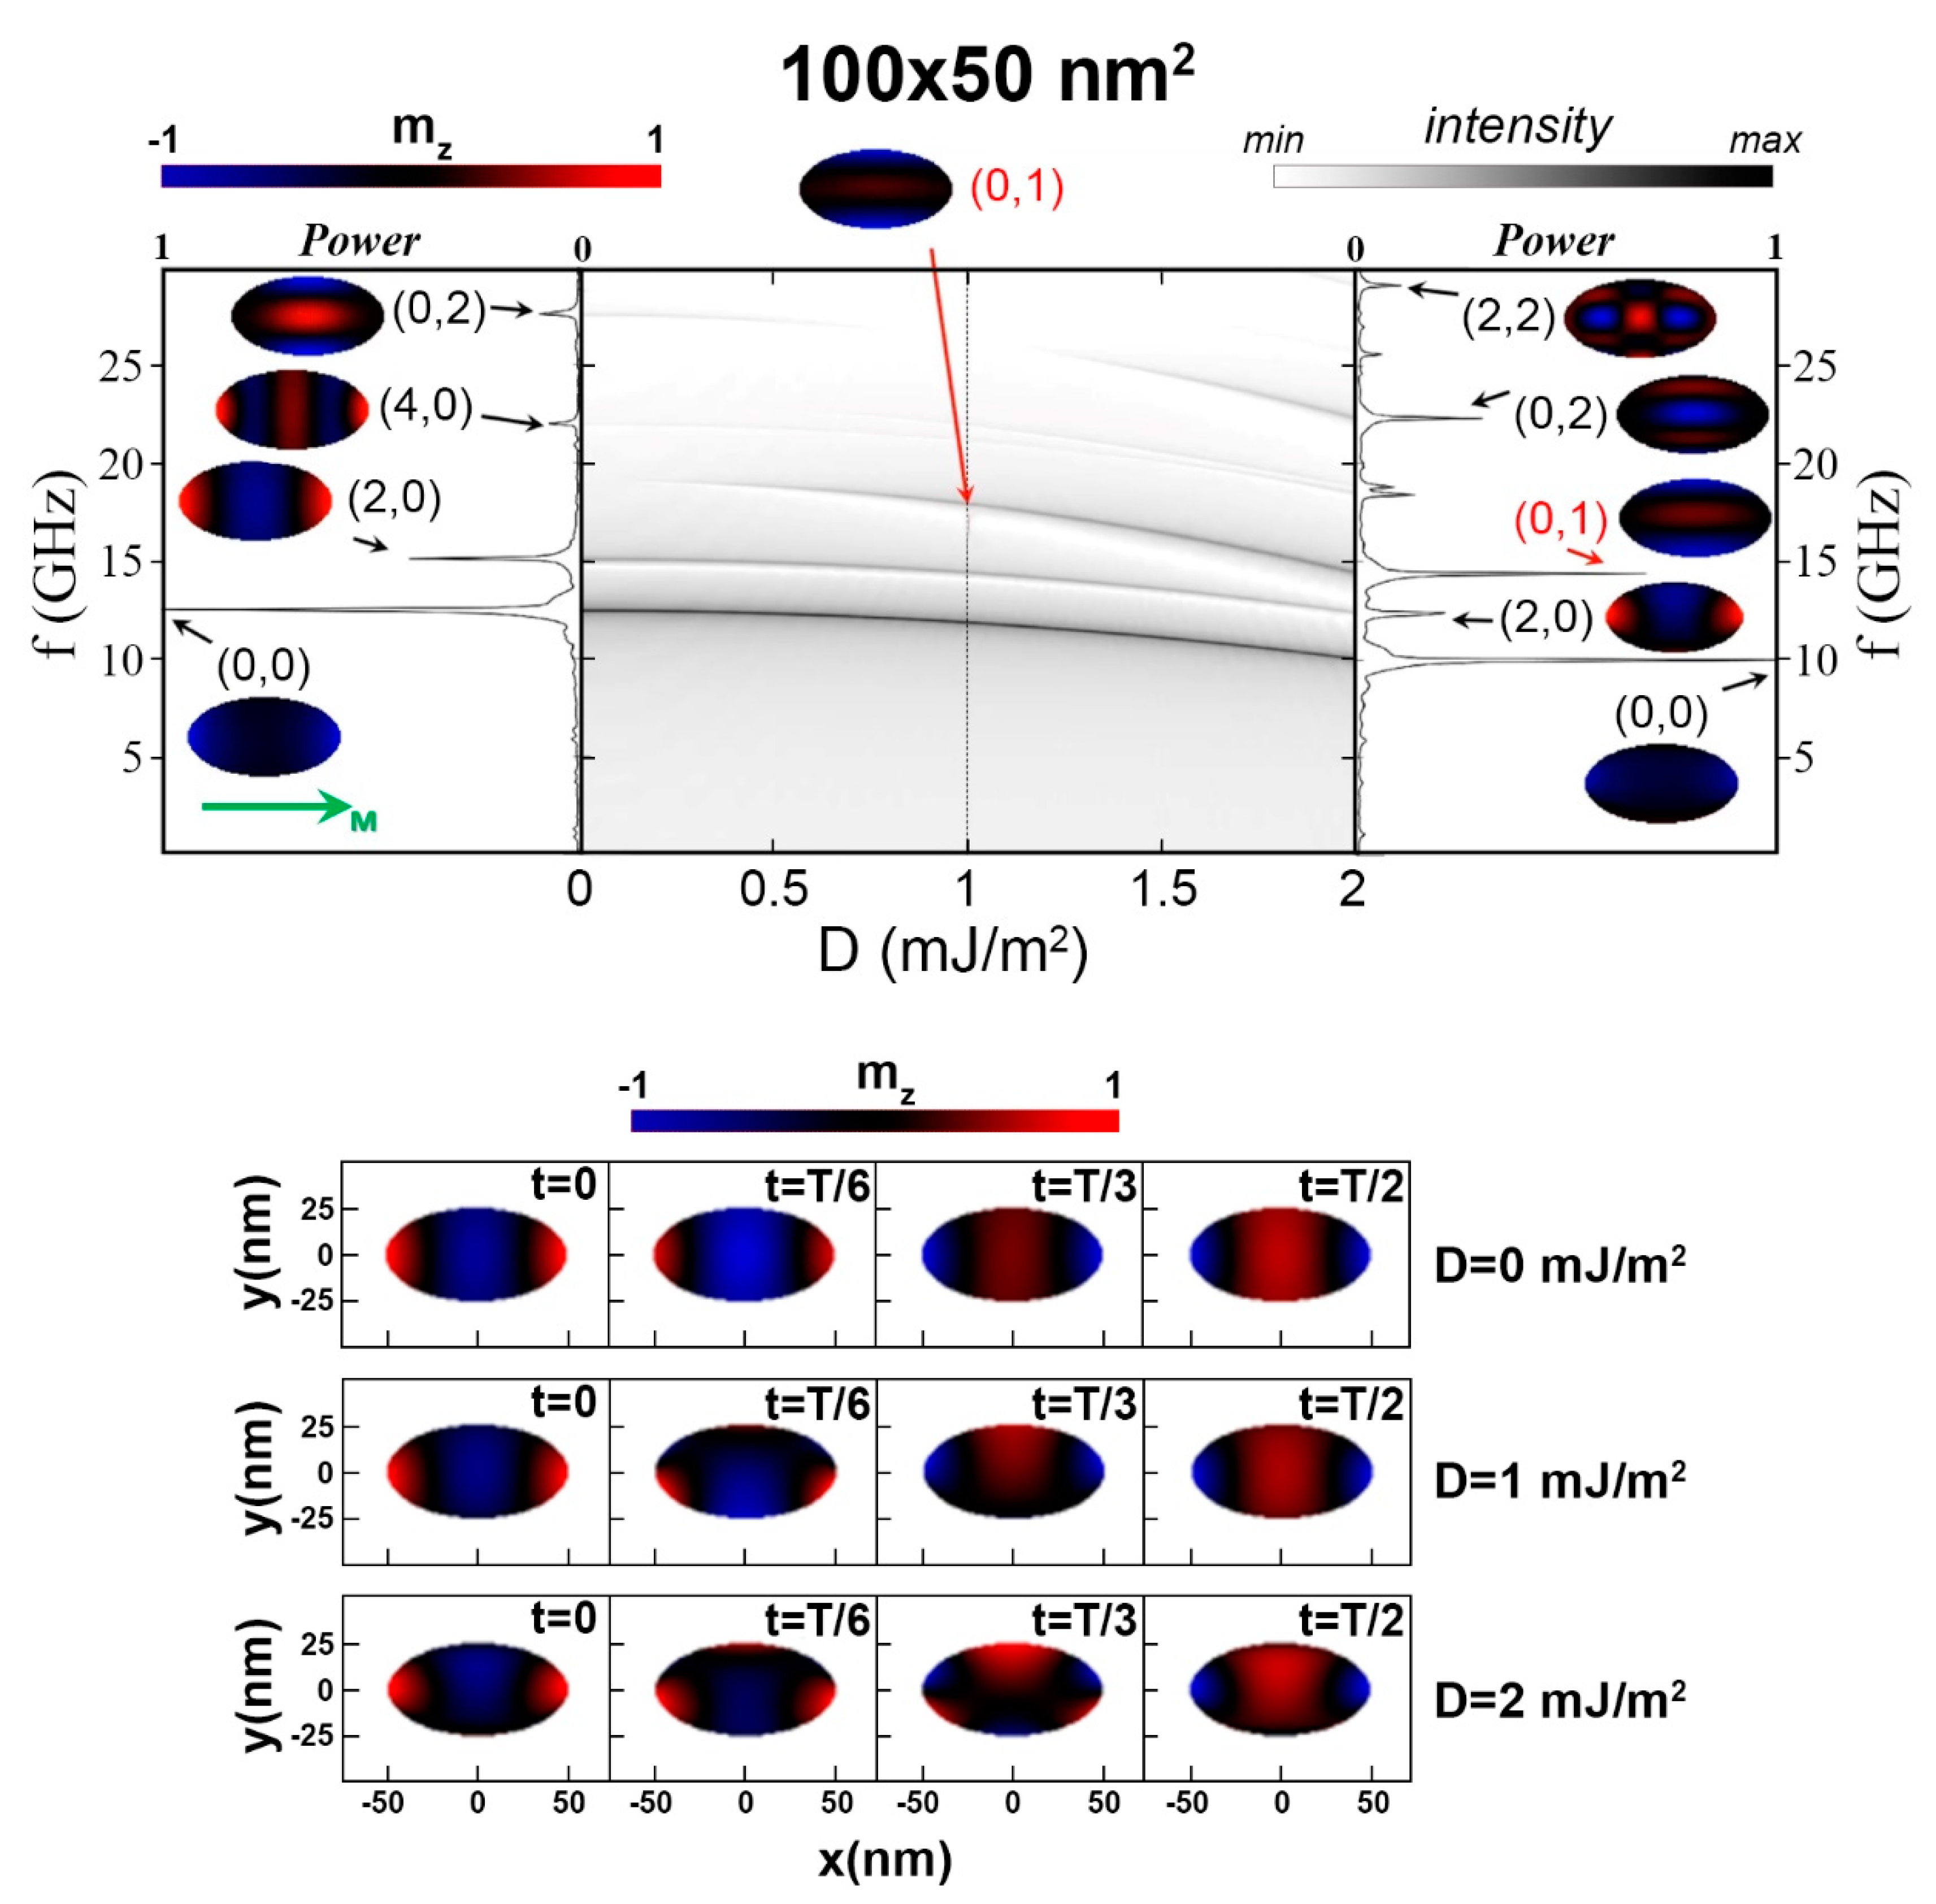
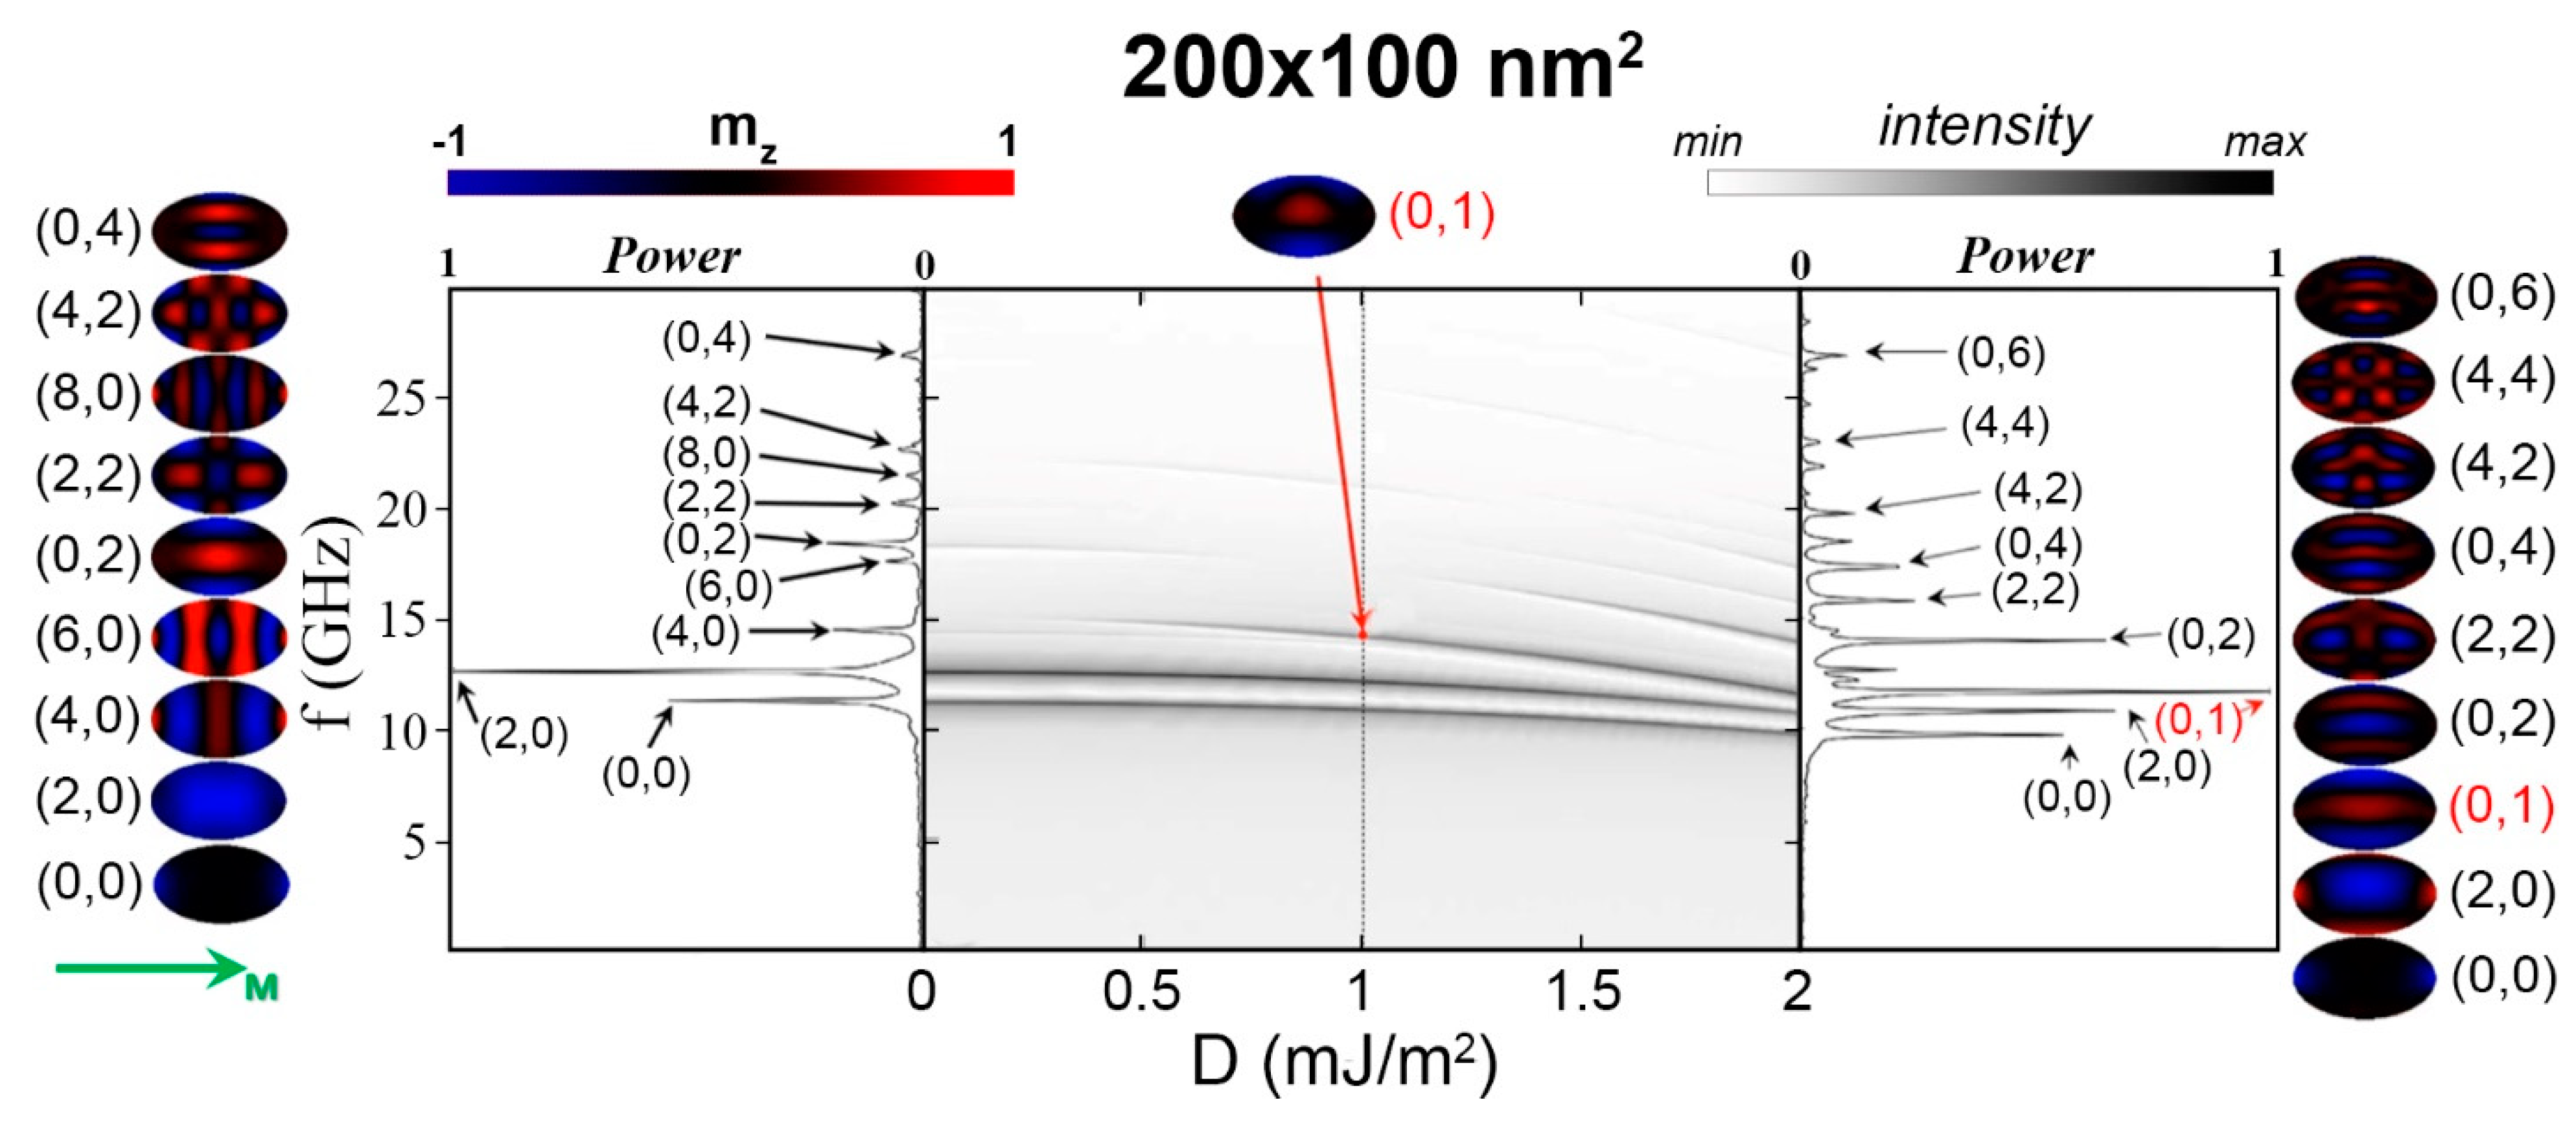
3.2. Eigenmode of Isolated Elliptical Nanodots

Let us now consider the more complicated case of elliptical nanodots, which, different from the wires discussed above, are laterally confined in both in-plane directions. For such case, we adopt the classification and the labelling scheme of the eigenmodes of magnetic nanodots that have been described in a recent review paper [30]: each mode is labelled with two integer indices (nx,ny) whose values correspond to the number of nodal lines perpendicular or parallel to the direction of the magnetization (x axis), respectively. In Figure 3 one can see the results of our simulations relative to the smallest dots considered in this study, having lateral dimensions 100 × 50 nm2. The central panel shows the evolution of the mode frequencies as a function of D, while in the left- and right-hand panels one finds the intensity spectra where each peak corresponds to the mode whose bidimensial spatial profile is shown in color scale. In this first approach we limit our analysis to the range of D between 0 and 2 mJ/m2, i.e., a range of values that are easily accessible in real samples [19].
In absence of DMI, the (0,0) mode, characterized by the absence of any nodal line, is by far the most intense one. Therefore, it is called the “fundamental” mode, although magnetostatic effects appear in the fact that the mode amplitude is mainly localized at the edges, where the demagnetizing field is relatively strong and the dynamic amplitude is larger than elsewhere. Similar to the case of the stripes, the odd mode (0,1) is completely absent in the spectra calculated for D = 0, but it starts to appear for finite values of D and becomes very intense, i.e., comparable with the fundamental mode (0,0), for D = 2 mJ/m2.
Again, the reason for this marked modification of the intensity of different modes in the spectra is the fact that the presence of DMI leads to a progressive loose of stationary character along the y direction and the appearance of a finite net dynamical magnetic moment for odd modes. This can be appreciated also in the bottom panel of Figure 3, where we show the temporal evolution of the mode (2,0) at different times. For D = 0 it exhibits a clear stationary character, with two nodal lines perpendicular to the static magnetization. Instead for D = 1 and 2 mJ/m2, it is visible a continuous shift of the profile along the y direction, i.e., a propagative character along y. Animations where one can follow in detail the evolution of the spatial profile of the various modes as a function of time, for different intensity of the DMI, are available in the Supplemental Material. Please note that, similarly to the case of the wires, in the case of elliptical dots, the antisymmetric mode (0,1) also exhibits a larger slope than the fundamental mode (0,0), and further on, in this same section, we will discuss its softening for large values of D.
Let us now consider how the characteristics of the mode spectrum change when the lateral dimensions of the magnetic dot increase. In Figure 4 and Figure 5 we report the results relative to dots of lateral dimensions 200 × 100 nm2 and 300 × 150 nm2, respectively. First of all, one notices that the number of modes that appear in the range of frequencies up to 30 GHz rapidly increases with the lateral dimensions. For instance, for the 200 × 100 nm2 dots one finds more than ten eigenmodes, i.e., about twice the number of modes observed in the smallest dots as well as in the 100 nm wide wires studied in the previous paragraph. Moreover, in absence of DMI the lowest mode (0,0) tends to be much more localized at the dot edges if compared to the case of the smallest dots, so that it loses its “fundamental” character, being replaced by the (2,0) mode. In fact, the latter is characterized by a maximum amplitude in the central region of the dot and presents the largest average dynamical magnetization, as seen in the calculated spectra plotted in the left-hand side of Figure 4 and Figure 5. However, also for the larger dots when the value of D is lifted from zero, the frequencies of all the modes decrease and the odd (0,1) mode becomes visible. The latter actually becomes the most intense peak in the spectrum, overcoming the (2,0) mode, as D approaches the value of 2 mJ/m2, as shown in the spectra on the right-hand side of Figure 4 and Figure 5.
Finally, let us extend the analysis of the frequency evolution of the eigenfrequencies to large values of D, in order to cross check also in the case of the elliptical dots the softening associated to the transition to a chiral ground state. Figure 6 presents the calculated frequencies for D ranging up to 5 mJ/m2 for the elliptical dots with different lateral dimensions. One finds a behavior that is similar to what observed for the wires, although in this case the mode softening occurs at relatively larger values of D. The slope of curve corresponding to the first odd mode (1,0) is clearly steeper than that of the corresponding curves of the low-frequency (0,0) and (0,2) modes. Therefore, mode-crossing is observed around D = 3 mJ/m2 and then the frequency of the soft mode approaches zero for a value of D just above 4 mJ/m2. Actually, this specific value of D is about 4.3 mJ/m2 in the smallest dots and somehow smaller for the larger dots, reflecting the different effective fields inside the dots related to their lateral dimensions. For larger values of D, the ground state undergoes a transition to a chiral non-uniform state and the dynamics becomes very complex, so the spectrum is completely changed.
To conclude, let us notice and interesting aspect connected with the eigenmodes intensity at relatively large values of D, which is easily seen in Figure 6. As D overcomes the values of about 2 mJ/m2, there is a clear evolution of the modes intensity. In particular, one sees that the character of “fundamental mode”, i.e., the largest intensity, is not anymore related to the (0,0) or (2,0) modes at lower frequencies. Rather, one finds that modes with relatively high-order assume a considerable intensity, while the soft mode at low frequency becomes less intense. For instance, for D between 3.5 and 4 mJ/m2 the spectrum is dominated by modes between 15 and 20 GHz. Such a lift of the frequency of the modes with the largest intensity under external excitation by a uniform field pulse for large values of D could be in principle exploited to achieve high-frequency operation in devices exploiting ferromagnetic resonance or microwave-assisted switching of magnetic dots.

4. Conclusions

In conclusion, we have analyzed, by micromagnetic simulations based on the GPU-accelerated software MuMax3, the effect of DMI on the characteristics of the spin waves spectrum of magnetic nanoelements magnetized in-plane, 1.5 nm thick: isolated stripes of width 100 nm and elliptical dots with lateral dimensions of 100 × 50, 200 × 100 and 300 × 150 nm2. The eigenmodes spectrum of the above-mentioned nanostructures is appreciably modified by the DMI-induced non-reciprocity in spin-waves propagation: the frequencies of the eigenmodes are red-shifted and their spatial profiles appreciably altered due to the lack of stationary character in the direction orthogonal to the magnetization direction. As a consequence, even for values of D between 1 and 2 mJ/m2, easily achievable in real samples, one finds important modifications in the frequency position and in the cross-section of the different modes of the spectra. For instance, the (0,1) antisymmetric mode of elliptical dot would remain invisible without DMI, while it would be the most intense for D as large as 2 mJ/m2. Moreover, we found that if one further increases the value of D above 3 mJ/m2, the low frequency antisymmetric mode becomes soft, reflecting the transition of the ground state from uniform state to a chiral one with opposite chirality at the borders. We are confident that the results of this theoretical study will stimulate the realization of ferromagnetic resonance or Brillouin light scattering experiments on real samples, which are still lacking in the literature, aimed at verifying our theoretical predictions and achieving a quantitative comprehension of the effect of DMI on the dynamical properties of nanostructured samples, paving the way to their exploitation in spintronic devices.

Supplementary Materials

The video animations of the eigenmodes for the stripes and the dots are available online at this link: https://doi.org/10.5281/zenodo.4540983 (accessed on 15 February 2021).

Author Contributions

Conceptualization, methodology and investigation, writing—review and editing, visualization, R.S., M.A., S.T., and G.C.; software, data curation, R.S. and M.A.; supervision and project administration, funding acquisition, G.C. and S.T. All authors have read and agreed to the published version of the manuscript.

Funding

This project 17FUN08 TOPS has received funding from the EMPIR programme co-financed by the Participating States and from the European Union’s Horizon 2020 research and innovation programme.

Institutional Review Board Statement

Not applicable.

Informed Consent Statement

Not applicable.

Data Availability Statement

The data presented in this study are openly available in Zenodo at https://doi.org/10.5281/zenodo.4629664 (accessed on 15 February 2021).

Conflicts of Interest

The authors declare no conflict of interest.

References

  1. Dzyaloshinsky, I. A thermodynamic theory of “weak” ferromagnetism of antiferromagnetics. J. Phys. Chem. Solids 1958, 4, 241–255. [Google Scholar] [CrossRef]
  2. Moriya, T. New Mechanism of Anisotropic Superexchange Interaction. Phys. Rev. Lett. 1960, 4, 228–230. [Google Scholar] [CrossRef]
  3. Kashid, V.; Schena, T.; Zimmermann, B.; Mokrousov, Y.; Blügel, S.; Shah, V.; Salunke, H.G. Dzyaloshinskii-Moriya interaction and chiral magnetism in 3d−5d zigzag chains: Tight-binding model and ab initio calculations. Phys. Rev. B 2014, 90, 054412. [Google Scholar] [CrossRef] [Green Version]
  4. Yang, H.; Thiaville, A.; Rohart, S.; Fert, A.; Chshiev, M. Anatomy of Dzyaloshinskii-Moriya Interaction at Co/Pt In-terfaces. Phys. Rev. Lett. 2015, 115, 267210. [Google Scholar] [CrossRef]
  5. Belabbes, A.; Bihlmayer, G.; Bechstedt, F.; Blügel, S.; Manchon, A. Hund’s Rule-Driven Dzyaloshinskii-Moriya Interaction at 3d−5d Interfaces. Phys. Rev. Lett. 2016, 117, 247202. [Google Scholar] [CrossRef] [Green Version]
  6. Boulle, O.; Vogel, J.; Yang, H.; Pizzini, S.; Chaves, D.D.S.; Locatelli, A.; Menteş, T.O.; Sala, A.; Buda-Prejbeanu, L.D.; Klein, O.; et al. Room-temperature chiral magnetic skyrmions in ultrathin magnetic nanostructures. Nat. Nanotechnol. 2016, 11, 449–454. [Google Scholar] [CrossRef] [Green Version]
  7. Khan, R.A.; Nembach, H.T.; Ali, M.; Shaw, J.M.; Marrows, C.H.; Moore, T.A. Magnetic domain texture and the Dzyaloshinskii-Moriya interaction in Pt/Co/IrMn and Pt/Co/FeMn thin films with perpendicular exchange bias. Phys. Rev. B 2018, 98, 064413. [Google Scholar] [CrossRef] [Green Version]
  8. Soucaille, R.; Belmeguenai, M.; Torrejon, J.; Kim, J.-V.; Devolder, T.; Roussigné, Y.; Chérif, S.-M.; Stashkevich, A.A.; Hayashi, M.; Adam, J.-P. Probing the Dzyaloshinskii-Moriya interaction in CoFeB ultrathin films using domain wall creep and Brillouin light spectroscopy. Phys. Rev. B 2016, 94, 104431. [Google Scholar] [CrossRef] [Green Version]
  9. Vaňatka, M.; Rojas-Sánchez, J.-C.; Vogel, J.; Bonfim, M.; Belmeguenai, M.; Roussigné, Y.; Stashkevich, A.; Thiaville, A.; Pizzini, S. Velocity asymmetry of Dzyaloshinskii domain walls in the creep and flow regimes. J. Physics: Condens. Matter 2015, 27, 326002. [Google Scholar] [CrossRef] [PubMed]
  10. Di, K.; Zhang, V.L.; Lim, H.S.; Ng, S.C.; Kuok, M.H.; Yu, J.; Yoon, J.; Qiu, X.; Yang, H. Direct observation of the Dzyaloshinskii-Moriya interaction in a Pt/Co/Ni film. Phys. Rev. Lett. 2015, 114, 047201. [Google Scholar] [CrossRef] [PubMed]
  11. Nembach, H.T.; Shaw, J.M.; Weiler, M.; Ju’e, E.; Silva, T.J. Linear relation between Heisenberg exchange and interfacial Dzyaloshinskii–Moriya interaction in metal films. Nat. Phys. 2015, 11, 825. [Google Scholar] [CrossRef]
  12. Chaurasiya, A.K.; Banerjee, C.; Pan, S.; Sahoo, S.; Choudhury, S.; Sinha, J.; Barman, A. Direct Observation of Interfacial Dzyaloshinskii-Moriya Interaction from Asymmetric Spin-wave Propagation in W/CoFeB/SiO2 Heterostructures Down to Sub-nanometer CoFeB Thickness. Sci. Rep. 2016, 6, 32592. [Google Scholar] [CrossRef] [PubMed] [Green Version]
  13. Tacchi, S.; Troncoso, R.E.; Ahlberg, M.; Gubbiotti, G.; Madami, M.; Åkerman, J.; Landeros, P. Interfacial Dzyaloshinskii-Moriya Interaction in Pt/CoFeB Films: Effect of the Heavy-Metal Thickness. Phys. Rev. Lett. 2017, 118, 147201. [Google Scholar] [CrossRef] [PubMed] [Green Version]
  14. Belmeguenai, M.; Gabor, M.S.; Roussigńe, Y.; Petrisor, T.; Mos, R.B.; Stashkevich, A.; Chérif, S.M.; Tiusan, C. Interfacial Dzyaloshinskii-Moriya interaction sign in Ir/Co2FeAl systems investigated by Brillouin light scattering. Phys. Rev. B 2018, 97, 054425. [Google Scholar] [CrossRef] [Green Version]
  15. Bouloussa, H.; Yu, J.; Roussigné, Y.; Belmeguenai, M.; Stashkevitch, A.; Yang, H.; Cherif, S.M.; Mohamed, B.; Stachkevich, A. Brillouin light scattering investigation of interfacial Dzyaloshinskii–Moriya interaction in ultrathin Co/Pt nanostripe arrays. J. Phys. D Appl. Phys. 2018, 51, 225005. [Google Scholar] [CrossRef]
  16. Chen, Y.; Zhang, Q.; Jia, J.; Zheng, Y.; Wang, Y.; Fan, X.; Cao, J. Tuning Slonczewski-like torque and Dzyaloshinskii–Moriya interaction by inserting a Pt spacer layer in Ta/CoFeB/MgO structures. Appl. Phys. Lett. 2018, 112, 232402. [Google Scholar] [CrossRef]
  17. Kim, G.W.; Samardak, A.S.; Kim, Y.J.; Cha, I.H.; Ognev, A.V.; Sadovnikov, A.V.; Nikitov, S.A.; Kim, Y.K. Role of the Heavy Metal’s Crystal Phase in Oscillations of Perpendicular Magnetic Anisotropy and the Interfacial Dzyaloshinskii-Moriya Interaction in W/Co−Fe−B/MgO Films. Phys. Rev. Appl. 2018, 9, 064005. [Google Scholar] [CrossRef]
  18. Gallardo, R.A.; Cortés-Ortuño, D.; Troncoso, R.E.; Landeros, P. Spin-waves in thin films and magnonic crystals with Dzyaloshinskii-Moriya interactions. In Three-Dimensional Magnonics: Layered, Micro- and Nanostructures; Gubbiotti, G., Ed.; Jenny Stanford Publishing, Pte. Ltd.: Singapore, 2019; pp. 121–160. [Google Scholar]
  19. Kuepferling, M.; Casiraghi, A.; Soares, G.; Durin, G.; Garcia-Sanchez, F.; Chen, L.; Back, C.H.; Marrows, C.H.; Tacchi, S.; Carlotti, G. Measuring interfacial Dzyaloshinskii-Moriya interaction in magnetic ultra thin films. arXiv 2020, arXiv:2009.11830. [Google Scholar]
  20. Ma, F.; Zhou, Y. Interfacial Dzialoshinskii–Moriya interaction induced nonreciprocity of spin waves in magnonic waveguides. RSC Adv. 2014, 4, 46454–46459. [Google Scholar] [CrossRef] [Green Version]
  21. Garcia-Sanchez, F.; Borys, P.; Vansteenkiste, A.; Kim, J.V.; Stamps, R.L. Nonreciprocal spin-wave channeling along textures driven by the Dzyaloshinskii-Moriya interaction. Phys Rev. B 2014, 89, 224408. [Google Scholar] [CrossRef] [Green Version]
  22. Mruczkiewicz, M.; Krawczyk, M. Influence of the Dzyaloshinskii-Moriya interaction on the FMR spectrum of magnonic crystals and confined structures. Phys. Rev. B 2016, 94, 024434. [Google Scholar] [CrossRef] [Green Version]
  23. Zingsem, B.W.; Farle, M.; Stamps, R.L.; Camley, R.E. Unusual nature of confined modes in a chiral system: Directional transport in standing waves. Phys. Rev. B 2019, 99, 214429. [Google Scholar] [CrossRef] [Green Version]
  24. Lee, S.-J.; Moon, J.-H.; Lee, H.-W.; Lee, K.-J. Spin-wave propagation in the presence of inhomogeneous Dzyaloshinskii-Moriya interactions. Phys. Rev. B 2017, 96, 184433. [Google Scholar] [CrossRef]
  25. Gallardo, R.A.; Cortés-Ortuño, D.; Schneider, T.; Roldán-Molina, A.; Ma, F.; Troncoso, R.E.; Lenz, K.; Fangohr, H.; Lindner, J.; Landeros, P. Flat Bands, Indirect Gaps, and Unconventional Spin-Wave Behavior Induced by a Periodic Dzyaloshinskii-Moriya Interaction. Phys. Rev. Lett. 2019, 122, 067204. [Google Scholar] [CrossRef] [Green Version]
  26. Chumak, A.V.; Vasyuchka, V.I.; Serga, A.A.; Hillebrands, B. Magnon spintronics. Nat. Phys. 2015, 11, 453–461. [Google Scholar] [CrossRef]
  27. Vansteenkiste, A.; Leliaert, J.; Dvornik, M.; Helsen, M.; Garcia-Sanchez, F.; Van Waeyenberge, B. The design and verification of MuMax3. AIP Adv. 2014, 4, 107133. [Google Scholar] [CrossRef] [Green Version]
  28. Montoncello, F.; Giovannini, L.; Nizzoli, F.; Vavassori, P.; Grimsditch, M. Dynamic origin of first and second order phase transitions in magnetization reversal of elliptical nanodots. Phys. Rev. B 2008, 77, 214402. [Google Scholar] [CrossRef]
  29. Montoncello, F.; Giovannini, L.; Nizzoli, F.; Vavassori, P.; Grimsditch, M.; Ono, T.; Gubbiotti, G.; Tacchi, S.; Carlotti, G. Soft spin waves and magnetization reversal in elliptical Permalloy nanodots: Experiments and dynamical matrix results. Phys. Rev. B 2007, 76, 024426. [Google Scholar] [CrossRef]
  30. Carlotti, G. Pushing down the lateral dimension of single and coupled magnetic dots to the nanometric scale: Characteristics and evolution of the spin-wave eigenmodes. Appl. Phys. Rev. 2019, 6, 031304. [Google Scholar] [CrossRef]
Figure 1. Sketch of the isolated nanoelements and of the reference frame considered in the present study: long wires and elliptical dots magnetized in-plane along the easy direction, coincident with the x-axis. The z-axis is perpendicular to the plane.
Applsci 11 02929 g001
Figure 2. Top panel: dependence of the frequencies of the spin wave eigenmodes on the Dzyaloshinskii–Moriya interaction (DMI) constant D for the wire of width w = 100 nm. The animations with the movies of the dynamics of the main modes for several values of D, corresponding to the red points in the central panel, are available in the Supplemental Material. On the left-hand side, the intensity spectra corresponding to D = 0 are reported, together with a snapshot of the spatial profile of the dynamical magnetization. Bottom panel: representation of the unitary vector of the magnetization of each discrete cell of the wire across the wire width. It is seen that the magnetization of the discretized cells is aligned along the x-direction (easy axis), but for D = 4 mJ/m2 the magnetization distribution exhibits a chiral state close to the left and right edges, where it is not anymore aligned along the x-direction, as it is in the central region of the wire.
Applsci 11 02929 g002
Figure 3. Top central panel: dependence of the frequencies of the spin wave eigenmodes on the DMI constant D for the elliptical dot of lateral dimensions 100 × 50 nm2. On the left- and right-hand sides, the intensity spectra corresponding to D = 0 and 2 mJ/m2 are reported, respectively, together with the color insets that represent the spatial profile of the dynamical magnetization, expressed as the product of the modulus of the dynamical magnetization by the sign of its phase. Bottom panel: spatial profile of the mode (2,0) plotted at different times during the period T, for three different values of D. The animations with the movies of the dynamics of all the modes for several values of D are available in the Supplemental Material.
Applsci 11 02929 g003
Figure 4. Central panel: dependence of the frequencies of the spin wave eigenmodes on the DMI constant D for the elliptical dot of lateral dimensions 200 × 100 nm2. On the left- and right-hand sides, the intensity spectra corresponding to D = 0 and 2 mJ/m2 are reported, respectively, together with the color insets that represent the spatial profile of the dynamical magnetization, expressed as the product of the modulus of the dynamical magnetization by the sign of its phase. The animations with the movies of the dynamics of all the modes for several values of D are available in the Supplemental Material.
Applsci 11 02929 g004
Figure 5. Central panel: dependence of the frequencies of the spin wave eigenmodes on the DMI constant D for the elliptical dot of lateral dimensions 300 × 150 nm2. On the left- and right-hand sides, the intensity spectra corresponding to D = 0 and 2 mJ/m2 are reported, respectively, together with the color insets that represent the spatial profile of the dynamical magnetization, expressed as the product of the modulus of the dynamical magnetization by the sign of its phase. The animations with the movies of the dynamics of all the modes for several values of D are available in the Supplemental Material.
Applsci 11 02929 g005
Figure 6. Dependence of the frequencies of the spin wave eigenmodes on the DMI constant D for the elliptical dot of lateral dimensions 100 × 50 nm2 (a), 200 × 100 nm2 (b), 300 × 150 nm2 (c). It is seen that the frequency of the (0,1) mode decreases more rapidly that the two lower modes, so mode crossing is observed for D around 3 mJ/m2 and then the mode becomes soft, driving the transition to a non-uniform chiral ground state.
Applsci 11 02929 g006
Publisher’s Note: MDPI stays neutral with regard to jurisdictional claims in published maps and institutional affiliations.

