Abstract
Shift-scheduling calibration of automatic transmission (AT) vehicles is vital for both driving experience and automobile industry. Shifting schedules are usually calibrated with the consideration of fuel economy and drivability while neglecting the individual driving preference. In this work, we propose to exemplify the individual shifting preference by integrating the manual transmission (MT) shifting habit into the AT shift-scheduling calibration, where the habit is reflected as the shifting points and is available in most automated manual transmission (AMT) vehicles. The automated calibration of AT shifting schedules is directed by using the particle swarm optimization (PSO), during the virtual automobile cycle test, i.e., FTP-72. Candidate shifting-schedules are generated in the overlapped zone of MT shifting points and the space around the base map, and are evaluated on both shifting quality and fuel economy. Through iterations, the generated candidate shift schedules are tested and assessed until the overall performance reach the optimum. Experimental results are presented to show the effectiveness of the proposed method, which retains the shifting preferences as well as enhances the performance index by about 5%, 4%, and 2% for the drivers with aggressive, moderate, and mild styles, respectively.
1. Introduction
Calibration of shift-scheduling is an important part of automobile industry to enhance the customer experience. As described in [1], shifting schedule has great influence on both the fuel economy and drivability. Thus, in the real-world development process, a careful trade-off must be made between the fuel economy and drivability to obtain the best combination for the shifting schedules. Traditionally, the calibration is implemented by human experts, which requires considerable time and effort but lacks the consideration of individual driving preference. Therefore, it is promising to utilize a virtual/robot driver to reserve manual preferences and fulfill most of the calibration task, and enhance the working efficiency of human experts.
The shift-scheduling is calibrated in order to achieve high-performance in both fuel economy and shifting quality, hence the calibration task could be formulated as a goal-directed optimization process. Currently, most default shift schedules in AT (automatic transmission) represent the average AT driver, where the parameters might be fixed and lack personal preference. Thus, from the perspective of customer experience, it is necessary and changeling to integrate the manual transmission (MT) driving preferences into the AT shift-scheduling calibration, in which the robot driver is built to mimic the real MT drivers’ maneuvers.
Automatic transmissions have been democratizing progressively over the last years, and resultantly, the optimization of shift-scheduling calibration is attracting more and more research attention [2]. Conventionally, the fuel-economy-oriented scheme in designing shift map is aimed at deciding shifting points to obtain optimum fuel consumption based on the engine efficiency diagram. Kamyar Nikzadfar et al. [3] employed the multi-objective grid search method to find the best gear-shifting solutions with the restrictions on the engine operation region in the engine brake-specific fuel consumption (BSFC) map. Damien Le Guen et al. [4] combined the AVL CRUISE™ and CRUISE GSP to execute the gear-shift pattern optimization based on engine BSFC and emission maps. Jony Javorski Eckert et al. [5] elaborated the gear-shifting optimization on the basis of engine torque and power by means of co-simulation between the multibody dynamics software AdamsTM and MatlabTM/SimulinkTM. Chinmay Kirtane et al. [6] developed a mathematical dynamic vehicle model integrated in in the MatlabTM based transmission platform to optimize the gear-shift schedules considering optimal vehicle acceleration and fuel economy. To maintain the equilibrium of the hybrid dynamical vehicle systems, the Lyapunov arguments were adopted in order to guarantee the engine torque demand [7].
Moreover, there emerged many artificial intelligence (AI)-based techniques for the shift-scheduling calibration and optimization. A fuzzy neural network was established to learn the driver’s experience and simulate the shift schedule of the automatic transmission (AT) vehicle [8]. Genetic algorithm (GA)-based gear shift optimization was adopted for the overall efficiency enhancement of electric vehicles [9]. Yonggang Liu et al. developed a fuzzy-logic-based intelligent correction method for shift schedules with regard to different driving conditions [10]. Dynamic-programming-based methods were deployed to find the optimum trade-off between the vehicle drivability and the fuel economy [11]. Tobias Nuesch et al. [12] proposed a combinational model on the basis of convex optimization and dynamic programming. The gear shift map is automatically processed by employing the bionic-based optimization in [13]. Ren He et al. [14] expounded a gear shifting indication system where the interval algorithm and genetic algorithm were adopted to achieve least fuel consumption and shift frequency reduction. A rule-based torque split scheme along with the robust-control-based gear shifting technique were proposed to accommodate the fuzzy driving intention [15]. The transmission kinematics and the calculus of variations were exploited to find the schedules for a swift, seamless operation [16]. A dynamic programming algorithm modified by the gear shift penalty factor is proposed to obtain the optimal shift strategy [17]. To optimize and accelerate the shift schedule design process, Cheng Lin et al. [18] developed a systematic blending extraction method based on k-means and dynamic programming. The aforementioned and unmentioned works have obtained remarkable achievements in the field of shift-scheduling optimization and calibration. However, the MT driving preferences was often neglected in the AT shift schedule calibration.
The main technical contribution of this paper lies in the following aspects. We proposed an effective way to integrate the MT driving preferences into the automated calibration of AT shifting schedules while reducing the labor burden and achieving satisfied performance in shift quality as well as fuel economy. This could be realized by means of personalized driver model and the bionic-based particle swarm optimization (PSO). The results manifest that the calibrated shifting schedules could not only retain the driving preference but also lead to higher shift quality and better fuel economy.
The remainder of this paper is organized as follows. Section 2 gives a brief introduction of methodologies including particle swarm optimization (PSO), Wasserstein distance (WD), Kolmogorov-Smirnov test, personalized driver modeling, and AT vehicle modeling. Section 3 introduces the proposed scheme for driving preference integration and shift-scheduling calibration. Numerical experiments are presented in Section 4. Conclusions and future work are given in the final section.
2. Related Work
Particle swarm optimization (PSO) is utilized to guide the shift-scheduling calibration process and personalized driver models are employed to equip the robot driver models with MT driving preferences. For the sake of simplicity, an AT vehicle model (ATVM) is established to make possible the calibration tasks of candidate schedules. Internal consistency of MT shifting behaviors from raw data and the calibrated shift behaviors are checked and confirmed before the driving preferences are analyzed in depth. The Wasserstein distance (WD) and the Kolmogorov–Smirnov (KS) tests are adopted in this paper to fulfil the task.
2.1. Particle Swarm Optimization (PSO)
PSO is a population based stochastic optimization technique proposed by Kennedy [19] in 1995. In PSO, each single solution is a ‘bird’ in the search space, which is called ‘particle’. The system is initialized with a population of random particles and searches for optima by updating generations according to a certain fitness function. The movement of each particle is determined by comparing the positions with best fitness functions in its topological neighborhood with its own. The swarm is supposed to obtain the optimum solutions through iterations [20].
The detailed PSO algorithm could be formularized as following steps,
- Generate a number of particles, . Each individual in the particle swarm has a position vector of d dimensions.
- With regard to the ith individual .
If the current fitness outperforms the individual best fitness, then the present position vector will be assigned as its individual best position, .
If its current fitness is better than the global best fitness, then the current position is assigned as the global best position, .
- 3.
- For particle , the velocity and position are updated according to the following rules:where w is the weight factor, l and g are the velocity parameters, and t is the number of iteration.
- 4.
- When the termination requirements are satisfied, stop the optimization; otherwise, repeat the previous steps.
2.2. Wasserstein Distance (WD)
Inspired by the optimal transportation problem, Wasserstein distance (WD) is used to measure the least cost in reconfiguring one probability distribution into another one. Irpino and Verde [21] proposed some WD-based techniques to obtain more specific characteristics of the distribution, i.e., shape, location, and scale. On account of the satisfying performance in quantifying the heterogeneity of probability distributions, the WD is widely adopted in machine learning [22].
Take the univariate distributions for example. Given a univariate distribution Y, which is described by histograms, density, or quantile functions. Assume is the observations for the ith histogram of Y. The density function of is denoted as , the cumulative distribution function (cdf) of is and the inverse of cdf is . Then, according to Rüschendorf [23], the WD of two univariate distributions is defined as,
where , and are the inverse of cdfs of and , respectively. When , the WD is defined as,
If is the empirical distribution of a dataset, then the distance could be rewrite in a simpler form:
where is the length of the data samples. In order to reduce the computational burden, the WD is employed in this work.
2.3. Kolmogorov-Smirnov Test
The Kolmogorov–Smirnov (KS) test is an efficient approach to test the hypothesis about the distribution of a population [24]. For example, it could be employed to determine if two samples come from the same distribution. The two-sample KS test is a non-parametric hypothesis test that quantifies the distance between the cumulative distribution functions (cdfs) of the samples. The null hypothesis states that there is no difference between the two distributions.
The test uses the maximum absolute difference between the cdfs of the distributions of the two data samples, which is given by the following equation,
where is a vector, which denotes the observations from the first sample, and is the cdf of it. The null hypothesis is accepted if the calculated value is less than the critical value and vice-versa, which means the distributions of two samples have no difference.
2.4. Driver Model
The driver models [25], are employed to reproduce the driving habits and fulfil the driving cycle test in the calibration process. Usually, drivers behave differently in operations on gas pedals due to their preferences, showing different driving styles, which may be roughly classified into aggressive, moderate, and mild [26]. However, most of the current AT shift-scheduling calibrations lack the consideration of individual preference, thus it is meaningful to exemplify the driving preferences by integrating the drivers’ maneuvering habits into the calibration.
Based on our previous work, driving styles could be reserved and imitated by the personalized virtual driver models based on the real-world vehicle test data (VTD) [26]. Provided by the Ford Motor Company, VTD is consistently collected via CAN bus data-loggers, i.e., the Kvaser. The VTD includes different driving styles (aggressive, moderate and mild), road types (city and highway), and vehicle types (MT and AT). Many quantities are involved in VTD, such as throttle position (TP), brake pressure (BP), vehicle speed (VS), engine speed (ES), gear (G), and so on. Traditionally, the experts of the Ford Company labeled the driving styles of different driver mainly based on the amplitudes of operations on gas pedals and brake pedals. More recent research proposed many other methods to categorize driving styles, i.e., the averaged energy spectrum density [26], which is employed in this work.
Figure 1 illustrates the block diagram of driver modeling and vehicle modeling. For the sake of simplicity, only TP, BP, and the corresponding VS are considered for driver modeling. The driver models are built by means of the partly connected multi-layer perception (PCMLP) due to its good performance on training data with drastic variations such as VTD. The model is trained by the error-backpropagation algorithm. The parameters of PCMLP in this work are as follows: The input variables are partitioned into 300 domains, the number of hidden units between neighbor subnets are set as 2, each subspace has 7 hidden units, and no hash-coding is employed [25].
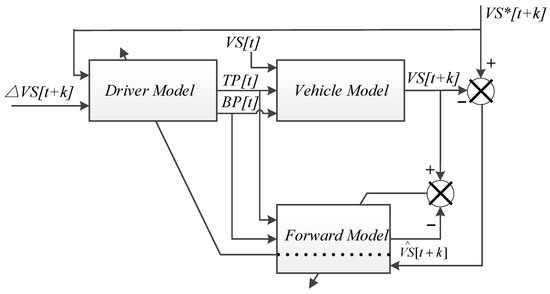
Figure 1.
Block diagram of driver modeling [25].
Totally, 240 MT driving data samples of 12 drivers (20 samples for each driver) collected from the Focus 1.6 L are used, with a time resolution of 0.12 s and a total time of more than 2 h for each sample.
2.5. Automatic Transmission Vehicle Model (ATVM)
The vehicle (model) is of great importance to the calibration of shift-scheduling. Considering it is more time-consuming and labor-intensive to use an actual vehicle, the data-based automatic transmission vehicle model (ATVM) is built and utilized for the shift-scheduling calibration. The calibrated shifting schedules could be further evaluated by a real vehicle or AVL-Drive to validate their performance. However, this is not the emphasis of this work.
The target vehicle under investigation in this work is the Escort (1.6 L), which is equipped with a six-speed automatic transmission (AT). The ATVM is built by means of a three-layered feed-forward neural network (FNN), i.e., the Multi-Layered Perceptron (MLP) and the vehicle test data. The FNN-based vehicle model utilized the throttle position (TP), brake pedal (BP), and gear (G) as the inputs, and outputs the vehicle speed at next time step (VS[t + 1]). The vehicle model uses a 3-7-1 structure, and the weights are tuned by using the Error Back-Propagation algorithm [25].
As illustrated in Figure 2a, the proposed vehicle model could generally produce identical vehicle speeds with the real data. Furthermore, in Figure 2b, the errors between the actual VS and model output VS are generally in an acceptable range, most of which are within (−5, 5) mph.
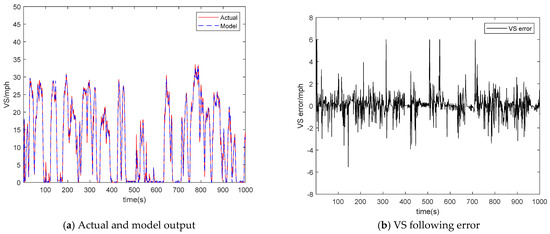
Figure 2.
Vehicle model performance. (a) Actual and the model output vehicle speed curves; (b) The error between the actual and the model output vehicle speed.
3. The Proposed Scheme for Preference Integration and Automated Shift-Scheduling Calibration
The influence of driving preferences is integrated into the robot driver via the virtual driver model. In order to guarantee the overall rationality of the shift schedules, candidate shifting schedules are generated in the overlapped zone of MT shifting points and the space around the base shift map of AT vehicle (Escort 1.6 L). Then, the calibration of shift scheduling could be expressed as an optimization task, which aims to search an optimal or near-optimal solution for the drivability and fuel economy. In consideration of the two factors, a shift performance index is proposed to make the automated calibration feasible. As a bionic-based optimization scheme, PSO is employed to direct the automated calibration optimization. By conducting calibration on all candidates, the optimal solution of shifting schedules are finally obtained.
3.1. Descriptions of Shifting Schedules and Preferences
In the AT vehicles, the shifting schedules preset in the transmission control unit could basically represent the vehicle speed at which each shift (upshift or downshift) shall occur. Several shift patterns can coexist in modern AT, where each of them could adapt to a specific driving condition (city, sport, fuel economy, uphill, downhill, etc.). The shifting schedules could be generally categorized into three types, which employ different parameters. For the single-parameter shifting schedules, the input takes only the vehicle speed, whereas the dual-parameter shifting schedules consider both the throttle position and the vehicle speed. In comparison, the dual-parameter shifting schedules are more inclusive since the driving state and the operation are both taken into account; thus, it is supposed to achieve better dynamic performance and fuel economy. The triple-parameter shifting schedules take the vehicle acceleration as the third input, which could achieve higher dynamic performance but at the cost of computational burden. Therefore, the dual-parameter shift schedule becomes the most popular and suitable strategy for the vehicle manufacture. On account of this factor, the dual-parameter strategy is adopted here.
While in the MT vehicles, there is no shift base map in the transmission control unit (TCU). The drivers could manually decide when to shift gears by cooperatively operating the clutch pedal and gas/brake pedal according to their preferences. Thus, there exists a great diversity in the behavioral operations of MT drivers during gear shifting.
The shift map contains a number of curves for upshifting and downshifting, and there is a constraint of monotonous ascending or descending. Every shift curve could be denoted by specific operation points, and every point is expressed in pairs of vehicle speed (VS) and throttle position (TP).
Examples of upshift curves for AT and MT vehicles (Focus 1.6 L and Escort 1.6 L) are illustrated by Figure 3a,b. In Figure 3b, the upshift schedules of the MT driver are roughly denoted by the dotted lines based on the raw data. The dots of different colors represent the shifting operation points of the MT driver. Obviously, the shift curves are not exactly the same for the MT driver and the AT vehicle. Based on these facts, the AT shifting schedules might not satisfy the MT drivers’ needs and preferences, and it would be uncomfortable for the MT drivers to adapt themselves to the AT vehicles. Thus, from the perspective of customer experience, it is necessary to integrate the MT shifting preferences into the shift map for AT vehicles.
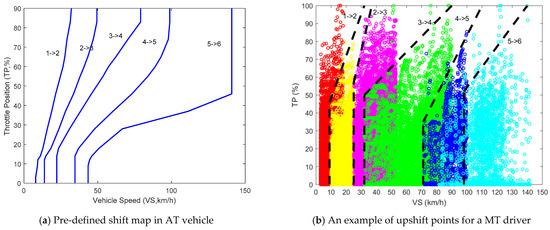
Figure 3.
Descriptions of shifting schedules. (a) Pre-defined shift map containing different upshift curves; (b) Upshift points and shift curves of MT driver.
The traditional shift-scheduling calibration is aimed to design appropriate operation points in order to achieve good fuel economy and shift quality. For the sake of convenience, the opening degrees of TP are pre-defined for the possible operation points. Thus, the shift scheduling is turned to decide the corresponding VS The shifting schedules in a six-speed AT vehicle include 5 upshift and 5 downshift curves, which could be expressed in the form of 10 shifting curves with 15 operation points on each. The default values of the upshift and downshift operation points for TP are predefined as shown in Table 1a,b, respectively. An example of the upshifting curves of AT vehicle is shown in Figure 3, where the shifting schedules are exhibited by a 75-point shift map. In addition, the detailed statistics of points are summarized in Table 1, where ‘1→2′ denotes the upshift from the first gear to the second gear, and ‘6→5′ denotes the downshift from the sixth gear to the fifth gear. Thus, for the PSO employed in this paper, each particle is expressed as a 150-dimension (15 × 10) vector. Then the goal of calibration is to search the VS for every gear-shift point in the space.

Table 1.
Example of shift schedules: Vehicle speed (VS) and throttle position (TP).
3.2. Shifting Performance Evaluation
Shifting performance is comprehensively established for evaluation considering both the fuel consumption (FC) and shifting quality (SQ) with respect to the given driver and vehicle.
Since the FC is not provided in the raw data, the summation of TP during the shift processes within the complete driving cycle test is borrowed here as its estimation, which is formulated as:
In this work, FC is represented in % rather than the standardized unit of gallon, since it uses the estimation for the summation of TP.
Shift quality (SQ) is also not available in VTD, thus it is evaluated by the sum of absolute jerk during the shift processes within the driving cycle test. To design a good shifting schedule, the SQ is anticipated to be as small as possible. Theoretically, the jerk is formulated by the derivative of vehicle acceleration, which is given in Equation (8).
In Equation (9), t is the time-step of one shift process, N is the duration, and C is the counts of gear shifting within the FTP-72 driving cycle test.
Then we define the performance index (PI) as the weighted sum of two criteria, which are the fuel consumption and shifting quality with reference to the base shift map.
where p is a scalar between 0 to 1. The optimal shifting schedules are supposed to reach the minimum in consideration of the fuel consumption and jerks induced in gear shifting events. Since the two parts are equally important for the evaluation, and they are minimized in the same decreasing trend. Thus, we set p as 0.5 in this work.
3.3. Preference Integration and Automated Calibration of Shift Scheduling
Figure 4 illustrates the shift-scheduling calibration system adopted in this work, which could be automated by the PSO to guide the optimization process. The robot driver (driver model) is employed to retain and reproduce the MT driving preferences via the CMAC neural network and the real-world vehicle test data (VTD). With regard to a particular candidate schedule, the vehicle (model) is manipulated by the robot driver to follow the pre-defined standard driving cycle, i.e., FTP-72 in this paper. The shifting performance is then assessed based on the performance index. This procedure is repeatedly conducted on each candidate schedule or particle, and could eventually find an optimal or near-optimal solution.
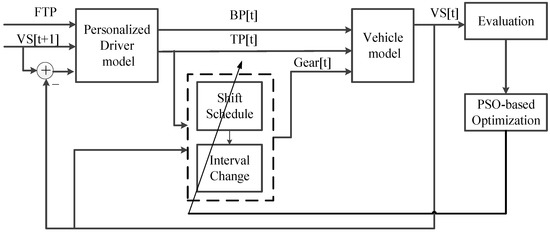
Figure 4.
Block diagram of automated calibration system.
The automated shift-scheduling optimization proceeds as illustrated in Figure 5. In the searching space, a group of candidate shifting schedules are produced randomly within the overlapped zone of MT shifting points and the space around the base map of specific vehicle type as initial particles. For each candidate schedule, the evaluation of performance index (PI) is implemented by a robot driver after each driving cycle test. In each test, the robot driver (model) is employed to manipulate the vehicle (model) equipped with a set of candidate shifting schedules to track the expected velocity profile. When the shifting performance evaluation of all candidate schedules is done, the new candidate schedules will be generated via PSO according to the position and velocity update of each particle in the group. The aforementioned procedures are repeatedly conducted until the optimal shift schedule is found or a maximum iteration is reached. The proposed method could also be applied in other vehicle types by changing the initial searching space based on specific shift map.
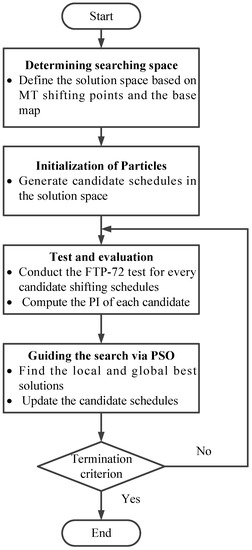
Figure 5.
Flowchart of automated optimization process.
The optimization is conducted via the following steps:
- Determining the searching space of the shifting-schedulesIn consideration of the drivers’ shifting preferences, the shifting points of MT drivers are collected for each kind of shifting event. Then, the searching space is obtained by the overlapped zone of MT shifting points and the space around the base map.
- Initializing the candidate shifting schedulesEach particle is a 150-dimension vector, which stands for 150 shifting points of the shift map. The candidate shifting schedules are generated in the aforementioned searching space.
- Decide the operations of the driver model
At current time t, suppose that the real and expected vehicle speeds are and , and the throttle position is . However, due to the time delay of the system, the will not impact on the vehicle speed until time t + k. The operation of robot driver model are determined by its input and , where
Considering it is not permitted to step on the gas pedal and brake pedal at the same time, at least one of TP and BP must be zero. As a rough estimation, the sum of TP during shifting events will be further analyzed for fuel consumption.
- 4.
- Adjust the intervals of candidate schedules
In order to avoid unnecessary and repeated gear-shifts, it is important to maintain proper shift delay between adjacent upshift and downshift curves [7]. The shift delay is set to adjust the intervals of candidate schedules, which is defined according to the base shift map as,
where is the upshift speed from gear(n) to gear(n + 1) at given TP position and is the downshift speed from gear(n + 1) to gear(n) at given TP position. is computed according to the base shift map. Therefore, the downshift schedule can be obtained based on upshift points as,
Hence, combining upshift and downshift schedules, resultant gear-shift schedule for dynamic performance evaluation could be acquired.
- 5.
- Regulate the gear positions
In the AT vehicle, the gear position is determined according to the changes of TP and VS on the basis of the gear shift map. If the VS increases and surpasses the upshifting curve, the gearbox will upshift; if the VS decreases and passes the down shifting curve, the gearbox will downshift; otherwise, it keeps the present gear position. In this study, notice that, only sequential shift events (e.g., 2→3/5→4) are considered, and the skipping shift events (e.g., 2→4/0→2) are excluded.
- 6.
- Generate the vehicle speed
The previous vehicle speed, gear position, throttle position, and brake pressure are taken in as inputs of neural network based vehicle (model), and the output is the current speed. Then, the vehicle speeds during shifting events will be further analyzed for shift quality.
These steps are repeatedly conducted after completing the driving cycle. Then, the performance index could be computed for the present candidate shifting schedule according to the accumulations of TP, gear count, and jerk during shift processes. When all of the candidate shift schedules are evaluated, one iteration of calibration is completed.
4. Numerical Experiments and Results
To validate the feasibility and effectiveness of the proposed method, numerical experiments were conducted on the automatic transmission vehicle model (ATVM) to accomplish the shift scheduling calibration task. In total, we conduct the calibration experiments on the data from 12 MT drivers, with 4 drivers for each style. MT driver models were established based on manual transmission vehicle data, which were pre-categorized by averaged energy spectrum density method [26]. Each manual transmission driver model (MTDM) acted as a robot driver to manipulate the ATVM in order to accomplish the standard driving cycle speed following task, i.e., FTP-72 as shown in Figure 6. Under the direction of PSO, the robot driver could attempt several candidate shifting schedules. Then the shifting performance in each attempt would be evaluated by the performance index. Finally, the optimal or near-optimal solution of shift schedules could be obtained.
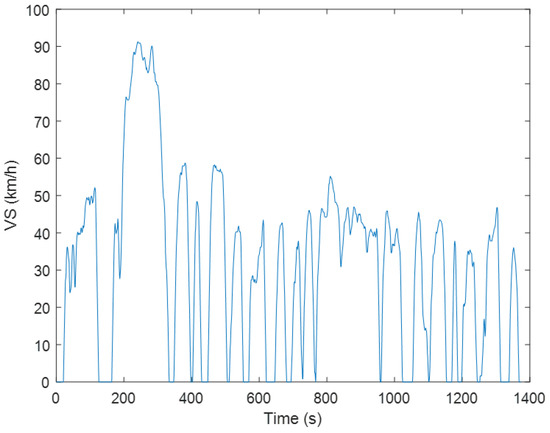
Figure 6.
FTP-72 driving cycle.
At first, the candidate shift schedules are generated from the real MT shifting points to reflect the driving preferences. Under the direction of PSO, the calibration was conducted, but the base map is neglected. Thus, to guarantee the overall rationality of the shift schedules, the calibration process is carried out based on the overlapped zone of MT shifting points and the space around the base map with respect to the AT vehicle. Two issues were exploited by the numerical experiments, i.e., how the MT driving preferences could be incorporated in the AT shift schedule calibration and how the shift schedules might be calibrated to achieve good fuel consumption and drivability under the direction of PSO.
4.1. Automated Calibration Based on MTDM and ATVM
We performed the automated calibrations of shift scheduling on the MTDM of the Focus 1.6L and the ATVM of the Escort 1.6L. With regard to each calibration task, the PI of the primary base map is borrowed as benchmark, which is set to 1. In Table 2, when the number of particles is set to 50, the processing time is 28 min, and the performance index is close to that of 150 particles. Therefore, in the initialization phase, the group volume of particles is set to 50, in consideration of both time and efficiency. Additionally, the searching space is defined by the overlapped zone between the MT drivers’ statistical shifting points and the searching boundary, which is [−5, 5] km/h around the primary shifting profiles. On account of practical experience in automobile industry, the shifting curves are restrained to increase or decrease monotonously.
Table 2.
Parameters of the optimization process.
- 1.
- Calibration based on real MT shifting points
To retain drivers’ shifting preferences, numerous candidate schedules based on raw MT shifting points were tried for the robot drivers. An example of the calibrated shifting schedules for a moderate driver is shown in Figure 7. However, the calibrated schedules lack the consideration of real vehicle base map. Thus, some points in the adjacent shifting curves are too close, which might lead to frequent shifts or mismatch of engine torque.
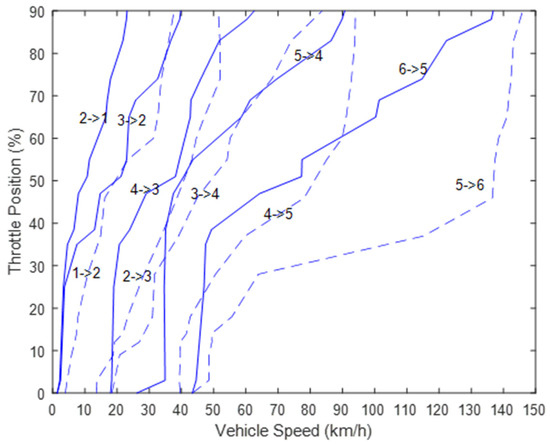
Figure 7.
Example of calibrated shifting schedules of a moderate driver.
Therefore, the candidate shifting schedules should be constrained in a certain zone. In this paper, the calibration process is carried out based on the overlapped zone of MT shifting points and the space around the base map with respect to the AT vehicle.
- 2.
- Calibration process for the performance index
Numerous candidate schedules were tried for the robot drivers. Specifically, the calibration system attempted 1437 candidate schedules for the Aggressive No.1, 1491 for the Moderate No.1, and 1612 for the Mild No.1, until the termination requirement is met. An example for the aggressive driver is presented in Figure 8a, where it is clear that both the shift quality and fuel consumption are minimized through the optimization. In Figure 8b, the performance index of the calibration process is shown, where the PI is reduced from 1 to 0.9734.
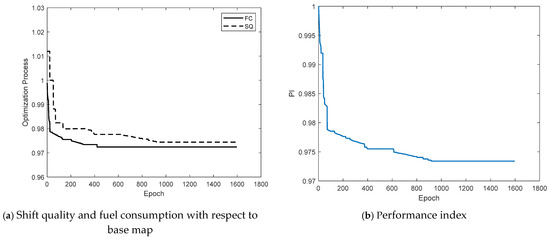
Figure 8.
Example of calibration process of an aggressive driver. (a) Shift quality and fuel consumption in the calibration process; (b) Performance index in the calibration process.
4.2. Consistency Analysis: Before vs. after Calibration
Internal consistency of MT shifting behaviors from raw data and the calibrated shift behaviors are checked and confirmed before the driving preferences are analyzed in depth. The WD [21] and the Kolmogorov–Smirnov (KS) tests [24] are adopted here to fulfil the task. For the WD, closer to 0 means the samples are more consistent with each other. Besides, the Kolmogorov-Smirnov (KS) test is implemented to determine whether the distribution of calibrated shifting behaviors with respect to the optimized shift map are identical to the raw MT shifting behaviors.
To conduct the consistency analysis, we randomly select three different drivers from each style. We firstly compute the VS frequency histograms of shifting operations for the raw data, and the behavior generated by virtual driver with respect to before and after the automated calibration. Then, the internal consistency of MT shifting behaviors from raw data and the generated shifting behaviors are evaluated by the WD and KS test, and the statistics are illustrated in Table 3.
Table 3.
Consistency statistics among three styled drivers.
As shown in Table 3, it is obvious that the WD values between the histogram of raw data and calibrated behavior are smaller than that with the uncalibrated behavior for all drivers from all styles. Moreover, it is noticed that not all of the un-calibrated behaviors could pass the KS tests. In comparison, all the returned values of KS tests are 1 for the calibrated behaviors, which means the shifting behaviors after calibration optimization maintains better and reasonable consistency with the raw data.
These results demonstrate the calibrated shift behaviors accord well with the raw shifting behaviors. Furthermore, the proposed method works well for different drivers from different styles, which could validate its high generalization and flexibility in various data samples.
4.3. Effects of Driving Preference
It is widely acknowledged that driving styles are representative of driving preferences and have significant impacts on both drivability and fuel economy. In this part, more results are provided to r analyze how the driving styles could affect the shifting performance.
Figure 9 illustrates the TP maneuvers of three drivers with calibrated shift schedules when fulfilling the FTP-72 speed following task. As shown in Figure 9, it is clear that there exist much more frequent and drastic operations on the gas pedal for the aggressive driver than the moderate and mild drivers, which is in accordance with the reality. Due to this reason, the aggressive drivers has largest fuel consumption and gear counts. The statistics on shifting performance are presented in Table 4. Speed error (SE) denotes the average on the absolute scalar calculated by the desired and real vehicle speed, which reflects the speed tracking performance. According to Table 4, the gear counts are improved by 19.6%, 19.8%, and 20.1%, with respect to the Aggressive No.1, the Moderate No.1, and the Mild No.1, respectively.
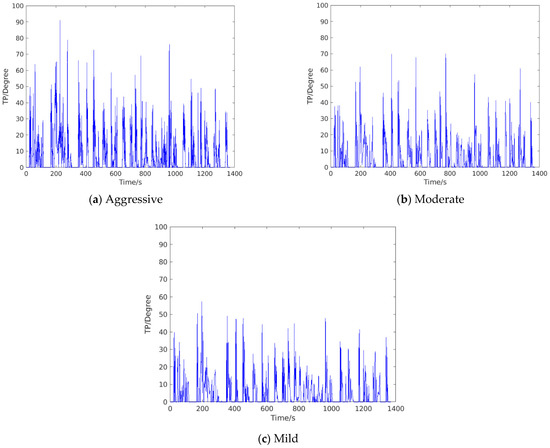
Figure 9.
TP of different styles after calibration: (a) Aggressive driver; (b) Moderate driver; (c) Mild driver.
Table 4.
Calibration statistics among three styled drivers.
Figure 10 depicts the gear indications of the drivers with three styles before and after shift-scheduling calibration during the same driving process. It is evident from Figure 10a that the gear change frequency is distinctly reduced for the aggressive driver, especially in high gears. This will not only lower the fuel consumption, but also enhance the driving comfort. Furthermore, for the moderate and mild drivers, the gear change operations are more timid than the aggressive driver, thus the improvements are not as great.
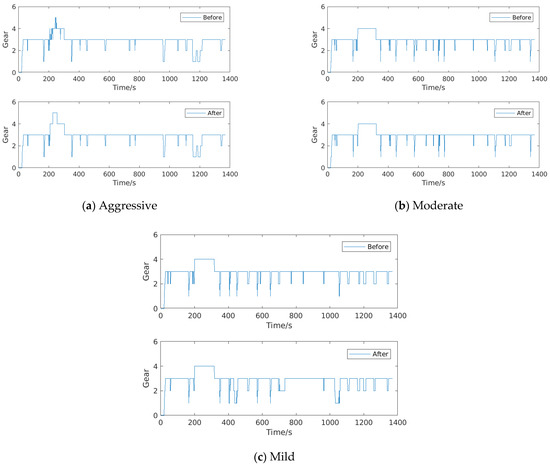
Figure 10.
Gear indications of three drivers: Before and after calibrations. (a) Aggressive driver; (b) Moderate driver; (c) Mild driver.
More calibrations tasks are conducted on other drivers with four models for every style and the statistics on performance and gear counts were illustrated in Figure 11. It is clear that the calibrated shift schedules are superior to the base map in both gear counts and performance index, regardless of their styles. Moreover, it is noticed that the calibrated shift schedules for aggressive drivers achieve larger improvements in shift performance than the other drivers. This could be explained by the fact that the moderate and mild drivers have more gentle operations on the gas pedal than the aggressive drivers, thus the aggressive drivers might have more significant improvements after the calibrations.
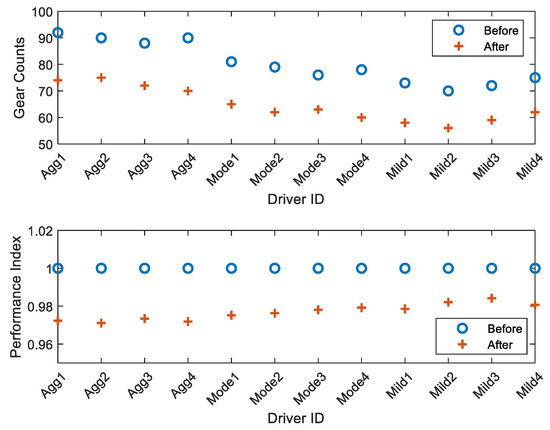
Figure 11.
Gear counts and shifting performance of 12 drivers: Before VS after calibration.
In Table 5, the statistics on acceleration and deceleration are illustrated. The standard driving cycle is conducted for both the primary shift map and calibrated shift schedules. Then the shifting behaviors are evaluated via the statistics on acceleration and deceleration. It is clear that the mean acceleration and deceleration of the calibrated shifting behaviors are closer to the raw data than the uncalibrated behaviors, despite the driving styles. Furthermore, there is a clear decrease trend in the mean acceleration and deceleration for the raw shifting data and calibrated data from the aggressive to the mild drivers. Thus, in a sense, this could also prove that the calibrated shifting behaviors could retain the original shifting preferences for MT drivers.
Table 5.
Statistics of acceleration and deceleration among three styled drivers.
In addition, the shifting performance statistics of three calibrated shift schedules are listed in Table 6. The performance index (PI) was cut down from benchmark (set as 1) to 0.9477, 0.9591, and 0.9755 for the three styles. Apparently, the PI got enhanced for all of the three styled robot drivers, both in shift quality (SQ) and fuel consumption (FC).
Table 6.
Performance index comparison among three styled drivers.
In Figure 12, the base shifting map and the calibrated shifting schedules of the three styled MTDM and ATVM are illustrated, in which label ‘1→2′ denotes upshift of 1th gear to 2nd gear, while ‘6→5′ denotes downshift of sixth gear to fifth gear, and so on. For the shift schedules in Figure 10, most of the calibrated shift points in low TP openings are close to the base map. While in the large TP openings, the upshift and down shift curves are on the left side and the right side of base lines, respectively. This could be explained by the reason that, in large TP openings, the early upshifts and delayed downshifts could reduce the fuel consumption. Specifically, according to Figure 12a, the shift schedules of aggressive driver (marked in red dotted lines) tend to shift earlier than most of the base map, which are also in accordance with his/her shift preference, that is, anxious to shift the gears. While in Figure 12b, a delayed shift strategy is adopted by the aggressive driver to retain more velocity.
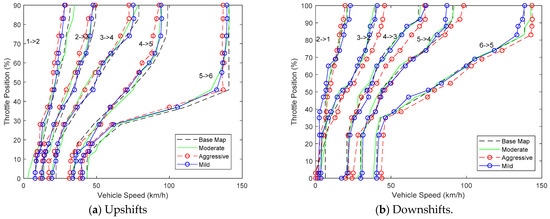
Figure 12.
Example of calibrated shift-schedules for different styled drivers compared with base map.
The experimental results manifest that it is feasible to retain and incorporate the driving preferences into the automated shift-scheduling calibration via PSO and the robot driver models through the evaluations.
5. Conclusions
In this work, the integration of MT driving preferences into personalized and automated calibration of shift scheduling is investigated. The calibration is automated by employing the particle swarm optimization (PSO). Based on the initial shifting schedules and MT shifting points, numerical experiments are carried out on the MT driver models and AT vehicle models of the Escort 1.6L. Simulation results manifest that the proposed method is effective for both driving preference integration and automated shift-scheduling calibration as well as achieving a good balance between the shift quality and fuel economy. The calibrated gear shifting behaviors are more in accordance with the raw shifting data than the uncalibrated. Moreover, the shift quality and the fuel economy could be improved, and according to the experiments, the overall performance could be reduced by 5.23%, 4.09%, and 2.45% for the aggressive, the moderate, and the mild driver. Thus, the personalization in shift scheduling calibration is suggested and preferred if possible.
With the respect of future work, a number of research directions are considered worth further effort. The proposed scheme may be applied to improve the drivability in shift-schedule calibration for hybrid or autonomous vehicles. The automated calibration may be performed and refined with real vehicles. In addition, the online calibration function might be integrated in the driving assistant system to further improve the performance of shifting schedules.
Author Contributions
Conceptualization, L.X. and X.H.; methodology, X.H. and M.L.; software, X.H. and M.L.; validation, X.H. and M.L.; formal analysis, X.H.; investigation, L.X.; writing—original draft preparation, X.H. and M.L.; writing—review and editing, X.H., L.X., and M.L.; funding acquisition, L.X. All authors have read and agreed to the published version of the manuscript.
Funding
This research was supported by Ford Motor Company under Grant URP2018-J077.4.
Institutional Review Board Statement
Not applicable.
Informed Consent Statement
Not applicable.
Data Availability Statement
Not applicable.
Acknowledgments
The authors would like to thank Ford Motor Company for the funding.
Conflicts of Interest
The authors declare no conflict of interest.
References
- Kim, N.; Vijayagopal, R.; Rousseau, A.; Lee, B.; Kim, S. Gearshift Calibration for Automatic Transmission Using a Model-Based Optimization Algorithm, Proceedings of the 2017 IEEE Vehicle Power and Propulsion Conference VPPC, Belfort, France, 11–14 December 2017; IEEE: Piscataway, NJ, USA, 2017; pp. 1–5. [Google Scholar] [CrossRef]
- Sangeetha, R.T.; Shankar, V.; Bose, A.; Jayaraman, B. A Unique Approach to Optimize the Gear-Shift Map of a Compact SUV to Improve FE and Performance; SAE Technol. Pap.; SAE International: Warrendale, PA, USA, 2020; Volume 2020, pp. 1–9. [Google Scholar] [CrossRef]
- Nikzadfar, K.; Bakhshinezhad, N.; Mirmohammadsadeghi, S.A.; Taheri Ledari, H.; Fathi, A. An Optimal Gear Shifting Strategy for Minimizing Fuel Consumption Based on Engine Optimum Operation Line; SAE Technol. Pap.; SAE International: Warrendale, PA, USA, 2019; Volume 2019, pp. 1–9. [Google Scholar] [CrossRef]
- Guen, D.; Weck, T.; Balihe, A.; Verbeke, B. Definition of gearshift pattern: Innovative optimization procedures using system simulation. SAE Int. J. Engines 2011, 4, 412–431. [Google Scholar] [CrossRef]
- Eckert, J.; Santiciolli, F.; Costa, E.; de Alkmin e Silva, L.; Dionísio, H.J.; Corrêa, F.C.; Dedini, F.G. Fuel Consumption Reduction Based on the Optimization of the Vehicle Gear Shifting Strategy Considering New Gear Ratios. In 24th SAE Brasil International Congress and Display, Sao Paulo, Brasil, 22–24 September 2015; SAE Technol. Pap.; SAE International: Warrendale, PA, USA, 2015; No. 2015-36-0136. [Google Scholar] [CrossRef]
- Kirtane, C.; Ghodke, S.; Kurode, S.; Prakash, A.K.; Malkhede, D.N. Gear Shift Schedule Optimization and Drive Line Modeling for Automatic Transmission. In Proceedings of the 1st International and 16th National Conference on Machines and Mechanics, Roorke, India, 18–20 December 2013; pp. 254–261. [Google Scholar]
- He, C.R.; Qin, W.B.; Ozay, N.; Orosz, G. Optimal gear shift schedule design for automated vehicles: Hybrid system based analytical approach. IEEE Trans. Control Syst. Technol. 2018, 26, 2078–2090. [Google Scholar] [CrossRef]
- Li, G.; Hu, J. Modeling and Analysis of Shift Schedule for Automatic Transmission Vehicle Based on Fuzzy Neural Network. In Proceedings of the World Congres Intell, Control Autom, London, UK, 30 June–2 July 2010; pp. 4839–4844. [Google Scholar] [CrossRef]
- Saini, V.; Singh, S.; NV, S.; Jain, H. Genetic algorithm based gear shift optimization for electric vehicles. SAE Int. J. Altern. Powertrains 2016, 5. [Google Scholar] [CrossRef]
- Liu, Y.; Qin, D.; Lei, Z.; Ding, R. Intelligent correction of shift schedule for dual clutch transmissions based on different driving conditions. Appl. Mech. Mater. 2012, 121–126, 3982–3987. [Google Scholar] [CrossRef]
- Ngo, V.D.; Colin Navarrete, J.A.; Hofman, T.; Steinbuch, M.; Serrarens, A. Optimal gear shift strategies for fuel economy and driveability. Proc. Inst. Mech. Eng. Part D J. Automob. Eng. 2013, 227, 1398–1413. [Google Scholar] [CrossRef]
- Nüesch, T.; Elbert, P.; Flankl, M.; Onder, C.; Guzzella, L. Convex optimization for the energy management of hybrid electric vehicles considering engine start and gearshift costs. Energies 2014, 7, 834–856. [Google Scholar] [CrossRef]
- Xu, L.; Zhang, J.; Shi, B.; Meng, W. Automating shift-scheduling calibration by using bionic optimization and personalized driver models. IEEE Trans. Intell. Transp. Syst. 2019, 20, 4367–4376. [Google Scholar] [CrossRef]
- He, R.; Hu, N. A Gear Shifting Indication Strategy of Eco-Driving Vehicle; SAE Tech. Pap.; SAE International: Warrendale, PA, USA, 2020; Volume 2020, pp. 1–9. [Google Scholar] [CrossRef]
- Yang, C.; Jiao, X.; Li, L.; Zhang, Y.; Zhang, L.; Song, J. Robust coordinated control for hybrid electric bus with single-shaft parallel hybrid powertrain. IET Control Theor. Appl. 2015, 9, 270–282. [Google Scholar] [CrossRef]
- Roozegar, M.; Angeles, J. The optimal gear-shifting for a multi-speed transmission system for electric vehicles. Mech. Mach. Theory 2017, 116, 1–13. [Google Scholar] [CrossRef]
- Shen, W.; Yu, H.; Hu, Y.; Xi, J. Optimization of shift schedule for hybrid electric vehicle with automated manual transmission. Energies 2016, 9, 220. [Google Scholar] [CrossRef]
- Lin, C.; Zhao, M.; Pan, H.; Yi, J. Blending gear shift strategy design and comparison study for a battery electric city bus with AMT. Energy 2019, 185, 1–14. [Google Scholar] [CrossRef]
- Kennedy, J.; Eberhart, R. Particle swarm optimization. Adapt. Learn. Optim. 2014, 15, 45–82. [Google Scholar] [CrossRef]
- Poli, R.; Kennedy, J.; Blackwell, T. Particle swarm optimization: An overview. Swarm Intell. 2007, 1, 33–57. [Google Scholar] [CrossRef]
- Irpino, A.; Verde, R. Dynamic clustering of interval data using a Wasserstein-based distance. Pattern Recognit. Lett. 2008, 29, 1648–1658. [Google Scholar] [CrossRef]
- Mescheder, L.; Nowozin, S.; Geiger, A. The numerics of GANs. arXiv 2017, arXiv:1705.10461. [Google Scholar]
- Rüschendorf, L. The Wasserstein distance and approximation theorems. Zeitschr. Wahrscheinlichkeitstheor. Verwandte Gebiete 1985, 70, 117–129. [Google Scholar] [CrossRef]
- Massey, F.J. The Kolmogorov-Smirnov test for goodness of fit. J. Am. Stat. Assoc. 1951, 46, 68–78. [Google Scholar] [CrossRef]
- Xu, L.; Hu, J.; Jiang, H.; Meng, W. Establishing style-oriented driver models by imitating human driving behaviors. IEEE Trans. Intell. Transp. Syst. 2015, 16, 2522–2530. [Google Scholar] [CrossRef]
- Shi, B.; Xu, L.; Hu, J.; Tang, Y.; Jiang, H.; Meng, W.; Liu, H. Evaluating driving styles by normalizing driving behavior based on personalized driver modeling. IEEE Trans. Syst. Man, Cybern. Syst. 2015, 45, 1502–1508. [Google Scholar] [CrossRef]


Publisher’s Note: MDPI stays neutral with regard to jurisdictional claims in published maps and institutional affiliations. |
© 2021 by the authors. Licensee MDPI, Basel, Switzerland. This article is an open access article distributed under the terms and conditions of the Creative Commons Attribution (CC BY) license (http://creativecommons.org/licenses/by/4.0/).