Abstract
Signal transmission over optical fibers in the ultraviolet to near-infrared domains remains very challenging due to their high intrinsic losses. In radiation-rich environments, this is made even more difficult due to the radiation-induced attenuation (RIA) phenomenon. We investigated here how the number of hydroxyl groups (OH) present in multi-mode (MM) pure-silica core (PSC) optical fibers influences the RIA levels and kinetics. For this, we tested three different fiber samples: one “wet”, one “dry” and one with an intermediate “medium” OH content. The RIA of the three samples was measured in the 400–900 nm (~3 eV to ~1.4 eV) spectral range during and after an X-ray irradiation at a dose rate of 6 Gy(SiO2) s−1 up to a total accumulated dose of 300 kGy(SiO2). Furthermore, we evaluated the H2-pre-loading efficiency in the medium OH sample to permanently improve both its intrinsic losses and radiation response in the visible domain. Finally, the spectral decomposition of the various RIA responses allows us to better understand the basic mechanisms related to the point defects causing the excess of optical losses. Particularly, it reveals the relationship between the initial OH groups content and the generation of non-bridging oxygen hole centers (NBOHCs). Moreover, the presence of hydroxyl groups also affects the contribution from other intrinsic defects such as the self-trapped holes (STHs) to the RIA in this spectral domain.
1. Introduction
Silica-based optical fiber technology presents many advantages justifying the increasing implementation of fiber-based solutions in natural and man-made radiation environments: immunity to most electromagnetic perturbations, low intrusiveness and an overall good radiation resistance [1]. If most of today’s applications are focused on the use of single-mode (SM) or multimode (MM) optical fibers in the infrared domain (IR, 1 to 1.6 µm) targeting data communications and sensing [1,2,3,4], there is also a need for waveguides able to operate in the ultraviolet, visible, and near-infrared domain (UV-Vis-near-IR from 350 to 1000 nm). As an example, such MM fibers are or will be integrated in the plasma diagnostics of fusion-devoted facilities such as ITER, National Ignition Facility (NIF), or Laser Mégajoule (LMJ) [5,6,7,8,9,10,11,12] as well as in the 351 nm laser diagnostics of LMJ and NIF [13]. Operating under radiation in this spectral domain remains very challenging, as the fiber optical losses can be too large to design the envisioned optical systems in terms of fiber length. Indeed, in addition to the fiber intrinsic attenuation (before irradiation), it is mandatory to also consider its radiation-induced attenuation (RIA). RIA phenomenon is caused by the generation through ionization or displacement damages of point defects in both silica-based fiber core and fluorine-doped cladding. These radiations induced defects possess absorption bands peaking mainly in the UV-Vis explaining the highest RIA levels that are usually observed in this spectral range [14] than in the IR [1,2]. The mitigation of these optical losses represents the biggest obstacle to overcome for the fiber implementation and has been the subject of several previous investigations highlighting that pure-silica core (PSC) and fluorine-doped multimode optical fibers are the best candidates for the steady-state radiation environments (kGy to MGy(SiO2) dose levels) [1,15]. Regarding the PSC fibers intrinsic losses, they are partially explained by the Rayleigh scattering losses, , which are caused by density fluctuations of the pure or F-doped glasses constituting the fiber core and cladding respectively. These scattering losses could be described in the case of a single-component glass such as silica by the following equation [16]:
where is the glass fictive temperature [17], the isothermal compressibility at , the photoelastic constant, the Boltzmann’s constant, the refractive index and the wavelength. For silica-based fibers (either PSC or F-doped), the fictive temperature is an important parameter governing the Rayleigh losses level. This criterion is strongly influenced by the amount of impurities introduced during the manufacturing process, mainly hydroxyl groups (Si-OH) and the Cl impurities [16]. A decrease of usually leads to a decrease of the Rayleigh losses [16] and then a fiber with reduced attenuation in the UV-visible range is achieved. The relative amounts of OH groups and Cl impurities are strongly anti-correlated for most of the preform deposition processes and can be tuned by varying the production parameters. As a consequence, several PSC optical fiber classes can be defined as: “wet” fibers (high-OH content, low-Cl content), “dry” fibers (low-OH, high-Cl contents). However, less-available low-OH, low-Cl fibers have also been produced, mainly in Russia [18]. Depending on the PSC fiber type, the attenuation in the UV-Vis differs due to the generation of some pre-existing (with respect to the irradiation) defects, mainly during the drawing process of the preform into the fiber. These defects (nature/concentration), and then the fiber attenuation, depend on the glass impurity levels too and are usually of similar structure than some of the radiation-induced defects [19]. This is the case, for example, of the so-called drawing-induced defect (DID) that corresponds to the non-bridging oxygen hole center (NBOHC, ≡Si-O•) structure having absorption bands peaking at 6.4 eV (~194 nm), 4.8 eV (~258 nm) and 1.97 eV (~630 nm) [20]. It has been shown that this center is created during the drawing (or by the irradiation) through the breakage of a strained (≡Si-O-Si≡)* bond, a process that also leads to the generation of a SiÉ’ (≡Si•) defect that absorbs at shorter wavelengths, around 5.8 eV (~214 nm) [21]:
DIDs are mainly observed in optical fibers presenting the lower OH amount (“dry” fibers) [19]. As a general rule, the “wet” fibers are more adapted for operation in the UV range while “dry” fibers are suitable for IR operation, as they do not present the strong absorption peak related to the Si-OH at around 1380 nm and the associated overtones. Depending on the application requirements, both fiber types can be selected for visible transmission. Under irradiation, these PSC fibers also exhibit different radiation responses as different point defects will contribute to the RIA levels. “Wet” fibers are characterized by a strong RIA in the visible domain caused by the NBOHCs and their 1.97 eV (~630 nm) absorption band that, in addition to the process described by (2), can be created by other processes whose efficiencies also depend on the glass stoichiometry [21,22]:
In the “dry” fibers case, the NBOHC contribution is strongly reduced as fewer precursor sites are available for their generation upon exposure, but an increasing contribution from the absorption bands of Cl-related defects is clearly observed. These bands are located around 3.78 eV (328 nm) and 2.3 eV (539 nm) for the Cl2, 3.26 eV (380 nm) and 3.65 eV (340 nm) for the Cl0 species [23,24]. For the optical fibers presenting both low-OH and low-Cl levels, it was shown that if NBOHC and Cl-defect concentrations are efficiently reduced, self-trapped holes (STHs) can be generated, strongly decreasing the fiber transmission in the visible domain through their absorption bands around 2.61 eV, 2.16 eV, 1.88 eV and 1.63 eV [14,25]. For this specific defect class, it was shown that the glass structure plays a key role, in particular, its fictive temperature [26] regarding the STH creation: larger leads to larger STH-related absorption. As a consequence, no perfect PSC composition exists for operation in steady-state environments.
A possibility to further improve the radiation resistance of PSC fiber consists in its loading with molecular hydrogen [15]. Indeed, hydrogen allows efficient passivation of most of the radiation-induced point defects absorbing in the visible domain. This is the case, for example, of NBOHCs that can be passivated through the following process also resulting in a simultaneous increase of the IR-absorption around 1380 nm [5]:
However, while the hydrogen can be easily loaded at room temperature in silica-based fibers, it will also quickly diffuse out [27] rendering the treatment efficiency dependent on the time delay between the treatment and the irradiation. From an applicative point of view, this strongly limits the interest of the technique for fusion-devoted facilities considering their long lifetimes. To maintain the hydrogen into the fibers, several techniques can be suggested implying the use of metallic coatings instead of polymer ones [7,8] or the addition of a hermetic thin carbon layer between the cladding and the coating [11,28]. In these cases, the hydrogen loading should be done at high temperatures to facilitate the hydrogen diffusion into the fiber core or a hole-assisted structure has to be used [28]. It should be noted that these particular structures could also lead to larger intrinsic attenuation, caused for example by some additional micro-bending losses.
In this paper, we investigated how the intrinsic and RIA attenuations of MM PSC fibers, in the visible-near IR domain, are controlled by their OH amounts. We characterized three different fiber samples: one “wet” and one “dry” fiber and also one sample with an intermediate OH content (medium-OH, 27 ppm). Furthermore, we discuss the H2 pre-treatment efficiency of the medium-OH fiber to permanently improve both its intrinsic losses in the visible domain and its steady-state radiation response up to 300 kGy dose levels. This procedure allows achieving optical fibers fulfilling the requirements of ITER plasma diagnostics as the ones described in [11] without using carbon-layers or metallic coatings. Finally, the decomposition of the various RIA spectra was performed in order to achieve a better understanding of the basic mechanisms related to the point defects causing the optical losses excess.
2. Materials and Methods
2.1. Tested Optical Fibers
For the present investigation, three MM optical fibers with pure silica cores, fluorine-doped claddings and polyimide coatings have been manufactured by iXblue (Lannion, France) [29]. The three fibers have been drawn from three distinct preforms that are characterized by different contents of hydroxyl groups bonded to the silica network (Si-OH) with 0.41 ppm (derived by the attenuation peak at 1385 nm), 27 ppm and 873 ppm (from the peak at 1240 nm). Hereafter, we will refer to these fibers as low-, medium-, and high-OH, respectively. The spectral attenuations of the three pristine fibers, obtained by cut-back measurements, are shown in Figure 1. Each sample has a numerical aperture of 0.22 and a diameter of 125 µm for the cladding and 150 µm for the coating, while the core diameter is 105 µm for the low- and high-OH fibers, and 112 µm for the medium-OH one. The main parameters of the three tested samples are listed in Table 1.
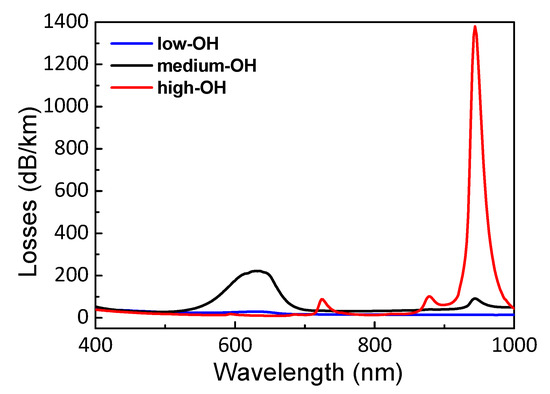
Figure 1.
Spectral losses of the three multimode optical fibers under test.

Table 1.
Main characteristics of the three fibers under test.
The number of OH groups affects the transmission properties of silica due to the fundamental OH absorption band at 2.72 µm and its corresponding overtones, whose major absorption peaks are located at 1.38 µm and 0.94 µm. It is known from the literature that, as far as the 0.94 µm overtone, the OH content affects the attenuation in the order of 1–2 dB km−1 ppm−1 [30,31,32,33]. Furthermore, in Figure 1 we observe the absorption band centered at 630 nm due to DID NBOHCs [14] for both the low- and medium-OH optical fibers. This same band is absent in the high-OH fiber due to the excess of hydrogen atoms that passivate the defects.
2.2. H2 Loading and Thermal Treatment
The three optical fibers were H2 loaded using a typical high-pressure reactor. After coiling the fibers on a 5 cm diameter cylinder inside the reactor, the hydrogen pressure was set at 120 bars. The reactor was kept at 60 °C for 3 days and 12 h, to ensure the saturation of the fiber core with molecular hydrogen. Immediately afterwards, a thermal treatment was performed on the loaded fibers by placing them for one day in an oven (from Binder, Bohemia, NY, USA) at a temperature of 120 °C. This last thermal treatment was not intended to anneal the defects but to accelerate the natural outgassing of the residual molecular hydrogen that failed to bond and passivate pre-existing defects in the silica matrix such as the NBOHCs and E’ created during the drawing process. Figure 2 shows the attenuation spectrum of the medium-OH sample before and after the hydrogen loading and the thermal treatment. The NBOHC absorption band, centered at 630 nm, was completely suppressed.
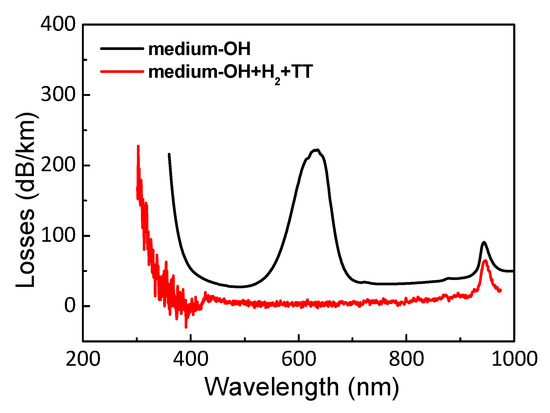
Figure 2.
Attenuation spectra of the pristine medium-OH sample before and after the H2 loading and thermal treatment (TT).
2.3. Irradiation Conditions
The three samples with different OH contents along with the additional H2-loaded and thermally treated medium-OH sample (hereafter indicated as medium-OH+H2+TT) have been exposed to a continuous X-rays irradiation at the MOPERIX facility located at the Hubert Curien Laboratory in Saint-Etienne, France. Here, a steady flux of photons with an average energy of ~40 keV was delivered to the samples with a dose-rate of 6 Gy(SiO2) s−1 (non-uniformity below 5% over the samples) up to a total accumulated dose of 300 kGy(SiO2) with an exception for the medium-OH one, which underwent to an irradiation up to 350 kGy(SiO2). All the samples are 1 m long and the irradiations were performed at room temperature.
In these conditions, online RIA measurements have been performed monitoring the transmitted signal of a white light source (DH-2000 Ocean Optics, Orlando, FL, USA) before, during, and after the X-rays exposure with an Ocean Optics QE65000 spectrometer. The optical source and the spectrometer were located outside the irradiator and connected to the samples by MM radiation-hardened optical fibers that, in addition, have been shielded with ~5 mm thick lead pieces inside the irradiator, making sure that only the samples under test were exposed to the X-rays.
3. Results
Figure 3 shows the spectral RIAs of the high- (a), medium- (b), and low-OH (c) samples in the visible/near-IR domain during the irradiation and up to 60 min after its end. In addition, the insets show the RIA growth and recovery kinetics at 450 nm and 650 nm. For all cases, a monotonic increase of the spectral RIA is observed, except for the red wavelength range of the medium-OH fiber. Indeed, the 450 nm kinetics increase rapidly at 1 dB/m up to ~10 kGy for both the high- and medium-OH samples and at 4 dB/m up to ~30 kGy for the low-OH. Instead, the kinetics at 650 nm follow different trends. For the high-OH, it continuously grows with no saturation trend. The medium-OH sample presents an unexpected non-monotonical behavior, reaching a local maximum RIA value (0.5 dB/m) at ~5 kGy, after which the RIA decreases before increasing again with a constant slope at higher doses. Finally, the RIA of the low-OH fiber follows the trend of the kinetic at 450 nm, since the tendency is dominated by the tail of the UV bands, reaching a very low saturation value (0.02 dB/m) at ~0.1 kGy. The most resolved features in the spectral measurements are the presence of the ~620 nm centered absorption band (high- and medium-OH content samples) overlapped by the tail of a UV absorption related to point defects absorbing at higher energies. The above-mentioned band is not observed in the low-OH sample for which the UV band is very intense. It is interesting to note how the amplitude of the 620 nm band is coherent with the OH concentration increase in the fibers and in countertendency with the UV tail.
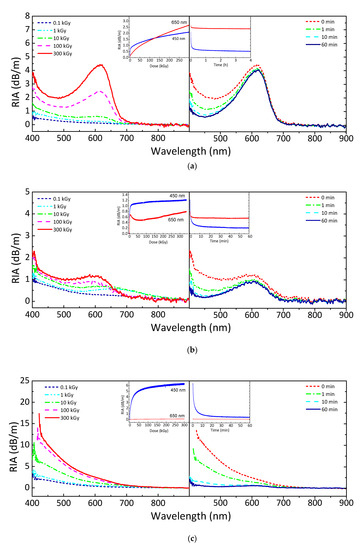
Figure 3.
Radiation-induced attenuation (RIA) spectral growth during the irradiation (left) and spectral decrease during the recovery (right) in the high-OH (a), the medium-OH (b), and the low-OH (c) sample. Both insets show their respective RIA kinetics at the wavelengths of 450 nm and 650 nm.
Another spectral characteristic observed in the medium-OH content fiber is an unstable wide band centered between 650 and 770 nm, which explains the local maximum at ~5 kGy observed in the RIA kinetic and disappears at higher doses. Regarding the RIA recovery kinetics, two types of decays are evident: one representing the contribution of the UV tail, which recovers almost all the transmission properties in one hour from the irradiation end, while the defects responsible for the 620 nm peaked band seem more stable in the same time frame at room temperature.
Figure 4 reports the RIA spectra during and up to one hour after the irradiation end for the treated medium-OH sample. The two most significant differences with respect to the non-treated counterpart, Figure 3b, are: a greater attenuation due to the tail of the band peaked in the UV region and the disappearance of the local maximum in the 650 nm kinetic.
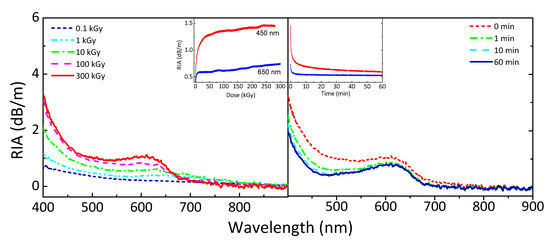
Figure 4.
Radiation-induced attenuation (RIA) spectral growth during the irradiation (left) up to 300 kGy(SiO2) and spectral decrease during the recovery (right) in the medium-OH+H2+TT sample. Both insets show the respective RIA kinetics at wavelengths of 450 nm and 650 nm.
4. Discussion
In order to have a better understanding of the basic mechanisms at the origin of the fiber degradations shown in Section 3, a fitting routine of all the RIA spectra was performed. To this end, we choose to use a set of Gaussian curves already proposed in the literature to describe the absorption bands associated with a set of color centers known to be present in the irradiated optical fibers (OFs) [14], and described as follows:
where A is the area of the band, is the center of the optical absorption band, while the standard deviation is related to the Full Width at Half Maximum (FWHM) as .
While to date the decomposition of RIA in the UV-visible range of silica-based materials is rather well known and understood, still a number of issues need to be clarified with regard to certain color centers typically identified in OFs, such as strain-assisted self-trapped holes (s-a STH) [34,35,36]. To the fit purpose, the values used for the Gaussians centers and for their FWHMs remain fixed parameters, whereas the amplitude A is left as a free parameter evolving during the irradiation.
Being all samples PSC, in the fitting routine we have considered only intrinsic defects and eventually impurities, such as Chlorine related centers [24,37]. Since the only source of extrinsic processes in the fibers under test is attributed to the OH content [38], we started our analysis from the low-OH content sample, being this fiber associated with the lowest probability for the process expressed in Equation (3). The result of the fitting routine obtained on the RIA at 300 kGy is shown in Figure 5a. This analysis highlights the large contribution of the color center centered at 3.26 eV (380 nm) attributed to Cl0, as well as the contributions of the STHs with two absorption bands centered at 2.61 eV (475 nm) and 2.16 eV (574 nm), corresponding to the STH1 and STH2 point defects respectively. Furthermore, it was deliberately chosen not to introduce in the fitting routine the absorption band related to the Cl2 given the significant error that would be committed when assessing its amplitude, considering that it is centered at 3.78 eV (328 nm) and then at quite far energies from those for which our experimental data are available. Table 2 reports the best-fit parameters of the Gaussian absorption bands of each point defect used in the decomposition of the three fibers responses.
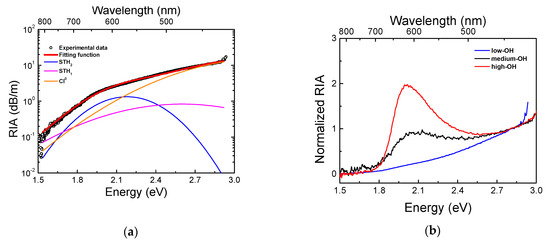
Figure 5.
(a) Decomposition of the RIA spectrum measured for the low-OH sample at 300 kGy dose. Open circles represent the experimental data while the red line represents the best fitting function obtained by summing the different absorption bands related to single point defects. (b) Normalized RIA spectra, acquired at 300 kGy dose, with respect to the RIA measured at 2.8 eV (450 nm) for the low-, medium- and high-OH samples.
Table 2.
Best-fit parameters for the RIA at 300 kGy of the three tested fibers.
To compare the different spectral profiles, we have reported in Figure 5b the normalized spectra, with respect to the RIA values measured at 2.8 eV (450 nm). This normalization was done in order to qualitatively highlight the disparity between the three samples. Indeed, the appearance of a new spectral feature in the range 1.7–2.7 eV (730–460 nm) is evident with analogous spectral characteristic compared to the one linked to NBOHC centered at ~2.0 eV, strongly supporting the NBOHC generation through Equation (3), in accordance with the OH amount registered in the pristine optical fiber.
To isolate the NBOHC contribution, we have then decided to perform the fitting routine on the differences between the normalized RIA (ΔRIA) of the high-OH and medium-OH samples with respect to the low-OH sample. In addition, considering the different models of NBOHC contribution around 2 eV we have decided to adopt the model reported by Morana et al. in [39] rather than the more standard symmetrical Gaussian peaked at ~2 eV reported in [14]. It is important to remark that the adopted model reconstructs the NBOHC contribution around 2 eV as a sum of three different Gaussian bands with a fixed relative amplitude ratio.
Figure 6a shows the fit related to the ΔRIA between the high-OH and low-OH samples. Here it is possible to observe that the contribution of the NBOHC absorption band stands out and that the selected model well suits the profile. However, to achieve a good quality of the fit, we were obliged to introduce the Gaussian absorption band related to the STH2 point defect. The introduction of this band is well supported by the literature, where it has been found that a higher OH concentration corresponds to a higher STH2 relative contribution [34]. In addition, the inset of Figure 6a reports the same fitting routine but with the NBOHC considered as a single Gaussian absorption band centered around 2 eV. In this case, it is evident that the result of the fit does not match the experimental data so, to complete the fit, new absorption bands associated with one or more yet unknown points defects should be introduced.
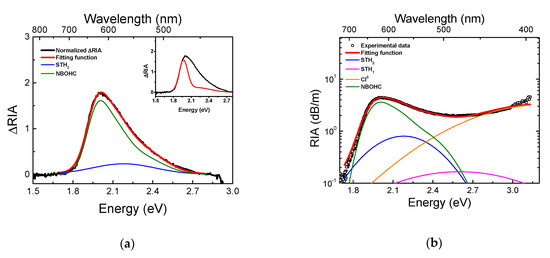
Figure 6.
(a) Fitting function of the difference between the normalized RIA (ΔRIA) of the high- and the low-OH samples, taking in account the model of the NBOHC of [39]. The inset shows the attempt to fit the ΔRIA with the NBOHC considered as a single Gaussian band. (b) Fitting function of the RIA at 300 kGy of the high-OH sample.
Figure 6b reports the fitting function obtained on the overall RIA profile of the high-OH sample at 300 kGy as well as the individual bands of the point defects used for the decomposition.
The same approach was used for the analysis of the irradiated medium-OH sample. Figure 7a displays the obtained fitting function for the ΔRIA at 300 kGy with respect to the low-OH. In accordance to Equation (3), in the medium-OH sample we observe a lower content of the NBOHC contribution. Moreover, the inset of Figure 6 shows again that, with the classical 1-Gaussian model of the NBOHC, the central region still needs to be completed by some other unknown absorption bands. Figure 7b reports the match between the experimental RIA and the fitting function in the medium-OH sample.
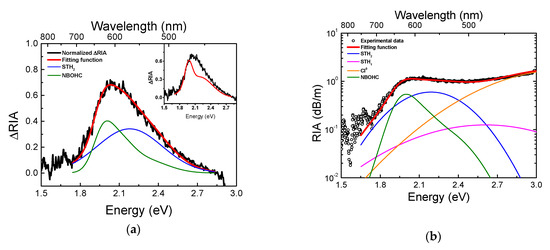
Figure 7.
(a) Fitting function of the difference between the normalized RIA of the medium- and the low-OH samples, taking into account the NBOHC model of [39]. The inset shows the attempt to fit the ΔRIA with the NBOHC considered as a single Gaussian band. (b) Fitting function of the RIA at 300 kGy of the medium-OH sample.
As in the case of the high-OH fiber, in Figure 7a the absorption bands related to NBOHC and STH2 have been used. In this case, the relative contribution provided by the STH2 increases in comparison to the high-OH case. The greater contribution of the STH-related bands could also justify the non-monotonic behavior observed in the RIA kinetics shown in Figure 3b, considering their strained assisted variants (s-a STHs) [14,35,40]. Indeed, it is possible to notice that the medium-OH RIA has a broader band covering also energies lower than 1.5 eV compared to the one of the same sample at 300 kGy (Figure 5b), in agreement with the s-a STH1 and s-a STH2 spectral characteristics, centered respectively at 1.88 eV (660 nm) and 1.63 eV (760 nm). For this reason, an in-depth analysis of the RIA at 10 kGy (the dose which corresponds at the maximum in the kinetics at 650 nm reported in Figure 3b) has been carried out. At this dose, Figure 8a reports together the normalized RIA at 2.8 eV of the medium- and low-OH samples. Figure 8b illustrates the fitting of the ΔRIA, where it becomes evident that the NBOHC contribution at lower doses is negligible and that the STH2 centers are still present.
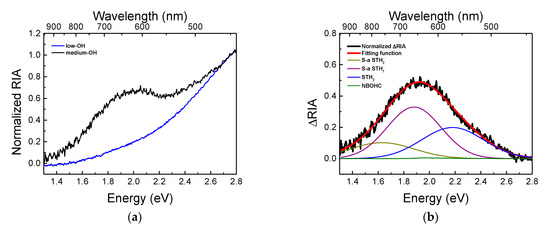
Figure 8.
(a) Normalized spectra with respect to the RIA measured at 2.8 eV (450 nm) for the low- and medium-OH samples at 10 kGy dose. (b) Fitting function obtained for the difference of the normalized RIA of the medium- and low-OH samples measured at a dose of 10 kGy.
As already mentioned in Section 2.2, the pristine medium-OH sample has been also loaded with H2 and thermally treated in order to eliminate the absorption band centered around 600 nm mainly due to DID. Figure 9a shows the normalized spectra of the low-OH and the treated medium-OH sample at the dose of 10 kGy. By comparing this figure with Figure 8a, we show that the treatment has no significant impact on the shape of the radiation-induced absorption but it slightly influences the relative magnitudes of the absorption bands used in the decomposition (Figure 9b). Particularly, the STH2 band area slightly decreases compared to the case of the non-treated sample and an increase in the NBOHC band is noted. The best-fit parameters for the treated and non-treated medium-OH sample are listed in Table 3.
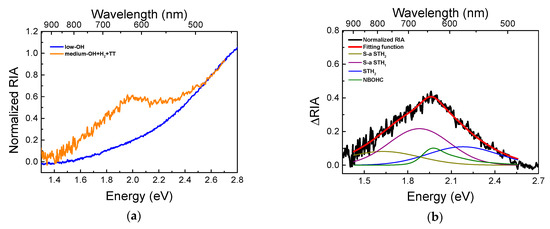
Figure 9.
(a) Normalized spectra with respect to the RIA measured at 2.8 eV (450 nm) for the low- and the treated medium-OH samples at 10 kGy dose. (b) Fitting function obtained for the difference of the normalized RIA of the treated medium- and low-OH samples measured at a dose of 10 kGy.
Table 3.
Best-fit parameters for the RIA at 10 kGy of the treated and not-treated medium-OH sample.
Finally, the two RIAs at 300 kGy for the treated and non-treated medium-OH sample are displayed in Figure 10 for a direct comparison. It can be seen that in the treated sample that the magnitude of the RIA increases significantly with respect to the untreated sample for energies above 2.4 eV. Simultaneously, it is reduced by approximately 10% in the 1.9–2.4 eV range. This last feature could be explained by the slight decrease of the STH2 magnitude already observed in Figure 9b. It is known from the literature [23,34] that STH annealing could be responsible for the creation of the Cl0 defect.
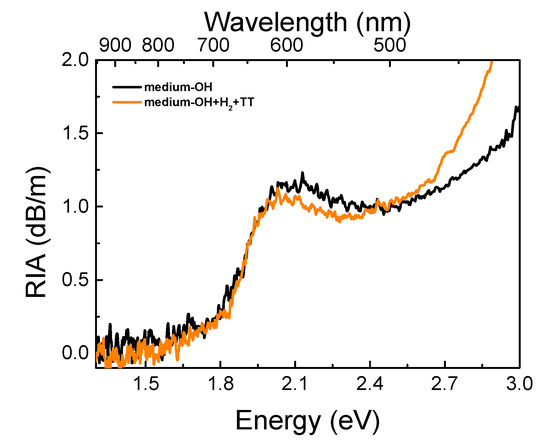
Figure 10.
Measured RIA of the medium-OH and the treated medium-OH samples at a dose of 300 kGy.
5. Conclusions
In the paper the investigations of how the amount of Si-OH groups governs the intrinsic losses and the radiation-induced attenuation (RIA) of multi-mode pure silica core (MM PSC) optical fibers in the vis-near IR spectral range are presented. For the study, three optical fibers have been drawn from three different preforms with different OH concentrations: the low-OH (0.41 ppm at 1385 nm), the medium-OH (27 ppm at 1240 nm) and the high-OH (873 ppm at 1240 nm). In addition, the effect of a combined H2 loading added to a thermal-treatment before the irradiation has been studied on the medium-OH sample, in order to eliminate its drawing-induced defects (DID), the main cause of the signal degradation in the considered spectral region.
The X-ray irradiation at 6 Gy(SiO2) s−1 up to 300 kGy(SiO2) shows a monotonic increase of the vis-near IR RIA for the low- and high-OH samples, while a different behavior was observed for the medium-OH, depending on the spectral range of interest: a monotonic increase of the RIA for wavelengths below ~600 nm and a non-monotonic behavior for wavelengths above ~600 nm.
The spectral decomposition of the RIA highlighted the various point defects that contribute to the spectral absorption. In particular, the absorption band peaked at 1.97 eV (~630 nm), attributed to non-bridging oxygen hole centers (NBOHCs), increases according to the OH amount present in the fiber. Moreover, due to its asymmetrical shape, the absorption band associated with the NBOHC has been fitted with two models: a 3-Gaussian model already presented in the literature [39] and the “standard” 1-Gaussian model [14], this latter revealing the necessity to include one or more yet unknown contributions in order to match the experimental data.
The non-monotonic trend with the dose of the RIA around 650 nm for the medium-OH sample has been studied by the decomposition of the RIA spectrum at 10 kGy(SiO2) dose at which the maximum value in the kinetic has been measured. Here, the strain-assisted self-trapped holes (s-a- STH) contribution is introduced and shown to be the most adapted one to reproduce the experimental data.
Author Contributions
Conceptualization, C.C., A.M., G.M., T.R., Y.O., A.B. and S.G.; Data curation, C.C., V.D.M., A.M. and E.M.; Formal analysis, C.C., V.D.M., A.M. and S.G.; Resources, T.R.; Writing – original draft, C.C., A.M., S.G.; Writing – review & editing, V.D.M., G.M., T.R., E.M., Y.O., A.B. All authors have read and agreed to the published version of the manuscript.
Funding
This research received no external funding.
Institutional Review Board Statement
Not applicable.
Informed Consent Statement
Not applicable.
Data Availability Statement
The data presented in this study are available on reasonable request from the corresponding author. Boca Raton.
Conflicts of Interest
The authors declare no conflict of interest.
References
- Girard, S.; Kuhnhenn, J.; Gusarov, A.; Brichard, B.; Van Uffelen, M.; Ouerdane, Y.; Boukenter, A.; Marcandella, C. Radiation Effects on Silica-Based Optical Fibers: Recent Advances and Future Challenges. IEEE Trans. Nucl. Sci. 2013, 60, 2015–2036. [Google Scholar] [CrossRef]
- Girard, S.; Morana, A.; Ladaci, A.; Robin, T.; Mescia, L.; Bonnefois, J.-J.; Boutillier, M.; Mekki, J.; Paveau, A.; Cadier, B.; et al. Recent Advances in Radiation-Hardened Fiber-Based Technologies for Space Applications. J. Opt. 2018, 20, 093001. [Google Scholar] [CrossRef]
- Hartog, A.H. An Introduction to Distributed Optical Fibre Sensors; Series in Fiber Optic Sensors; Published June 2018, CRC Press: Boca Raton, FL, USA; ISBN 978-1-138-08269-4.
- Bao, X.; Chen, L. Recent Progress in Distributed Fiber Optic Sensors. Sensors 2012, 12, 8601–8639. [Google Scholar] [CrossRef] [PubMed]
- Brichard, B.; Fernandez, A.F.; Ooms, H.; Berghmans, F.; Decréton, M.; Tomashuk, A.; Klyamkin, S.; Zabezhailov, M.; Nikolin, I.; Bogatyrjov, V.; et al. Radiation-Hardening Techniques of Dedicated Optical Fibres Used in Plasma Diagnostic Systems in ITER. J. Nucl. Mater. 2004, 329-333, 1456–1460. [Google Scholar] [CrossRef]
- Brichard, B.; Tomashuk, A.L.; Bogatyrjov, V.A.; Fernandez, A.F.; Klyamkin, S.N.; Girard, S.; Berghmans, F. Reduction of the Radiation-Induced Absorption in Hydrogenated Pure Silica Core Fibres Irradiated in Situ with γ-Rays. J. Non-Cryst. Solids 2007, 353, 466–472. [Google Scholar] [CrossRef]
- Brichard, B.; Tomashuk, A.L.; Ooms, H.; Bogatyrjov, V.A.; Klyamkin, S.N.; Fernandez, A.F.; Berghmans, F.; Decréton, M. Radiation Assessment of Hydrogen-Loaded Aluminium-Coated Pure Silica Core Fibres for ITER Plasma Diagnostic Applications. Fusion Eng. Des. 2007, 82, 2451–2455. [Google Scholar] [CrossRef]
- Tomashuk, A.L.; Golant, K.M.; Dianov, E.M.; Medvedkov, O.I.; Plaksin, O.A.; Stepanov, V.A.; Stepanov, P.A.; Demenko, P.V.; Chernov, V.M.; Klyamkin, S.N. Radiation-Induced Absorption and Luminescence in Specially Hardened Large-Core Silica Optical Fibers. IEEE Trans. Nucl. Sci. 2000, 47, 693–698. [Google Scholar] [CrossRef]
- Bourgade, J.L.; Costley, A.E.; Reichle, R.; Hodgson, E.R.; Hsing, W.; Glebov, V.; Decreton, M.; Leeper, R.; Leray, J.L.; Dentan, M.; et al. Diagnostic Components in Harsh Radiation Environments: Possible Overlap in R&D Requirements of Inertial Confinement and Magnetic Fusion Systems. Rev. Sci. Instrum. 2008, 79, 10F304. [Google Scholar] [CrossRef]
- Bourgade, J.L.; Marmoret, R.; Darbon, S.; Rosch, R.; Troussel, P.; Villette, B.; Glebov, V.; Shmayda, W.T.; Gomme, J.C.; Le Tonqueze, Y.; et al. Diagnostics Hardening for Harsh Environment in Laser Mégajoule (Invited). Rev. Sci. Instrum. 2008, 79, 10F301. [Google Scholar] [CrossRef]
- Gusarov, A.; Vukolov, K.Y.; Orlovskiy, I.I.; Andreenko, E.N. Radiation Induced Absorption of Hydrogen-Loaded Pure Silica Optical Fibers with Carbon Coating for ITER Diagnostics. Fusion Eng. Des. 2020, 151, 111356. [Google Scholar] [CrossRef]
- Bourgade, J.L.; Allouche, V.; Baggio, J.; Bayer, C.; Bonneau, F.; Chollet, C.; Darbon, S.; Disdier, L.; Gontier, D.; Houry, M.; et al. New Constraints for Plasma Diagnostics Development Due to the Harsh Environment of MJ Class Lasers (Invited). Rev. Sci. Instrum. 2004, 75, 4204–4212. [Google Scholar] [CrossRef]
- Girard, S.; Baggio, J.; Bisutti, J. 14-MeV Neutron, γ-Ray, and Pulsed X-Ray Radiation-Induced Effects on Multimode Silica-Based Optical Fibers. IEEE Trans. Nucl. Sci. 2006, 53, 3750–3757. [Google Scholar] [CrossRef]
- Girard, S.; Alessi, A.; Richard, N.; Martin-Samos, L.; De Michele, V.; Giacomazzi, L.; Agnello, S.; Francesca, D.D.; Morana, A.; Winkler, B.; et al. Overview of Radiation Induced Point Defects in Silica-Based Optical Fibers. Rev. Phys. 2019, 4, 100032. [Google Scholar] [CrossRef]
- Brichard, B. Systèmes à Fibres Optiques Pour Infrastructures Nucléaires: Du Durcissement Aux Radiations à l’application. Ph.D. Thesis, Université de Montpellier, Montpellier, France, 2008. [Google Scholar]
- Sakaguchi, S.; Todoroki, S.; Shibata, S. Rayleigh Scattering in Silica Glasses. J. Am. Ceram. Soc. 1996, 79, 2821–2824. [Google Scholar] [CrossRef]
- Lancry, M.; Régnier, E.; Poumellec, B. Fictive Temperature in Silica-Based Glasses and Its Application to Optical Fiber Manufacturing. Prog. Mater. Sci. 2012, 57, 63–94. [Google Scholar] [CrossRef]
- Cheremisin, I.I.; Ermolenko, T.A.; Evlampiev, I.K.; Popov, S.A.; Turoverov, P.K.; Golant, K.M.; Zabezhajlov, M.O. Radiation-Hard KS-4V Glass and Optical Fiber, Manufactured on Its Basis, for Plasma Diagnostics in ITER. Plasma Devices Oper. 2004, 12, 1–9. [Google Scholar] [CrossRef]
- Friebele, E.J.; Sigel, G.H.; Griscom, D.L. Drawing-induced Defect Centers in a Fused Silica Core Fiber. Appl. Phys. Lett. 1976, 28, 516–518. [Google Scholar] [CrossRef]
- Skuja, L.; Kajihara, K.; Hirano, M.; Hosono, H. Visible to Vacuum-UV Range Optical Absorption of Oxygen Dangling Bonds in Amorphous SiO2. Phys. Rev. B 2011, 84, 205206. [Google Scholar] [CrossRef]
- Devine, R.A.B.; Arndt, J. Correlated Defect Creation and Dose-Dependent Radiation Sensitivity in Amorphous SiO2. Phys. Rev. B 1989, 39, 5132–5138. [Google Scholar] [CrossRef] [PubMed]
- Girard, S.; Meunier, J.-P.; Ouerdane, Y.; Boukenter, A.; Vincent, B.; Boudrioua, A. Spatial Distribution of the Red Luminescence in Pristine, γ Rays and Ultraviolet-Irradiated Multimode Optical Fibers. Appl. Phys. Lett. 2004, 84, 4215–4217. [Google Scholar] [CrossRef]
- Griscom, D.L. Trapped-Electron Centers in Pure and Doped Glassy Silica: A Review and Synthesis. J. Non-Cryst. Solids 2011, 357, 1945–1962. [Google Scholar] [CrossRef]
- Griscom, D.L.; Friebele, E.J.; Mukherjee, S.P. Studies of Radiation-Induced Point Defects in Silica Aerogel Monoliths. Cryst. Lattice Defects Amorph. Mater. 1987, 17, 157–163. [Google Scholar]
- Griscom, D.L. Self-Trapped Holes in Pure-Silica Glass: A History of Their Discovery and Characterization and an Example of Their Critical Significance to Industry. J. Non-Cryst. Solids 2006, 352, 2601–2617. [Google Scholar] [CrossRef]
- Yamaguchi, M.; Saito, K.; Ikushima, A.J. Fictive-Temperature-Dependence of Photoinduced Self-Trapped Holes in SiO2. Phys. Rev. B 2003, 68, 153204. [Google Scholar] [CrossRef]
- Stone, J. Interactions of Hydrogen and Deuterium with Silica Optical Fibers: A Review. J. Lightwave Technol. 1987, 5, 712–733. [Google Scholar] [CrossRef]
- Girard, S.; Laurent, A.; Pinsard, E.; Robin, T.; Cadier, B.; Boutillier, M.; Marcandella, C.; Boukenter, A.; Ouerdane, Y. Radiation-Hard Erbium Optical Fiber and Fiber Amplifier for Both Low- and High-Dose Space Missions. Opt. Lett. OL 2014, 39, 2541–2544. [Google Scholar] [CrossRef]
- IXBlue Photonics Website. Available online: https://photonics.ixblue.com/ (accessed on 25 March 2021).
- Keck, D.; Maurer, R.; Schultz, P. On the Ultimate Lower Limit of Attenuation in Glass Optical Waveguides. Appl. Phys. Lett. 1973, 22, 307–309. [Google Scholar] [CrossRef]
- Keck, D.B.; Tynes, A.R. Spectral Response of Low-Loss Optical Waveguides. Appl. Opt. AO 1972, 11, 1502–1506. [Google Scholar] [CrossRef]
- Kaiser, P.; Tynes, A.R.; Astle, H.W.; Pearson, A.D.; French, W.G.; Jaeger, R.E.; Cherin, A.H. Spectral Losses of Unclad Vitreous Silica and Soda-Lime-Silicate Fibers. J. Opt. Soc. Am. JOSA 1973, 63, 1141–1148. [Google Scholar] [CrossRef]
- Elliott, C.R.; Newns, G.R. Near Infrared Absorption Spectra of Silica: OH Overtones. Appl. Spectrosc. AS 1971, 25, 378–379. [Google Scholar] [CrossRef]
- De Michele, V.; Marcandella, C.; Francesca, D.D.; Paillet, P.; Alessi, A.; Cannas, M.; Ouerdane, Y.; Boukenter, A.; Girard, S. Pulsed X-Ray Radiation Responses of Solarization-Resistant Optical Fibers. Phys. Status Solidi (a) 2019, 216, 1800487. [Google Scholar] [CrossRef]
- Tomashuk, A. Inherent and Strain-Assisted Radiation-Induced Self-Trapped Holes in Pure-Silica Optical Fibers. In Bragg Gratings, Photosensitivity and Poling in Glass Waveguides and Materials, Proceedings of the Advanced Photonics 2018, Zurich Switzerland, 2–5 July 2018;(BGPP, IPR, NP, NOMA, Sensors, Networks, SPPCom, SOF) (2018), paper BM2A.6; Optical Society of America: Washington, DC, USA, 2018; p. BM2A.6. [Google Scholar]
- Kashaykin, P.F.; Tomashuk, A.L.; Salgansky, M.Y.; Guryanov, A.N.; Dianov, E.M. Anomalies and Peculiarities of Radiation-Induced Light Absorption in Pure Silica Optical Fibers at Different Temperatures. J. Appl. Phys. 2017, 121, 213104. [Google Scholar] [CrossRef]
- Skuja, L.; Kajihara, K.; Smits, K.; Silins, A.; Hosono, H. Luminescence and Raman Detection of Molecular Cl2 and ClClO Molecules in Amorphous SiO2 Matrix. J. Phys. Chem. C 2017, 121, 5261–5266. [Google Scholar] [CrossRef]
- Vaccaro, L.; Cannas, M.; Boizot, B.; Parlato, A. Radiation Induced Generation of Non-Bridging Oxygen Hole Center in Silica: Intrinsic and Extrinsic Processes. Journal of Non-Cryst. Solids 2007, 353, 586–589. [Google Scholar] [CrossRef]
- Morana, A.; Cannas, M.; Girard, S.; Boukenter, A.; Vaccaro, L.; Périsse, J.; Macé, J.-R.; Ouerdane, Y.; Boscaino, R. Origin of the Visible Absorption in Radiation-Resistant Optical Fibers. Opt. Mater. Express OME 2013, 3, 1769–1776. [Google Scholar] [CrossRef]
- De Michele, V.; Morana, A.; Campanella, C.; Vidalot, J.; Alessi, A.; Boukenter, A.; Cannas, M.; Paillet, P.; Ouerdane, Y.; Girard, S. Steady-State X-Ray Radiation-Induced Attenuation in Canonical Optical Fibers. IEEE Trans. Nucl. Sci. 2020, 67, 1650–1657. [Google Scholar] [CrossRef]


Publisher’s Note: MDPI stays neutral with regard to jurisdictional claims in published maps and institutional affiliations. |
© 2021 by the authors. Licensee MDPI, Basel, Switzerland. This article is an open access article distributed under the terms and conditions of the Creative Commons Attribution (CC BY) license (http://creativecommons.org/licenses/by/4.0/).