Article

The Effect of Biogas Origin on the Electricity Production by Solid Oxide Fuel Cells

by
George N. Prodromidis
and
Frank A. Coutelieris
*
Department of Environmental Engineering, University of Patras, G. Seferi 2, 30100 Agrinio, Greece
*
Author to whom correspondence should be addressed.
Appl. Sci. 2021, 11(7), 3112; https://doi.org/10.3390/app11073112
Submission received: 4 March 2021 / Revised: 29 March 2021 / Accepted: 29 March 2021 / Published: 31 March 2021
(This article belongs to the Section Energy Science and Technology)

Abstract

:

Featured Application

This work reveals an extensive energy and exergy analysis on a Solid Oxide Fuel Cell (SOFC)-based system which uses biogas as a fuel under several ratios of methane over carbon dioxide. These different qualities of biogas (mixture of CH4 and CO2 with minor chemically neutral impurities), as they are presented here, refer to real life scenarios produced by different raw materials through the anaerobic digestion process.

Abstract

This work simulates electricity production in a Solid Oxide Fuel Cell (SOFC)-based power plant, fed by biogas of various compositions. Steam reforming of the gas feed stream is used to produce the required supply for the SOFC. Given the constraints of the feed stream compositions, resulting from the origin of biogas, i.e., by the biomass from which the biogas has been produced as well as by the operating conditions selected for its production, the overall plant performance is modelled in terms of energy and exergy. The model provides results on the efficiency, power output and thermal behavior of the system, thus presenting the potential to offer great advantages in generating electricity from biogas and reducing the environmental impact. This research study presents the efficiency of such a system in terms of energy and exergy, by considering several values of the operational parameters (extensions of reactions that take place in the apparatus, temperatures, feed stream compositions, etc.). It is found that moving towards a methane richer fuel, the energy and exergy efficiency can remain almost constant at high levels (around 70%), while in absolute value the electric energy can increase up to 35% according to the system’s needs. Therefore, under this prospect, the present research study reveals the usefulness of low content methane fuels, which through the optimization process can succeed identical energy management compared to high content methane fuels.

1. Introduction

Solid Oxide Fuel Cells (SOFCs) are electrochemical devices which are able to convert the chemical energy of the feed stream to electricity embodied in combined heat and power application [1]. These devices became popular during recent decades due to the great variety of fuels that they can be fed with (such as ethanol, methanol, etc.), a fact that can be mainly attributed to the high temperature where SOFCs usually operate [2].
It is also known that biomass can be converted into biogas (a mixture consisting mainly of CH4 and CO2) through several bioprocesses, where biogas composition strongly depends on the biomass raw materials, as Table 1 presents (for details, see Section 2).
By using these procedures, biogas can be converted into syngas, a complex gas consisting mainly of CH4 (non-combustible), H2, CO, CO2 and a small amount of steam, thus being partially suitable for utilization in an SOFC to produce electricity [3,4]. Obviously, the analogy between H2 and CO2, which are the main components for fuel cell operation while the other components remain intact through the device by following the main power plant’s path, notably affects the SOFC’s performance because the higher the hydrogen content, the more electricity is produced [5]. This analogy is attributed to the origin of biogas, i.e., by the biomass from which the biogas has been produced, while the operating conditions selected for the conversion of organic material to biogas are also important for the electricity produced [6].
In this context, several layouts of stand-alone power plants have been proposed, where a fuel cell is inevitably included [7,8,9]. In the present project, a thermodynamics-based model for the optimization of the operation of SOFC-based power plants is presented under specific assumptions (for details, see Section 2). The calculations of the system’s performance and efficiency are based on mass, energy and exergy balances, where the processes involved have been mathematically described. In order to examine the importance of biomass quality on the electricity produced, the model presented here may be supplied by several feed streams with different CH4/CO2 ratios, thus representing different biomass resources and production processes [10]. This concept constitutes the innovation of this work, since it is able to simulate experimentally unattainable cases, just by applying a great variety of different values for each parameter.
To specify the above, the present research work embodies an extensive parametric analysis on such FC based systems through a simulation model, which is able to use as the main supply fuel not only pure CH4 [11,12] but a variety of different qualities of biogas referring to real life scenarios as they are produced by different raw materials through the anaerobic digestion process.

2. Theory

The model, which is designed on a computational basis, is, in general, based on balances for mass, energy and exergy. These balances are applied on any device of the simulated power plant which is analytically presented in the simulation process of this study. Additionally, it is essential for these balances to become valid in every time step of the operational process of the entire plant. Regarding the mass balance, the core idea is as follows:
m a s s e n t e r s   t h e   d e v i c e   +   m a s s   g e n e r a t e d   i n t h e   d e v i c e   d u e t o   c h e m i c a l   r e a c t i o n s     m a s s   c o n s u m e d   i n t h e   d e v i c e   d u e o t   c h e m i c a l   r e a c t i o n s     m a s s   a c c u m u l a t e d   i n t h e   d e v i c e     m a s s   e x i t s t h e   d e v i c e   =   0
In an analogous way, the energy balance can be expressed as follows:
e n e r g y e n t e r s   t h e   d e v i c e   +   t h e r m a l   e n e r g y   g e n e r a t e d   i n t h e   d e v i c e   d u e t o   c h e m i c a l   r e a c t i o n s     t h e r m a l   e n e r g y   c o n s u m e d   i n t h e   d e v i c e   d u e t o   c h e m i c a l   r e a c t i o n s     e n e r g y   w a s t e s   r e l e a s e d   i n t h e   e n v i r o n m e n t     e n e r g y   e x i t s t h e   d e v i c e     w o r k   e x i t s t h e   d e v i c e   =   0
The energy entering a device is the chemical energy of the feed stream, depending on its composition, and the energy that the feed stream contains because of its temperature and flux velocity. The heat excesses or demands in any device depend on the existence and the extension of the reactions that take place there. If the produced heat is higher than necessary, a specific amount of thermal energy is released to the environment as thermal waste. In some cases, extra heat is necessary for a reaction to occur, thus a heat source is sometimes also required.
As for exergy, it is important to underline here that it follows the second law of thermodynamics; therefore, it is not a conservative physical magnitude, but it might be generated or destroyed. Therefore, the general form of the exergy balance is as follows:
e x e r g y e n t e r s   t h e   d e v i c e   +   e x e r g y   d u e   t o   h e a t   t r a n s f e r     e x e r g y d e s t r o y e d   i n   t h e   d e v i c e     e x e r g y   d u e   t o   w o r k   t r a n s f e r     e x e r g y   e x i t s t h e   d e v i c e   =   0
By assuming isobaric conditions, no-phase change and equilibrium for all the reactions considered here, the above generic relations can be mathematically described as follows [13]:
  • Energy balance for heat exchangers (see in Figure 1, devices D1, D2 and D3) [14]:
    T in i M i C P i in = T out i M i C P i out
    where T in and T out are the inlet and outlet temperatures (in K), respectively, at each branch of heat exchangers, M i is the mass (in mol) of species i, and C P i is the specific heat capacity (in J mol−1 K−1) of species i.
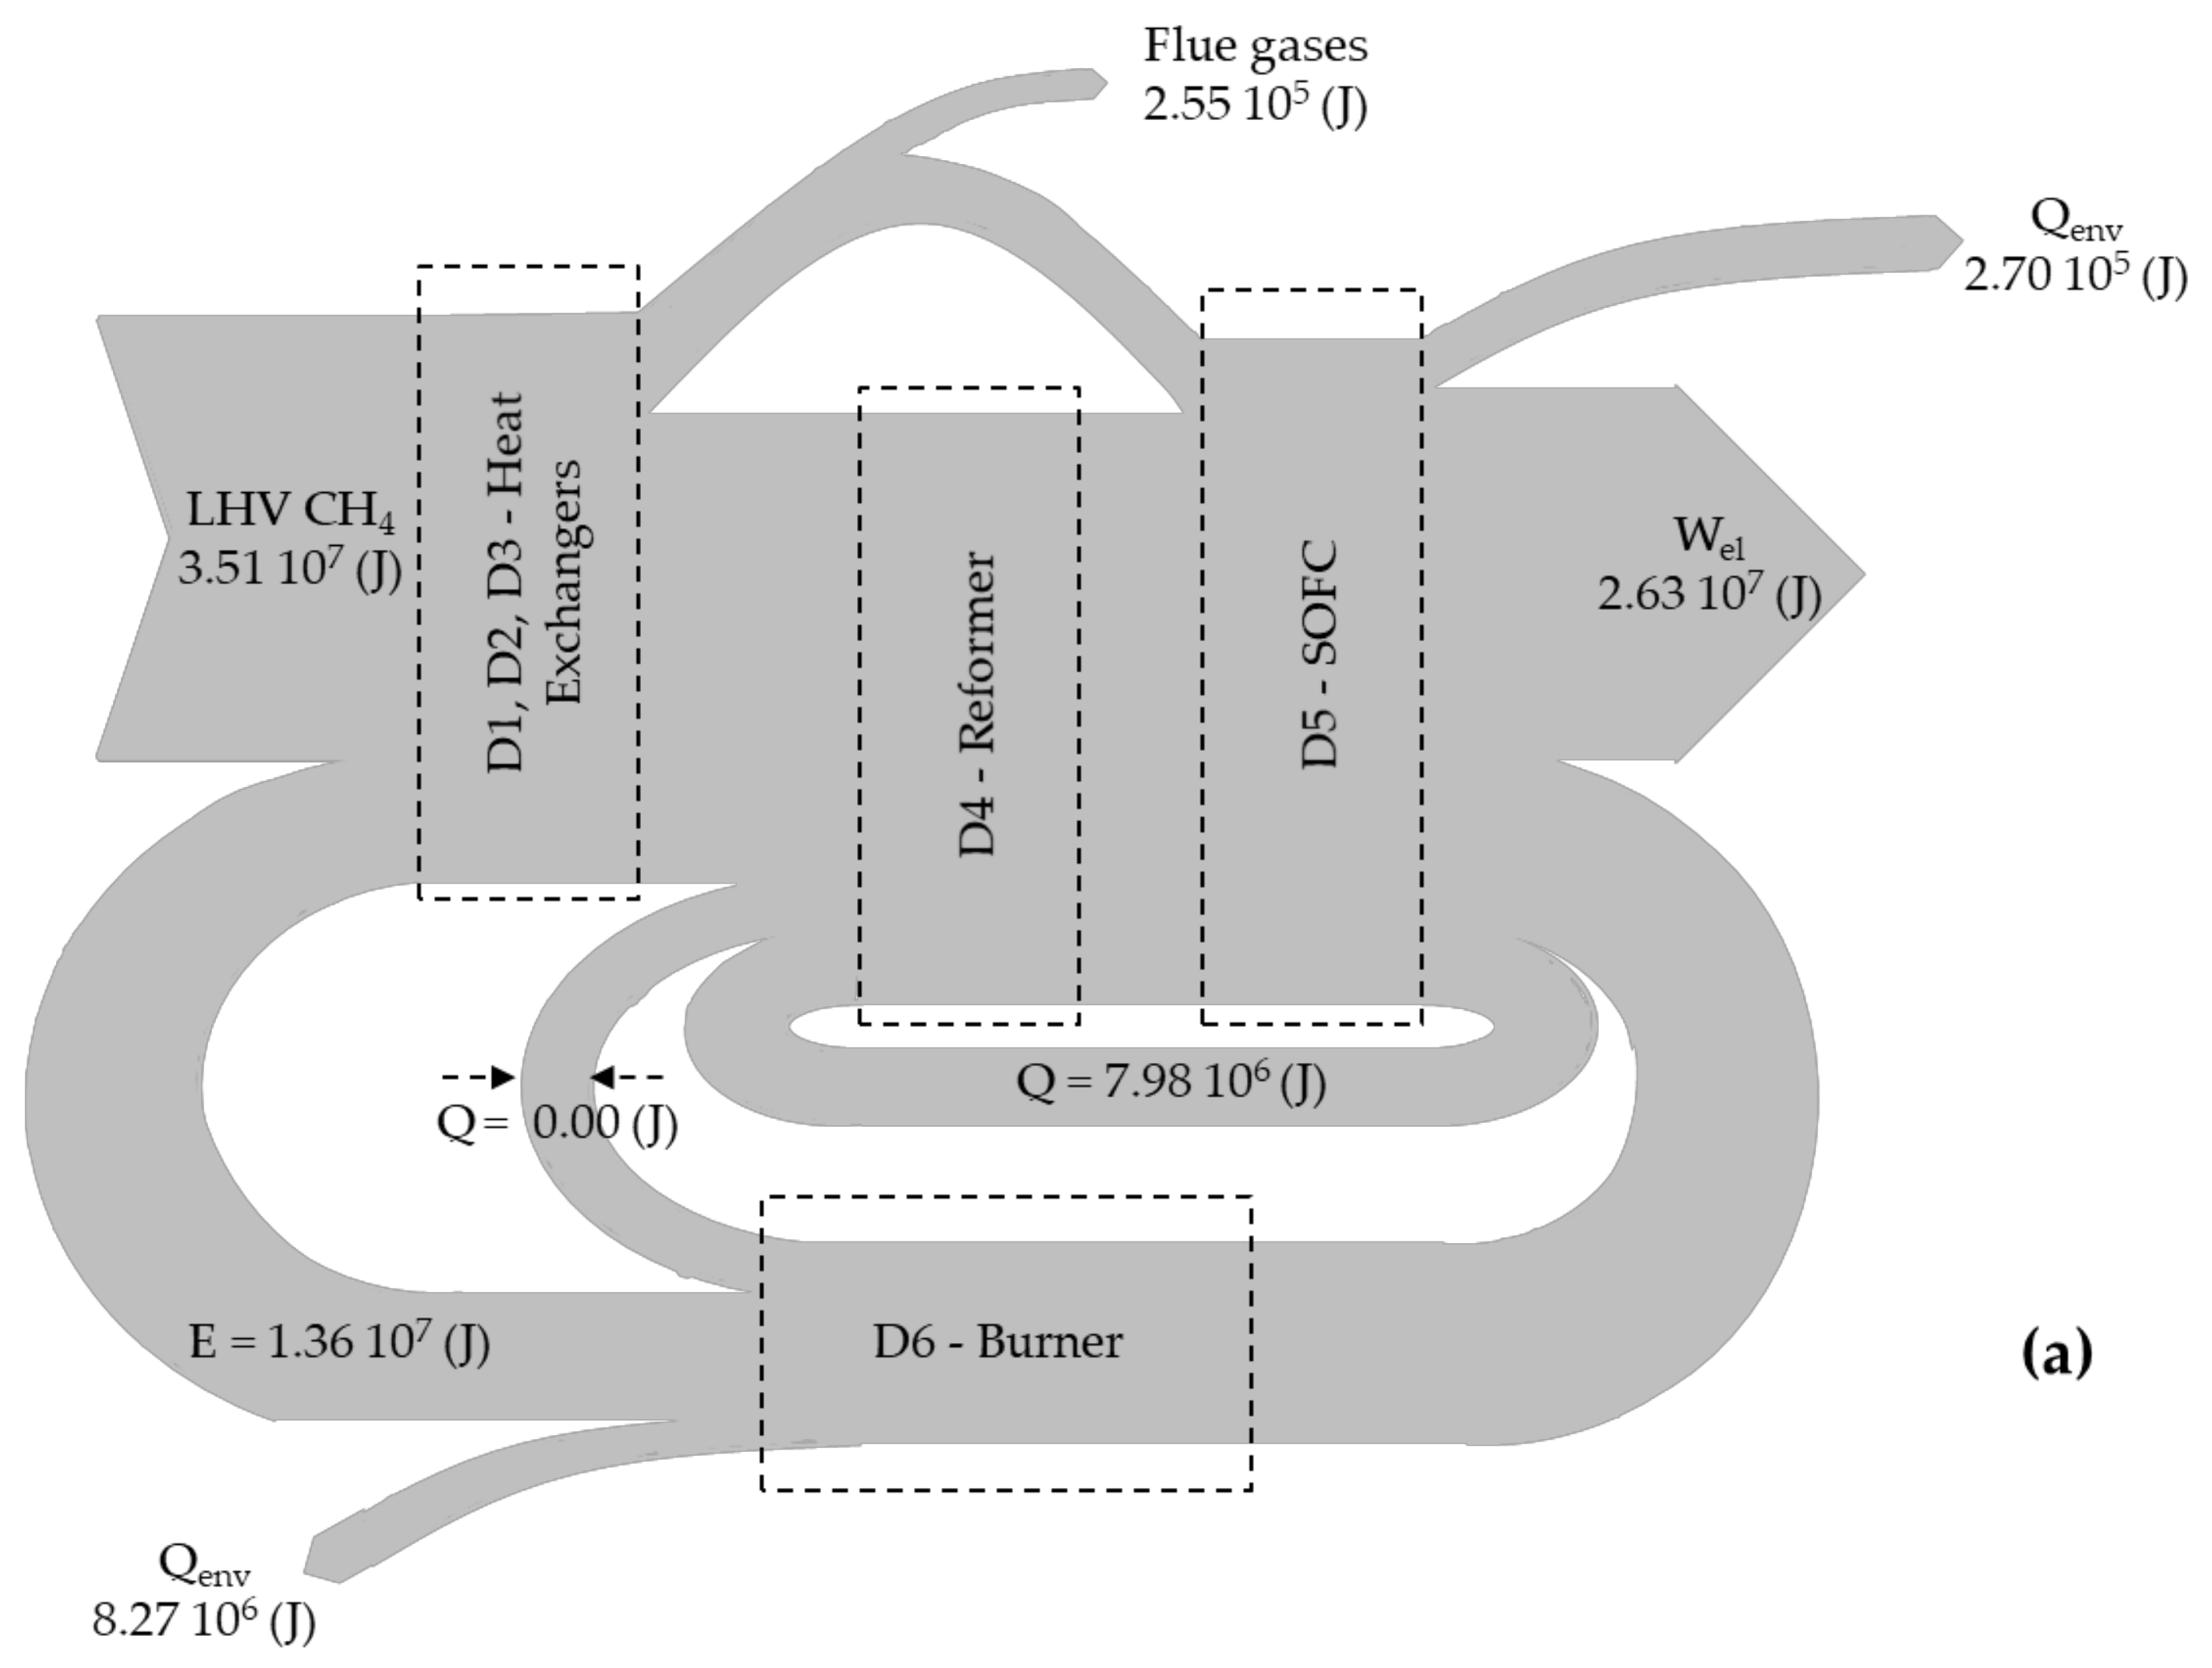
  • Energy balance for biogas reformer (see in Figure 1, device D4) [15]:
    T in i M i C P i in + Q burn ref + Δ H WGS   = T out i M i C P i out + Δ H ref
    where T in and T out are the inlet and outlet temperatures (in K) at each branch of the reformer, Q burn ref is the thermal energy (in J) that is transferred from the burner to the reformer, while Δ H WGS and Δ H ref are the enthalpies (in J mol−1) for the water gas shift and the methane reforming reaction, respectively.
  • Exergy balance for heat exchangers (see in Figure 1, devices D1, D2 and D3) [16]:
    l M tot Δ T i x i C P ε i in = l M tot Δ T i x i C P ε i out + I
    where M tot is the total mass (in mol), x i is the molar fraction of species i, Δ T is the temperature difference (in K), C P ε i is the mean isobaric exergy capacity (in J kmol−1 K−1) of species i, and I is the irreversibility rate (in J).
  • Exergy balance for biogas reformer (see in Figure 1, device D4) [16]:
    l M tot i x i ε 0 i + R T 0 i x i ln x i + M tot Δ T i x i C P ε i in + Q burn   ref T SOFC T 0 T SOFC   =   M tot i x i ε 0 i + R T 0 i x i ln x i + M tot Δ T i x i C P ε i out + I
    where ε 0 i is the exergy (in J) of species i at the state of the environment, R is the universal gas constant (= 8.1344 J mol−1 K−1), T 0 is the temperature (in K) at the state of the environment, and T SOFC is the operational temperature (in K) of the SOFC.
  • Exergy balance for the burner (see in Figure 1, device D6) [16]:
    I Q   =   Q burn   ref + Q burn   env T burn T 0 T burn
    where I Q is the irreversibility due to heat losses (in J), Q burn env is the thermal energy (in J) that is emitted to the environment, and T burn is the operational temperature (in K) of the burner.
  • Exergy balance of the SOFC (see in Figure 1, device D5) [16]:
    W el = r H prod T S prod + H react T S react
    where W el is the electric energy (in J) produced in the SOFC, H prod and H react are the enthalpies (in J) of the products and the reactants, respectively, while S prod and S react are the entropies (in J) of the products and the reactants, respectively.
  • Energy efficiency is calculated through the expression [12]:
    n en = W el M bio L H V bio
    where n en is the energetic efficiency, W el is the electric energy (in J) produced by the SOFC, M bio is the mass of biogas (in mol) entering the system (see Figure 1, path 2), and LHV is the lower heating value of the inlet fuel (= 802.34 kJ mol−1) measured at 298 K.
  • Exergy efficiency for each simulated scenario is calculated through the expression:
    n ex = W el M bio E x bio + M 1 E x 1 + M 3 E x 3
    where n ex is the exergetic efficiency, E x bio , E x 1 and E x 3 are the exergies (in J) of the biogas, the atmospheric air and the water in stream 2, 1 and 3 in Figure 1, respectively.
It is important to note here that the values for enthalpy and entropy used above are calculated by NASA polynomials [11,12]. Remarkable points as well as details about the estimation and calculation of the parameters used in the above equations can be found elsewhere [11,12].

3. Simulation

By considering the above presented theory, in the THERMAS computational tool, the designed simulated power plant is based on an SOFC device where the electricity is produced while a steam reformer is incorporated to the system in order to convert the biogas entering the system to a hydrogen reach gas, therefore being suitable for utilization in the fuel cell. In this research study, the simulated fuel for the power plant’s operation is a “model biogas”, consisting of two main components, CH4 and CO2, while inert impurities (less than 2%) are also contained. Such a feedstock can be produced from several organic raw materials [17]: anaerobic digestion of waste materials [18], urban organic waste [19], solid waste in landfill [20], organic fraction of municipal solid waste [21], lignocellulosic biomasses [22] and anaerobic co-digestion of multiple substrates [23].
Even if there are so many different sources for biogas production, the final product is a percentage of CH4 and CO2 over the whole amount of the inlet fuel (40–70% for CH4 and 25–60% for CO2) according to the type of waste source utilized, while all mixtures present an insignificant amount of impurities (<2%), mainly H2S and H2, which do not influence the process of biogas reforming, as previously stated. The above presented mixture leads to a specific ratio “λ” (concentration of methane over carbon dioxide), which represents in a unique manner the production source and route. During power plant operation, the impurities follow the main pipeline and are finally emitted to the environment through the flue gases [24].
Biogas reforming is nowadays a well-established technology and can be satisfactorily performed through several ways by using different catalysts during the reforming process, mainly named as dry reforming [25], bi-reforming (steam biogas reforming) [26] and tri-reforming [27]. In the present research study, by considering the simulated power plant, as presented in Figure 1, the essential amount of H2 for the SOFC’s feeding is exclusively produced through the steam biogas reforming process, which analytically presents by the first equation (see in Figure 1, Equation (1)) in the reformer device. Additionally, the present computational model embodies the electrochemical oxidization reaction of CO (see in Figure 1, Equation (2)) [27], and the extension can reach high levels in a low temperature range.
It is essential to be mentioned that CH4 reforming is not possible thermodynamically below 600 K [28], while the water-gas shift reaction is favored at lower temperatures (<800 K) [28]. In this respect, for the optimal simulated scenario of the present research project, the CH4 reforming has been chosen to be finalized at 1100 K, which is around the low limit of the optimal temperature range for this process. At this temperature, by using the appropriate catalyst (Ni/MgAl2O4), the extension of the reforming reaction can reach the percentage of 98% [29].
Now, as concerns the SOFC modelling, the CO oxidization (see in Figure 1, Equation (4)) can approximately reach the 1/4 (0–15%) of the extension of the hydrogen reaction, positively contributing the overall efficiencies (energy and exergy) of the total power plant [30]. In general, throughout the literature, most computational models do not embody the hydrogen reaction due to its low impact on the general system’s efficiency, contrary to THERMAS [11,12], which approaches real life scenarios and is used here. Additionally, the operational temperature for the fuel cell device, for the optimal simulated scenario of the present project, has been chosen as 1060 K through thermodynamic analysis, which is near the low limit, but it absolutely meets the requirements of the (Intermediate Temperature Solid Oxide Fuel Cell) IT-SOFC technology [31]. Finally, the thermal needs of the system can be covered through the combination of the thermal energy emitted from the exothermic reactions (see Figure 1, Equations (3) and (4)) of the SOFC and the heat released from an extra burner, while three heat exchangers are also used for assuring the thermal balance of the system [11]. At this point, it is important to clarify that the computational algorithm on which the THERMAS model is based initially uses the thermal load from the SOFC to cover the energy needs of reforming and then, if it is necessary, it uses the extra amount from the burner to cover the reforming process. The following Figure 1 depicts the plant.
To calculate the mass and energy balances, we assumed constant pressure (=1 Atm) for any process while the system is supposed to be supplied by a certain amount of model biogas (1 kg), while we also import air for the needs in the fuel cell and water in order to satisfy the reforming process. The ratio λ of CH4 over CO2 is very important, since the CH4 is the “useful” component of the biogas from which the hydrogen can be extracted and utilized in the cell. The above-mentioned mass balances were also written, thus formatting a linear system of 18 equations with 18 unknown masses, which was numerically solved for each time step. The extensions of all the reactions (see Figure 1) have been considered as parameters, whose values must be determined for the optimal operation of the plant. The constraint imposed as the main optimization criterion was the minimization of the energy losses, while the temperature of the flue gases emitted in the environment must be as low as possible.
The numerical errors caused by the approximations rather than exact measurements being available [32] have all been taken into account and sufficiently treated by defining the lowest acceptable accuracy (=10−17).

4. Results and Discussion
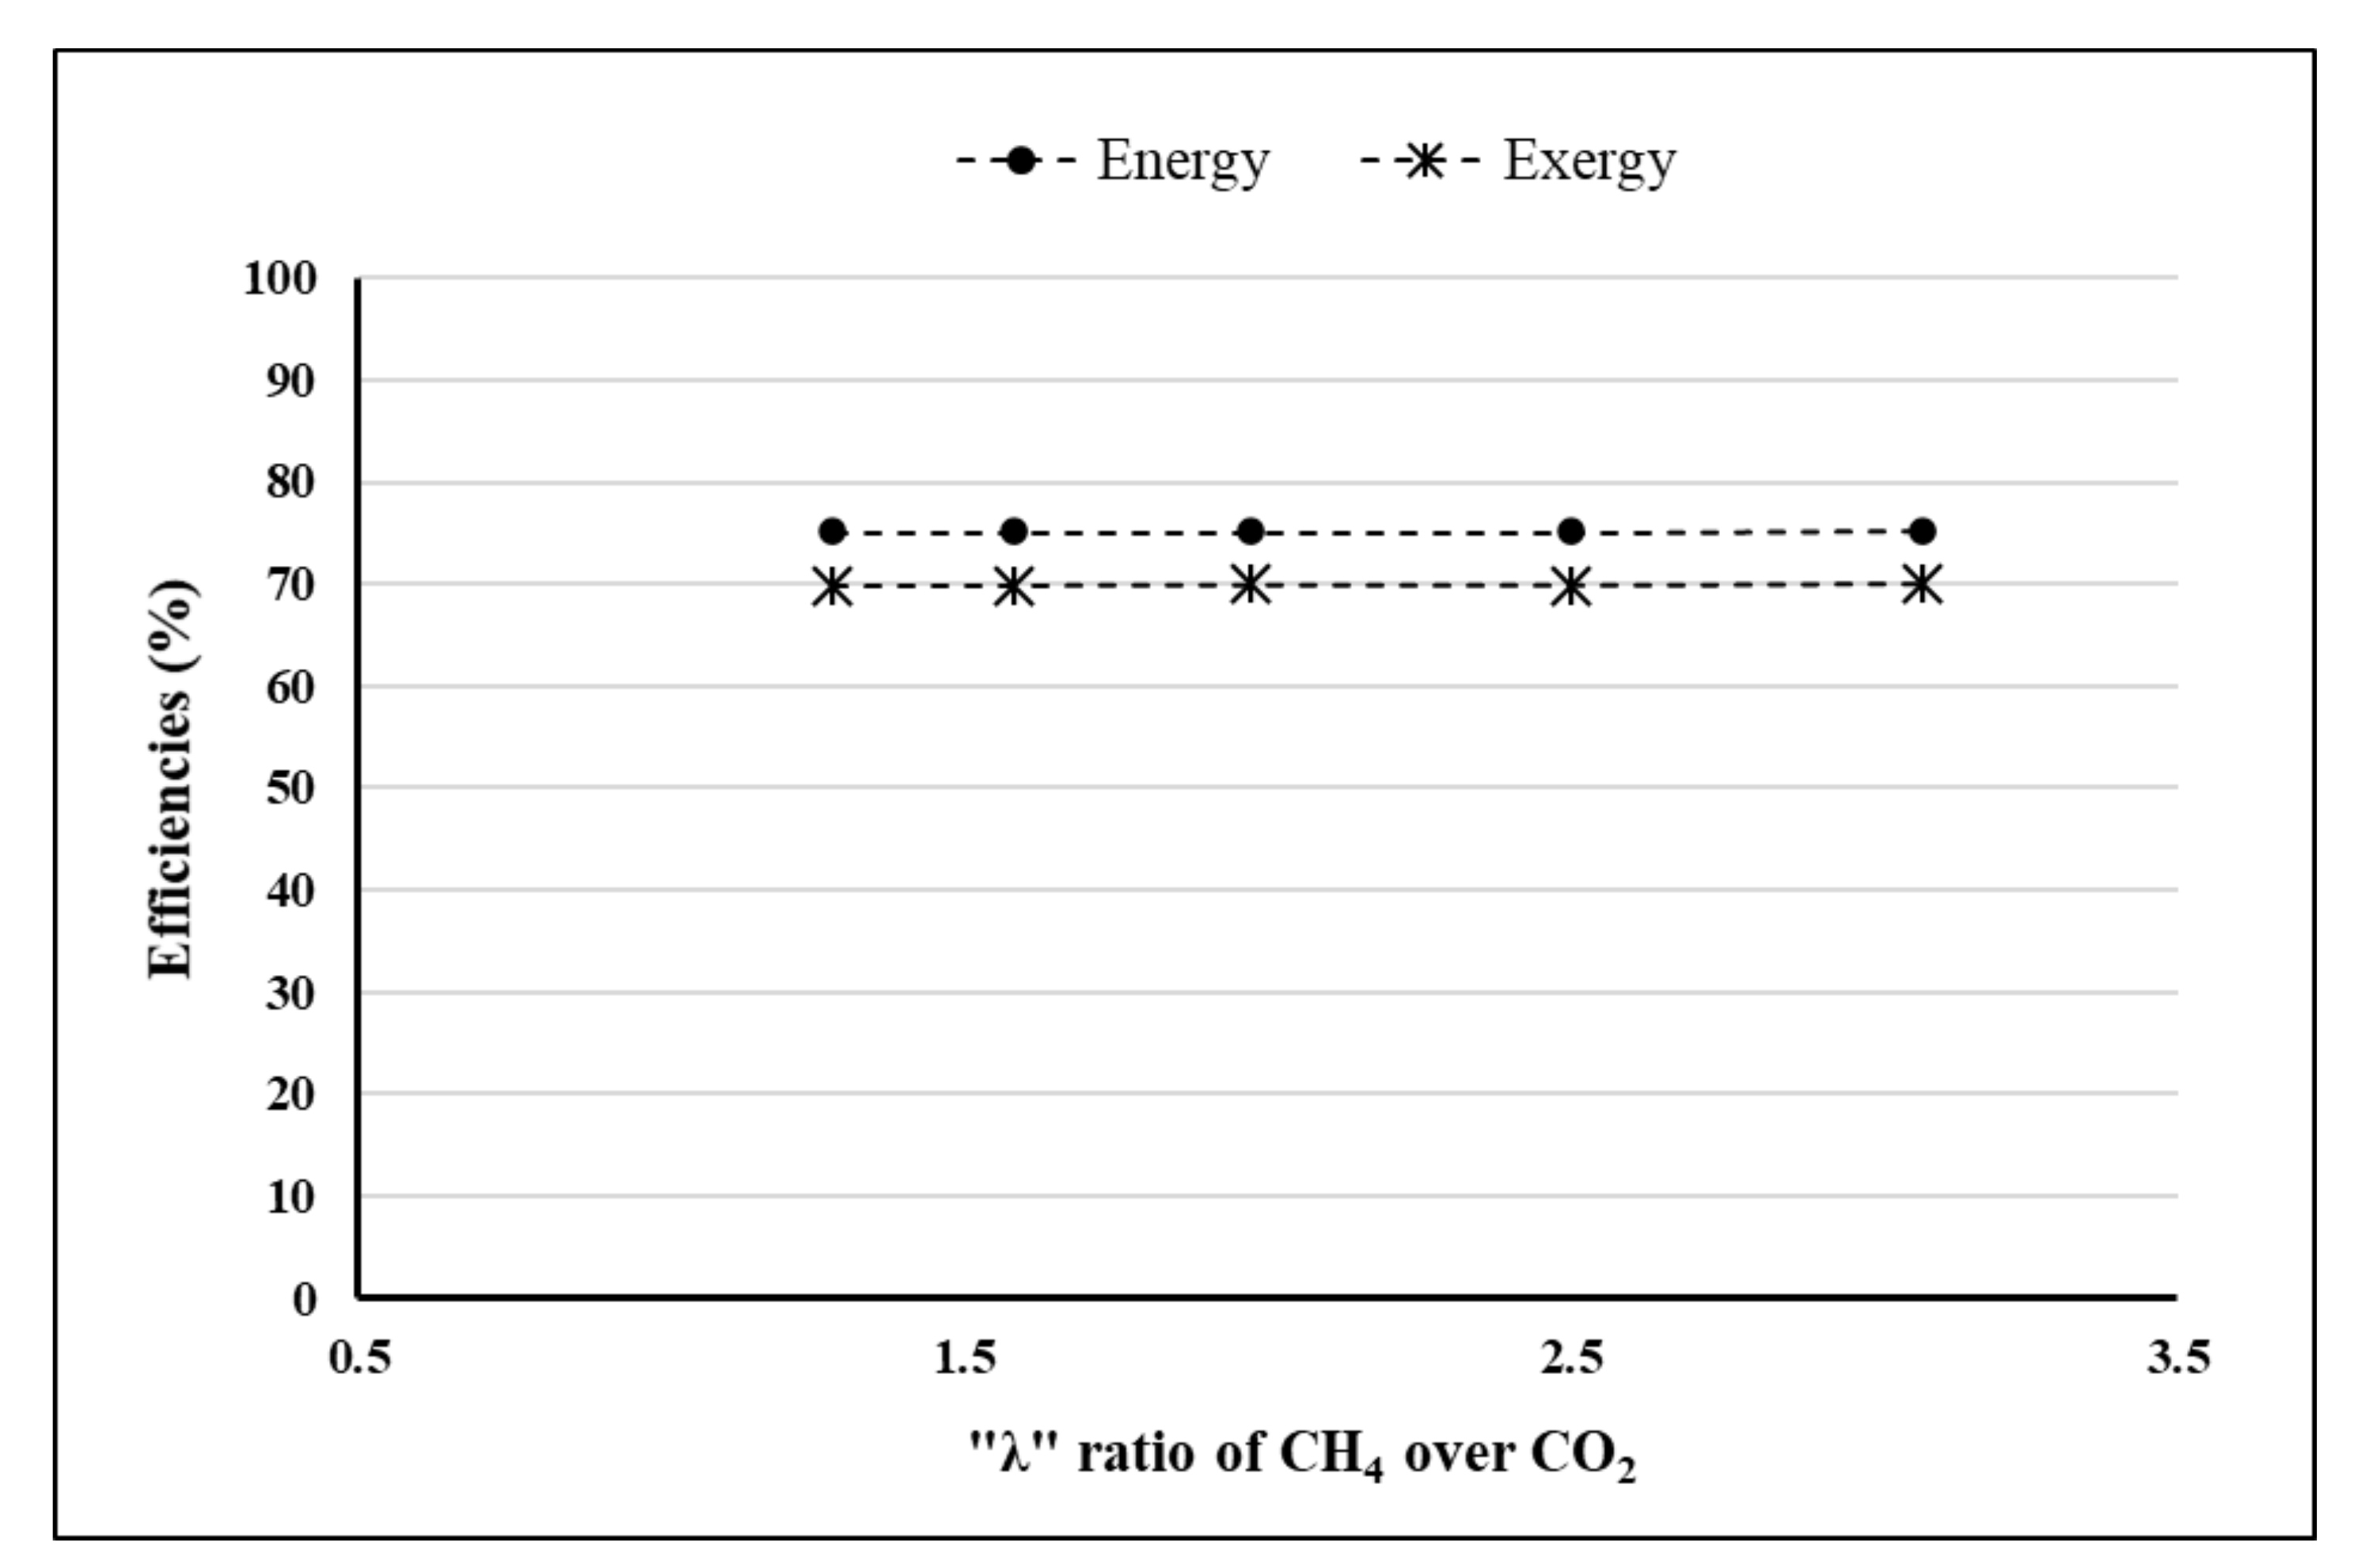
To start with, we present typical results for an optimized system. The overall performance of the power plant can be defined in both energetic and exergetic terms as the percentage ratio of the produced electricity over the chemical energy and exergy, respectively, that enter the system. The optimization was achieved by applying the parameters’ values as follows:
  • λ = 2.5.
  • Pressure = 1 Atm (constant).
  • Air excess at inlet = 26.80% over the stoichiometric requirement.
  • Water excess at inlet = 6.93% over the stoichiometric requirement.
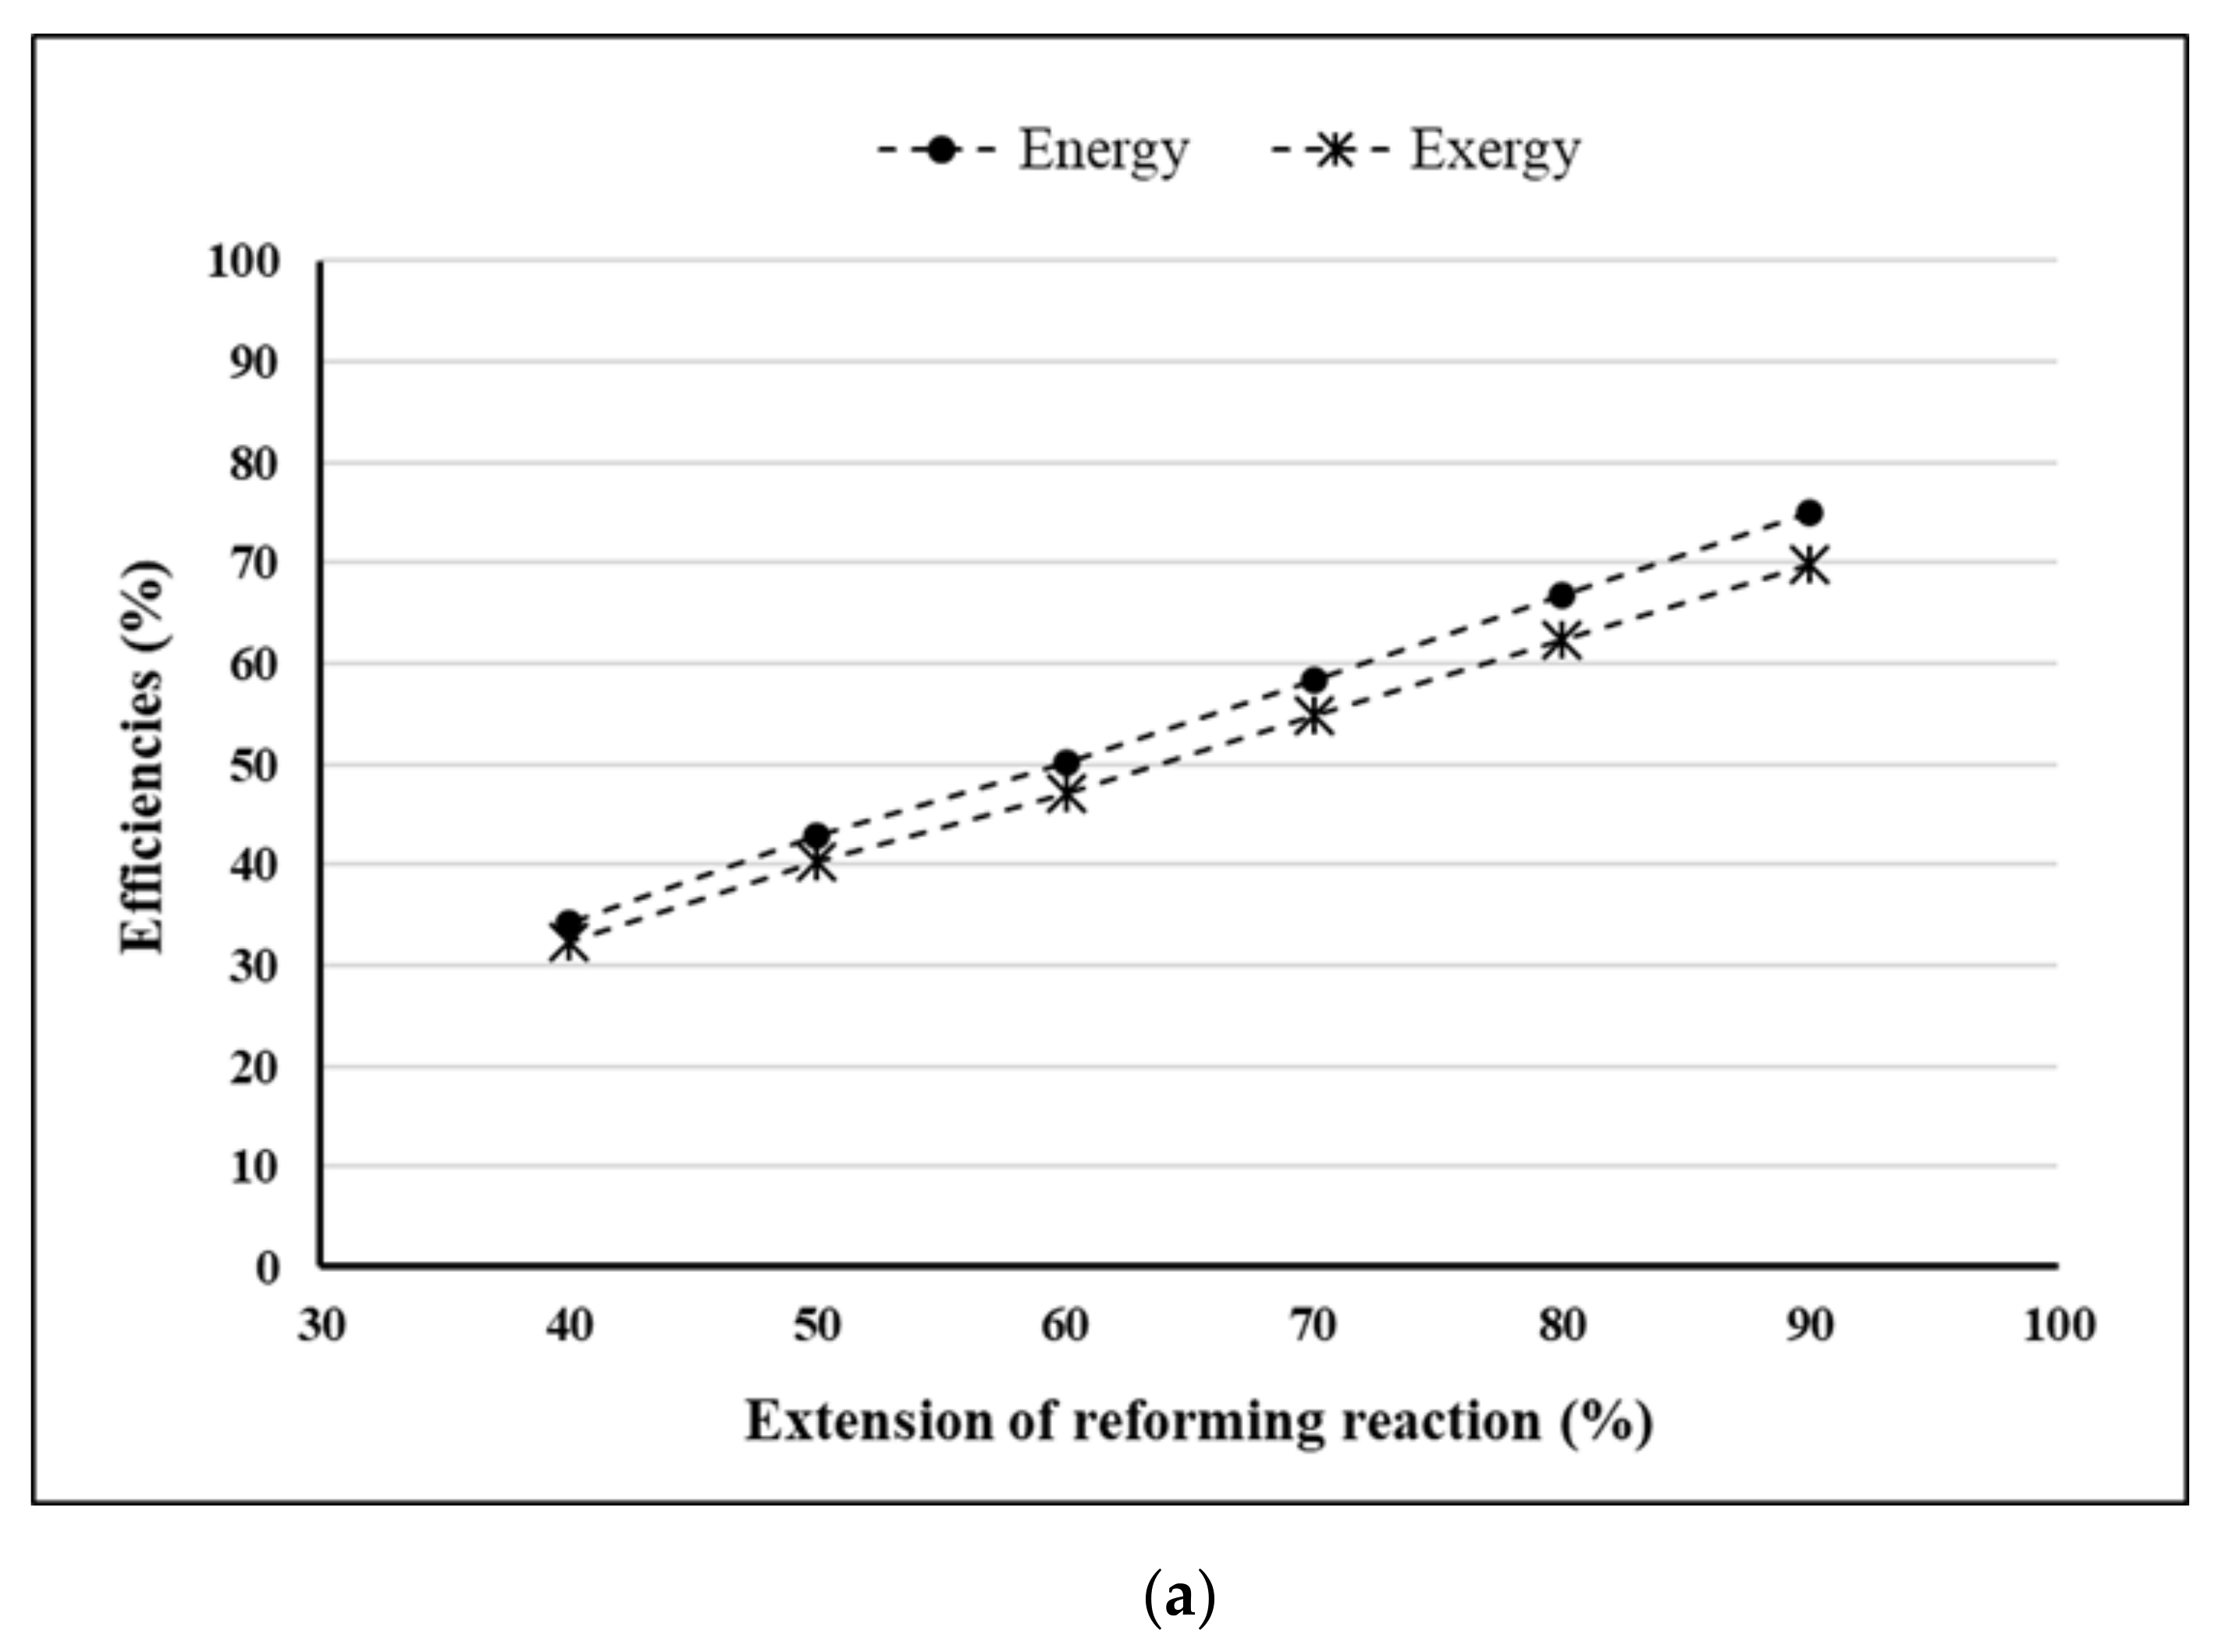
  • Extension of reforming reaction = 90%.
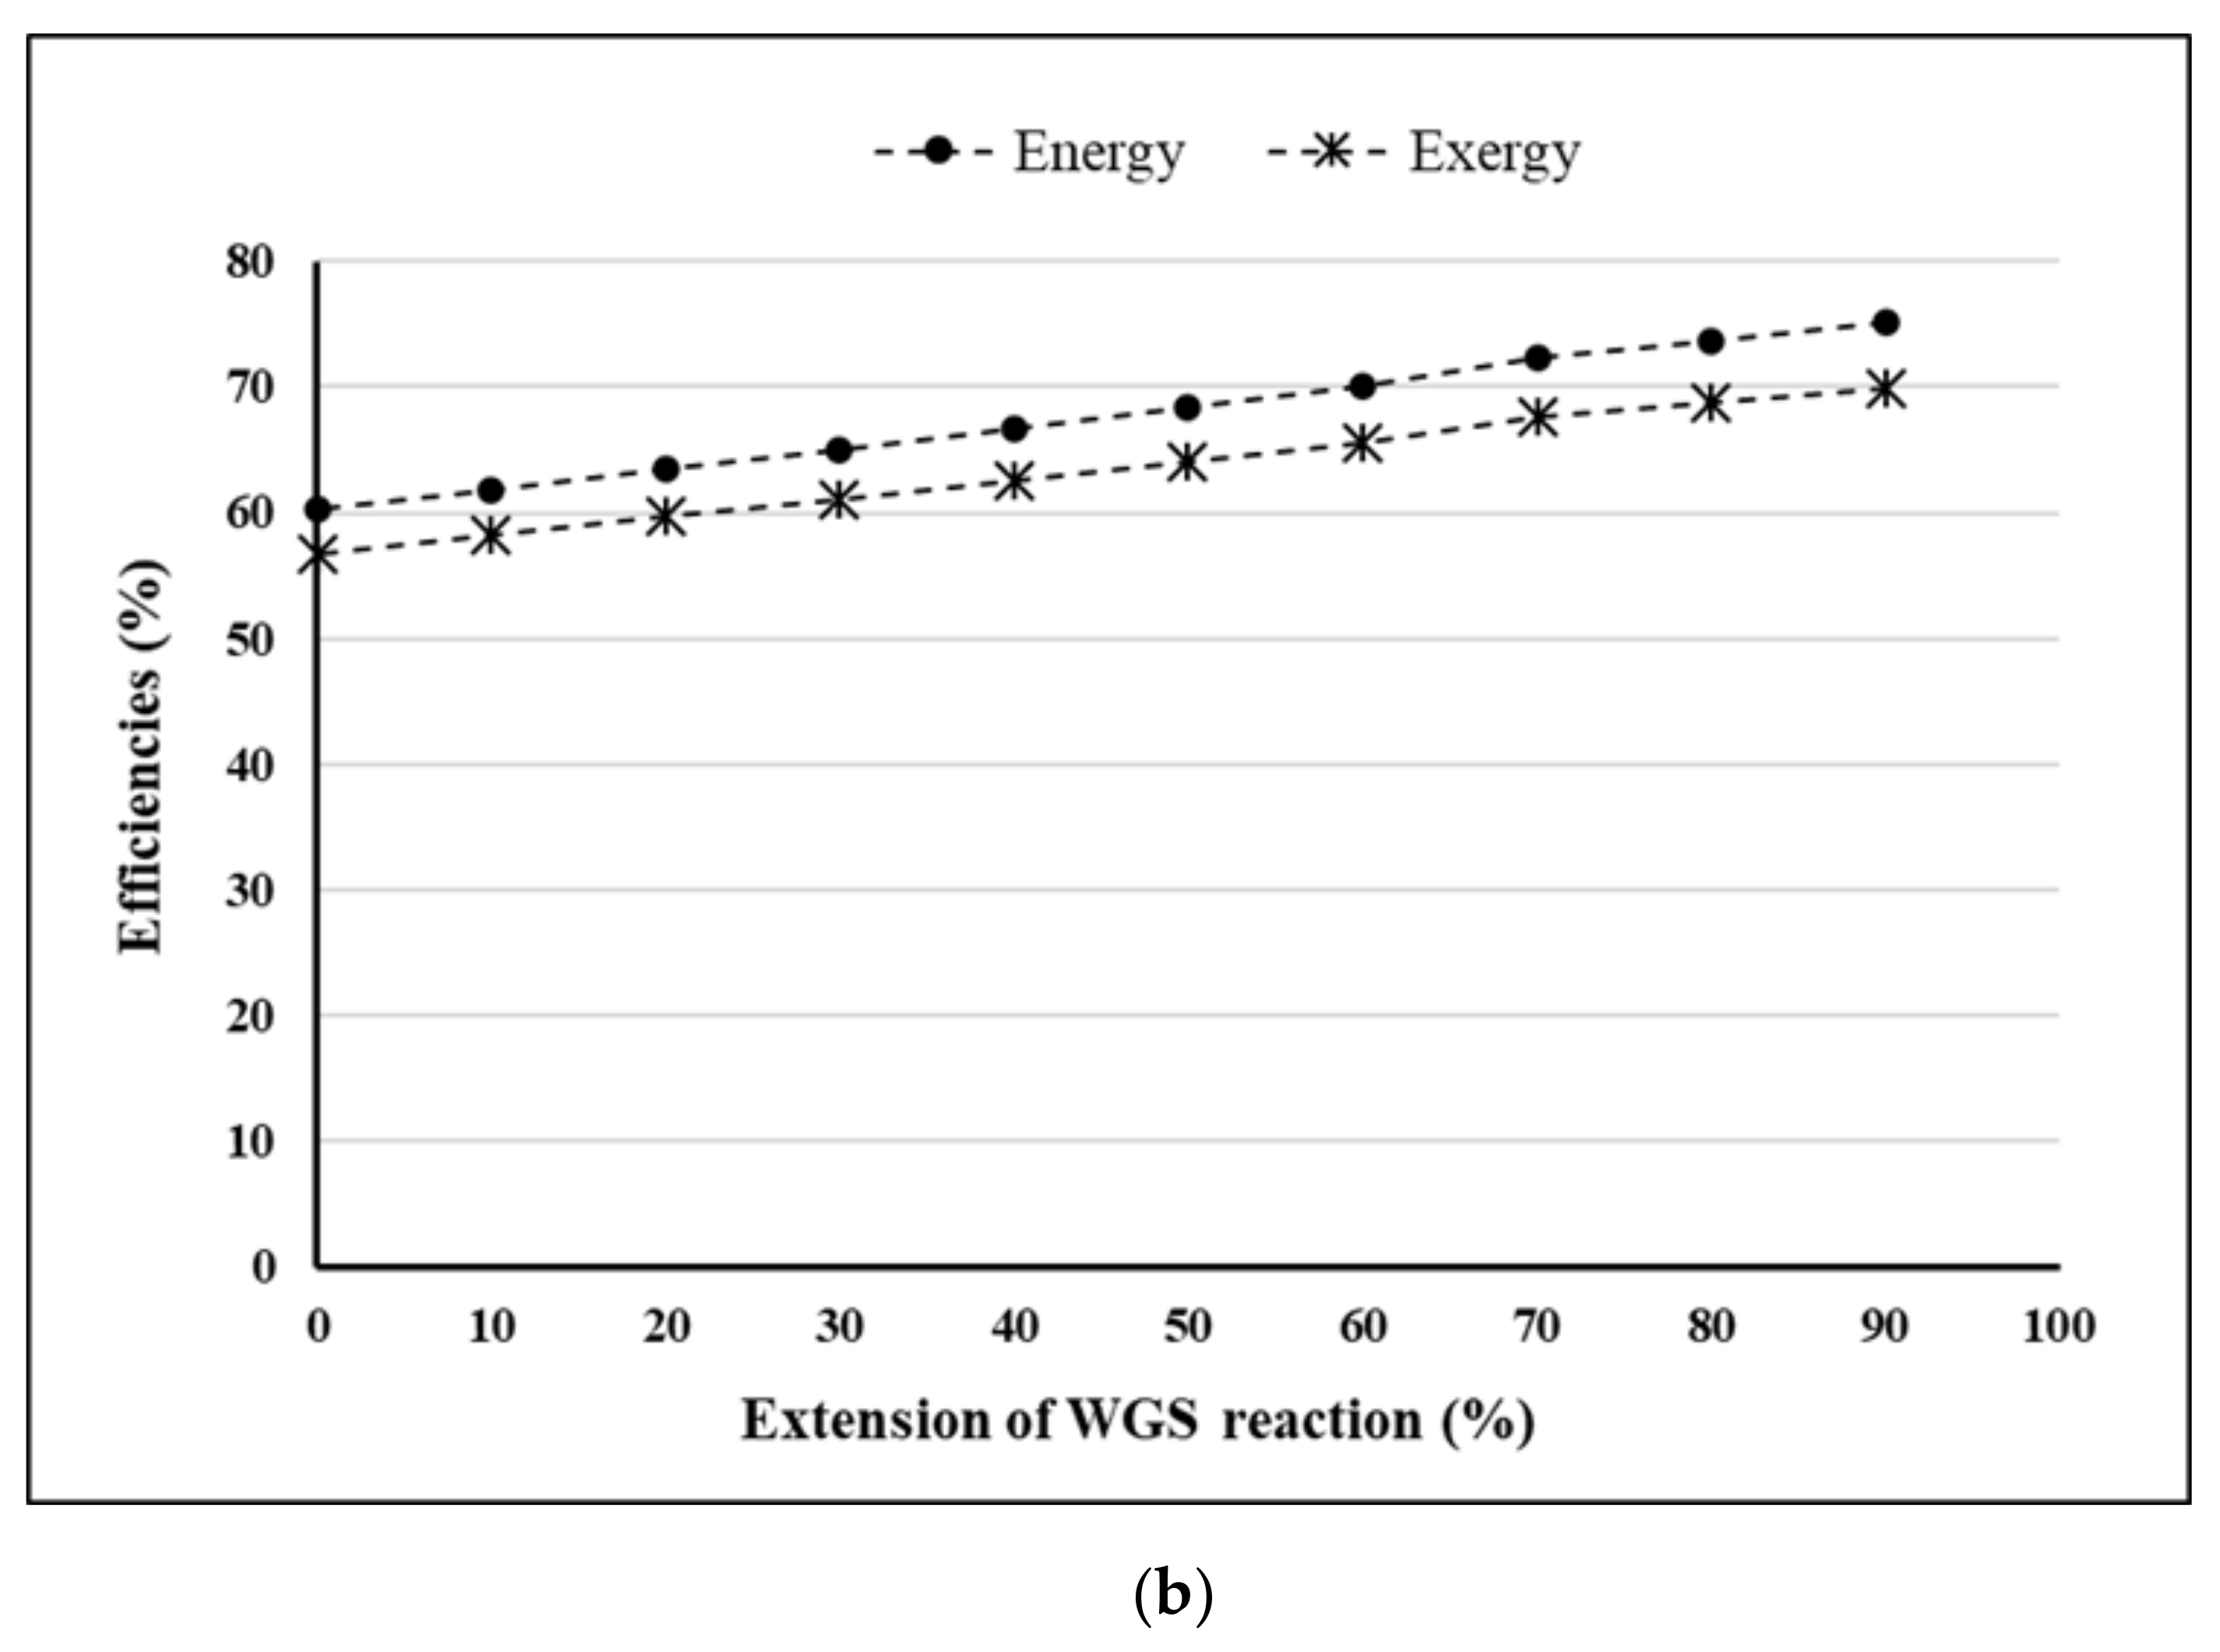
  • Extension of WGS reaction = 90%.
  • Extension of electrochemical oxidization of H2 = 90%.
  • Extension of CO reaction in the SOFC = 15%.
  • Temperature of burner = 1043 K.
  • Temperature of flue gases = 313.50 K.
In compliance with the notation introduced by Figure 1, Table 2 presents the temperatures, the masses and the energy at any branch of the system, as well as the overall energy and exergy efficiencies and the thermal losses.
The energetic efficiency reaches high levels (above 70%) due to the operational conditions: the reforming reaction is as extensive as 90%, corresponding to the large amount of hydrogen produced. In conjunction with the high utilization in the SOFC (90%) along with the high operational temperature for the reformer and the fuel cell, the efficiency of the system is estimated as very high. The minus sign during enthalpy’s calculations (last column of Table 2) results from the heat of the formation method, which is used to meet the energy balance among the several branches of the simulated power plant (see Figure 1).
As presented in Figure 2, the irreversibilities encountered by the optimized system are sufficiently low: 3.26% at the heat exchangers, 2.15% at the reformer, 5.25% at the fuel cell and 3.74% at the burner. These produce a total amount of 14.40%, which is more than acceptable to characterize the optimization process as successful.
To assure the reliability of the above results, we validated the results of the proposed model against published data for the case of a pure methane feed stream. Thus, we set λ = 198, a value that corresponds to a fuel consisting of 99% methane, and we produce the following results:
The above results are in good agreement with available data published elsewhere [12]. The slightly different estimations of the efficiencies presented here in Table 3 can be attributed to the developments of the THERMAS simulation tool, which took place throughout the years. This new version of the computational tool embodies a totally different approach to the management of the excess thermal energy produced during the power plant’s operation (see elsewhere in Section 4). This agreement allows for the extensive use of the model to analyze the system in terms of thermodynamics, sometimes simulating situations that are very tough to be attained experimentally.
The parametric analysis we performed here initially focuses on chemistry, since the production and utilization of hydrogen as well as the WGS are the crucial processes for electricity production. Chemistry is quantified here through the extension of the relative reactions, which is defined through the catalysts (materials) and the conditions. The effect of this extension of the crucial chemical reactions is brought by the following Figure 3. Precisely, the model considers the steam reforming reaction, the WGS reaction and the oxidation of hydrogen and carbon monoxide in the SOFC. As presented, the higher the extension of any reaction, the higher both the energetic and exergetic efficiencies.
For all the presented scenarios, the percentage of the inlet water and atmospheric air over the stoichiometric requirements can remain at the same level of the optimized system. It is important to be noted that by considering the WGS reaction (see Figure 3b) in a simulated project, the overall efficiencies can be improved up to 15% (from 0% to 90% of the reaction’s extension), while the difference between energy and exergy efficiency remains constant.
Given that exergy is the useful energy, i.e., the amount of exergy is only a part of the available energy, the energetic efficiency is higher than the exergetic one, while the trend of both curves is almost identical, in any case. The relative difference between these two efficiencies is always relatively low, thus indicating the successful optimization of the system’s performance [12]. Additionally, it is important to be mentioned that for reforming and electrochemical oxidization of H2 reactions, the extension cannot be set in values under 40% due to limitations of the system arising from the optimization. This means that by choosing values in this forbidden zone for both reactions, the SOFC’s and reformer’s temperature has to be set under 900 K in order to satisfy the energy and exergy balance of the system, while at this situation the thermal energy released from the burner to the environment reaches 65%.
The influence of biogas composition on the efficiency of the system appears in Figure 4, where several λ-ratios have been considered. As mentioned above as well as in the relative research literature, different raw materials and different digestion operating conditions correspond to biogas of different compositions, i.e., of different “λ” ratios [24]. Additionally, in order to compare different simulated scenarios using several ratios of CH4 over the inlet biogas, it is important to keep the inflow of water and atmospheric air almost constant (see Figure 1, branch 1 and 3) at ≈7% and 27% over the stoichiometric requirements accordingly, as they have been chosen for the optimized system (see Table 2). Finally, temperatures for reforming, the SOFC and burner operation for all the simulated projects have been set at those of the optimized system, as presented above.
Higher λ values actually correspond to biogas that is rich in methane, and therefore more suitable to be utilized in the reformer to produce H2. In this sense, the energy and exergy efficiency remain almost constant with λ. It is worth noticing that even if the systems which are fed by biogas of low ratios appear to produce lower electric energy up to 35.3% in absolute value (see Figure 5), they can keep their efficiencies in higher levels under a proper optimization process (the difference between system with λ = 1.28 and λ = 3.08). This is because CO2 does not contain significant exploitable energetic content that can be utilized in the given power plant. The behavior of the efficiency with the biogas compositions sounds quite strange, but can be easily explained, as presented through Figure 5. The feed steams of low methane content produce low electricity, but it is necessary to underline that their energetic content is low as well. On the other hand, the ratio between these two magnitudes, for the optimized systems, is of the same high level as for high-methane fuels. Nevertheless, Figure 5 reveals the chemical energy of the fuel, the electricity produced and the thermal losses of the system for different biogas compositions (as presented elsewhere in the manuscript) to clearly explain the approximately constant behavior for the energy efficiency, as obtained through the optimization process.

5. Conclusions

In this work, a power plant based on an SOFC and supplied by biogas has been simulated for various biogas compositions. It is found that the extension of all the reactions should be of high level, except of CO oxidization, which does not seriously affect the power plant’s overall efficiency due to the limitations imposed by the reaction itself. Although of low contribution, CO oxidation must be incorporated in the system to assure the completeness of the analysis. In this respect, an indicative result is that by setting the extension of the CO oxidization reaction to zero, the system’s overall efficiency drops only by less than 1%. As expected, the reforming reaction is more critical than the WGS, while hydrogen utilization in the cell is actually the key player for increasing the system’s performance. Furthermore, the biogas composition, as seen through “λ”, is the most decisive parameter that strongly affects both the optimization of the system as well as its energy performance in absolute values, while the overall exergy and energy efficiency can be of almost constant trend, even for supplying fuels of CH4 content lower than 75%. By moving towards methane-richer fuels, both energy and exergy attain high levels (see Figure 5), while the relative efficiencies are approximately constant (t ~75% and ~69%, respectively, see Figure 4). Feedstock, such as agricultural residues and landfill waste, is more suitable to produce hydrogen-rich biogas through anaerobic digestion [31].

Author Contributions

Conceptualization, F.A.C.; methodology, F.A.C.; software, G.N.P.; validation, G.N.P.; formal analysis, G.N.P.; investigation, G.N.P.; resources, F.A.C.; data curation, G.N.P.; writing—original draft preparation, F.A.C.; writing—review and editing, F.A.C.; visualization, G.N.P.; supervision, F.A.C.; project administration, F.A.C. All authors have read and agreed to the published version of the manuscript.

Funding

This research has been financed by the European Union and Greek national funds under the call “Greece—China Call for Proposals for Joint RT&D Projects” (Project SYNAGRON, code: T7DKI-00388).

Institutional Review Board Statement

Not applicable.

Informed Consent Statement

Not applicable.

Conflicts of Interest

The authors declare no conflict of interest.

Nomenclature

Latin symbols
CPMolar Isobaric Specific Heat Capacity (J mol−1 K−1)
C P ε Mean Isobaric Exergy Capacity (J kmol−1 K−1)
ExExergy (J)
HEnthalpy (J)
IIrreversibility (J)
IQIrreversibility due to heat losses (J)
LHVLower Heating Value, 802.34 (kJ mol−1)
MMass (mol)
nEfficiency (%)
QThermal Energy (J)
RGas constant, 8.1344 (J mol−1 K−1)
SEntropy (J)
TTemperature (K)
WWork (J)
xMolar fraction
Greek symbols
ΔHEnthalpy of a reaction (J mol−1)
ΔTTemperature difference (K)
εExergy (J)
Subscripts
0Property at the state of the environment
3Property at path 3 of Figure 1
bioBiogas
burnBurner
burn envFrom burner to environment
burn refFrom burner to reformer
elElectric
enEnergy
exExergy
iIndex for chemical species
inInput
lStreams throughout a device
outOutput
prodProducts (chemical elements)
rChemical reaction
reactReactants (chemical elements)
SOFCSolid Oxide Fuel Cell
totTotal amount of components

References

  1. Brouzgou, A.; Demin, A.; Tsiakaras, P. Interconnects for Solid Oxide Fuel Cells. In Advances in Medium and High Temperature Solid Oxide Fuel Cell Technology; Boaro, M., Salvatore, A., Eds.; CISM International Centre for Mechanical Sciences (Courses and Lectures); Springer: Cham, Switzerland, 2017; Volume 574. [Google Scholar] [CrossRef]
  2. Amiri, A.; Tang, S.; Steinberger-Wilckens, R.; Tadé, M.O. Evaluation of fuel diversity in Solid Oxide Fuel Cell system. Int. J. Hydrog. Energy 2018, 43, 23475–23487. [Google Scholar] [CrossRef] [Green Version]
  3. Salman, C.A.; Schwede, S.; Thorin, E.; Yan, J. Enhancing biomethane production by integrating pyrolysis and anaerobic digestion processes. Appl. Energy 2017, 204, 1074–1083. [Google Scholar] [CrossRef]
  4. Hubner, T.; Mumme, J. Integration of pyrolysis and anaerobic digestion—Use of aqueous liquor from digestate pyrolysis for biogas production. Bioresour. Technol. 2015, 183, 86–92. [Google Scholar] [CrossRef] [PubMed]
  5. Cozzolino, R.; Lombardi, L.; Tribioli, L. Use of biogas from biowaste in a solid oxide fuel cell stack: Application to an off-grid power plant. Renew. Energy 2017, 111, 781–791. [Google Scholar] [CrossRef]
  6. Radenahmad, N.; Azad, A.T.; Saghir, M.; Taweekun, J.; Abu Bakar, M.S.; Reza, M.R.; Azad, A.K. A review on biomass derived syngas for SOFC based combined heat and power application. Renew. Sustain. Energy Rev. 2020, 119, 109560. [Google Scholar] [CrossRef]
  7. Van herle, J.; Membrez, Y.; Bucheli, O. Biogas as a fuel source for SOFC co-generators. J. Power Sources 2004, 127, 300–312. [Google Scholar] [CrossRef]
  8. Akkaya, A.V.; Erdem, H.H.; Sahin, B. An analysis of SOFC/GT CHP system based on exergetic performance criteria. Int. J. Hydrog. Energy 2008, 33, 2566–2577. [Google Scholar] [CrossRef]
  9. Tang, S.; Amiri, A.; Tadé, M.O. System Level Exergy Assessment of Strategies Deployed for Solid Oxide Fuel Cell Stack Temperature Regulation and Thermal Gradient Reduction. Ind. Eng. Chem. Res. 2019, 58, 2258–2267. [Google Scholar] [CrossRef]
  10. Athanasiou, C.; Vakouftsi, E.; Coutelieris, F.A.; Marnellos, G.; Zabaniotou, A. Efficiencies of olive kernel gasification combined cycle with solid oxide fuel cells (SOFCs). Chem. Eng. J. 2009, 149, 183–190. [Google Scholar] [CrossRef]
  11. Prodromidis, G.N.; Coutelieris, F.A. Thermodynamic analysis of biogas fed solid oxide fuel cell power plants. Renew. Energy 2017, 108, 1–10. [Google Scholar] [CrossRef]
  12. Prodromidis, G.N.; Coutelieris, F.A. Solid Oxide Fuel Cell systems for electricity generation: An optimization prospect. Renew. Energy 2020, 146, 38–43. [Google Scholar] [CrossRef]
  13. Szargut, J. Chemical Exergies of the Elements. Appl. Energy 1989, 32, 269–285. [Google Scholar] [CrossRef]
  14. Perry, R.H.; Green, D.W. Perry’s Chemical Engineers’ Handbook, 7th ed.; McGraw-Hill: New York, NY, USA, 1999. [Google Scholar]
  15. Bejan, A.; Tsatsaronis, G.; Moran, M. Thermal Design and Optimization, 1st ed.; John Wiley & Sons: Hoboken, NJ, USA, 1996. [Google Scholar]
  16. Kotas, T.J. The Exergy Method of Thermal Plant Analysis; Krieger: Malabar, FL, USA, 1995. [Google Scholar]
  17. Vita, A.; Italiano, C.; Fabiano, C.; Lagana, M.; Pino, L. Biogas as renewable raw material for syngas production by tri-reforming process over NiCeO2 catalysts: Optimal operative condition and effect of nickel content. Fuel Process Technol. 2014, 127, 47–58. [Google Scholar] [CrossRef]
  18. Yentekakis, I.V.; Goula, G.; Panagiotopoulou, P.; Katsoni, A.; Diamantopoulos, E.; Mantzavinos, D.; Delimitris, A. Dry reforming of methane: Catalytic performance and stability of Ir catalysts supported on γ-Al2O3, Zr0.92Y0.08O2–δ (YSZ) or Ce0.9Gd0.1O2–d (GDC) supports. Top. Catal. 2015, 58, 1228–1241. [Google Scholar] [CrossRef]
  19. Zhang, X.; Yang, C.; Zhang, Y.; Xu, Y.; Shang, S.; Yin, Y. Ni-Co catalyst derived from layered double hydroxides for dry reforming of methane. Int. J. Hydrog. Energy 2015, 40, 16115–16126. [Google Scholar] [CrossRef]
  20. Broun, B.; Sattler, M. A comparison of greenhouse gas emissions and potential electricity recovery from conventional and bioreactor landfills. J. Clean. Prod. 2016, 112, 2664–2673. [Google Scholar] [CrossRef]
  21. Del Valle-Zermeno, R.; Romero-Guiza, M.S.; Chimenos, J.M.; Formosa, J.; Mata-Alvarez, J.; Astals, S. Biogas upgrading using MSWI bottom ash: An integrated municipal solid waste management. Renew. Energy 2015, 80, 184–189. [Google Scholar] [CrossRef]
  22. Vita, A.; Italiano, C.; Fabiano, C.; Lagana, M.; Pino, L. Influence of Ce-precursor and fuel on structure and catalytic activity of combustion synthesized Ni/CeO2 catalysts for biogas oxidative steam reforming. Mater. Chem. Phys. 2015, 163, 337–347. [Google Scholar] [CrossRef]
  23. Siddique, M.N.I.; Wahid, Z.A. Achievements and perspectives of anaerobic co-digestion: A review. J. Clean. Product. 2018, 194, 359–371. [Google Scholar] [CrossRef]
  24. Zhao, X.; Joseph, B.; Kuhn, J.; Ozcan, S. Biogas Reforming to Syngas: A Review. iScience 2020, 23, 101082. [Google Scholar] [CrossRef]
  25. Charisiou, N.D.; Douvartzides, S.L.; Siakavelas, G.I.; Tzounis, L.; Sebastian, V.; Stolojan, V.; Hinder, S.J.; Baker, M.A.; Polychronopoulou, K.; Goula, M.A. The relationship between reaction temperature and carbon deposition on nickel catalysts based on Al2O3, ZrO2 or SiO2 supports during the biogas dry reforming reaction. Catalysts 2019, 9, 676. [Google Scholar] [CrossRef] [Green Version]
  26. Roy, P.S.; Song, J.; Kim, K.; Park, C.S.; Raju, A.S.K. CO2 conversion to syngas through the steam-biogas reforming process. J. CO2 Util. 2018, 25, 275–282. [Google Scholar] [CrossRef] [Green Version]
  27. Walker, D.M.; Pettit, S.L.; Wolan, J.T.; Kuhn, J.N. Synthesis gas production to desired hydrogen to carbon monoxide ratios by tri-reforming of methane using Ni-MgO-(Ce, Zr) O2 catalysts. Appl. Catal. A Gen. 2012, 445–446, 61–68. [Google Scholar] [CrossRef]
  28. Elsayed, N.H.; Maiti, D.; Joseph, B.; Kuhn, J.N. Precious metal doped Ni-Mg/ceria-zirconia catalysts for methane conversion to syngas by low temperature bi-reforming. Catal. Lett. 2018, 148, 1003–1013. [Google Scholar] [CrossRef]
  29. Rahmat, N.; Yaakob, Z.; Rahman, N.A.; Jahaya, S.S. Renewable hydrogen-rich syngas from CO2 reforming of CH4 with steam over Ni/MgAl2O4 and its process optimization. Int. J. Environ. Sci. Technol. 2019, 17, 843–856. [Google Scholar] [CrossRef]
  30. Vakouftsi, E.; Marnellos, G.; Athanassiou, C.; Coutelieris, F.A. CFD modeling of a biogas fuelled SOFC. Solid State Ion. 2011, 192, 458–463. [Google Scholar] [CrossRef]
  31. Hossain, S.; Abdalla, A.M.; Jamain, S.N.B.; Zaini, J.H.; Azad, A.K. A review on proton conducting electrolytes for clean energy and intermediate temperature-solid oxide fuel cells. Renew. Sustain. Energy Rev. 2017, 79, 750–764. [Google Scholar] [CrossRef]
  32. Szargut, J.; Kolenda, Z.; Taramin, K. Co-ordination of material and energy balances as a basis of combustion process optimization. Int. J. Energ. Res. 1981, 5, 253–261. [Google Scholar] [CrossRef]
Figure 1. Flow chart of the power plant.
Applsci 11 03112 g001
Figure 2. Sankey’s energy (a) and exergy (b) diagram for the optimized system (λ = 2.5).
Applsci 11 03112 g002aApplsci 11 03112 g002b
Figure 3. System’s efficiency as a function of extension of reforming reaction (a), extension of WGS reaction (b) and extension of electrochemical oxidation (c).
Applsci 11 03112 g003aApplsci 11 03112 g003bApplsci 11 03112 g003c
Figure 4. Effect of “λ” on system’s efficiency.
Applsci 11 03112 g004
Figure 5. Effect of “λ” on system’s inlet energy (ENin), the produced electricity (ENout) and the thermal wastes to the environment (Q).
Applsci 11 03112 g005
Table 1. Common substrates for biogas production.
Sources of BiogasCH4 Content (%)CO2 Content (%)H2O, N2, O2, H2, H2S (%)
Organic raw materials45–7525–55Mainly H2O: 2–7%, while the other impurities appear at less than 2%, analogous to primary source.
Anaerobic digestion of waste materials45–7030–55
Urban organic waste40–7030–60
Solid waste in landfill40–6040–60
Organic fraction of municipal waste55–7030–45
Lignocellulosic biomasses and sewage sludge55–7030–45
Table 2. Typical results for the optimized system, λ=2.5.
BranchElementsTemperature (K)Mass Flux (Kg/s)Enthalpy (×106 J)
1Atmospheric Air (O2 and N2)298.0011.55+0.0044
2Biogas (CH4, CO2 and H2O)298.001.00−6.0400
3Water (H2O)298.001.44−21.0000
4Biogas (CH4, CO2 and H2O)1100.001.00−3.7600
5CH4, CO2, H2O, H2, CO1120.002.44−12.7000
6Steam (H2O)1100.001.44−16.9000
7CH4, CO2, H2O, H2, CO, O2 and N21025.0013.94−38.6000
8CH4, CO2, H2O, H2, CO, O2 and N21043.5013.94−46.9000
9CH4, CO2, H2O, H2, CO, O2 and N2921.5013.94−49.2750
10CH4, CO2, H2O, H2, CO, O2 and N2803.0013.94−51.5490
11CH4, CO2, H2O, H2, CO, O2 and N2313.5013.94−60.2390
12Atmospheric Air (O2 and N2)1000.0013.94+8.6900
Energy efficiency (%)74.98
Exergy efficiency (%)69.90
Total Thermal Losses to the environment (×106 J)8.80
Thermal Losses to the environment through devices (% of energy entering the system)24.33
Thermal Losses to the environment through flue gases, see Branch 11, Figure 1 (% of energy entering the system)0.73
Table 3. Validation for the case of pure methane.
Energy efficiency (%)76.20
Exergy efficiency (%)71.16
Thermal Losses to the environment (% of energy entering the system)20.77
Energy of flue gases, at T11, emitted to the environment (% of energy entering the system)3.11
Publisher’s Note: MDPI stays neutral with regard to jurisdictional claims in published maps and institutional affiliations.

