Human Health Impact Analysis of Contaminant in IoT-Enabled Water Distributed Networks
Abstract
1. Introduction
2. Related Work
3. Materials and Methods
3.1. Materials
3.1.1. Case Study
3.1.2. Tools
3.2. Methods
3.2.1. Contaminant Generation
3.2.2. Dose Level Calculation
- = load of substance delivered to people from i sub-network (pipe),
- = concentration of contamination in water at time (t),
- = Water demand in section i at a time (t), and
- t = Exposure time.
3.2.3. Health Impact Analysis
| Algorithm 1 Calculating the volume of the contaminant water |
| 1: Generate Contamination Scenarios (S). |
| 2: Select one scenario (C) from S. |
| 3: WHILE ( C ≤ S) |
| 4: Simulate Hydraulic and Quality models. |
| 5: If (Contamination Concentration(CC) > > Threshold) |
| 6: Contaminate water volume (q) ← cc × Δt × demand |
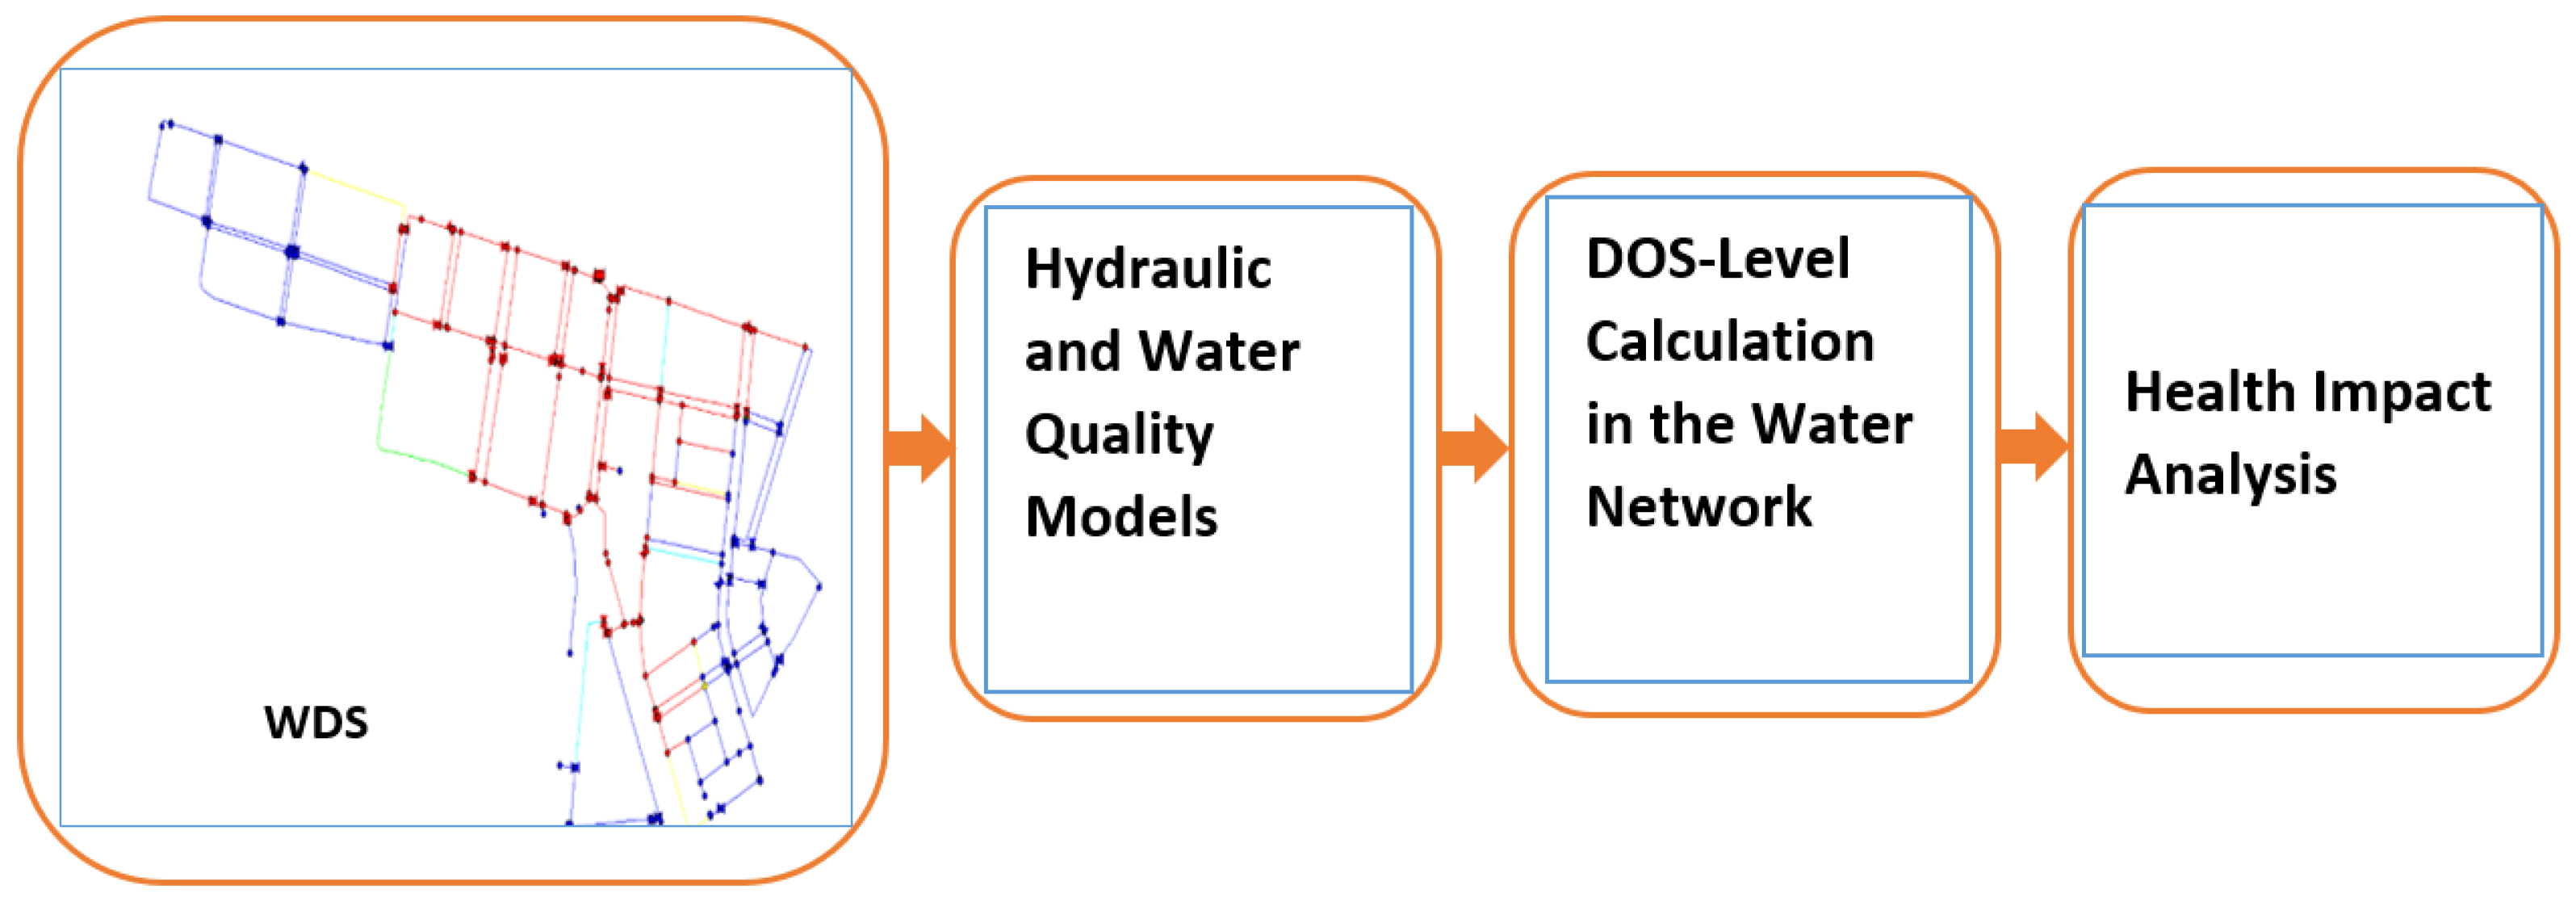
- Generate and simulate water contamination propagation on the pipeline networks (WDS).
- Develop the hydraulic and water quality models of the pipeline networks.
- Calculate dose level delivered to one section of the water network, which is supplying N people using Equation (1).
- Evaluate the health impact based on the calculation of the mass of the substance entering the body using Equation (5).
4. Results and Discussion
4.1. Health Analysis Results
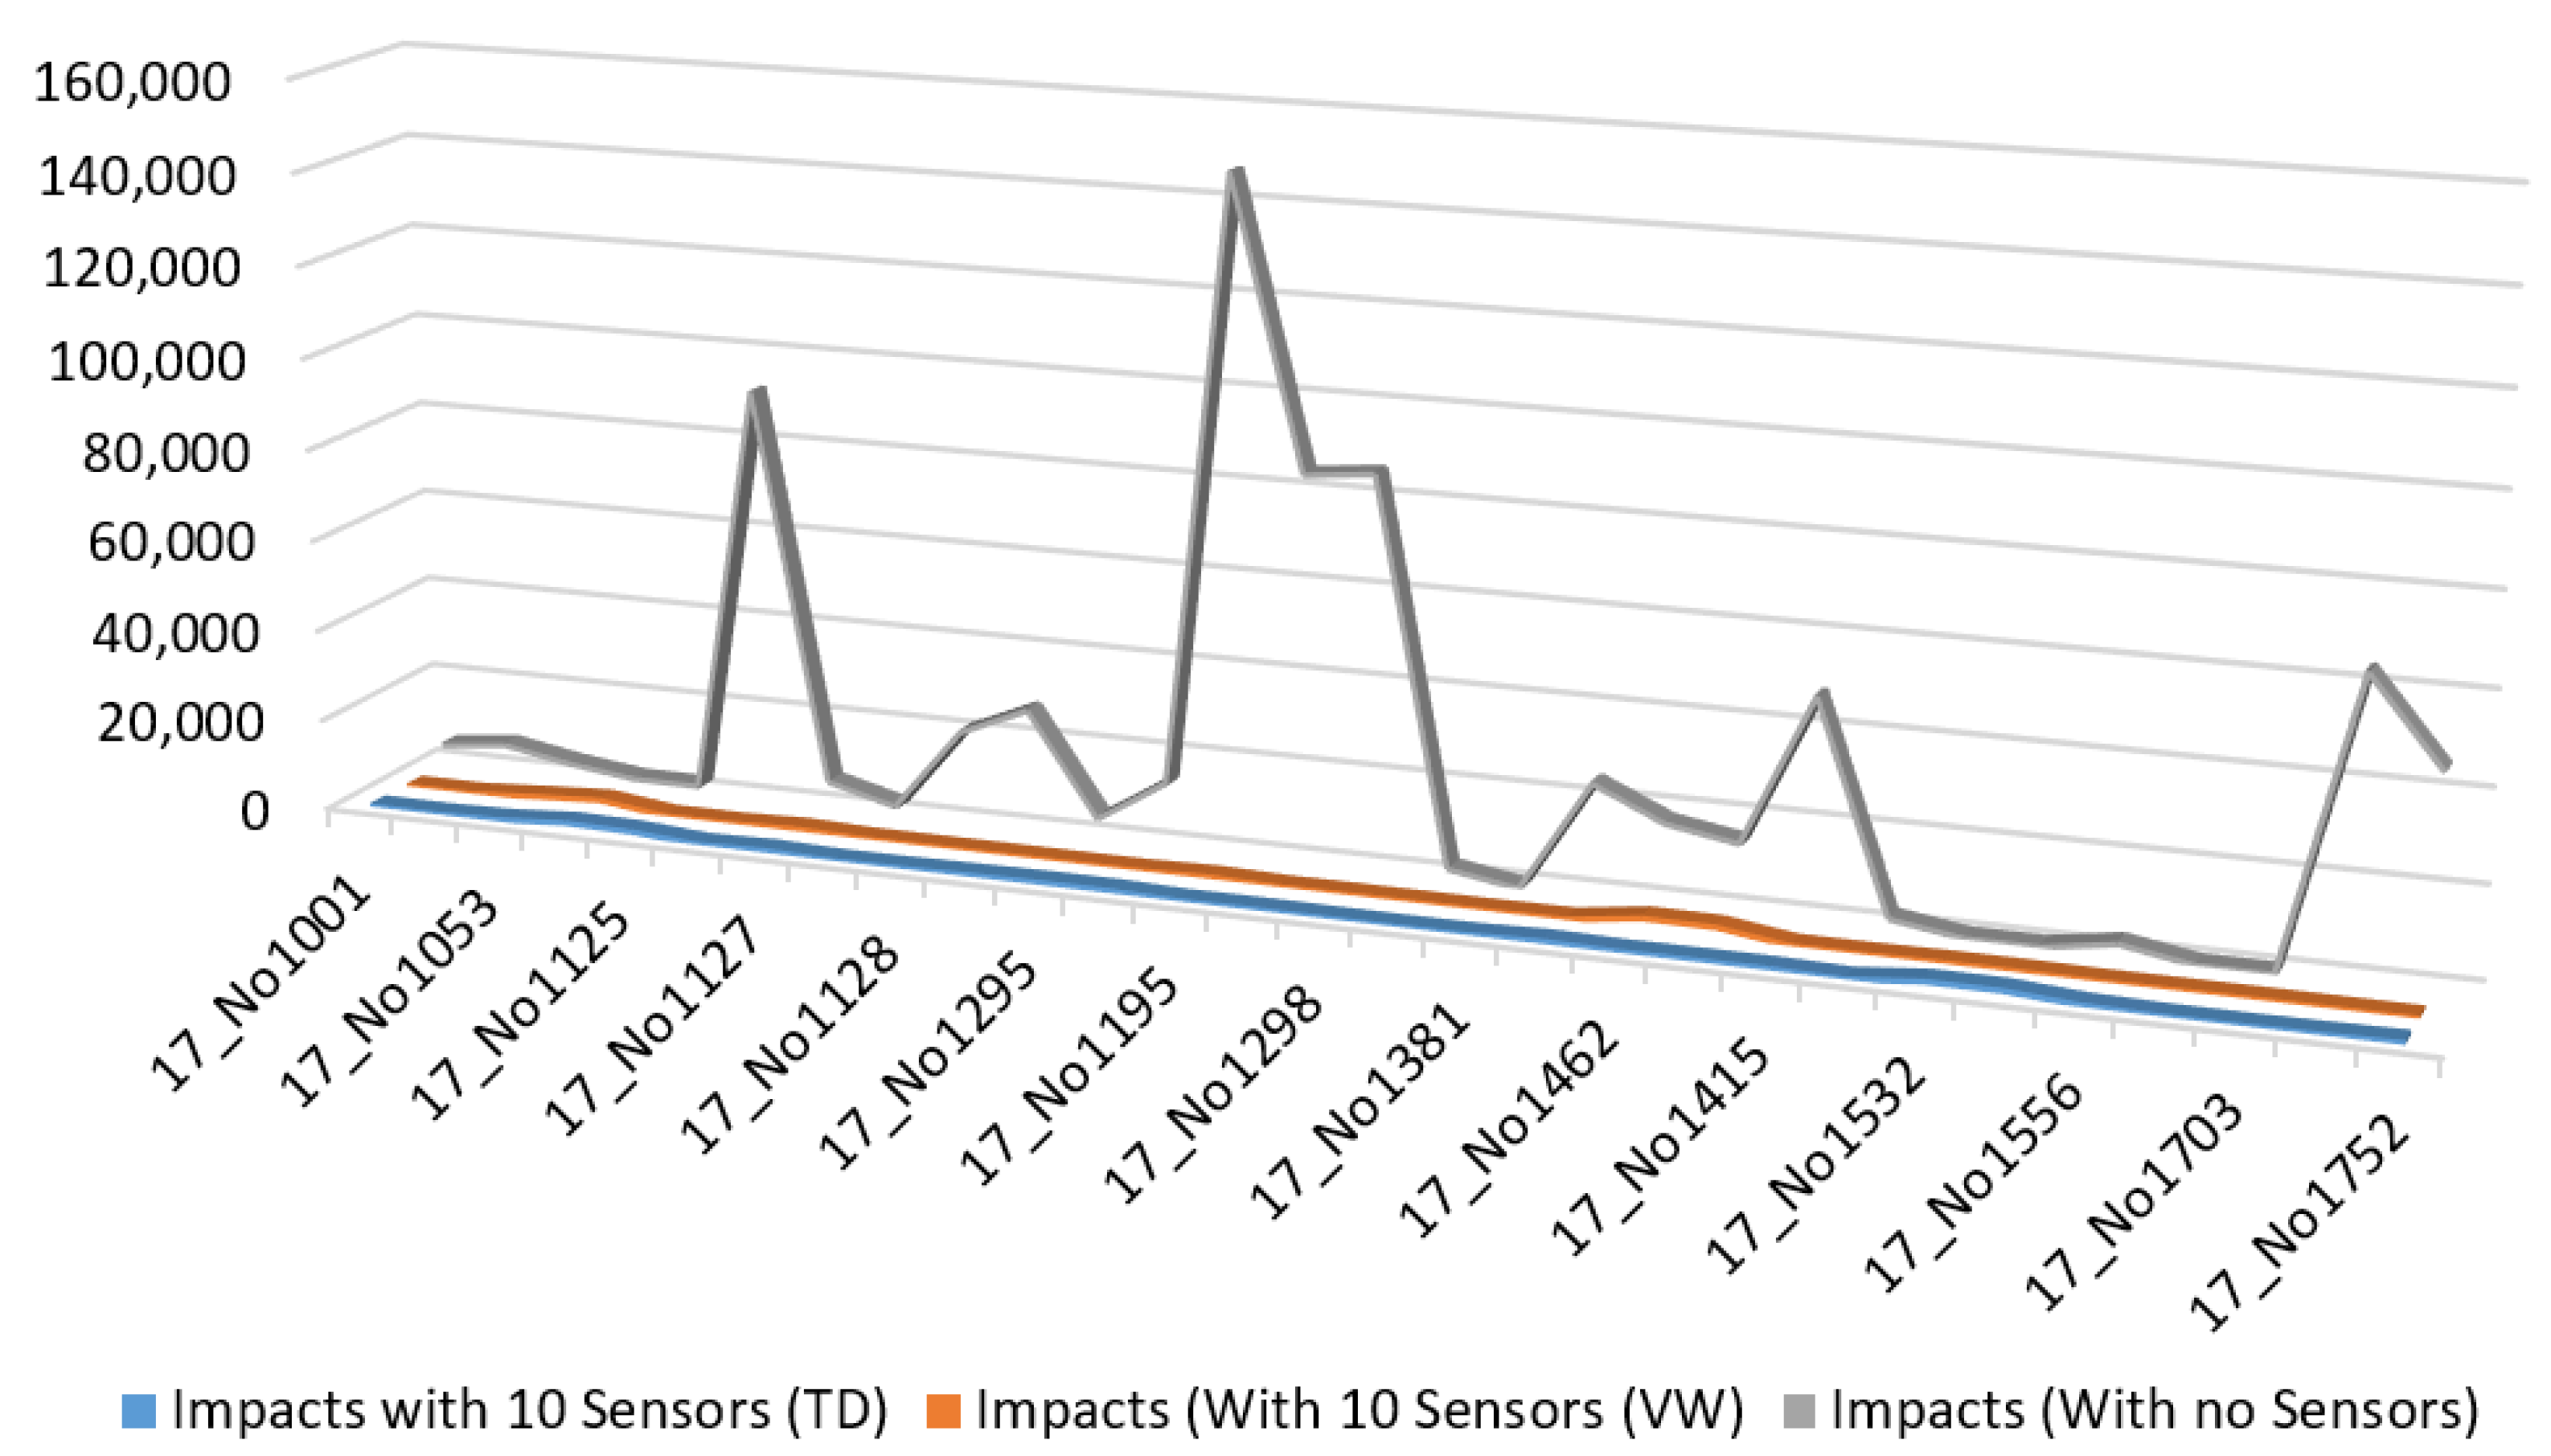
4.2. Reducing the Impact of the Contaminant Using Water Quality Sensors
- The first experiment investigated the impact of the contaminant without using water quality sensors.
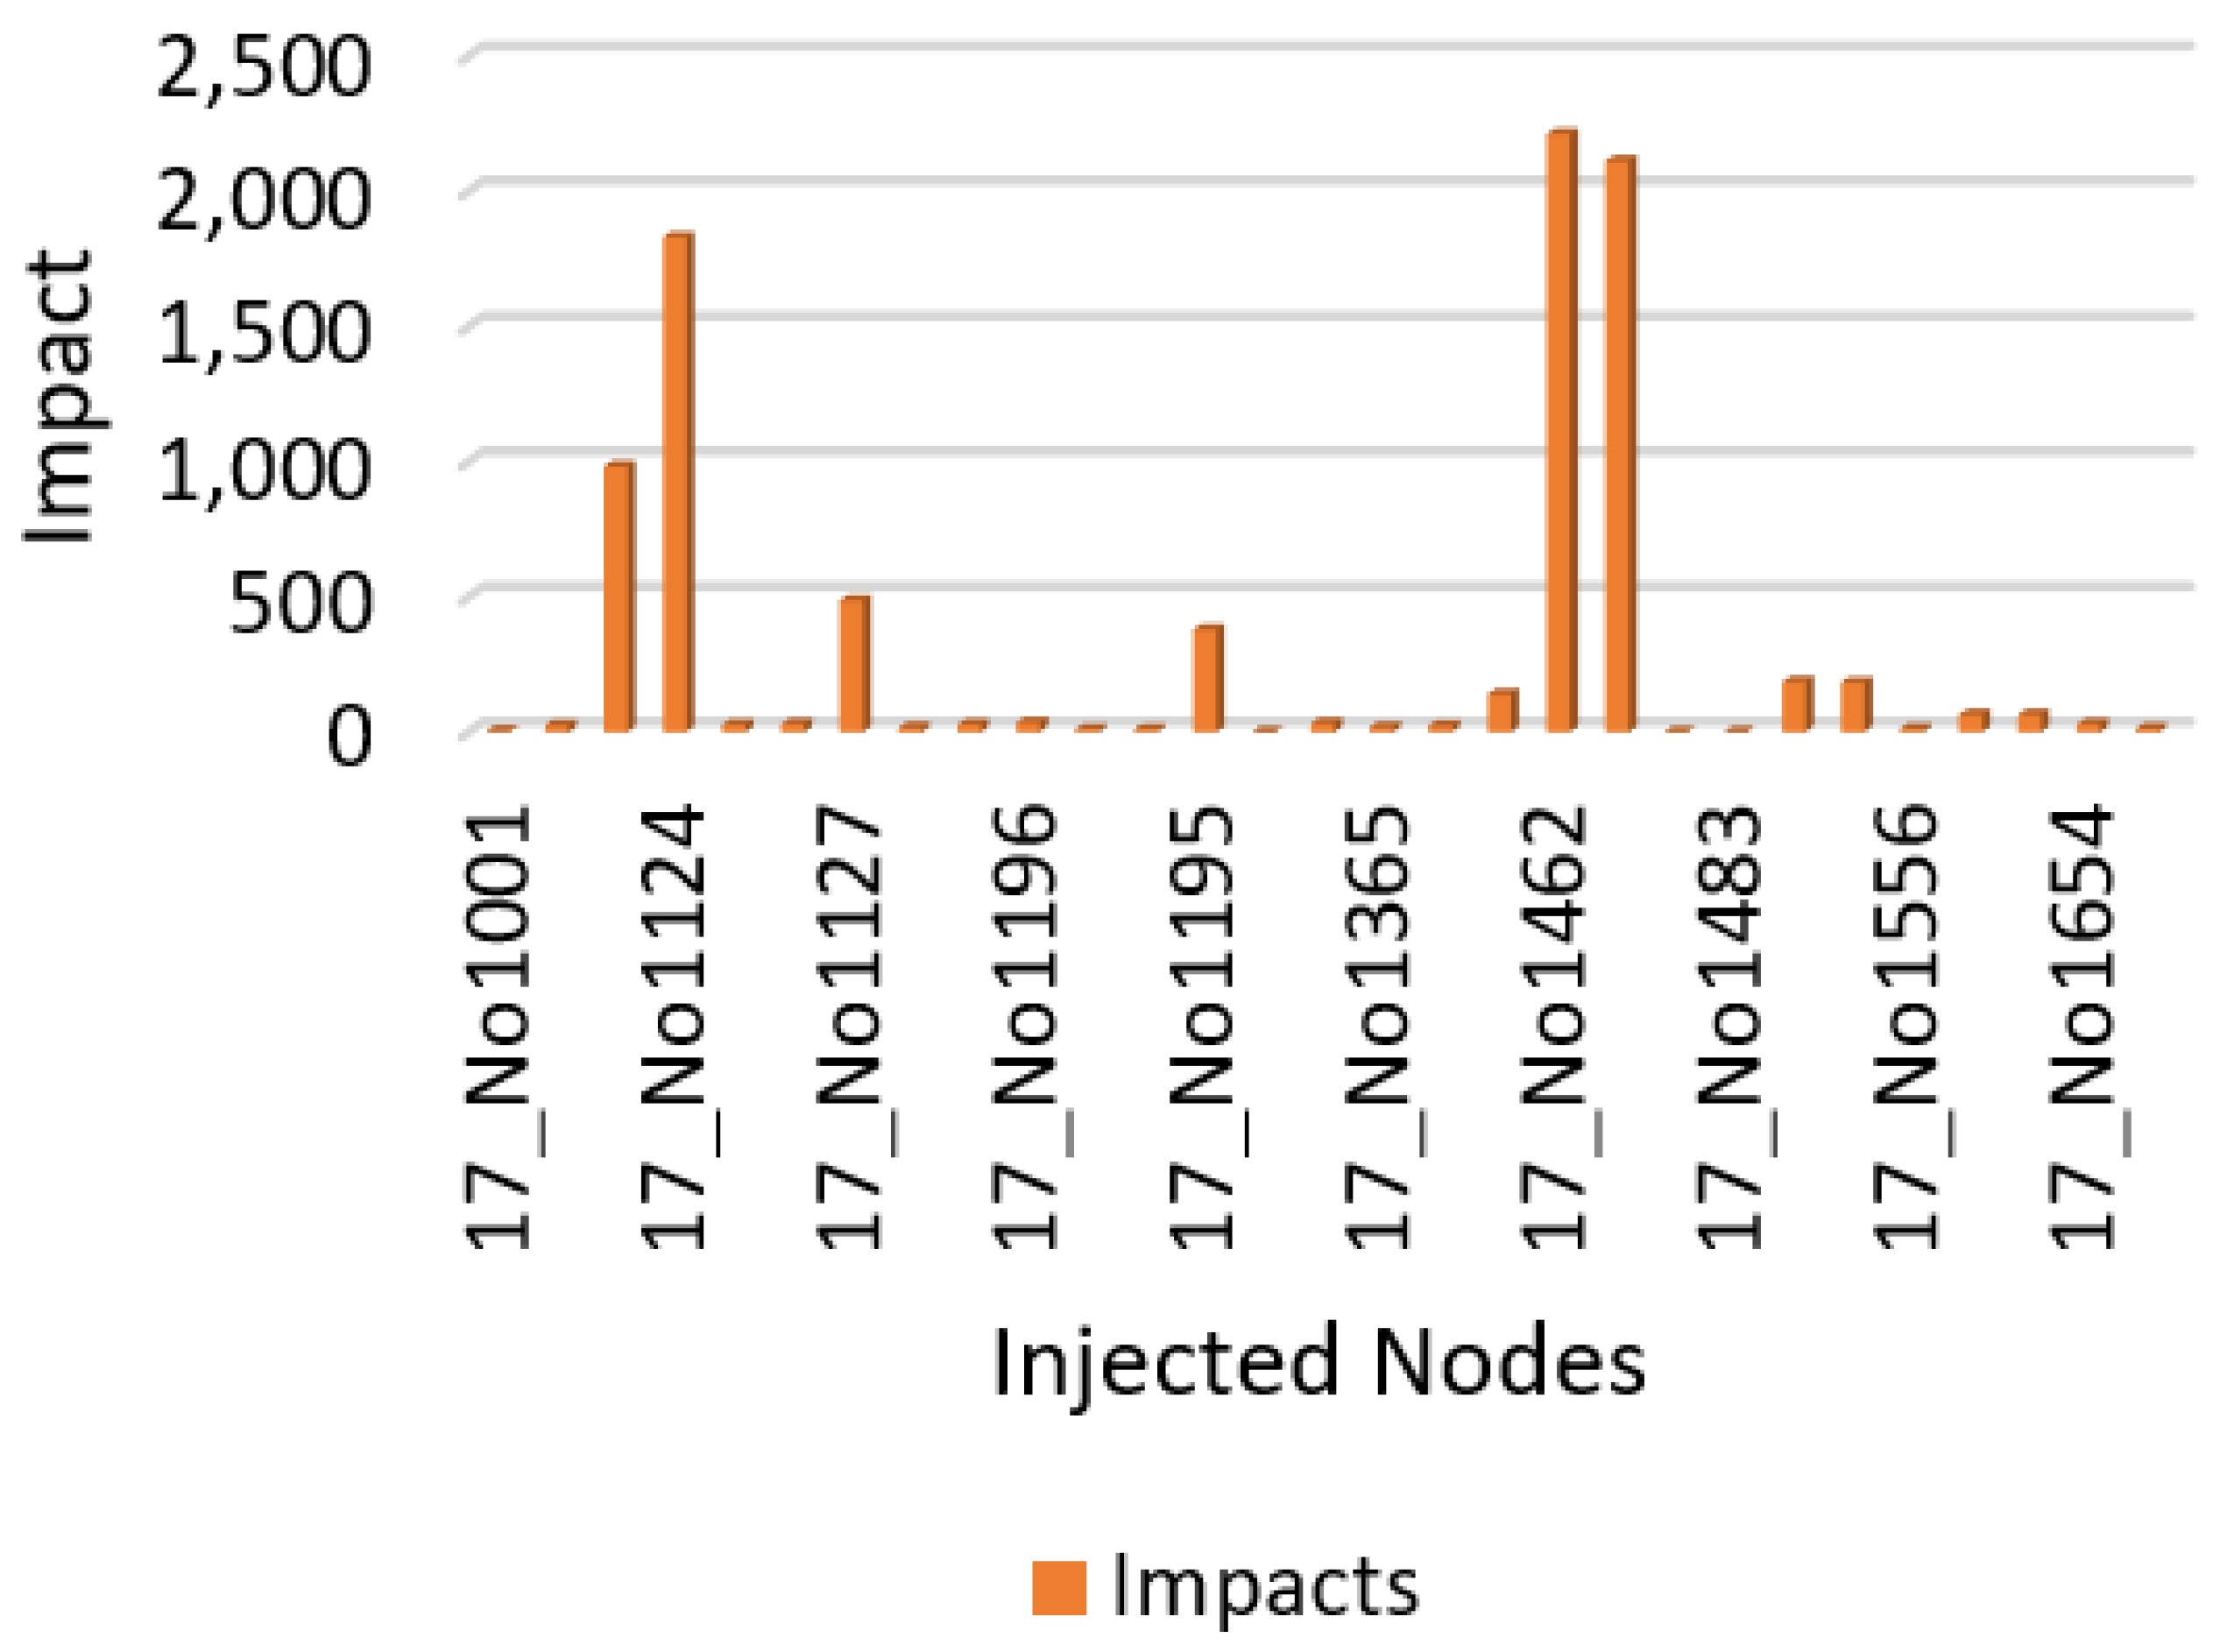
- The second experiment shows the impact using the water quality sensors optimally deployed on WDS utilizing the volume of the contamination water (VCW) as an objective function for deploying the sensors.
- The third experiment analyzes the impact using water quality sensors that are optimally deployed on WDS using time detection (TD) as an objective function to deploy the sensors.
5. Conclusions
Author Contributions
Funding
Institutional Review Board Statement
Informed Consent Statement
Data Availability Statement
Acknowledgments
Conflicts of Interest
References
- Li, P.; Wu, J. Drinking water quality and public health. Expo. Health 2019, 11, 73–79. [Google Scholar] [CrossRef]
- Padulano, R.; Del Giudice, G. A nonparametric framework for water consumption data cleansing: An application to a smart water network in Naples (Italy). J. Hydroinform. 2020, 22, 666–680. [Google Scholar] [CrossRef]
- Damiani, M.; Núñez, M.; Roux, P.; Loiseau, E.; Rosenbaum, R.K. Addressing water needs of freshwater ecosystems in life cycle impact assessment of water consumption: State of the art and applicability of ecohydrological approaches to ecosystem quality characterization. Int. J. Life Cycle Assess. 2018, 23, 2071–2088. [Google Scholar] [CrossRef]
- Liu, G.; Zhang, Y.; Knibbe, W.J.; Feng, C.; Liu, W.; Medema, G.; van der Meer, W. Potential impacts of changing supply-water quality on drinking water distribution: A review. Water Res. 2017, 116, 135–148. [Google Scholar] [CrossRef] [PubMed]
- Kara, S.; Karadirek, I.E.; Muhammetoglu, A.; Muhammetoglu, H. Real time monitoring and control in water distribution systems for improving operational efficiency. Desalin. Water Treat. 2016, 57, 11506–11519. [Google Scholar] [CrossRef]
- Frisbie, S.H.; Mitchell, E.J.; Dustin, H.; Maynard, D.M.; Sarkar, B. World Health Organization discontinues its drinking-water guideline for manganese. Environ. Health Perspect. 2012, 120, 775–778. [Google Scholar] [CrossRef]
- Lavoie, R.; Joerin, F.; Rodriguez, M. ATES: A geo-informatics decision aid tool for the integration of groundwater into land planning. J. Hydroinform. 2015, 17, 771–788. [Google Scholar] [CrossRef]
- De Vera, G.A.; Wert, E.C. Using discrete and online ATP measurements to evaluate regrowth potential following ozonation and (non) biological drinking water treatment. Water Res. 2019, 154, 377–386. [Google Scholar] [CrossRef]
- Long, D.T.; Pearson, A.L.; Voice, T.C.; Polanco-Rodríguez, A.G.; Sanchez-Rodríguez, E.C.; Xagoraraki, I.; Concha-Valdez, F.G.; Puc-Franco, M.; Lopez-Cetz, R.; Rzotkiewicz, A.T. Influence of rainy season and land use on drinking water quality in a karst landscape, State of Yucatán, Mexico. Appl. Geochem. 2018, 98, 265–277. [Google Scholar] [CrossRef]
- Scheili, A.; Rodriguez, M.; Sadiq, R. Seasonal and spatial variations of source and drinking water quality in small municipal systems of two Canadian regions. Sci. Total Environ. 2015, 508, 514–524. [Google Scholar] [CrossRef]
- Abtahi, M.; Golchinpour, N.; Yaghmaeian, K.; Rafiee, M.; Jahangiri-rad, M.; Keyani, A.; Saeedi, R. A modified drinking water quality index (DWQI) for assessing drinking source water quality in rural communities of Khuzestan Province, Iran. Ecol. Indic. 2015, 53, 283–291. [Google Scholar] [CrossRef]
- Rodriguez-Narvaez, O.M.; Peralta-Hernandez, J.M.; Goonetilleke, A.; Bandala, E.R. Treatment technologies for emerging contaminants in water: A review. Chem. Eng. J. 2017, 323, 361–380. [Google Scholar] [CrossRef]
- Chang, K.; Gao, J.L.; Wu, W.Y.; Yuan, Y.X. Water quality comprehensive evaluation method for large water distribution network based on clustering analysis. J. Hydroinform. 2011, 13, 390–400. [Google Scholar] [CrossRef]
- Soltani, A.A.; Oukil, A.; Boutaghane, H.; Bermad, A.; Boulassel, M.R. A new methodology for assessing water quality, based on data envelopment analysis: Application to Algerian dams. Ecol. Indic. 2021, 121, 106952. [Google Scholar] [CrossRef]
- Baştürk, E. Assessing Water Quality of Mamasın Dam, Turkey: Using Water Quality Index Method, Ecological and Health Risk Assessments. CLEAN-Air Water 2019, 47, 1900251. [Google Scholar] [CrossRef]
- Wu, Z.; Zhang, D.; Cai, Y.; Wang, X.; Zhang, L.; Chen, Y. Water quality assessment based on the water quality index method in Lake Poyang: The largest freshwater lake in China. Sci. Rep. 2017, 7, 1–10. [Google Scholar] [CrossRef]
- Abtahi, M.; Yaghmaeian, K.; Mohebbi, M.R.; Koulivand, A.; Rafiee, M.; Jahangiri-rad, M.; Jorfi, S.; Saeedi, R.; Oktaie, S. An innovative drinking water nutritional quality index (DWNQI) for assessing drinking water contribution to intakes of dietary elements: A national and sub-national study in Iran. Ecol. Indic. 2016, 60, 367–376. [Google Scholar] [CrossRef]
- Akter, T.; Jhohura, F.T.; Akter, F.; Chowdhury, T.R.; Mistry, S.K.; Dey, D.; Barua, M.K.; Islam, M.A.; Rahman, M. Water Quality Index for measuring drinking water quality in rural Bangladesh: A cross-sectional study. J. Health Popul. Nutr. 2016, 35, 1–12. [Google Scholar] [CrossRef]
- Ba, A.; McKenna, S.A. Water quality monitoring with online change-point detection methods. J. Hydroinform. 2015, 17, 7–19. [Google Scholar] [CrossRef]
- Braun, M.; Piller, O.; Deuerlein, J.; Mortazavi, I.; Iollo, A. Uncertainty quantification of water age in water supply systems by use of spectral propagation. J. Hydroinform. 2020, 22, 111–120. [Google Scholar] [CrossRef]
- Banda, T.D.; Kumarasamy, M.V. Development of Water Quality Indices (WQIs): A Review. Pol. J. Environ. Stud. 2020, 29. [Google Scholar] [CrossRef]
- Gara, T.; Fengting, L.; Nhapi, I.; Makate, C.; Gumindoga, W. Health safety of drinking water supplied in Africa: A closer look using applicable water-quality standards as a measure. Expo. Health 2018, 10, 117–128. [Google Scholar] [CrossRef]
- Chen, J.; Qian, H.; Gao, Y.; Li, X. Human health risk assessment of contaminants in drinking water based on triangular fuzzy numbers approach in Yinchuan City, Northwest China. Expo. Health 2018, 10, 155–166. [Google Scholar] [CrossRef]
- Zhang, H.; Zhou, X.; Wang, L.; Wang, W.; Xu, J. Concentrations and potential health risks of strontium in drinking water from Xi’an, Northwest China. Ecotoxicol. Environ. Saf. 2018, 164, 181–188. [Google Scholar] [CrossRef] [PubMed]
- Ali, N.; Khan, S.; ur Rahman, I.; Muhammad, S. Human health risk assessment through consumption of organophosphate pesticide-contaminated water of Peshawar basin, Pakistan. Expo. Health 2018, 10, 259–272. [Google Scholar] [CrossRef]
- Joshi, Y.P.; Kim, J.H.; Kim, H.; Cheong, H.K. Impact of drinking water quality on the development of enteroviral diseases in Korea. Int. J. Environ. Res. Public Health 2018, 15, 2551. [Google Scholar] [CrossRef]
- Zhang, Q.; Xu, P.; Qian, H. Groundwater quality assessment using improved water quality index (WQI) and human health risk (HHR) evaluation in a semi-arid region of northwest China. Expo. Health 2020, 12, 487–500. [Google Scholar] [CrossRef]
- Adimalla, N.; Li, P. Occurrence, health risks, and geochemical mechanisms of fluoride and nitrate in groundwater of the rock-dominant semi-arid region, Telangana State, India. Hum. Ecol. Risk Assess. Int. J. 2019, 25, 81–103. [Google Scholar] [CrossRef]
- Kumar, D.; Singh, A.; Jha, R.K.; Sahoo, S.K.; Jha, V. A variance decomposition approach for risk assessment of groundwater quality. Expo. Health 2019, 11, 139–151. [Google Scholar] [CrossRef]
- Shahra, E.Q.; Wu, W. Water contaminants detection using sensor placement approach in smart water networks. J. Ambient. Intell. Humaniz. Comput. 2020, 1–16. [Google Scholar] [CrossRef]
- Ung, H.; Piller, O.; Gilbert, D.; Mortazavi, I. Accurate and optimal sensor placement for source identification of water distribution networks. J. Water Resour. Plan. Manag. 2017, 143, 04017032. [Google Scholar] [CrossRef]
- Hooshmand, F.; Amerehi, F.; MirHassani, S. Risk-Based Models for Optimal Sensor Location Problems in Water Networks. J. Water Resour. Plan. Manag. 2020, 146, 04020086. [Google Scholar] [CrossRef]
- Santonastaso, G.F.; Di Nardo, A.; Creaco, E.; Musmarra, D.; Greco, R. Comparison of topological, empirical and optimization-based approaches for locating quality detection points in water distribution networks. Environ. Sci. Pollut. Res. 2020, 1–10. [Google Scholar] [CrossRef]
- Hu, C.; Yan, X.; Gong, W.; Liu, X.; Wang, L.; Gao, L. Multi-objective based scheduling algorithm for sudden drinking water contamination incident. Swarm Evol. Comput. 2020, 55, 100674. [Google Scholar] [CrossRef]
- Janke, R.; Murray, R.; Haxton, T.; Taxon, T.; Bahadur, R.; Samuels, W.; Berry, J.; Boman, E.; Hart, W.; Riesen, L.; et al. Threat Ensemble Vulnerability Assessment-Sensor Placement Optimization Tool (TEVA-SPOT) Graphical User Interface User’S Manual; Researchgate: Berlin, Germany, 2012; pp. 1–109. [Google Scholar]
- Bałut, A.; Urbaniak, A. Application of the TEVA-SPOT in designing the monitoring of water networks. E3S Web Conf. EDP Sci. 2018, 59, 00009. [Google Scholar] [CrossRef]
- Davis, M.J.; Janke, R.; Taxon, T.N. Mass imbalances in EPANET water-quality simulations. Drink. Water Eng. Sci. 2018, 11, 25–47. [Google Scholar] [CrossRef] [PubMed]
- Studziński, A.; Pietrucha-Urbanik, K. Simulation model of contamination threat assessment in water network using the EPANET software. Ecol. Chem. Eng. S 2016, 23, 425–433. [Google Scholar] [CrossRef][Green Version]
- Davis, M.J.; Janke, R.; Magnuson, M.L. A framework for estimating the adverse health effects of contamination events in water distribution systems and its application. Risk Anal. 2014, 34, 498–513. [Google Scholar] [CrossRef]






| Parameters | Values |
|---|---|
| Contaminant type | Chemical/Toxin |
| Average Body Mass (KG) | 70.0 |
| Water Ingestion Rate (Liters per day) | 1.41 |
| Gallons per Person per Day (GPD) | 200 |
| LD50 (mg/kg) | 0.001 |
| Simulation Start time | 00:00 A.M. |
| Simulation Length | 24 h |
| Injection Start Time | 00:00 A.M. |
| Injection Duration | 8 h |
| Injection Node | Reservoir |
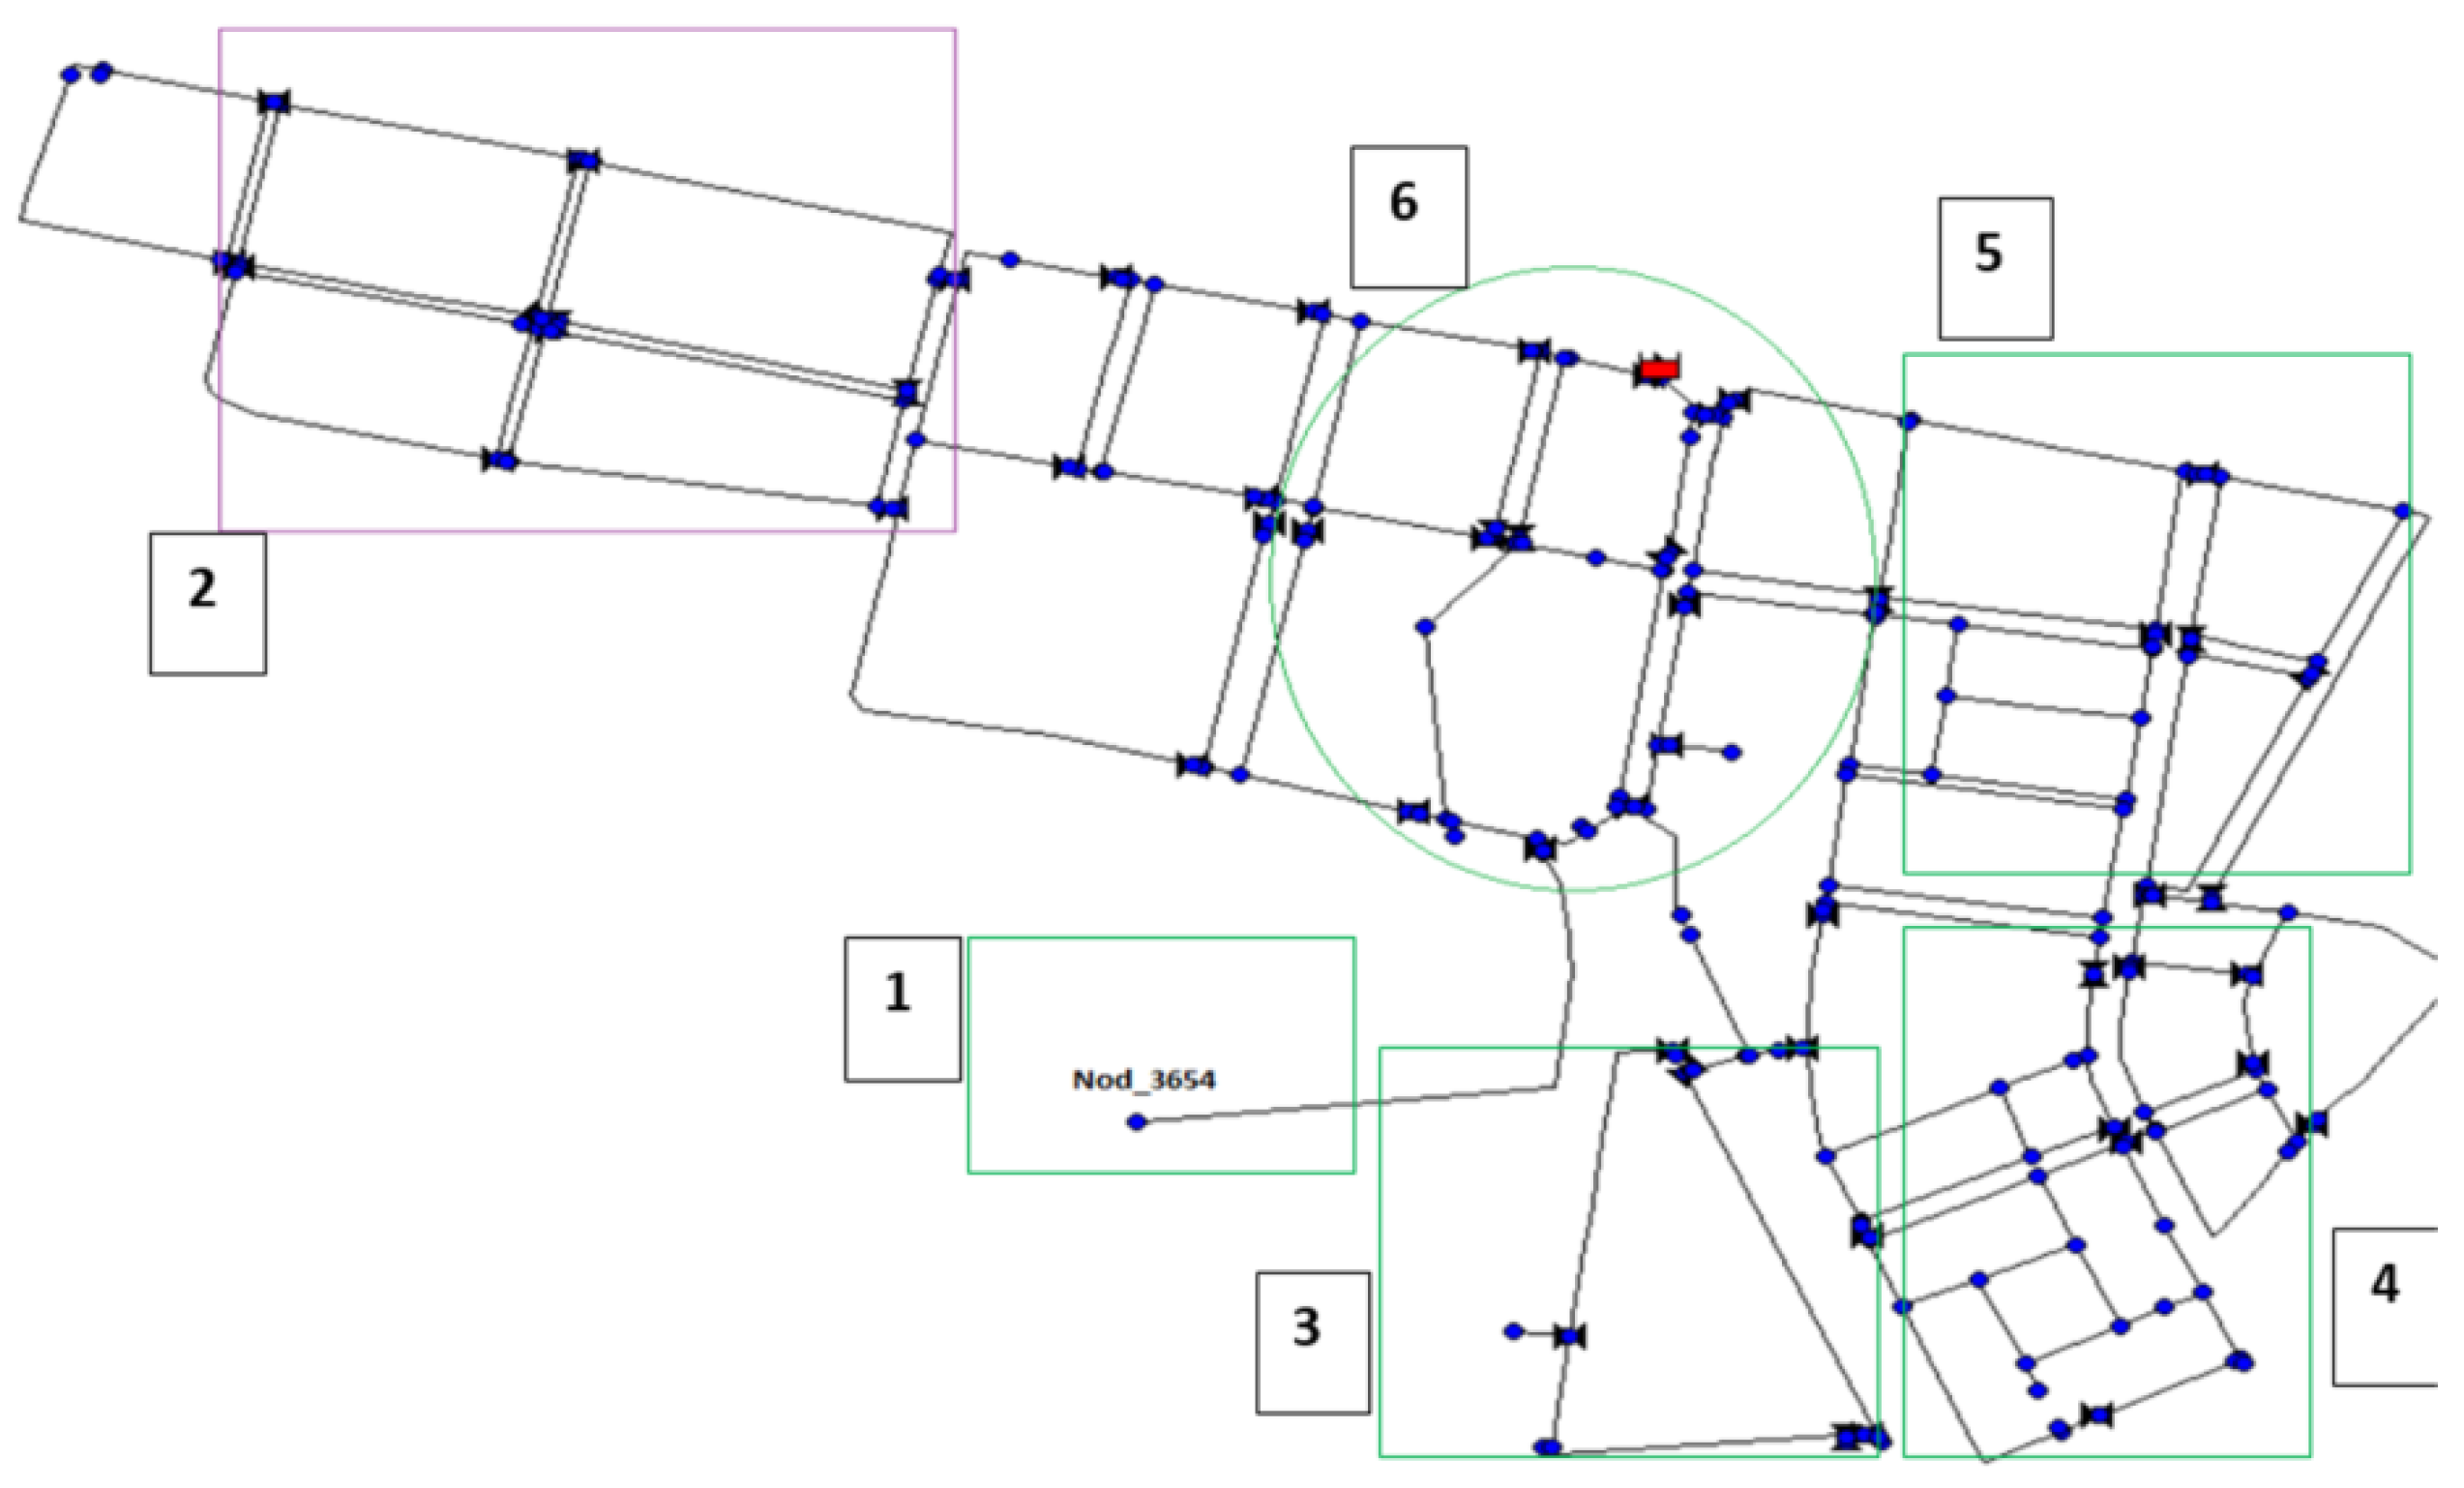
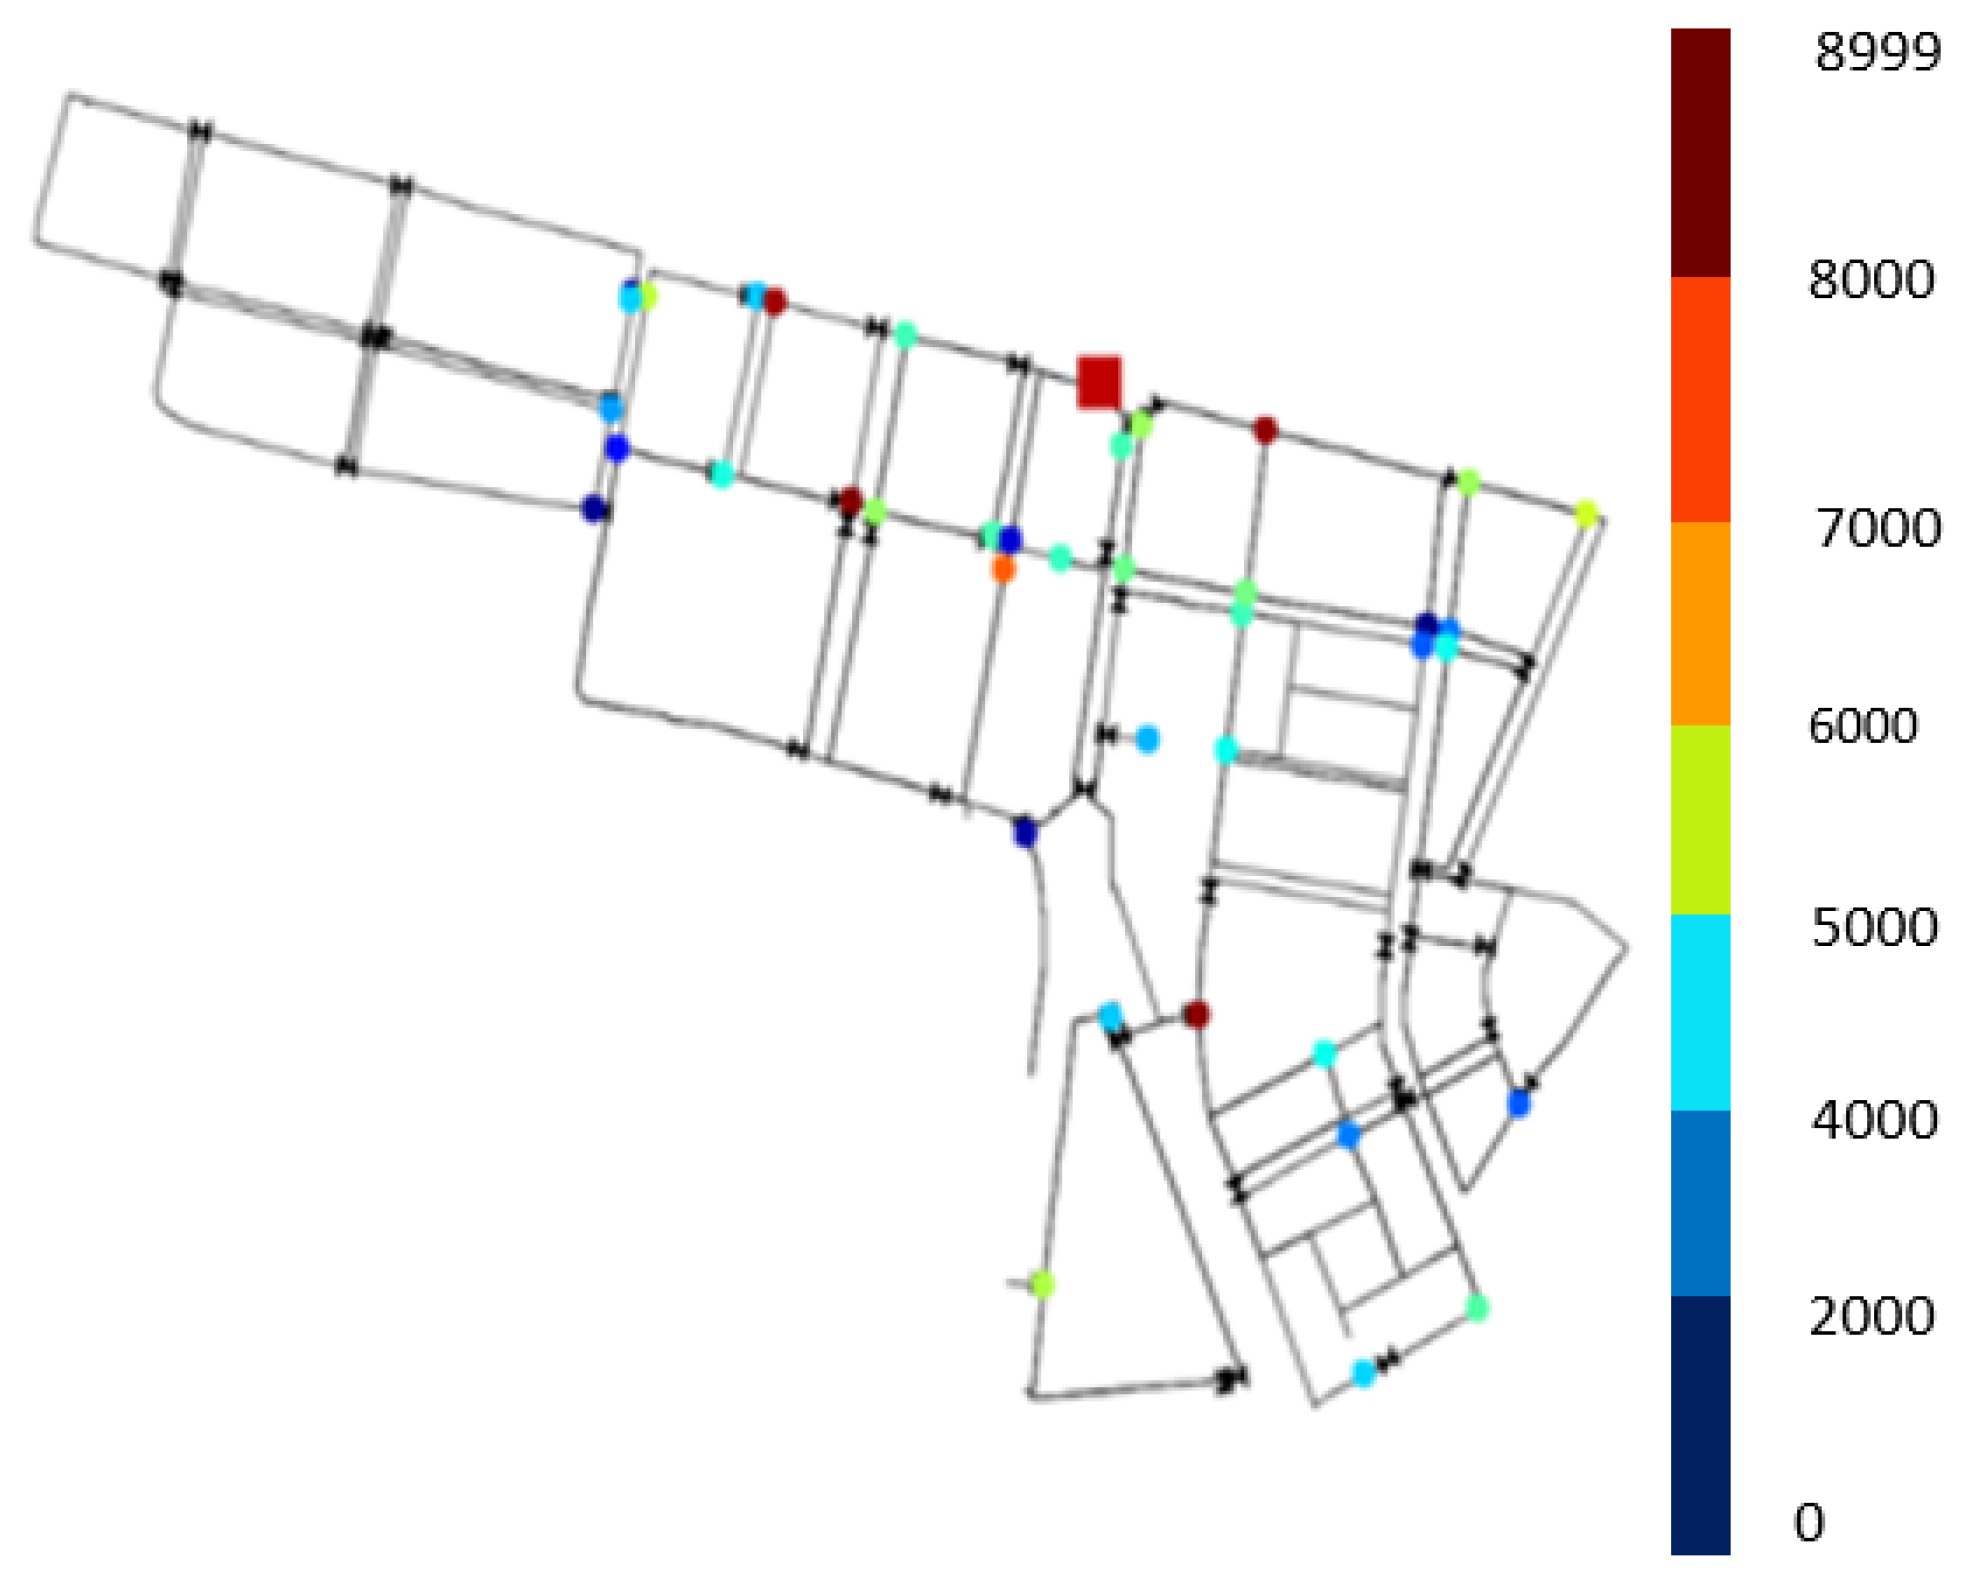
| Contamination Locations | Maximum Concentration (Mg/L) | Maximum Individual Dose (mg) | Number of Estimated Infected People |
|---|---|---|---|
| Loc. 1 | 2993 | 1 | 0 |
| Loc. 2 | 30 | 2 | 2750 |
| Loc. 3 | 44 | 5 | 7217 |
| Loc. 4 | 224 | 11 | 29,017 |
| Loc. 5 | 27 | 16 | 43,996 |
| Loc. 6 | 2 | 91 | 146,729 |
| Mean | 217 | 8 | 18,568 |
| Injection Nodes in WDS | Detection Time (Minutes) | Infected People |
|---|---|---|
| 17_No1001 | 1440 | 4858 |
| 17_No1002 | 1440 | 6499 |
| 17_No1053 | 1440 | 3899 |
| 17_No1124 | 1440 | 2071 |
| 17_No1125 | 1440 | 2042 |
| 17_No1113 | 1440 | 91,710 |
| 17_No1127 | 1440 | 6364 |
| 17_No1126 | 1440 | 2512 |
| 17_No1128 | 1440 | 20,742 |
| 17_No1196 | 1440 | 27,215 |
| 17_No1295 | 1440 | 4821 |
| 17_No1296 | 1440 | 14,360 |
| 17_No1195 | 1440 | 114,721 |
| 17_No1297 | 1440 | 84,217 |
| 17_No1298 | 1440 | 85,784 |
| 17_No1365 | 1440 | 2492 |
| 17_No1381 | 1440 | 23 |
| 17_No1414 | 1440 | 24,377 |
| 17_No1462 | 1440 | 17,485 |
| 17_No1463 | 1440 | 14,949 |
| 17_No1415 | 1440 | 47,880 |
| 17_No1483 | 1440 | 2493 |
| 17_No1532 | 1440 | 186 |
| 17_No1533 | 1440 | 183 |
| 17_No1556 | 1440 | 2666 |
| 17_No1702 | 1440 | 64 |
| 17_No1703 | 1440 | 64 |
| 17_No1654 | 1440 | 63,882 |
| 17_No1752 | 1440 | 45,190 |
| Injection Nodes in WDS | Detection Sensors | Detection Time | Infected People |
|---|---|---|---|
| 17_No1001 | 17_No1891 | 106 | 3 |
| 17_No1002 | 17_No1891 | 66 | 24 |
| 17_No1053 | 17_No1483 | 382 | 982 |
| 17_No1124 | 17_No1483 | 1410 | 1829 |
| 17_No1125 | 17_No1483 | 1166 | 25 |
| 17_No1113 | 17_No1297 | 8 | 30 |
| 17_No1127 | 17_No525 | 612 | 485 |
| 17_No1126 | 17_No1483 | 32 | 16 |
| 17_No1128 | 17_No3856 | 104 | 28 |
| 17_No1196 | 17_No3707 | 24 | 35 |
| 17_No1295 | 17_No525 | 494 | 10 |
| 17_No1296 | 17_No525 | 496 | 10 |
| 17_No1195 | 17_No3707 | 26 | 378 |
| 17_No1297 | 17_No1297 | 0 | 0 |
| 17_No1298 | 17_No1415 | 48 | 32 |
| 17_No1365 | 17_No1483 | 4 | 17 |
| 17_No1381 | 1440 | 23 | |
| 17_No1414 | 17_No3856 | 512 | 140 |
| 17_No1462 | 17_No4702 | 232 | 2211 |
| 17_No1463 | 17_No2087 | 310 | 2111 |
| 17_No1415 | 17_No1415 | 0 | 0 |
| 17_No1483 | 17_No1483 | 0 | 0 |
| 17_No1532 | 1440 | 186 | |
| 17_No1533 | 1440 | 183 | |
| 17_No1556 | 17_No1483 | 354 | 11 |
| 17_No1702 | 1440 | 64 | |
| 17_No1703 | 1440 | 64 | |
| 17_No1654 | 17_No1415 | 54 | 29 |
| 17_No1752 | 17_No1483 | 342 | 12 |
| Injection Nodes in WDS | Detection Sensors | Detection Time | Infected People (People) |
|---|---|---|---|
| 17_No1001 | 17_No1891 | 106 | 108 |
| 17_No1002 | 17_No2830 | 62 | 65 |
| 17_No1053 | 17_No1483 | 382 | 386 |
| 17_No1124 | 17_No1483 | 1410 | 1415 |
| 17_No1125 | 17_No1483 | 1166 | 1172 |
| 17_No1113 | 17_No5633 | 120 | 127 |
| 17_No1127 | 17_No4089 | 460 | 468 |
| 17_No1126 | 17_No1483 | 32 | 41 |
| 17_No1128 | 17_No4089 | 102 | 112 |
| 17_No1196 | 17_No525 | 320 | 331 |
| 17_No1295 | 17_No525 | 494 | 506 |
| 17_No1296 | 17_No525 | 496 | 509 |
| 17_No1195 | 17_No525 | 86 | 100 |
| 17_No1297 | 17_No5633 | 148 | 163 |
| 17_No1298 | 17_No5633 | 60 | 76 |
| 17_No1365 | 17_No1483 | 4 | 21 |
| 17_No1381 | 17_No348 | 50 | 68 |
| 17_No1414 | 17_No4089 | 510 | 529 |
| 17_No1462 | 17_No4702 | 232 | 252 |
| 17_No1463 | 17_No2087 | 310 | 331 |
| 17_No1415 | 17_No1483 | 334 | 356 |
| 17_No1483 | 17_No1483 | 2 | 23 |
| 17_No1532 | 1440 | 1464 | |
| 17_No1533 | 17_No1483 | 1200 | 1225 |
| 17_No1556 | 17_No_1483 | 354 | 380 |
| 17_No1702 | 17_No961 | 38 | 65 |
| 17_No1703 | 17_No961 | 22 | 50 |
| 17_No1654 | 17_No1483 | 142 | 171 |
| 17_No1752 | 17_No1483 | 342 | 372 |
Publisher’s Note: MDPI stays neutral with regard to jurisdictional claims in published maps and institutional affiliations. |
© 2021 by the authors. Licensee MDPI, Basel, Switzerland. This article is an open access article distributed under the terms and conditions of the Creative Commons Attribution (CC BY) license (https://creativecommons.org/licenses/by/4.0/).
Share and Cite
Shahra, E.Q.; Wu, W.; Gomez, R. Human Health Impact Analysis of Contaminant in IoT-Enabled Water Distributed Networks. Appl. Sci. 2021, 11, 3394. https://doi.org/10.3390/app11083394
Shahra EQ, Wu W, Gomez R. Human Health Impact Analysis of Contaminant in IoT-Enabled Water Distributed Networks. Applied Sciences. 2021; 11(8):3394. https://doi.org/10.3390/app11083394
Chicago/Turabian StyleShahra, Essa Q., Wenyan Wu, and Roberto Gomez. 2021. "Human Health Impact Analysis of Contaminant in IoT-Enabled Water Distributed Networks" Applied Sciences 11, no. 8: 3394. https://doi.org/10.3390/app11083394
APA StyleShahra, E. Q., Wu, W., & Gomez, R. (2021). Human Health Impact Analysis of Contaminant in IoT-Enabled Water Distributed Networks. Applied Sciences, 11(8), 3394. https://doi.org/10.3390/app11083394


