Article

Analysis of La4Ni3O10±δ-BaCe0.9Y0.1O3-δ Composite Cathodes for Proton Ceramic Fuel Cells

by
Francisco J. A. Loureiro
*,
Devaraj Ramasamy
,
Vanessa C. D. Graça
,
Laura I. V. Holz
,
Sergey M. Mikhalev
and
Duncan P. Fagg
*
Centre for Mechanical Technology and Automation, Mechanical Engineering Department, University of Aveiro, 3810-193 Aveiro, Portugal
*
Authors to whom correspondence should be addressed.
Appl. Sci. 2021, 11(8), 3407; https://doi.org/10.3390/app11083407
Submission received: 25 February 2021 / Revised: 31 March 2021 / Accepted: 6 April 2021 / Published: 10 April 2021

Abstract

:
Layered Ruddlesden-Popper (RP) lanthanide nickelates, Lnn+1NinO3n+1 (Ln = La, Pr, and Nd; n = 1, 2, and 3) have generated great interest as potential cathodes for proton conducting fuel cells (PCFCs). The high-order phase (n = 3) is especially intriguing, as it possesses the property of a high and metallic-type electronic conductivity that persists to low temperatures. To provide the additional requirement of high ionic conductivity, a composite electrode is here suggested, formed by a combination of La4Ni3O10±δ with the proton conducting phase BaCe0.9Y0.1O3-δ (40 vol%). Electrochemical impedance spectroscopy (EIS) is used to analyse this composite electrode in both wet (pH2O ~ 10−2 atm) and low humidity (pH2O ~ 10−5 atm) conditions in an O2 atmosphere (400–550 °C). An extended analysis that first tests the stability of the impedance data through Kramers-Kronig and Bayesian Hilbert transform relations is outlined, that is subsequently complemented with the distribution function of relaxation times (DFRTs) methodology. In a final step, correction of the impedance data against the short-circuiting contribution from the electrolyte substrate is also performed. This work offers a detailed assessment of the La4Ni3O10±δ-BaCe0.9Y0.1O3-δ composite cathode, while providing a robust analysis methodology for other researchers working on the development of electrodes for PCFCs.

1. Introduction

Protonic ceramic fuel cells (PCFCs) stand out as one of the most promising technologies for energy conversion [1]. These devices use proton-conducting electrolytes, which allow them to operate at considerably lower temperatures (400–600 °C) than that of their oxide-ion-conducting counterparts (>600 °C) [2,3]. Decreasing the operation temperature brings out several cost-effective benefits, including shorter start-up times, lower energy inputs to heat the cell up to the operating temperature, and greater materials longevity [3].
Nonetheless, several drawbacks remain when working at such low temperatures, with the minimisation of polarisation resistance being one of the most critical challenges remaining to date [4,5]. In this respect, the majority of published works have focused on the use of mixed ionic electronic conductors (MIECs) as potential PCFC electrodes, where materials selection is driven by that traditionally used in solid oxide fuel cells (SOFCs), based on both oxide-ion and electron (O2−/e) conduction [6,7,8,9,10,11,12]. One good example is that of the layered Ruddlesden-Popper (RP) lanthanide nickelates, Lnn+1NinO3n+1 (Ln = La, Pr, and Nd; n = 1, 2, and 3) [13,14,15,16]. These interesting materials differ from typical, state-of-the-art, perovskite cathode materials, due to their unique crystal structures that are composed of a rock-salt LnO layer with a finite number (n) of perovskite-type LnNiO3 layers along the main crystallographic axis. Importantly, one of the key attractions of these materials is their ability to offer metallic-type electronic conductivity over extensive temperature ranges [14].
In recent years, these materials have also been proposed as electrodes targeted for PCFCs [17,18,19,20], with the main bulk of previous work having concentrated on the lower order, Ln2NiO4-based phase, where n = 1. In this respect, the electronic conductivity of the lower order nickelate phases (n = 1, 2) has been documented to suffer an abrupt depletion as the operating temperature decreases below 600 °C, in air, as a result of temperature dependent changes in crystallographic symmetry [16]. This drop in electronic conductivity below 600 °C is concerning, as it may bring into question the continued validity of these lower order nickelate materials for the intended PCFC operational temperature range of (400–600 °C). In contrast to these lower order phases, the higher order La4Ni3O10±δ, n = 3, material shows a uniform, metallic-type, conductivity in air that increases monotonically with decreasing temperature, thus, providing the important advantage of a high level of electronic conductivity that persists across the complete temperature range, from high temperatures (e.g., 900 °C) to room temperature [16].
The stability of these RP phases was studied in detail, as a function of oxygen partial pressure (pO2), by Bannikov et al. using thermodynamic calculations [21]. In their work, the authors demonstrated that, despite the observance of a smooth dependence of conductivity on temperature in air, the stability of the La4Ni3O10±δ compound faces an important limit towards less oxidising conditions, due to the release of oxygen and its decomposition into La3Ni2O7±δ and NiO (Figure 1), as follows:
3 La 4 Ni 3 O 10 ( s ) 4 La 3 Ni 2 O 7 ( s ) + NiO ( s ) + 0.5 O 2 ( g )
Of concern, this factor may become relevant upon applied cathodic polarisation due to a localised drop in the chemical potential of oxygen at the cathode/electrolyte interface upon fuel cell operation [7,22]. Nonetheless, reference to Figure 1 shows that this pO2 decomposition limit can be improved upon decreasing the operation temperature to the intermediate range (i.e., below 600 °C), an operating window that concurs well with the temperature range of interest for PCFCs (400–600 °C). A preliminary example of the viability of the La4Ni3O10±δ material as a PCFC cathode material was provided by the current authors [19], where the performance of La4Ni3O10±δ and La4Ni3O10±δ-BaCe0.9Y0.1O3-δ composite cathodes, deposited on a BaCe0.9Y0.1O3-δ (BCY10) proton-conducting electrolyte, was studied in the temperature range 350–550 °C in a wet O2 atmosphere. The presence of the BCY10 composite phase was shown to be highly beneficial to lower the polarisation resistance, providing performance figures that were in line with some of the best PCFC cathodes currently reported [19].
Despite this promise, the strong chemical interreaction of BCY10 with high levels of water vapour has been shown to severely compromise the long-term performance of this material [1,23]. To avoid this limitation, a very recent work highlighted the extended applicability of yttrium-doped barium cerate, BaCe0.9Y0.1O3-δ (BCY10), for operation in nominally dry conditions in the intermediate temperature range (350–600 °C) [24]. In such conditions, this composition was shown to be able to retain predominant proton conduction to very low values of water vapour partial pressure (pH2O > 10−4–10−5 atm). This feature is highly important as the chemical stability of this material can also be retained at such low water vapour partial pressures [23].
Hence, we aim to extend our previous work to assess the continued usability of the La4Ni3O10±δ-BaCe0.9Y0.1O3-δ composite cathodes for operation under such low humidity contents (i.e., pH2O ~ 10−5 atm) [23,24]. Unfortunately, such conditions also lead to a severe increase in the electronic transport number of the electrolyte substrate [24], potentially erroneously decreasing the measured polarisation resistances [19,25,26,27,28]. In our previous study [19], an alternative equivalent circuit model for the correction of such short-circuiting effect was successfully provided. Therefore, this methodology is also adopted here to also take into account the electronic transport numbers of the BaCe0.9Y0.1O3-δ (BCY10) proton-conducting electrolyte under very low humidity conditions (i.e., pH2O ~ 10−5 atm) [24].
Moreover, the impedance data show often a very complex dispersion, and the choice of the equivalent circuit may become problematic, especially when distinct electrochemical processes may appear convoluted. In this respect, in recent years, the distribution function of frequency times (DFRT) analysis has become an essential tool for the analysis of electrochemical devices, due to its powerful aptitude to be able to deconvolute the elementary steps of electrode reactions [19,29,30,31].
Moreover, the impedance data is a transfer function, and it needs to reflect a linear, time-invariant, and causal response [32,33,34]. Despite this requirement, the data are rarely benchmarked against quality in a typical fuel cell literature or tested for their validity. For this reason, we adopt a recently developed Bayesian Hilbert transform methodology in the current work, which is an equivalent of the classical Kramers-Kronig (KK) relations [32] in the assessment of the quality of impedance data, thereby, ensuring the reliability of both the EQM and the DFRT analyses.
By the presented methodology, we hope that the current article can serve as a useful study basis for other researchers working on the development of electrodes for electrochemical devices, as well as documenting the functional operational parameters of a promising new cathode material for PCFCs.

2. Materials and Methods

Symmetrical cell assemblies were formed consisting of composite electrodes made of La4Ni3O10±δ (LNO, synthesised elsewhere [19]) and of BaCe0.9Y0.1O3-δ (BCY10, TYK, Tokyo, Japan), deposited on both faces of BCY10 electrolyte disks. The electrolyte discs were made by pelletising BCY10 by uniaxial pressing (200 MPa for 1 min), followed by sintering at 1400 °C for 6 h to achieve relative densities >95% that of the theoretical. The composite electrodes were prepared by spin-coating of a pre-made slurry of the LNO and BCY10 phases, in a 60%/40% volumetric ratio, using preparation details that are reported elsewhere [5], and calcined in air at 1050 °C for 4 h with heating and cooling rates of 1.5 °C min−1.
The scanning electron microscope (SEM, Hitachi Tabletop microscope TM4000Plus, Tokyo, Japan) was used to assess the microstructure of the top-view and cross-section features of the composite cathode. The cross-sectional image was taken on samples cut with a circular blade saw. The energy dispersive X-ray analysis (EDS, Brucker SCU, Brockton, MA, USA) was performed on the top-view sample to provide elemental mapping.
Electrochemical impedance spectroscopy (EIS) was used to study the electrical properties of the composite electrode, in the frequency range 0.01 Hz‒1 MHz with a signal amplitude 50 mV (Electrochemie-Autolab PGSTAT302N frequency response analyser, Utrecht, Netherlands). Humidification was controlled by passing wetted O2 (50 mL min−1) that had been bubbled through the KCl-saturated H2O solution at 30 °C (~84% RH, JUMO humidity meter) to attain a pH2O ~ 10−2 atm, herein defined as wet conditions. In contrast, low humidity conditions were obtained directly from the high purity O2 gas bottle, where a pH2O ~ 10−5 atm was recorded (JUMO humidity meter). Impedance data were acquired on decreasing the temperature from 550 to 400 °C, being recorded twice, with dwell times of 1 h and after a further 1 h, to confirm stability. Impedance data were analysed using the ZView© software (Scribner Associates, Southern Pines, NC, USA) and the MATLAB tool packages DFRTtoEIS [35] and DRTtools [36].

3. Results and Discussion
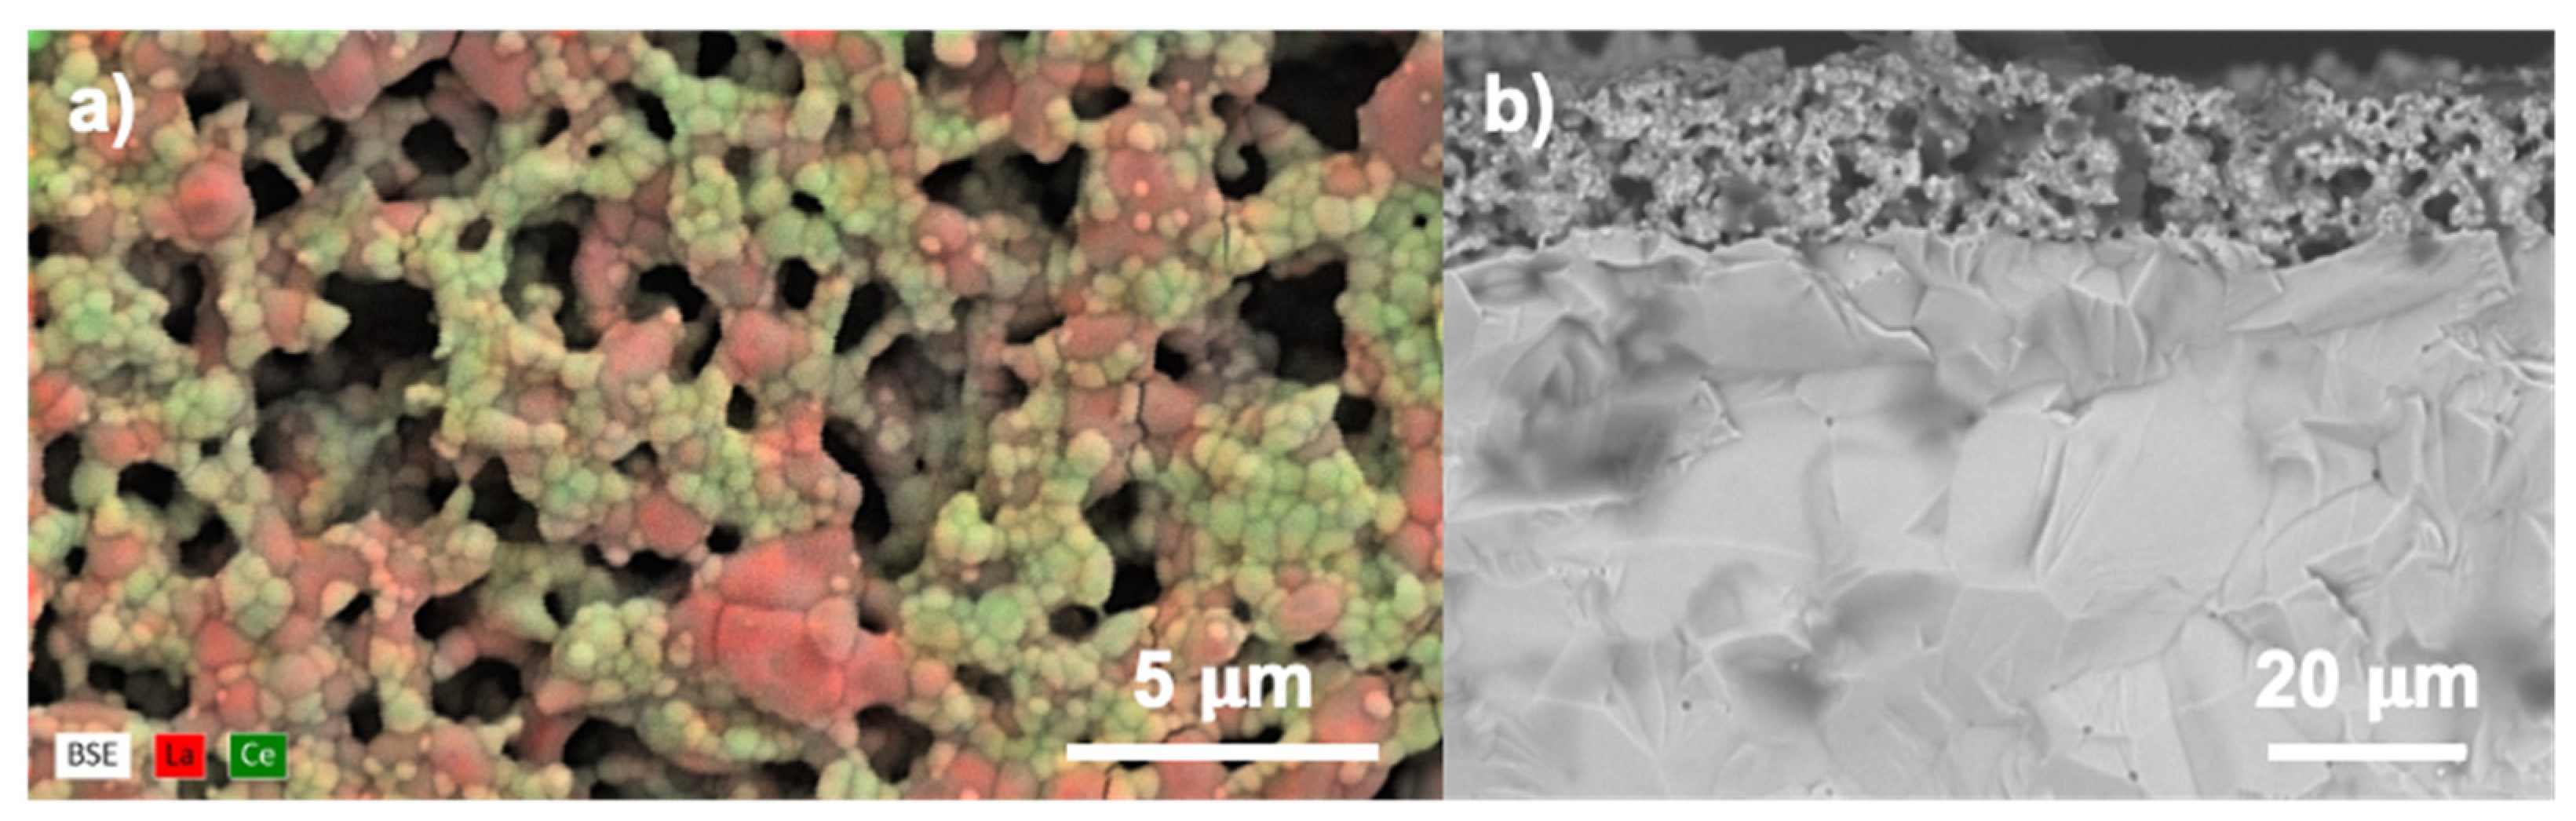
3.1. Microstructure

Figure 2a shows the top-view microstructures with EDS mapping, denoting a well distributed mix of both lanthanide and BCY10 phases with a fairly uniform particle size distribution (~1–2 μm), and a microstructure of open porosity. According to Quarez et al. [37], an enhancement in the electrochemical activity of RP-PCFC cathodes can be obtained for highly porous electrodes. The noted open porosity registered in this work is most likely a result from the relatively low temperature used (1050 °C). In this respect, Solís et al. [38] found that the best performance for cathodes of the RP-phase La1.5Pr0.5Ni0.8Co0.2O4+δ was attained when decreasing the sintering temperature from 1150 to 1050 °C. In addition, no apparent intergranular element diffusion can be identified by the EDS analysis, in agreement with previous studies reporting the good chemical compatibility of lanthanum nickelates with barium cerates [20,39].
The cross-sectional features of the composite cathode are shown in Figure 2b, highlighting that the thickness of the composite is close to 20 μm, which should be sufficient for attaining good performances [38,39]. Moreover, good adhesion to the electrolyte substrate can be evidenced with no apparent sites of delamination.

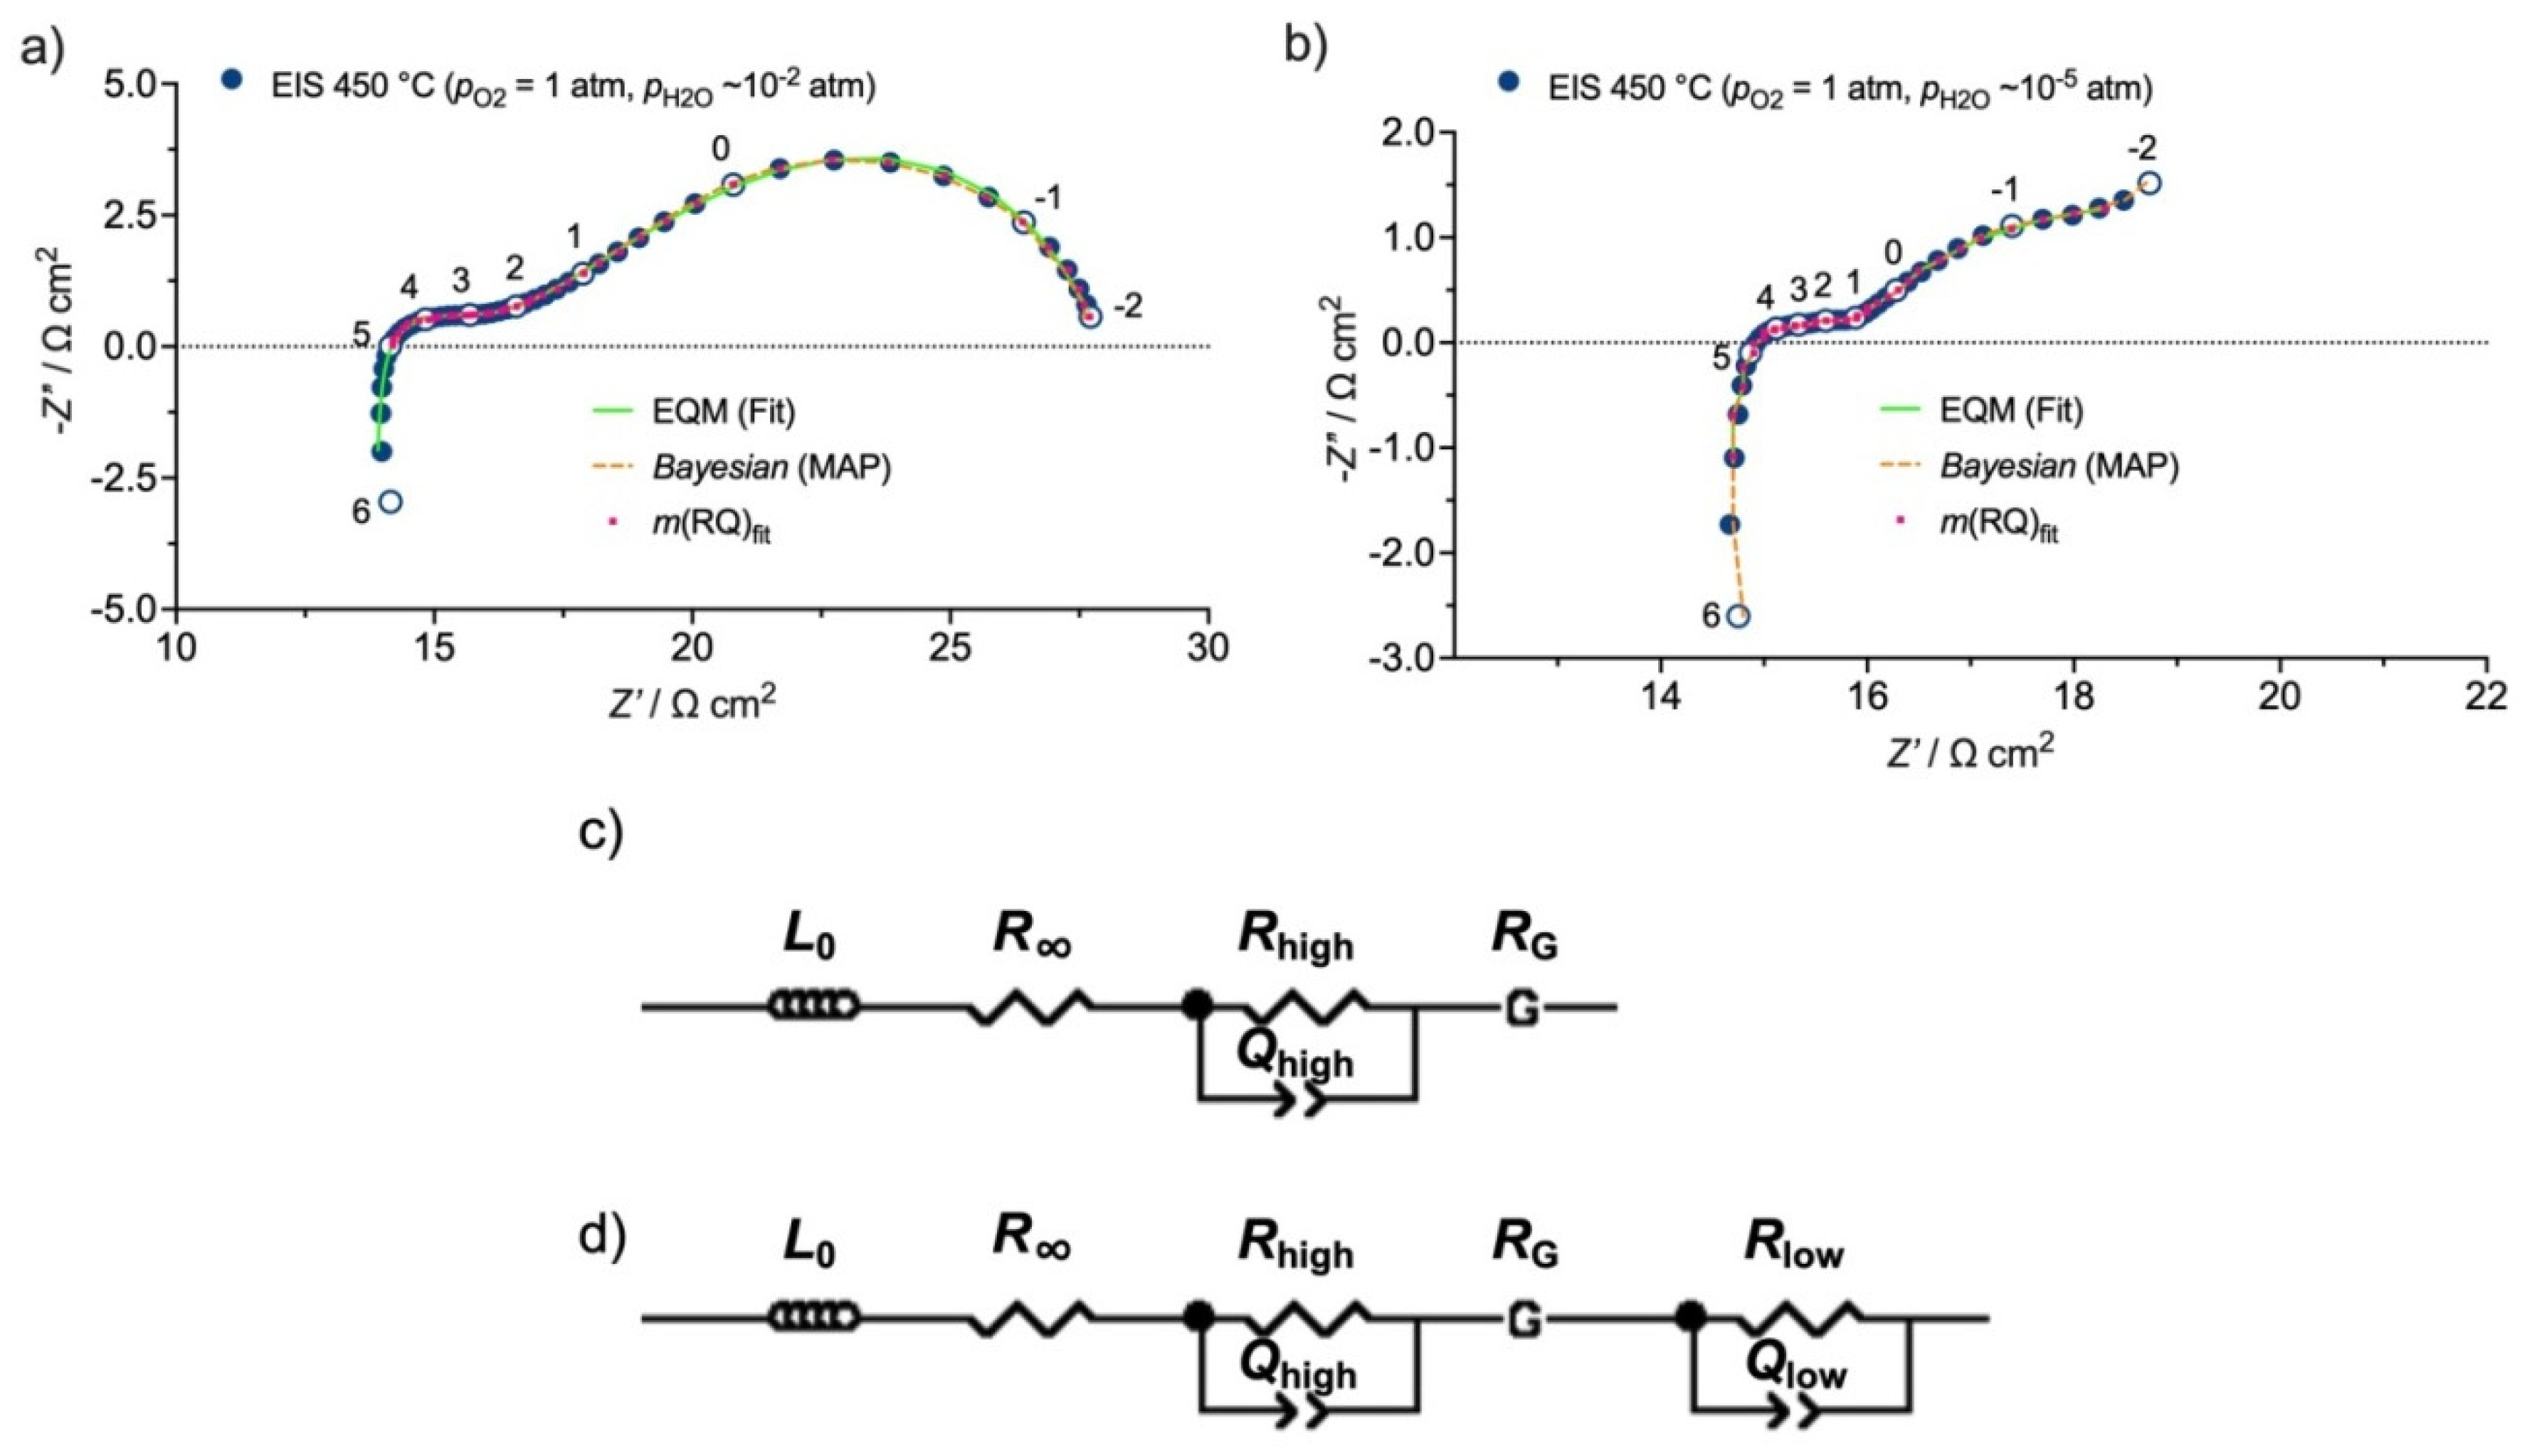
3.2. Equivalent Circuit Model (EQM)

Figure 3a,b depicts the EIS dispersions obtained for the LNO+BCY10 composite cathode in both wet (pH2O ~ 10−2 atm) and low humidity (pH2O ~ 10−5 atm) conditions at 450 °C in O2 atmosphere. Significant differences can be observed between the two dispersions. In wet conditions, a well-defined spectrum with a high-frequency inductive tail can be observed, followed by a small contribution resembling a depressed semicircle. The presence of one or more processes at high frequencies has been previously observed in the SOFC literature, which are usually ascribed to interfacial charge-transfer processes [5,19,40,41]. These processes can be appropriately described by R||Q elements, with impedance given by:
Z Q = Q i 1 ( i ω ) ϕ
where ω corresponds to the angular frequency, Qi to the pseudo-capacitance, and ϕ to the exponent of the angular frequency. The apparent capacitance is given by [4,5,42]:
C = R ( 1 n ) / n Q 1 / n
With decreasing frequency, a straight line evolves, characteristic of diffusion limitations, followed by a smooth transition to an R||C shape, indicating a capacitive behaviour at lower frequencies. This shape resembles a Gerischer contribution (G), which has been used to represent diffusion coupled to a reaction process in MIECs, such as the case of lanthanum nickelate cathodes [9] and also for a combination of a MIEC and an electrolyte phase [43]. The impedance of the Gerischer contribution is given by:
Z G ( ω ) = Z 0 K G + j ω
where Z0 is proportional to the chemical diffusion coefficient ( D ˜ ) 1 , j is an imaginary number ( j = 1 ) , and ω is the radial frequency ( ω = 2 π f ) . KG is related to the oxygen surface exchange rate, being independent of the geometry of the electrode. Hence, the Gerischer resistance, RG, is given by:
R G = 1 Y 0 K G   [ Ω ]
where Y0 is a parameter related to the diffusion coefficient. The capacitance is calculated by:
C G = 1 2 π · f m a x · R G
The resultant equivalent circuit model (EQM) is depicted in Figure 3c, which is composed by an inductor (L0), an off-set resistance (R), a high-frequency electrode polarisation resistance (Rhigh), and a Gerischer element. Conversely, in low humidity conditions, the low-frequency region cannot be resolved within the measured frequency ranges (1 MHz to 10−2 Hz), where an incomplete arc can be observed at low frequencies. For these conditions, a third element set composed of further R||Q contributions was used (Figure 3d). The fitting curves are shown in Figure 3a,b, from where it is possible to observe a good match to the experimental points. However, this information is not sufficient, since if the fit model contains any parameter that has a minor influence on the form of the fitted curve, the precision of determination of this parameter is unclear. For example, if an impedance arc is composed of two sub-arcs with close characteristic frequencies, but where one of the resistances is significantly smaller than the other one, the small resistance will be estimated with a larger error, although the deviation between the measured and fitted points might still be negligible. For this reason, the uncertainties of determination of fitting parameters must be also taken into consideration. Table 1 shows the fitting results obtained in both wet and low humidity conditions. From the results, we can observe that significant errors occur in the case of the data obtained in low humidity conditions, while considerably lower errors were estimated for the fitting in wet conditions. Hence, the data were further analysed using the distribution function of relaxation times (DFRT), as discussed in the following section.

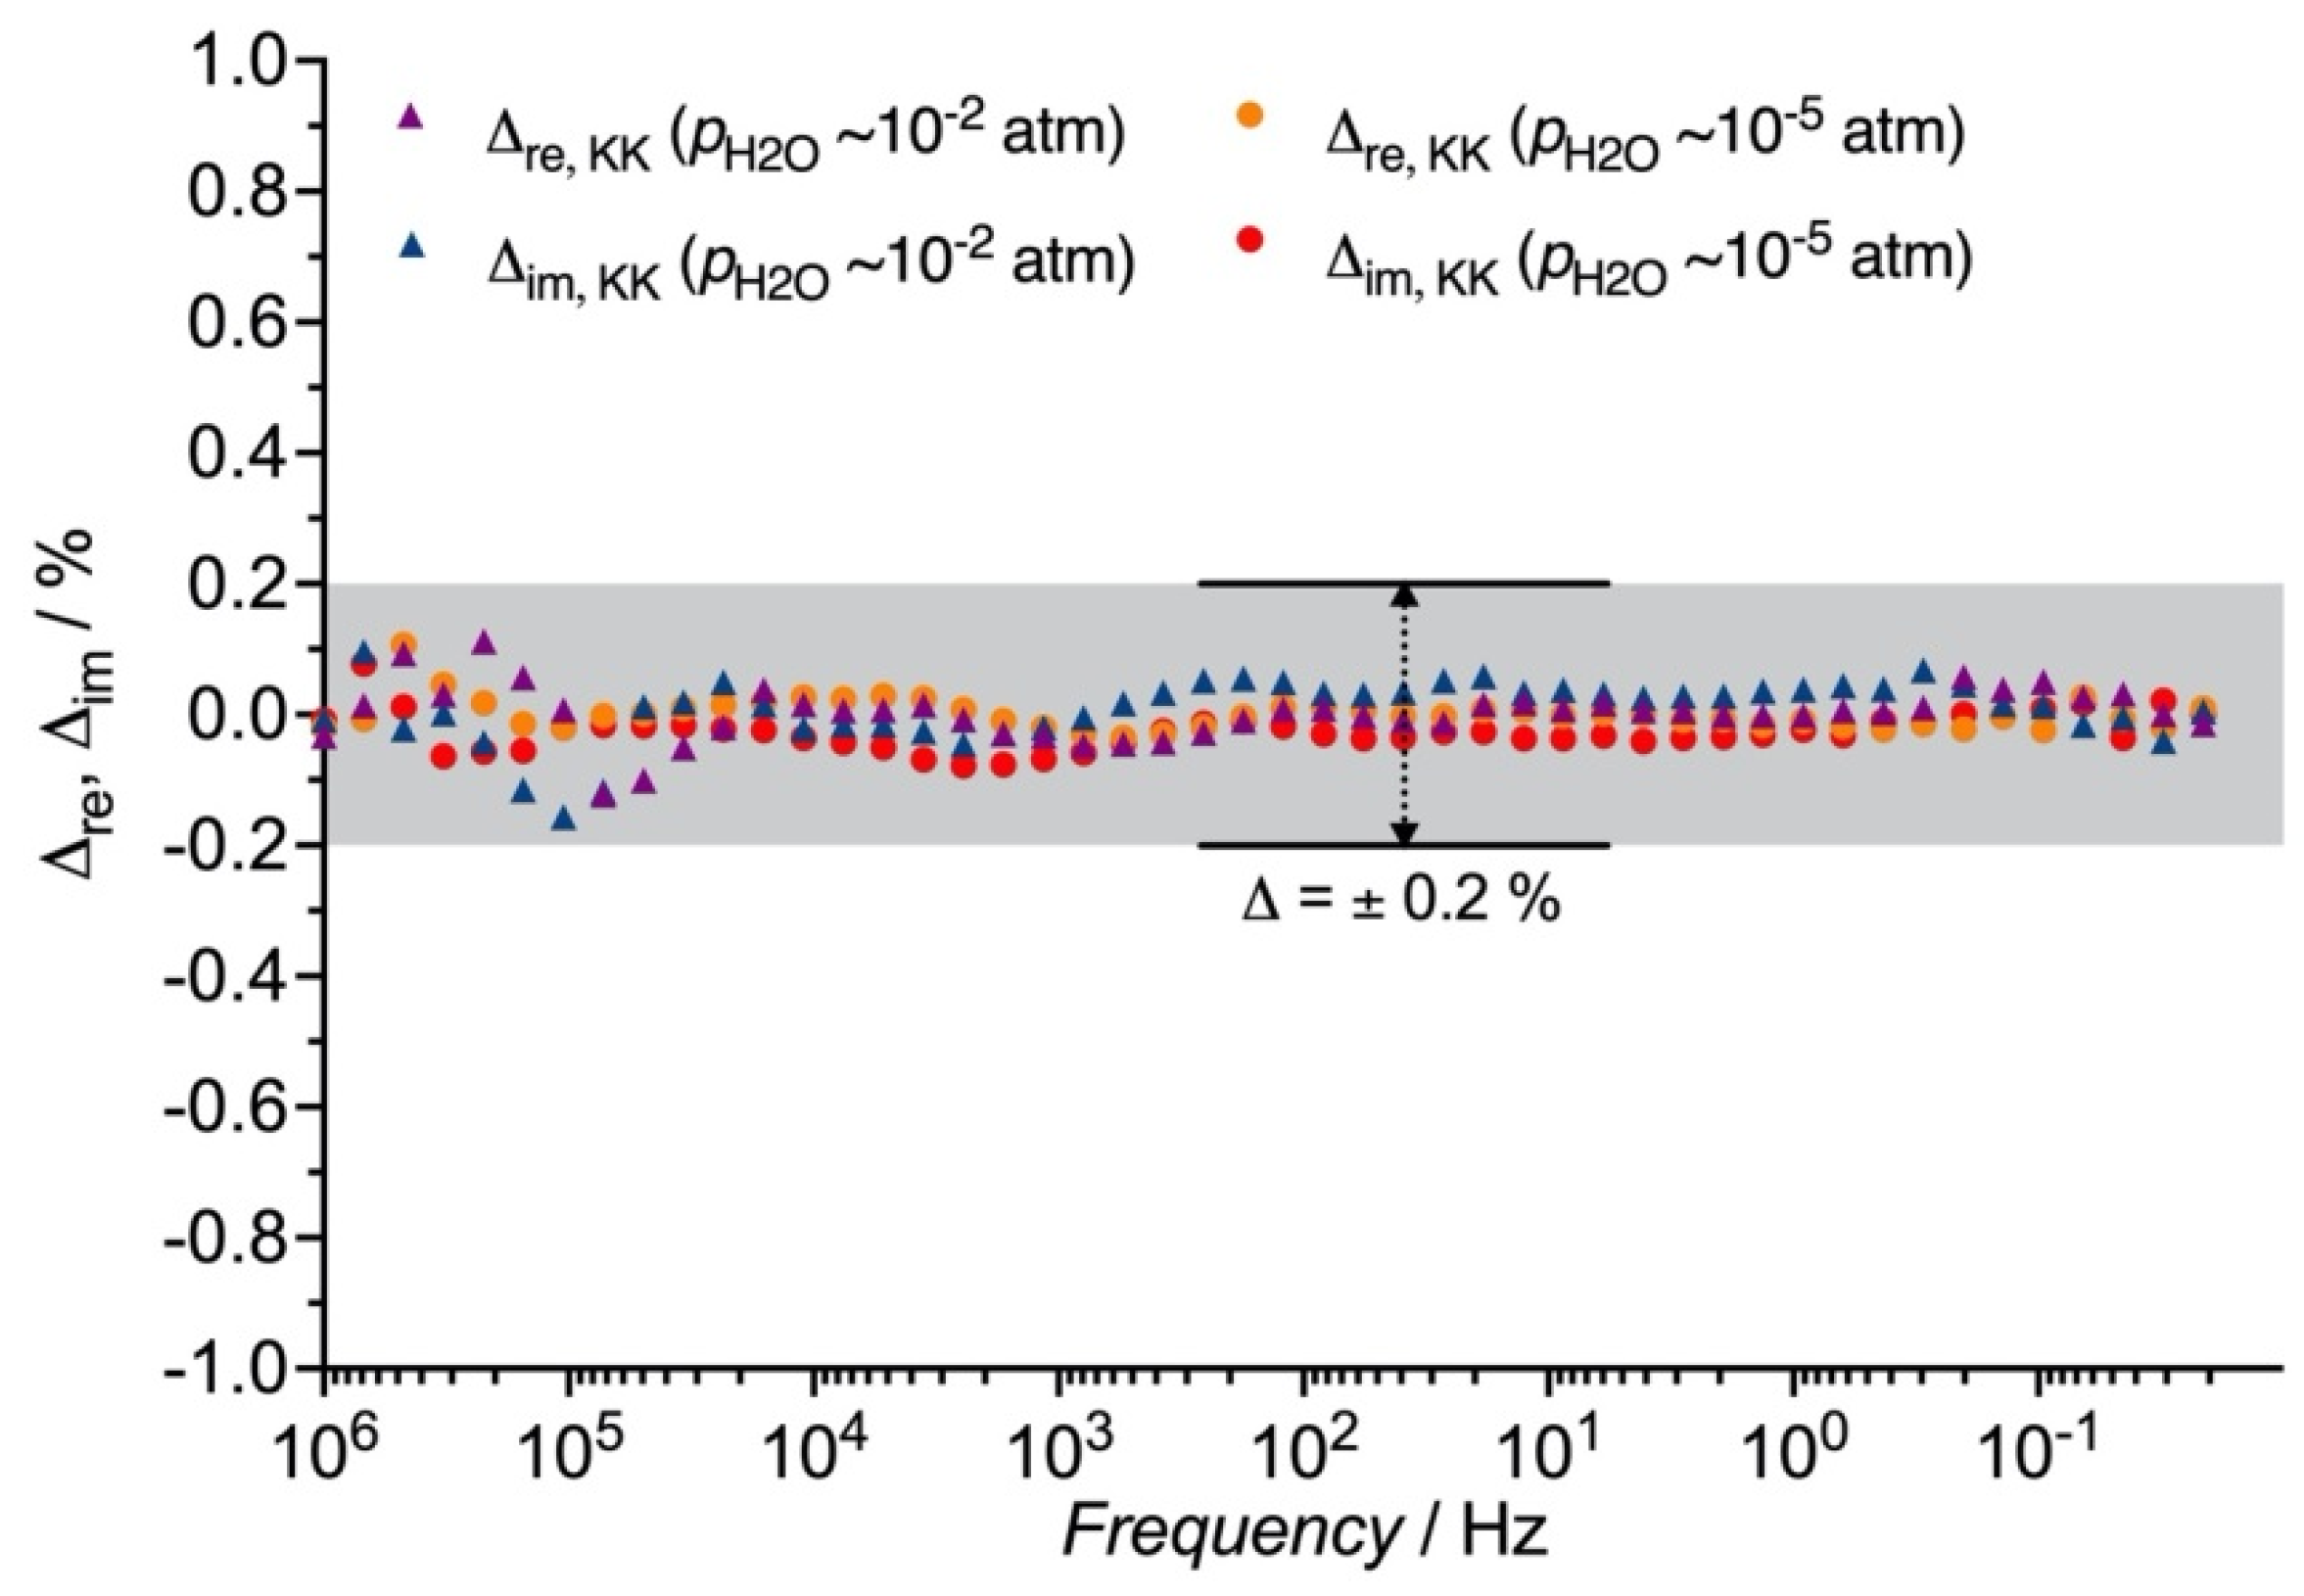
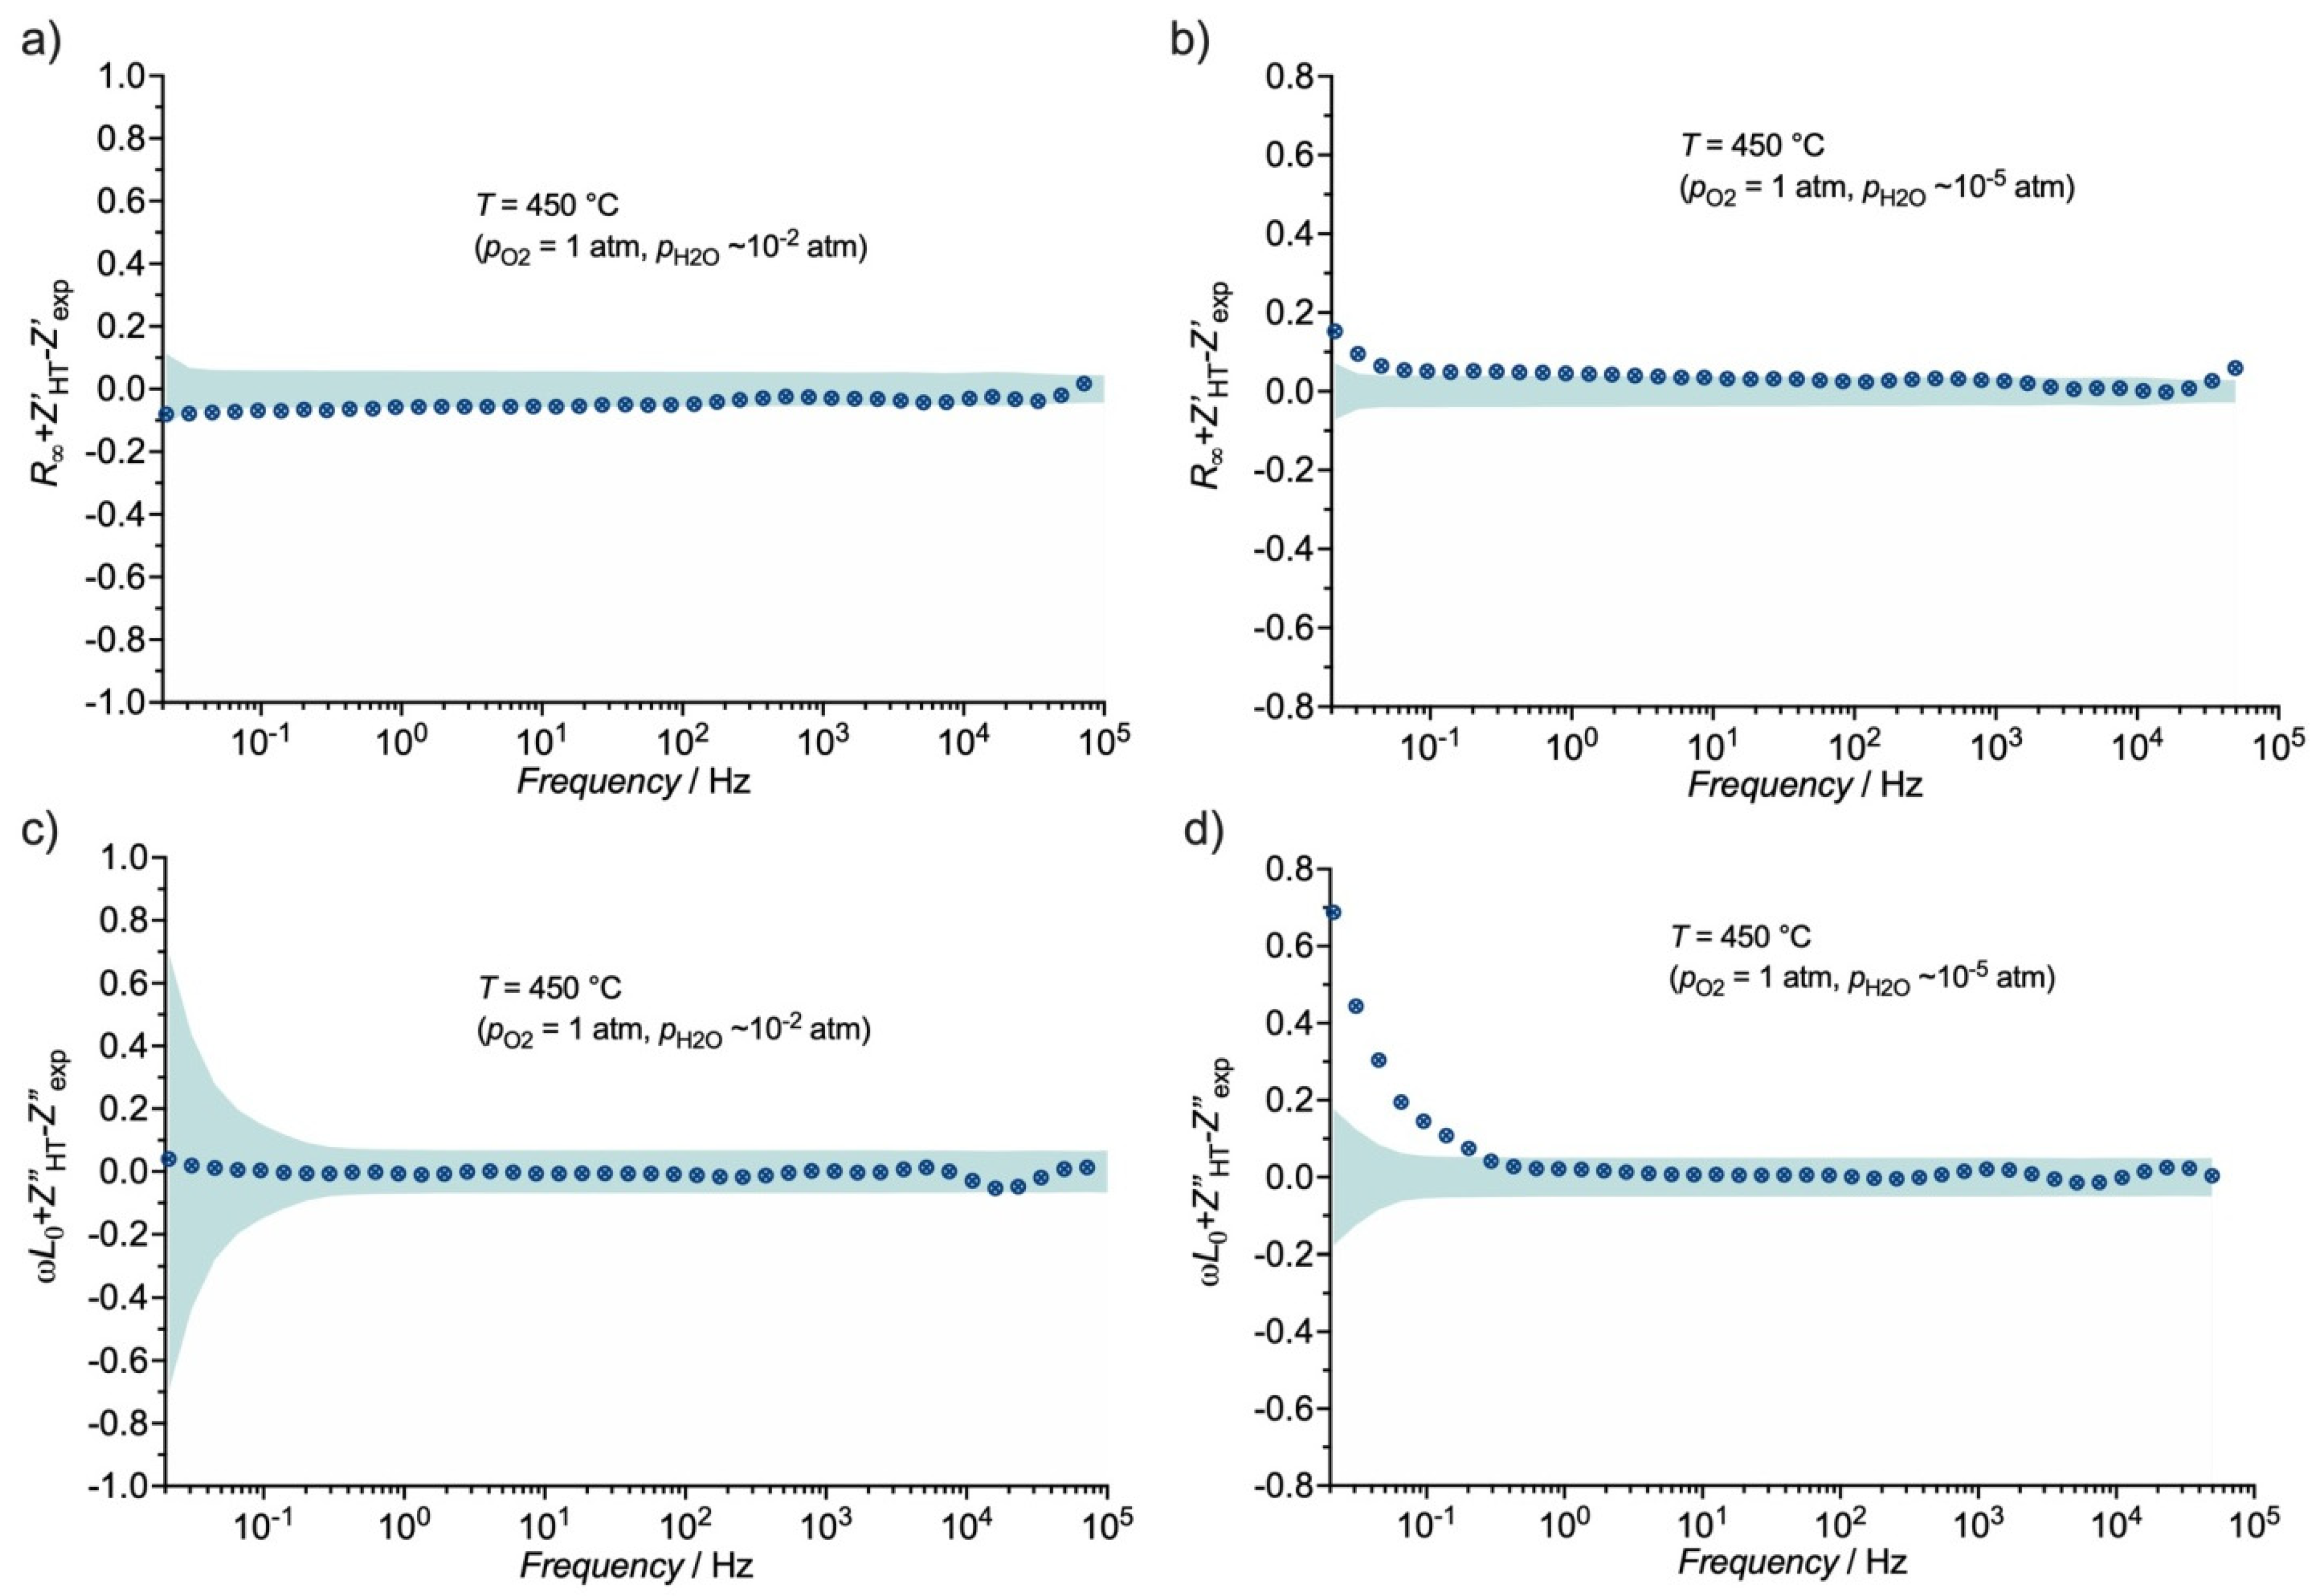
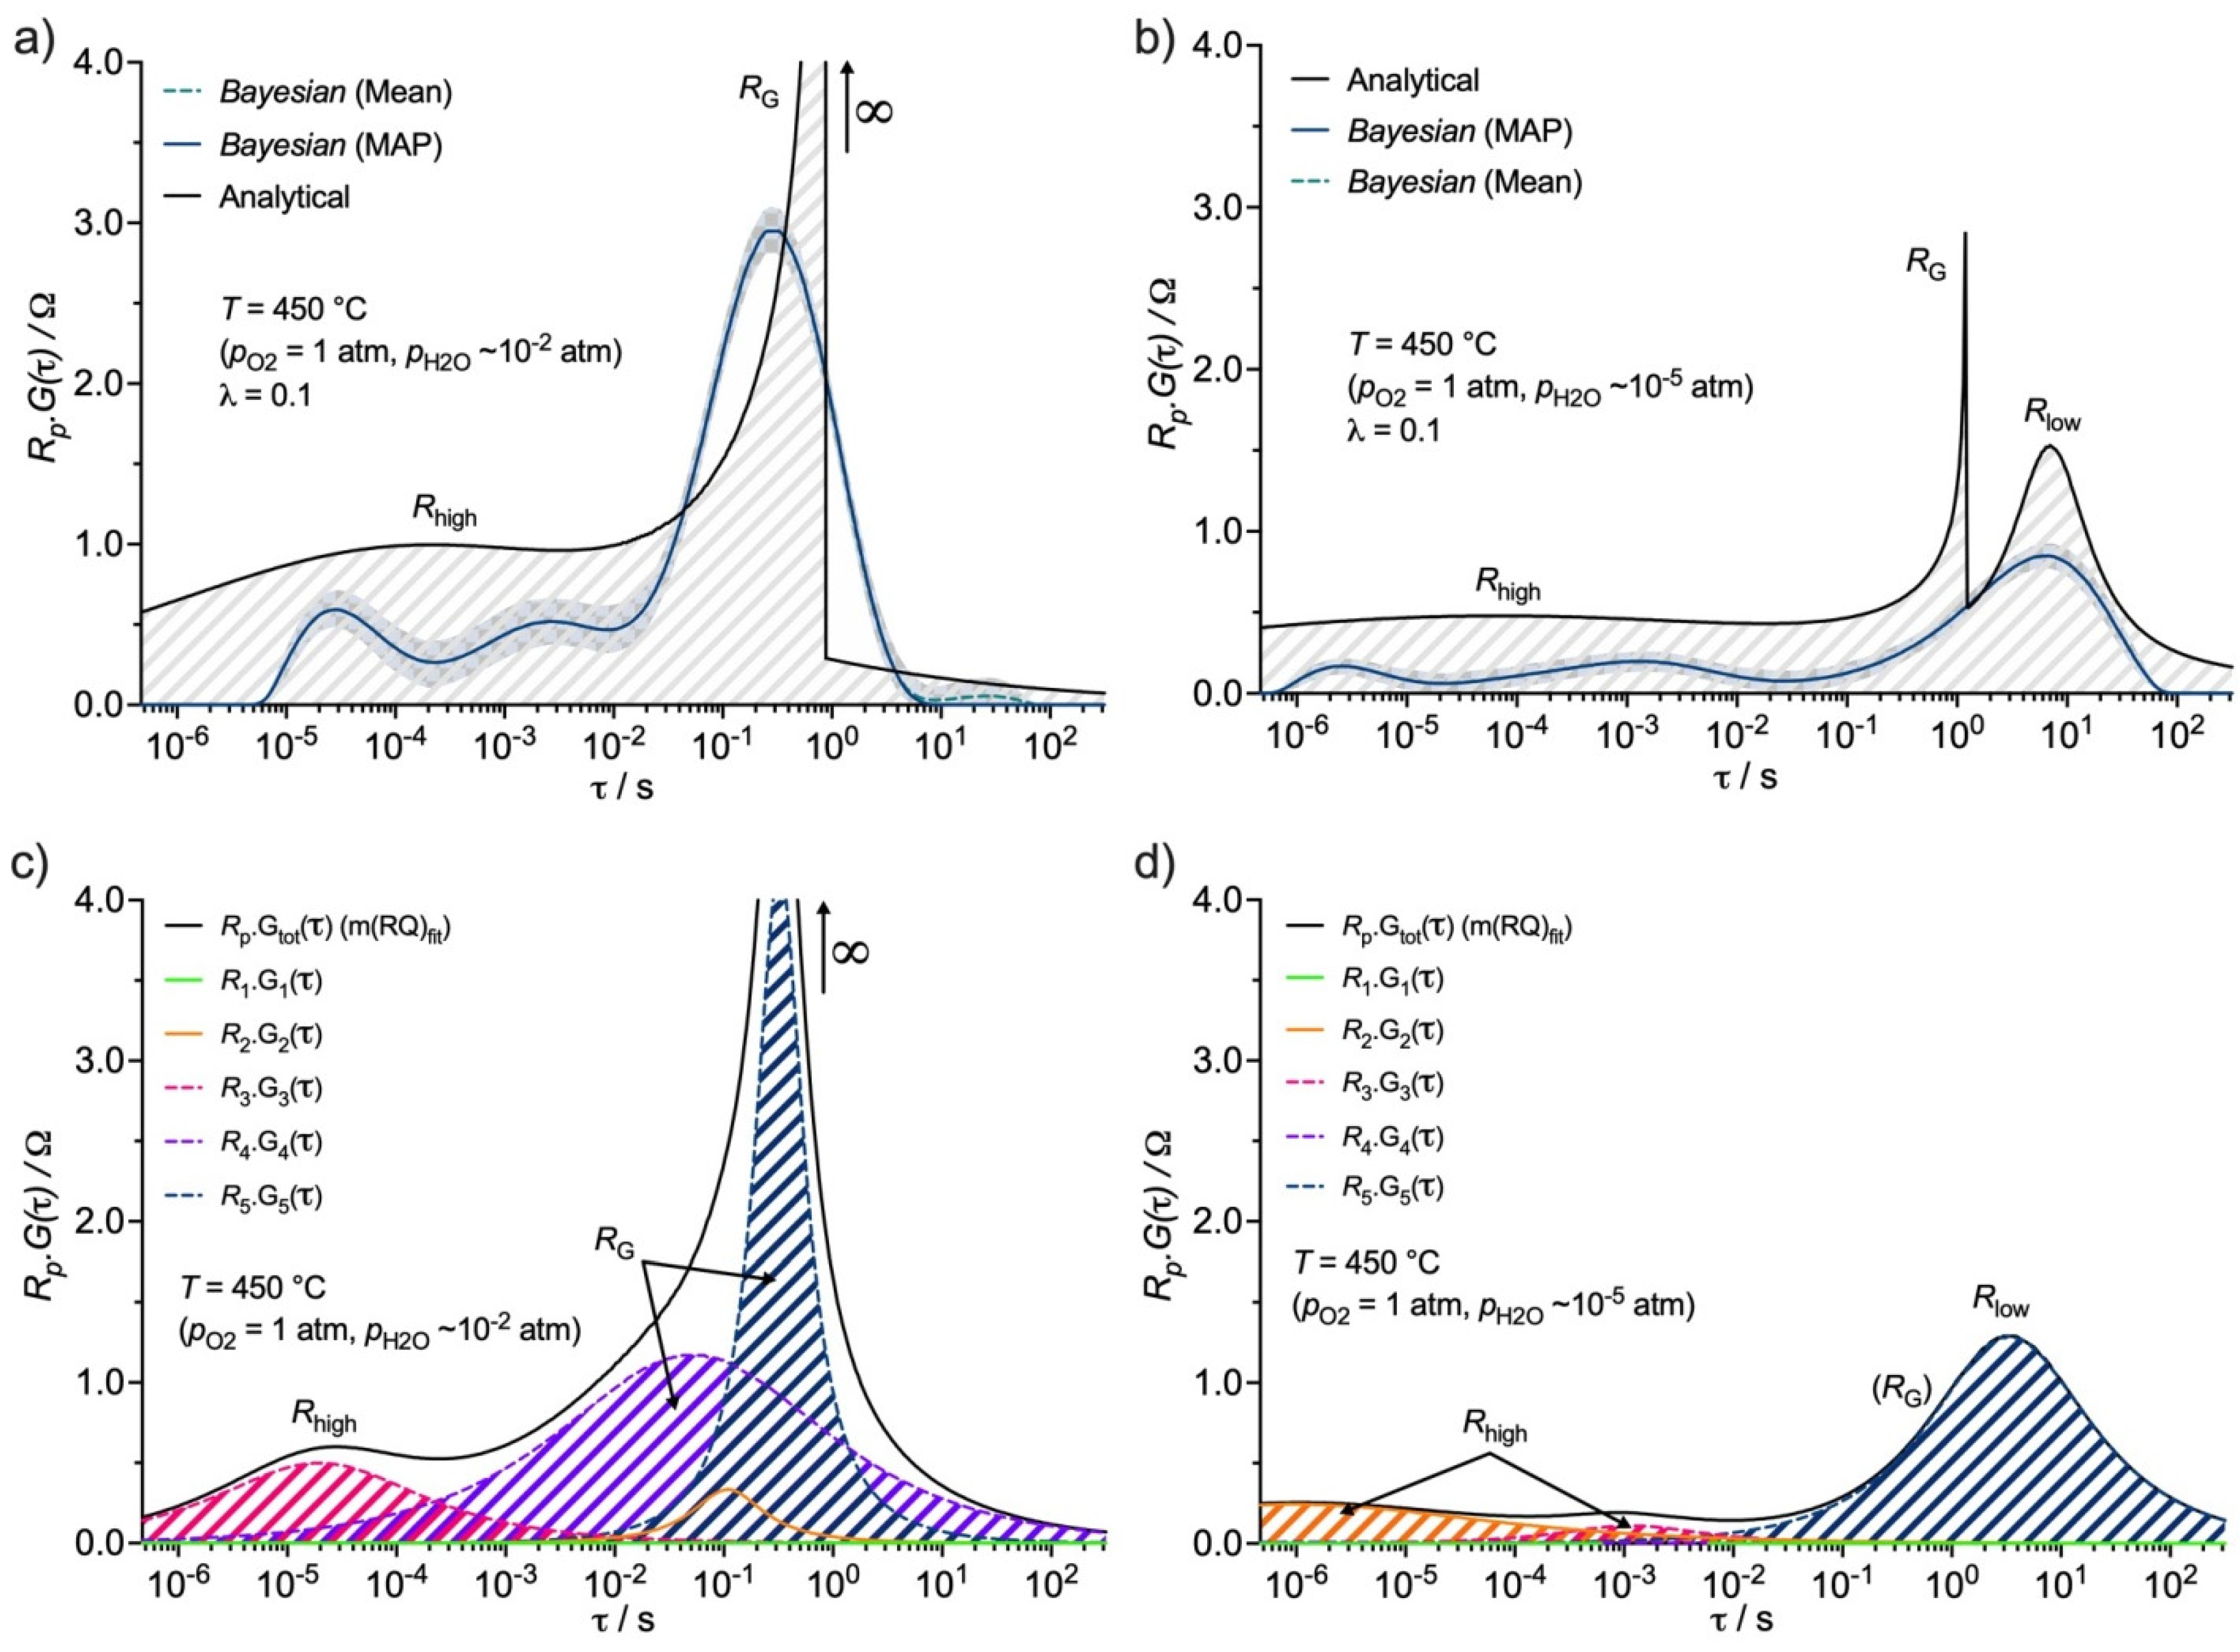
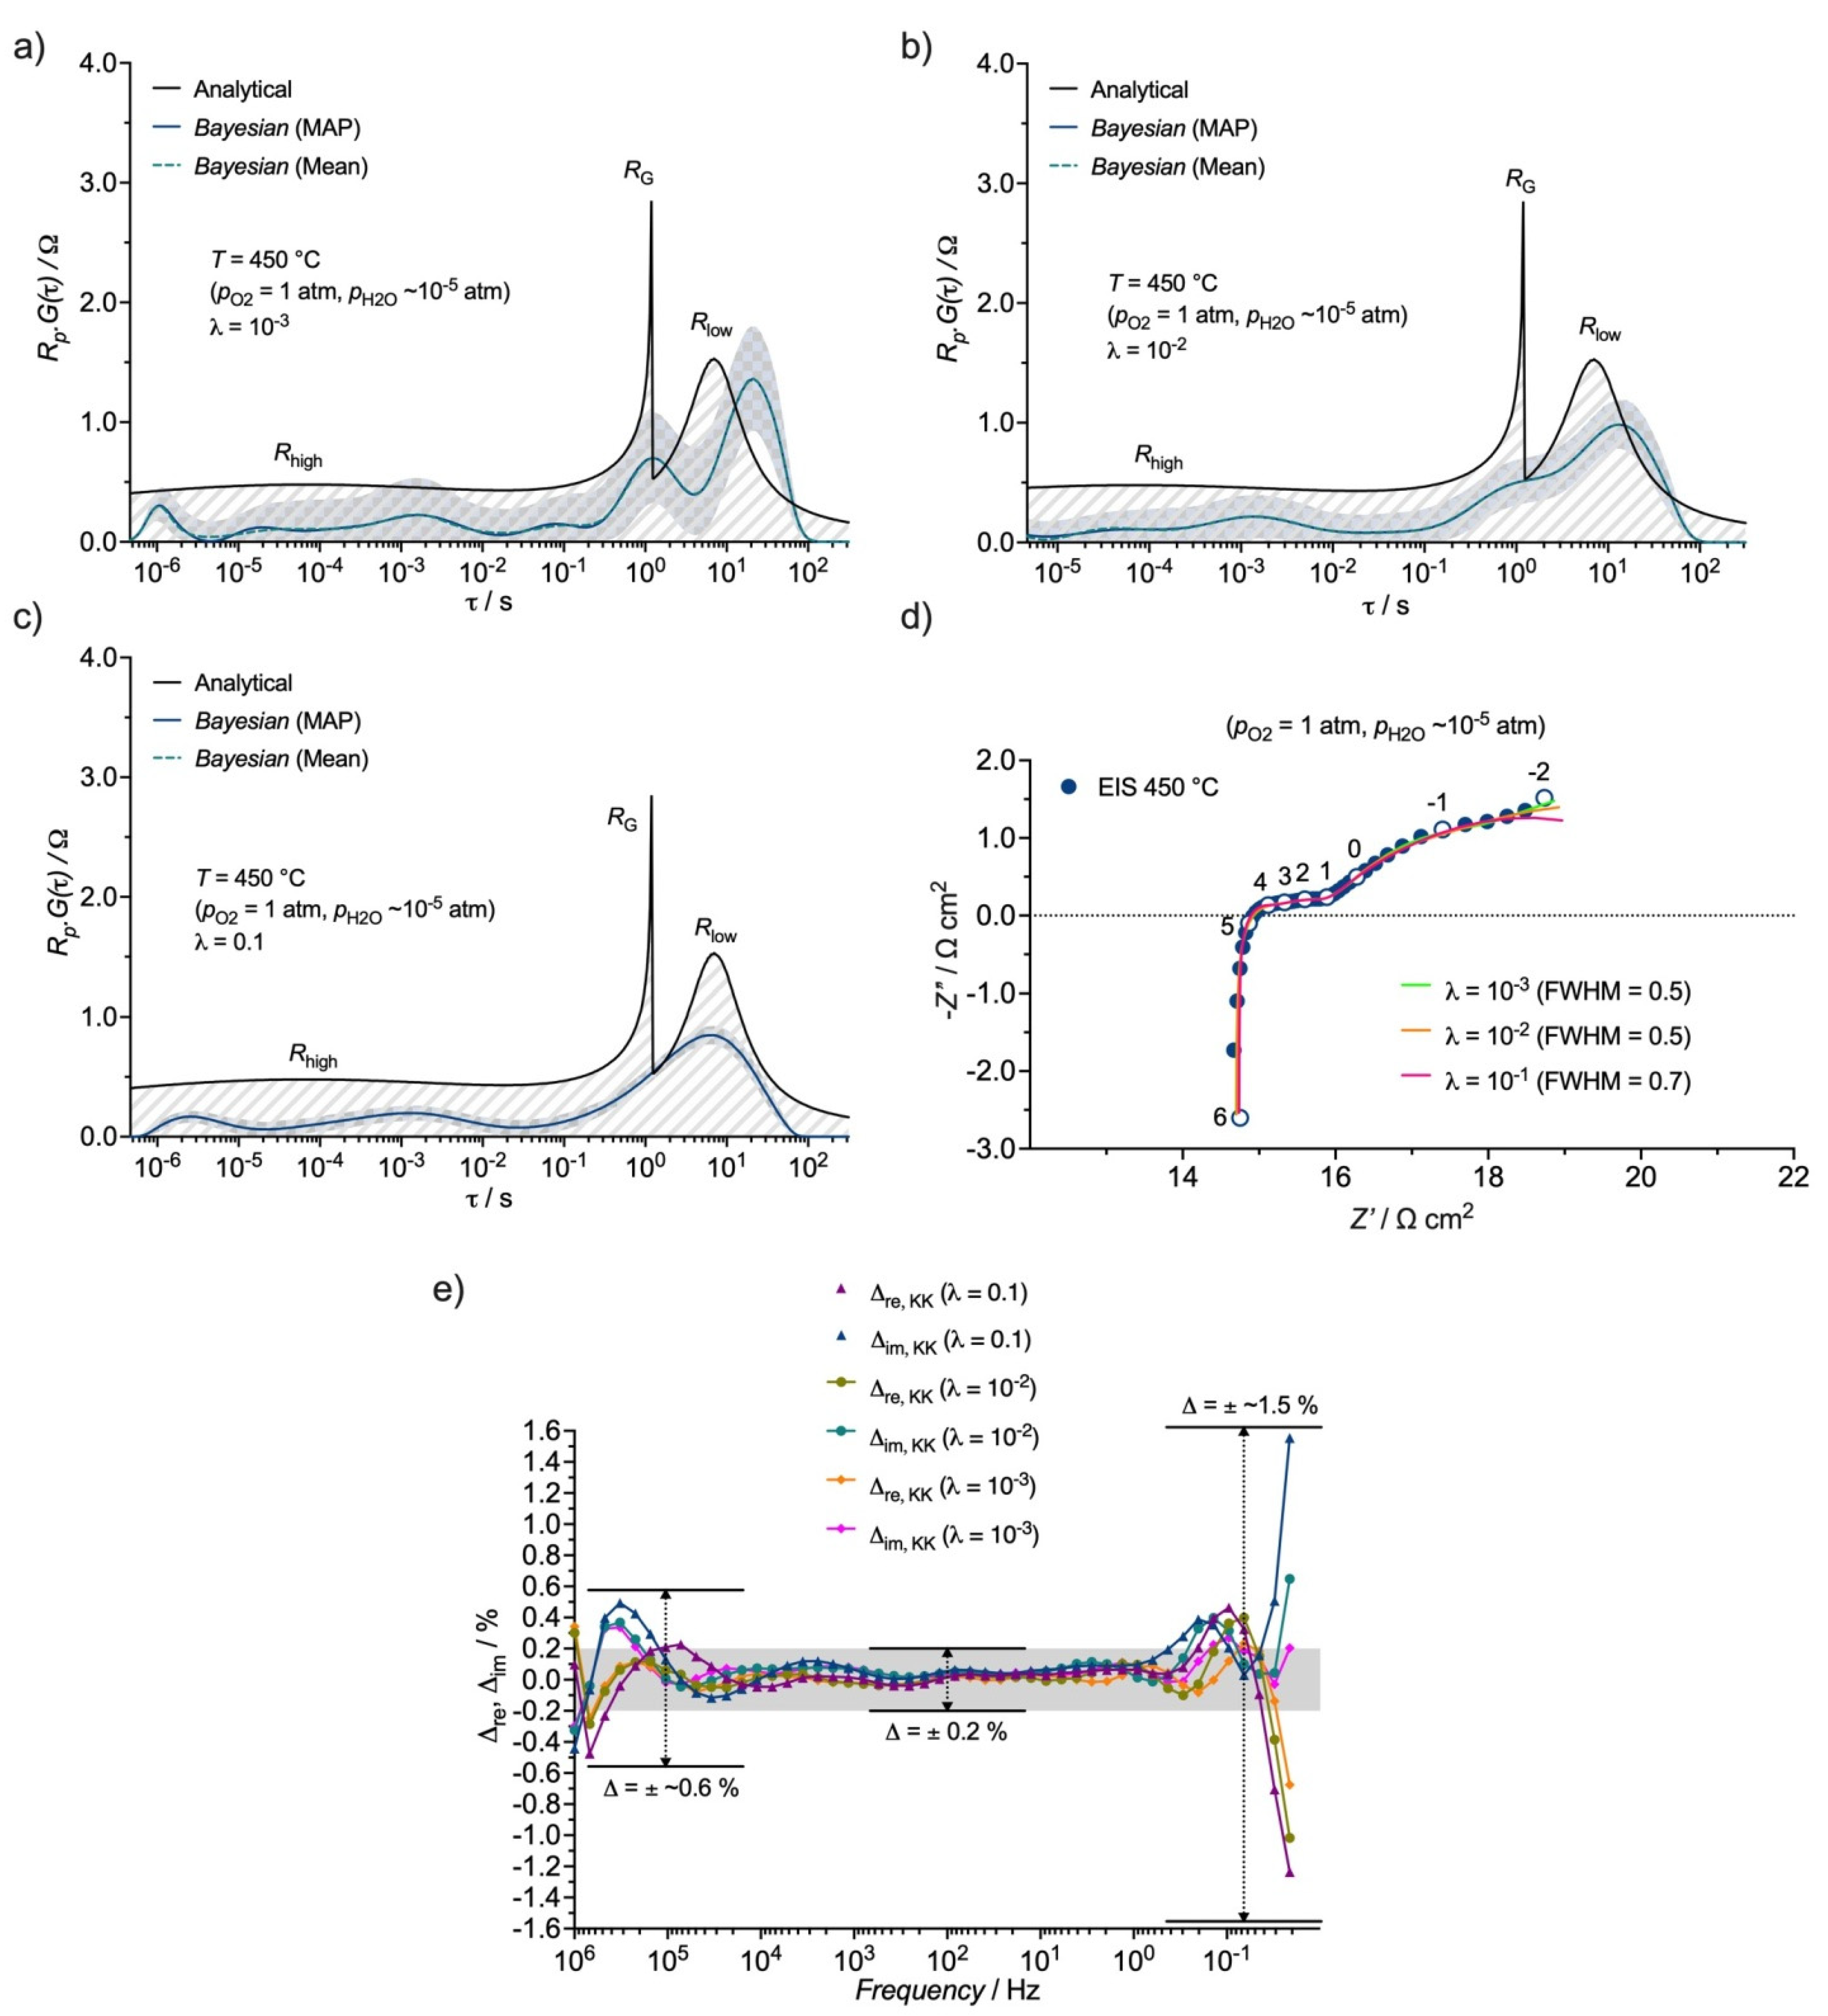
3.3. Distribution Function of Relaxation Times (DFRT) Analysis

The distribution function of relaxation times (DFRT) is given by a function, R p G ( τ ) , which can be given by [44,45]:
Z ( ω i ) = R + R p 0 γ ( τ ) 1 + j ω i τ d τ = R + R p G ( τ ) 1 + j ω i τ dln τ
with G ( τ ) = τ γ ( τ ) and   G ( τ ) dln τ = 1 . The term τ is the time constant,   ω is the angular frequency, R is the ohmic resistance, and R p is the polarisation resistance given by R p = R 0 R , where R 0 represents the impedance at ω 0 . The distribution function γ ( τ ) satisfies the normalisation condition 0 + γ ( τ ) = 1 .
Nonetheless, the impedance data must reflect a linear, time-invariant, and causal system [32,33,34]. Hence, the quality of the impedance data was initially evaluated in terms of Kramers-Kronig (KK) relations. The comparison is presented in Figure 4 for the real and imaginary parts of the impedance dispersions from Figure 3a,b. This is often represented in terms of a residual plot, which is obtained by the following two well-known relations [34]:
Δ real ( ω i ) = Z data , real ( ω i ) Z fit , real ( ω i ) | Z data ( ω i ) |
Δ imag ( ω i ) = Z data , imag ( ω i ) Z fit , imag ( ω i ) | Z data ( ω i ) |
where ω = 2 π f . From Figure 4, it becomes clear that the imaginary part can well reconstruct the real part (and vice-versa) of the experimental data with values lower than ±0.2% (Figure 4).
A further analysis is related to the Bayesian Hilbert transform (BHT) [32] test that is depicted in Figure 5, obtained from both EIS dispersions. In this figure, the blue dots represent the mean impedance, while the green shading area was calculated based on the number of experimental points that lie within three standard deviations (3σ) [32]:
S 3 σ , re = 1 M m = 1 M 1 ( | R + Z BHT , re ( ω m ) Z exp , re ( ω m ) | 3 σ ( ω m ) )
S 3 σ , im = 1 M m = 1 M 1 ( | ω m L 0 + Z HT , im ( ω m ) Z exp , im ( ω m ) | 3 σ ( ω m ) )
where “1” is the indicator function, which can take the value of 1 if its argument is true and 0 when the argument is false, 3σ (ωm) is the standard deviation multiplied by 3 (i.e., three credible intervals), ωm, and R and L0 are obtained by the Bayesian regression. This metric considers that 0 ≤ S ≤ 1, where scores closer to 1 have lower residuals.
In wet conditions, both the real and imaginary experimental part falls within this interval, with the majority of the residuals represented inside the 3σ credible interval, suggesting that the EIS data are consistent. However, the dispersion indicates a minor time drift in the EIS data acquired in low humidity conditions. Particularly, in the case of the imaginary part, a significant deviation at low frequencies is observable. Such deviation is significantly larger in the case of the analysis in low humidity conditions, due to the difficulty in fitting the low-frequency tail below 0.1 Hz (Figure 3b). This notable result may well explain the relatively large errors obtained by the EQM fitting in Table 1, highlighting the importance of studying the quality of the EIS spectra when analysing the results. The scores presented in Table 2 also corroborate this conclusion.
Another useful score, Sμ, consists in summing 1 to the negative of the relative distance between the mean μDFRT and μBHT vectors. The score Sμ varies between 0 and 1 and, when both μDFRT and μBHT vectors are similar higher scores can be obtained, as follows [32]:
S μ , re = 1 μ DFRT , re μ BHT , re μ DFRT , re + μ BHT , re
S μ , im = 1 μ DFRT , im μ BHT , im μ DFRT , im + μ BHT , im
Table 2 depicts the scores (%) obtained for the Bayesian Hilbert transform (BHT) experiments by both described metrics. The high Sμ values are indicative that the real part can recover the imaginary part well and vice-versa, of the spectra obtained in both wet and low humidity conditions, with values in the range of 86–100%. This result can be observed by the fitting curves depicted in Figure 3a,b. Nonetheless, while an apparent good match to the experimental data can be observed, this result emphasises that different metrics should be used for a deep understanding of the results. This is especially important when the accuracy of the determination of the fitting parameters from the EQM may be questionable, as it is the case of the results presented in Table 1. Hence, the use of both metrics allows determining, with more depth, the quality of the impedance data, being able to detect minor deviations from linearity or stability, thus, emphasising the need for a much deeper analysis.
Figure 6 depicts the DFRT analysis performed on the LNO+BCY10 composite cathode in both wet (pH2O ~ 10−2 atm) and low humidity (pH2O ~ 10−5 atm) conditions at 450 °C in O2 atmosphere. The analytical procedure (Figure 6a,b) was executed using the following expression for the R||Q contributions [44,45]:
R i · G ( τ ) RQ = R 2 π · sin ( ( 1 ϕ ) π ) cosh ( n ln ( τ τ 0 ) ) cos ( ( 1 ϕ ) π )
with τ 0 = ω 0 1 = R i · Y 0 ϕ .
However, an alternative procedure was also adopted for simulating the Gerischer dispersion (G) [44,45]:
R i · G ( τ ) G = R π · τ τ 0 τ , τ τ 0 R i · G ( τ ) G = 0 , τ > τ 0
The DFRT is then the sum of all separate contributions [44,45]:
R p · G ( τ ) = i R i · G ( τ )
with R p = i R i , where the area under the curve of R·G(τ) equals Rp.
The analytical DFRT in wet conditions is composed of a first peak with a broad distribution for τ 0 = 1.13 × 10 4   s , as a result of the low value of ϕ = 0.25 , followed by an asymmetric peak that is related to the Gerischer dispersion for τ 0 = 0.85   s . Regarding the measurement in low humidity conditions, similar time constants were detected, but an additional contribution with a large time constant ( τ 0 = 7.06   s ) is observed. In this case, a sharper peak can be observed due to the higher value of the exponent ( ϕ = 0.76 ). The full width at half maximum (FWHM) depends strongly on the value of the exponent ϕ [44,45].
The G(τ) of the Gerischer element is unbounded to the left of τ0, i.e., lim τ τ 0 γ ( τ ) = that relates to the diffusion part, followed by a straight vertical line with a discontinuity at τ0 (right side of the peak), which relates to the capacitive part. It is worth saying that the analytical procedure is very sensitive to this behaviour, where the capacitive processes appear in the form of a narrower peak. Such complexity of the Gerischer dispersion makes the DFRT of this contribution quite challenging. In this respect, the Bayesian regression has been recently introduced [46,47], and it is here used as an attempt to facilitate the deconvolution of this response. In Figure 6a,b, the DFRT obtained by this method is also presented for comparison with the corresponding confidence interval (CI), by carrying out 2000 iterations.
Indeed, the Bayesian framework is a powerful tool to evaluate the credibility of the obtained DFRT solution, i.e., the narrower the CI, the more confident is the solution under the given hypothesis [46,47]. Such differences are highlighted in Figure 7a–c for a different regularisation parameter (λ), which was varied from 10−3 to 0.1 for low humidity conditions. It follows that, for lower λ values, larger CI are observed, as well as more peaks, resulting in higher oscillation of the DFRT curve. Lower λ values usually lead to a higher degree of oscillation, creating more peaks, however with a better reconstructed EIS (Figure 7d) and lower residuals (Figure 7e). The MATLAB application “DFRTtoEIS” tool co-developed by some of the current authors [34] was used for obtaining the reconstructed solutions. The difference between the MAP (Maximum-a-Posteriori) solution, which maximises the probability density function of the DFRT, and of the mean solution, is also higher for lower λ values (Figure 7a–c).
Another interesting feature is that the analytical Gerischer component presents a good match with the two peaks of the Bayesian regression. In contrast, the last peak, appearing for higher τ-values (low-frequency region), has a strong deviation between both procedures. In addition, the numerous peaks of this Bayesian solution seem too unrealistic for attributing physical processes separately. However, with the increase of λ, the oscillation decreases and the number of peaks, as well. Hence, the best solution was that given by λ = 0.1, with a good match between the individual time constants and a decreased CI.
Finally, a last approach to obtain a DFRT was based on a EQM with a linear series of R||Q-circuits [44,45], herein designated as multi-fit procedure (m(RQ)fit), which was obtained using a combination of five R||Q-circuits in the series (Figure 6c,d). This method avoids the use of any regularisation parameter, thus, minimising the chance of having extra peaks (oscillations). As a result, for lower time constants (higher frequencies), only one large peak could be obtained in wet conditions. In contrast, two peaks were detected in this region for the data in low humidity conditions. Interestingly, one of these peaks has a characteristic time constant falling outside of the represented τ-axis scale. This could be related to some contribution related to the grain boundary of the BCY10 electrolyte support (e.g., due to the very low humidity in this case) or due to the difficulty in fitting the data with five R||Q contributions. Nonetheless, the important point here is that both the Bayesian regression and the m(RQ)fit procedure show quite similar behaviour with a broad main peak for higher time constants (lower frequencies), albeit the latter procedure has a slightly sharper peak, which is clearly related to the RC type behaviour of the Gerischer dispersion at lower frequencies, which should yield a δ-function in τ-space (i.e., a vertical spike) [45].
The main idea in this discussion is to clearly demonstrate that the impedance reconstructions of the different methodologies are all very close to the original experimental data and different DFRTs. This implies that for any given EIS spectrum there are many possible DFRTs, depending on the employed methodology. It is, thus, very important to put all information together in order to determine the exact number of meaningful physical processes. In this way, it is reasonable to assume that at least three time constants can be expected in low humidity conditions, which is in agreement with those found for the EQM procedure.

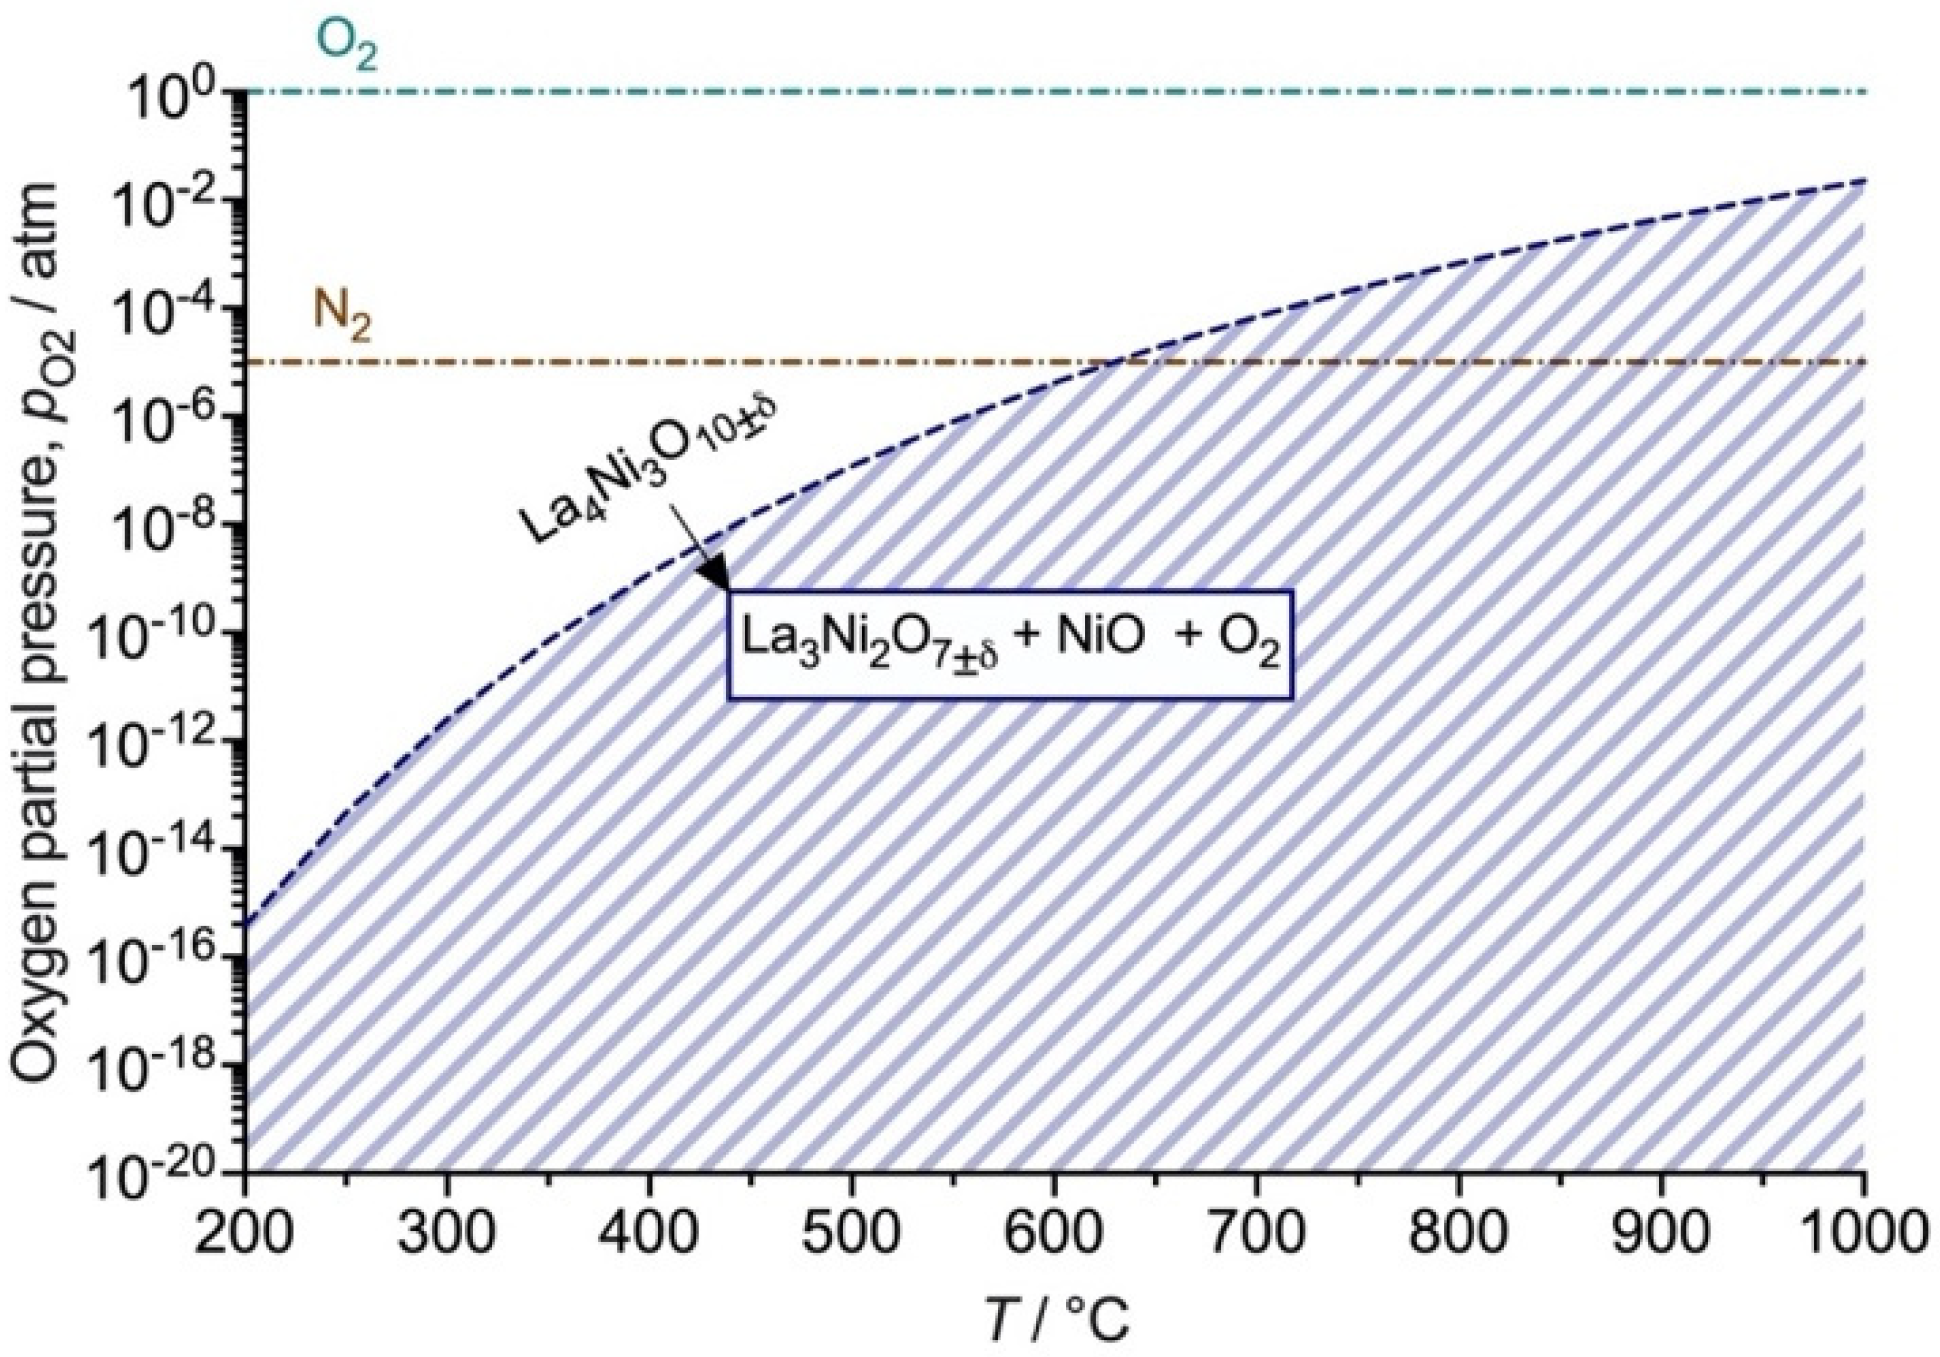
3.4. Electronic Short-Circuiting through the BCY10 Electrolyte

In addition to the typical protonic and oxide-ion conductivity, the majority of proton-conducting ceramic electrolytes exhibit electronic p-type conductivity in oxidising atmospheres. The ionic-conducting phase here utilised, BCY10, is known to possess this electronic component in oxidising atmospheres, which can significantly impact the total conductivity in these conditions [24], as expressed by:
1 2 O 2 ( g ) + V O O O x + 2 h
Figure 8 depicts the electronic transport numbers for hole conduction estimated for BCY10 as a function of pH2O in the temperature range of 400–550 °C in O2 atmosphere. The significant electronic contribution with increasing temperature and decreasing pH2O is evident.
Therefore, the intercept of the impedance dispersion with the real axis at high frequency ( Z Q = 1 / T ( j ω C ) n ) corresponds to the electrolyte electrical resistance (R), which corresponds to the parallel combination of the ionic (Rion) and electronic (Reon) resistances, given by:
1 R ohm = 1 R ion + 1 R eon
At low frequency, ( Z Q = 1 / T ( j ω C ) n 0 ) corresponds to the total resistance ( R 0 ) of the cell:
1 R 0 = 1 R ion + R p + 1 R eon
Finally, the true total polarisation resistance of the electrode is given by:
R p = R 0 R eon R eon R 0 R ion
where R eon = R ohm / t eon .

3.5. Temperature Dependence of the Polarisation Resistances

The temperature dependence of the polarisation resistances is depicted in Figure 9 in wet (pH2O ~ 10−2 atm) and low humidity (pH2O ~ 10−5 atm) conditions at 450 °C in O2 atmosphere. Data were corrected using Equation (20) to account for the electronic leakage through the electrolyte. An obvious observation is that this effect is much more pronounced in low humidity conditions and at higher temperatures, as expected due to the increase in p-type conductivity (Equation (17)). In terms of the magnitude of the corrected total polarisation resistance, we can observe a slight increase in this term in low humidity conditions in the whole measured temperature range (400–550 °C). Nonetheless, it notable that the opposite trend would be observed, if no short-circuiting correction was used, highlighting the significance of this procedure for the correct interpretation of the impedance data and, thus, the limiting electrode mechanisms.
Hence, for a more elaborated interpretation, the individual contributions, with correction, will now be discussed. In this respect, the high-frequency term, Rhigh,eon, shows a distinctive behaviour upon changes in pH2O. In wet conditions, this term shows capacitance values in the range of 10−5–10−6 F cm−2 in all conditions. Such values are typical of charge transfer processes [17,18], which may involve the oxygen diffusion into the electrode:
O 2 ( ads ) + 2 e + V O O O ( cathode ) x
and/or proton-transfer:
OH O ( electrolyte ) + O O ( cathode ) x O O ( electrolyte ) x + OH O ( cathode )
Both processes have a negligible pH2Om dependence ( m = 0 ) , which is in line with that determined for Rhigh,eon in this work, in both conditions of humidity. The activation energy found for this term was found to range from 0.7 to 1.1 eV upon increasing the pH2O (Table 3). In fact, the activation energy found for this term is slightly higher than that reported for proton mobility (i.e., 0.5 eV [23,24]). Hence, in wet conditions, a combination of both processes may be occurring. However, the lower activation energy in low humidity conditions may be a result of an increased electronic p-type conductivity in the absence of sufficient humidification of the LNO phase. This is also corroborated by the fact that this term dominates the total polarisation resistance at higher temperatures in low humidity conditions, as expected from the decrease of p-type conductivity with increasing temperature in the LNO phase [14].
The Gerischer response, RG,eon, occurring at intermediate frequencies, is used here to represent a co-limitation of both surface processes, including oxygen adsorption ( m = 0 ) :
O 2 ( g ) O 2 ( ads )
and/or oxygen dissociation ( m = 0 ) :
O 2 ( ads ) 2 O ( ads )
However, a striking feature is related to the Y0-parameter, which shows a pH2O−0.44 dependence, thus, suggesting proton transfer ( m = 0.5 ) . In wet conditions, the Y0-parameter shows an activation energy value of 0.49 eV (Table 3), similar to that reported for proton transport (Ea = ~0.5 eV [23]). Nonetheless, as pointed out by Grimaud et al. [18], proton diffusion in LNO electrodes should be limited to a narrow zone close to the electrode/electrolyte. However, this is likely to not be the case in the current electrodes, due to the presence of the proton-conducting phase of BCY10 in the composite electrode. This behaviour can indeed favour the Rp by extending the electroactive surface area for water formation. Conversely, in low humidity conditions, the activation energy for the Y0-parameter is 1.38 eV (Table 3), close to that determined for oxygen self-diffusion in LNO (Ea = 1.44 eV [14]), thus, suggesting that the oxide-ion conductivity can be more relevant in such conditions.
Concerning the electrode reaction step, i.e., the low-frequency term, Rlow,eon, shows a strong pH2O−1 dependence, thus, the rate determining step of this term can be assigned to either water formation ( m = 1 ) :
2 OH O ( cathode ) H 2 O ( ads ) + V O O O ( cathode ) x
and/or to steam release ( m = 1 ) :
H 2 O ( ads ) H 2 O ( g )
The very high capacitance values found for this term (close to 1 F cm−2) are characteristic of diffusion processes, hence, possibly suggesting that the molecular gaseous water diffusion is rate limiting. Indeed, the presence of this low-frequency process only in low humidity conditions is an indication that the adsorbed water may be involved in the process, where the decreased concentration of protons is affecting the formation of water at the surface. In this regard, the relatively open microstructure of the current electrode should play an important role, due to the increased surface area, thus, providing an increase in active sites all over the surface of the grains. Such observations are in agreement with those previously reported by Grimaud et al. [17,18] for lower order Ruddlesden Popper nickelates and also the results of Quarez et al. [37] and Solís et al. [38], where the authors reported that improved performance can be obtained for more porous cathodes.

3.6. Conclusions

In this work, a symmetrical cell of the La4Ni3O10±δ-BaCe0.9Y0.1O3-δ composite cathode on the BaCe0.9Y0.1O3-δ electrolyte substrate was successfully analysed with respect to the dominant electrode mechanism under wet (pH2O ~ 10−2 atm) and low humidity (pH2O ~ 10−5 atm) conditions in O2 atmosphere (400–550 °C). Equivalent circuit modelling was revealed to be challenging on the analysis and correct interpretation of the individual processes of the polarisation resistance, leading to large fitting errors for each distributed element. In this respect, a detailed analysis of the stability of the impedance data against Kramers-Kronig (KK) relations and Bayesian Hilbert transform (BHT) simulations allowed to detect significant deviations from stability. To try to accommodate these concerns, a combination of three different methodologies for the distribution function of relaxation times (DFRT) analysis permitted the identification of the main processes governing the electrode mechanism. Data were also corrected for short-circuiting due to an increase of electronic p-type conductivity from the electrolyte substrate with increasing temperature and decreasing humidity. In a more global conclusion, the current work highlights that the excellent performance of the La4Ni3O10±δ-BaCe0.9Y0.1O3-δ composite cathode can be maintained on reducing water vapour partial pressure to the very low humidity conditions of pH2O ~ 10−5 atm, for operation in nominally dry conditions in the intermediate temperature range (350–600 °C).

Author Contributions

Conceptualization, F.J.A.L. and D.P.F.; methodology, F.J.A.L., D.P.F. and D.R.; formal analysis, F.J.A.L., D.P.F., D.R., V.C.D.G., L.I.V.H. and S.M.M.; investigation, F.J.A.L., D.P.F., D.R., V.C.D.G., L.I.V.H. and S.M.M.; writing—original draft preparation, F.J.A.L., D.R., V.C.D.G., L.I.V.H. and S.M.M.; writing—review and editing, F.J.A.L. and D.P.F.; funding acquisition, F.J.A.L. and D.P.F. All authors have read and agreed to the published version of the manuscript.

Funding

This research was partially funded by FCT (Fundação para a Ciência e a Tecnologia), grants numbers PTDC/CTM-CTM/2156/2020, PTDC/QUI-ELT/3681/2020, POCI-01-0247-FEDER-039926, POCI-01-0145-FEDER-032241, UIDB/00481/2020 and UIDP/00481/2020; and also, by Centro Portugal Regional Operational Programme (Centro2020), under the PORTUGAL 2020 Partnership Agreement, through the European Regional Development Fund (ERDF), grant number CEN-TRO-01-0145-FEDER-022083.

Data Availability Statement

The data supporting this research article are available upon request to the corresponding authors.

Conflicts of Interest

The authors declare no conflict of interest.

References

  1. Loureiro, F.J.A.; Nasani, N.; Reddy, G.S.; Munirathnam, N.R.; Fagg, D.P. A review on sintering technology of proton conducting BaCeO3-BaZrO3 perovskite oxide materials for Protonic Ceramic Fuel Cells. J. Power Sources 2019, 438, 226991. [Google Scholar] [CrossRef]
  2. Antunes, I.; Pérez-Coll, D.; Nasani, N.; Soares, H.S.; Mather, G.C.; Frade, J.R.; Fagg, D.P. Mechanochemical processing of BaZr1−yYyO3−δ (y = 0.15, 0.20) protonic ceramic electrolytes: Phase purity, microstructure, electrical properties and comparison with other preparation routes. Int. J. Hydrogen Energy 2020. [Google Scholar] [CrossRef]
  3. Fabbri, E.; Bi, L.; Pergolesi, D.; Traversa, E. Towards the Next Generation of Solid Oxide Fuel Cells Operating Below 600 °C with Chemically Stable Proton-Conducting Electrolytes. Adv. Mater. 2012, 24, 195–208. [Google Scholar] [CrossRef]
  4. Loureiro, F.J.A.; Macedo, D.A.; Nascimento, R.M.; Cesário, M.R.; Grilo, J.P.F.; Yaremchenko, A.A.; Fagg, D.P. Cathodic polarisation of composite LSCF-SDC IT-SOFC electrode synthesised by one-step microwave self-assisted combustion. J. Eur. Ceram. Soc. 2019, 39, 1846–1853. [Google Scholar] [CrossRef]
  5. Loureiro, F.J.A.; Yang, T.; Stroppa, D.G.; Fagg, D.P. Pr2O2SO4–La0.6Sr0.4Co0.2Fe0.8O3-δ: A new category of composite cathode for intermediate temperature-solid oxide fuel cells. J. Mater. Chem. A 2015, 3, 12636–12641. [Google Scholar] [CrossRef]
  6. Marinha, D.; Dessemond, L.; Djurado, E. Electrochemical investigation of oxygen reduction reaction on La0.6Sr0.4Co0.2Fe0.8O3−δ cathodes deposited by Electrostatic Spray Deposition. J. Power Sources 2012, 197, 80–87. [Google Scholar] [CrossRef]
  7. Loureiro, F.J.A.; Araújo, A.J.M.; Paskocimas, C.A.; Macedo, D.A.; Fagg, D.P. Polarisation mechanism of the misfit Ca-cobaltite electrode for reversible solid oxide cells. Electrochim. Acta 2021, 373, 137928. [Google Scholar] [CrossRef]
  8. Adler, S.B. Mechanism and kinetics of oxygen reduction on porous La1-xSrxCoO3-δ electrodes. Solid State Ion. 1998, 111, 125–134. [Google Scholar] [CrossRef]
  9. Hildenbrand, N.; Nammensma, P.; Blank, D.H.A.; Bouwmeester, H.J.M.; Boukamp, B.A. Influence of configuration and microstructure on performance of La2NiO4+δ intermediate-temperature solid oxide fuel cells cathodes. J. Power Sources 2013, 238, 442–453. [Google Scholar] [CrossRef]
  10. Zapata-Ramírez, V.; Dos Santos-Gómez, L.; Mather, G.C.; Marrero-López, D.; Pérez-Coll, D. Enhanced Intermediate-Temperature Electrochemical Performance of Air Electrodes for Solid Oxide Cells with Spray-Pyrolyzed Active Layers. ACS Appl. Mater. Interfaces 2020, 12, 10571–10578. [Google Scholar] [CrossRef] [PubMed]
  11. Pérez-Coll, D.; Aguadero, A.; Escudero, M.J.; Daza, L. Effect of DC current polarization on the electrochemical behaviour of La2NiO4+δ and La3Ni2O7+δ-based systems. J. Power Sources 2009, 192, 2–13. [Google Scholar] [CrossRef]
  12. Loureiro, F.J.A.; Silva, V.D.; Simões, T.A.; Cesário, M.R.; Grilo, J.P.F.; Fagg, D.P.; Macedo, D.A. Misfit-layered Ca-cobaltite-based cathodes for intermediate-temperature solid oxide fuel cell. In Intermediate Temperature Solid Oxide Fuel Cells: Electrolytes, Electrodes and Interconnects; Elsevier: Amsterdam, The Netherlands, 2019; pp. 347–377. ISBN 9780128174456. [Google Scholar]
  13. Sharma, R.K.; Djurado, E. Functionally graded and homogeneous composites of La2NiO4+δ and Lan+1NinO3n+1 (n = 2 and 3) solid oxide fuel cell cathodes. J. Mater. Chem. A 2017, 5, 22277–22287. [Google Scholar] [CrossRef]
  14. Song, J.; Ning, D.; Boukamp, B.; Bassat, J.-M.; Bouwmeester, H.J.M. Structure, electrical conductivity and oxygen transport properties of Ruddlesden–Popper phases Lnn+1NinO3n+1 (Ln = La, Pr and Nd; n = 1, 2 and 3). J. Mater. Chem. A 2020, 8, 22206–22221. [Google Scholar] [CrossRef]
  15. Woolley, R.J.; Skinner, S.J. Functionally graded composite La2NiO4+δ and La4Ni3O10−δ solid oxide fuel cell cathodes. Solid State Ionics 2014, 255, 1–5. [Google Scholar] [CrossRef]
  16. Amow, G.; Davidson, I.J.; Skinner, S.J. A comparative study of the Ruddlesden-Popper series, Lan+1NinO3n+1 (n=1, 2 and 3), for solid-oxide fuel-cell cathode applications. Solid State Ionics 2006, 177, 1205–1210. [Google Scholar] [CrossRef] [Green Version]
  17. Grimaud, A.; Mauvy, F.; Marc Bassat, J.; Fourcade, S.; Marrony, M.; Claude Grenier, J. Hydration and transport properties of the Pr2−xSrxNiO4+δ compounds as H+-SOFC cathodes. J. Mater. Chem. 2012, 22, 16017–16025. [Google Scholar] [CrossRef]
  18. Grimaud, A.; Mauvy, F.; Bassat, J.M.; Fourcade, S.; Rocheron, L.; Marrony, M.; Grenier, J.C. Hydration Properties and Rate Determining Steps of the Oxygen Reduction Reaction of Perovskite-Related Oxides as H+-SOFC Cathodes. J. Electrochem. Soc. 2012, 159, B683–B694. [Google Scholar] [CrossRef]
  19. Loureiro, F.J.A.; Ramasamy, D.; Mikhalev, S.M.; Shaula, A.L.; Macedo, D.A.; Fagg, D.P. La4Ni3O10±δ-BaCe0.9Y0.1O3-δ cathodes for Proton Ceramic Fuel Cells; short-circuiting analysis using BaCe0.9Y0.1O3-δ symmetric cells. Int. J. Hydrogen Energy 2021, 46, 13594–13605. [Google Scholar] [CrossRef]
  20. Tarutin, A.P.; Lyagaeva, J.G.; Medvedev, D.A.; Bi, L.; Yaremchenko, A.A. Recent advances in layered Ln2NiO4+δ nickelates: Fundamentals and prospects of their applications in protonic ceramic fuel and electrolysis cells. J. Mater. Chem. A 2021, 9, 154–195. [Google Scholar] [CrossRef]
  21. Bannikov, D.O.; Cherepanov, V.A. Thermodynamic properties of complex oxides in the La–Ni–O system. J. Solid State Chem. 2006, 179, 2721–2727. [Google Scholar] [CrossRef]
  22. Santos, J.R.D.; Loureiro, F.J.A.; Grilo, J.P.F.; Silva, V.D.; Simões, T.A.; Fagg, D.P.; Macedo, D.A. Understanding the cathodic polarisation behaviour of the misfit [Ca2CoO3-δ]q[CoO2] (C349) as oxygen electrode for IT-SOFC. Electrochim. Acta 2018, 285, 214–220. [Google Scholar] [CrossRef]
  23. Loureiro, F.J.A.; Pérez-Coll, D.; Graça, V.C.D.; Mikhalev, S.M.; Ribeiro, A.F.G.; Mendes, A.; Fagg, D.P. Proton conductivity in yttrium-doped barium cerate in nominally dry reducing conditions for application in chemical synthesis. J. Mater. Chem. A 2019, 7, 18135–18142. [Google Scholar] [CrossRef]
  24. Loureiro, F.J.A.; Ramasamy, D.; Ribeiro, A.F.G.; Mendes, A.; Fagg, D.P. Underscoring the transport properties of yttrium-doped barium cerate in nominally dry oxidising conditions. Electrochim. Acta 2020, 334. [Google Scholar] [CrossRef]
  25. Loureiro, F.J.A.; Souza, G.S.; Graça, V.C.D.; Araújo, A.J.M.; Grilo, J.P.F.; Macedo, D.A.; Fagg, D.P. Nickel-copper based anodes for solid oxide fuel cells running on hydrogen and biogas: Study using ceria-based electrolytes with electronic short-circuiting correction. J. Power Sources 2019, 438. [Google Scholar] [CrossRef]
  26. Miyashita, T. Necessity of verification of leakage currents using Sm doped Ceria electrolytes in SOFCs. J. Mater. Sci. 2006, 41, 3183–3184. [Google Scholar] [CrossRef]
  27. Liu, M.; Hu, H. Effect of Interfacial Resistance on Determination of Transport Properties of Mixed-Conducting Electrolytes. J. Electrochem. Soc. 1996, 143, L109–L112. [Google Scholar] [CrossRef]
  28. Poetzsch, D.; Merkle, R.; Maier, J. Investigation of oxygen exchange kinetics in proton-conducting ceramic fuel cells: Effect of electronic leakage current using symmetric cells. J. Power Sources 2013, 242, 784–789. [Google Scholar] [CrossRef]
  29. Boukamp, B.A.; Rolle, A.; Vannier, R.N.; Sharma, R.K.; Djurado, E. Electrostatic spray deposited Ca3Co4O9+δ and Ca3Co4O9+δ/Ce0.9Gd0.1O1.95 cathodes for SOFC: A comparative impedance analysis study. Electrochim. Acta 2020, 362, 137142. [Google Scholar] [CrossRef]
  30. Osinkin, D.A.; Kolchugin, A.A.; Bogdanovich, N.M.; Beresnev, S.M. Performance and redox stability of a double–layer Sr2Fe1.5Mo0.5O6-δ-based electrode for solid state electrochemical application. Electrochim. Acta 2020, 361, 137058. [Google Scholar] [CrossRef]
  31. Pikalova, E.; Kolchugin, A.; Koroleva, M.; Vdovin, G.; Farlenkov, A.; Medvedev, D. Functionality of an oxygen Ca3Co4O9+δ electrode for reversible solid oxide electrochemical cells based on proton-conducting electrolytes. J. Power Sources 2019, 438, 226996. [Google Scholar] [CrossRef]
  32. Liu, J.; Wan, T.H.; Ciucci, F. A Bayesian view on the Hilbert transform and the Kramers-Kronig transform of electrochemical impedance data: Probabilistic estimates and quality scores. Electrochim. Acta 2020, 357, 136864. [Google Scholar] [CrossRef]
  33. Boukamp, B.A. A Linear Kronig-Kramers Transform Test for Immittance Data Validation. J. Electrochem. Soc. 1995, 142, 1885. [Google Scholar] [CrossRef]
  34. Melo, B.M.G.; Loureiro, F.J.A.; Fagg, D.P.; Costa, L.C.; Graça, M.P.F. DFRTtoEIS: An easy approach to verify the consistency of a DFRT generated from an impedance spectrum. Electrochim. Acta 2021, 366, 137429. [Google Scholar] [CrossRef]
  35. DFRTtoEIS. Available online: https://github.com/bmgmelo/DFRTtoEIS (accessed on 31 January 2021).
  36. DRTtool Toolbox. Available online: https://sites.google.com/site/drttools (accessed on 31 January 2021).
  37. Quarez, E.; Oumellal, Y.; Joubert, O. Optimization of the Lanthanum Tungstate/Pr2NiO4 Half Cell for Application in Proton Conducting Solid Oxide Fuel Cells. Fuel Cells 2013, 13, 34–41. [Google Scholar] [CrossRef]
  38. Solís, C.; Navarrete, L.; Serra, J.M. Study of Pr and Pr and Co doped La2NiO4+δ as cathodes for La5.5WO11.25−δ based protonic conducting fuel cells. J. Power Sources 2013, 240, 691–697. [Google Scholar] [CrossRef] [Green Version]
  39. Lyagaeva, J.; Medvedev, D.; Pikalova, E.; Plaksin, S.; Brouzgou, A.; Demin, A.; Tsiakaras, P. A detailed analysis of thermal and chemical compatibility of cathode materials suitable for BaCe0.8Y0.2O3−δ and BaZr0.8Y0.2O3−δ proton electrolytes for solid oxide fuel cell application. Int. J. Hydrogen Energy 2017, 42, 1715–1723. [Google Scholar] [CrossRef]
  40. Dailly, J.; Fourcade, S.; Largeteau, A.; Mauvy, F.; Grenier, J.C.; Marrony, M. Perovskite and A2MO4-type oxides as new cathode materials for protonic solid oxide fuel cells. Electrochim. Acta 2010, 55, 5847–5853. [Google Scholar] [CrossRef]
  41. Ricote, S.; Bonanos, N.; Lenrick, F.; Wallenberg, R. LaCoO3: Promising cathode material for protonic ceramic fuel cells based on a BaCe0.2Zr0.7Y0.1O3−δ electrolyte. J. Power Sources 2012, 218, 313–319. [Google Scholar] [CrossRef]
  42. Fulgêncio, E.B.G.A.; Loureiro, F.J.A.; Melo, K.P.V.; Silva, R.M.; Fagg, D.P.; Campos, L.F.A.; Macedo, D.A. Boosting the oxygen reduction reaction of the misfit [Ca2CoO3-δ]q[CoO2] (C349) by the addition of praseodymium oxide. J. Alloys Compd. 2019, 788, 148–154. [Google Scholar] [CrossRef]
  43. Nielsen, J.; Jacobsen, T.; Wandel, M. Impedance of porous IT-SOFC LSCF:CGO composite cathodes. Electrochim. Acta 2011, 56, 7963–7974. [Google Scholar] [CrossRef]
  44. Boukamp, B.A.; Rolle, A. Analysis and Application of Distribution of Relaxation Times in Solid State Ionics. Solid State Ionics 2017, 302, 12–18. [Google Scholar] [CrossRef]
  45. Boukamp, B.A.; Rolle, A. Use of a distribution function of relaxation times (DFRT) in impedance analysis of SOFC electrodes. Solid State Ionics 2018, 314, 103–111. [Google Scholar] [CrossRef]
  46. Ciucci, F.; Chen, C. Analysis of Electrochemical Impedance Spectroscopy Data Using the Distribution of Relaxation Times: A Bayesian and Hierarchical Bayesian Approach. Electrochim. Acta 2015, 167, 439–454. [Google Scholar] [CrossRef]
  47. Effat, M.B.; Ciucci, F. Bayesian and Hierarchical Bayesian Based Regularization for Deconvolving the Distribution of Relaxation Times from Electrochemical Impedance Spectroscopy Data. Electrochim. Acta 2017, 247, 1117–1129. [Google Scholar] [CrossRef]
Figure 1. Stability limits calculated for the La4Ni3O10±δ (LNO) phase as a function of temperature, calculated from data from [21]. The typical pO2 values of O2 and N2 atmospheres are indicated as a reference.
Applsci 11 03407 g001
Figure 2. SEM analysis of the (a) top-view and (b) fracture cross-section of the LNO+BCY10 composite cathode.
Applsci 11 03407 g002
Figure 3. Impedance dispersions obtained under (a) wet (pH2O ~ 10−2 atm) and (b) low humidity (pH2O ~ 10−5 atm) conditions at 450 °C in O2 atmosphere (numbers indicate the decades of the measuring frequencies). Equivalent circuit models (EQMs) used to fit the dispersions in (c) wet and (d) low humidity conditions.
Applsci 11 03407 g003
Figure 4. Residual plots obtained for the Kramers-Kronig (KK) relations from the electrochemical impedance spectroscopy (EIS) dispersion at 450 °C in both wet (pH2O ~ 10−2 atm) and low humidity (pH2O ~ 10−5 atm) O2 atmosphere.
Applsci 11 03407 g004
Figure 5. Residuals of the Bayesian Hilbert transform (BHT) data: Wet conditions (a) real and (b) imaginary; low humidity conditions (c) real and (d) imaginary.
Applsci 11 03407 g005
Figure 6. Distribution function of relaxation times (DFRTs) obtained from an EQM of a linear combination of (R||Q) and (G) elements and using the Bayesian regularisation of the EIS data obtained in (a) wet (pH2O ~ 10−2 atm) and (b) low humidity (pH2O ~ 10−5 atm) conditions at 450 °C in O2 atmosphere (the 99% credibility interval is presented in the shadow area around the Bayesian curves). An alternative approach to obtain a DFRT based on an EQM with a linear series of (R||Q)-circuits, designated as multi-fit procedure (m(RQ)fit), is depicted in (c,d) for, respectively, wet and low humidity atmospheres.
Applsci 11 03407 g006
Figure 7. DFRTs obtained from the Bayesian regularisation of the EIS data obtained in low humidity (pH2O ~ 10−5 atm) conditions at 450 °C in O2 atmosphere (the 99% credibility interval is presented in the shadow area around the Bayesian curves) for different regularisation parameters: (a) λ = 10−3, (b) λ = 10−2, (c) λ = 0.1 (FWHM is the full width at half maximum). The reconstructed impedances are plotted together with the original EIS data in (d), and the respective residuals in (e).
Applsci 11 03407 g007
Figure 8. Electronic transport number for hole conduction of the BCY10 electrolyte as a function of water vapour partial pressure (pH2O) in O2 atmosphere, calculated from data from [24].
Applsci 11 03407 g008
Figure 9. Temperature dependence of the polarisation resistances with and without the electronic pathway correction for: (a) Wet (pH2O ~ 10−2 atm) and (b) low humidity (pH2O ~ 10−5 atm) conditions at 450 °C in O2 atmosphere.
Applsci 11 03407 g009
Table 1. Fitting results using the equivalent circuit model (EQM) model (error % inside parenthesis) to the data obtained at 450 °C in O2 atmosphere.
Circuit ElementWetLow Humidity
L/H5.13 × 10−7 (2.33%)3.69 × 10⁻⁷ (2.41%)
R12.28 (1.16%)13.25 (1.86%)
Rhigh4.79 (6.45%)2.40 (23.23%)
Qhigh/S sφ2.08 × 10⁻² (11.90%)8.30 × 10⁻² (21.76%)
ϕ high0.25 (7.06%)0.16 (21.88%)
Y0/S s−1/28.15 × 10−2 (1.36%)0.99 (93.56%)
KG/s−11.78 (1.38%)0.74 (73.81%)
Rlow-2.99 (73.81%)
Qlow/S sφ-1.49 (125.73%)
ϕ low-0.76 (47.52%)
Table 2. Scores (%) obtained for the Bayesian Hilbert transform experiments.
MetricScore/%
WetLow Humidity
S k σ , re 76.1976.19
S k σ , im 100.00100.00
S μ , re 99.5898.39
S μ , im 99.5486.05
Table 3. Calculated values for the activation energy obtained in both wet and low humidity conditions.
pH2O/atmActivation Energy/eV
Wet10−2RhighRGRlowRp
1.261.24-1.24
Rhigh,eonRG,eonRlow,eonRp,eon
1.121.09-1.09
Low humidity10−7RhighRGRlowRp
0.971.631.661.28
Rhigh,eonRG,eonRlow,eonRp,eon
0.691.401.401.11
Publisher’s Note: MDPI stays neutral with regard to jurisdictional claims in published maps and institutional affiliations.

