Article

Parametric Stability Analysis of Groin Vaults

Block Research Group, Institute of Technology in Architecture, ETH Zürich, Stefano-Franscini-Platz 1, HIB E 45 8093 Zürich, Switzerland
*
Author to whom correspondence should be addressed.
Appl. Sci. 2021, 11(8), 3560; https://doi.org/10.3390/app11083560
Submission received: 21 March 2021 / Revised: 10 April 2021 / Accepted: 12 April 2021 / Published: 15 April 2021
(This article belongs to the Special Issue Theory and Modelling of Historic Masonry Architecture)

Abstract

:
This paper presents a parametric stability study of groin, or cross vaults, a structural element widely used in old masonry construction, particularly in Gothic architecture. The vaults’ stability is measured using the geometric safety factor (GSF), computed by evaluating the structure’s minimum thickness through a thrust network analysis (TNA). This minimum thickness is obtained by formulating and solving a specific constrained nonlinear optimisation problem. The constraints of this optimisation enforce the limit analysis’s admissibility criteria, and the equilibrium is calculated using independent force densities on a fixed horizontal projection of the thrust network. The parametric description of the vault’s geometry is defined with respect to the radius of curvature of the vault and its springing angle. This detailed parametric study allows identifying optimal parameters which improve the vaults’ stability, and a comprehensive comparison of these results was performed with known results available for two-dimensional pointed arches. Moreover, an investigation of different force flows represented by different form diagrams was performed, providing a better understanding of the vaults’ structural behaviour, and possible collapse mechanisms were studied by observing the points where the thrust network touches the structural envelope in the limit states. Beyond evaluating the GSF, the groin vault’s stability domain was described to give additional insights into the structural robustness. Finally, this paper shows how advances in equilibrium methods can be useful to understand and assess masonry groin vaults.

1. Introduction

The statics of masonry groin vaults has been subject to multiple historic and recent research streams [1,2]. Groin, or cross vaults, first appeared during the Roman empire as a roofing strategy and reappeared after the 10th century in Europe, when the building techniques evolved, culminating in very slender and elegant vaults built during the Gothic period [2,3]. They represent an evolution from barrel vaults, allowing for wide window openings in the side walls [4]. The groin vault is defined as the intersection of two barrel vaults. From a structural perspective, this intersection engages a three dimensional structural behaviour, which allows for an efficient (compressive) transfer of the loads to the buttresses and walls. In a typical nave system, the vertical load from groin vaults goes down to the pillars and the (horizontal) thrust is recovered by buttresses on the corners.
Masonry vaults have been analysed with limit analysis on many occasions [5,6,7]. In fact, limit analysis can be applied to masonry structures given that the three Heyman assumptions are verified [8]. These assumptions consider that the material has infinite compression strength, that no sliding occurs, and that the tensile strength of the material is neglected. From the safe theorem of limit analysis, a structure is safe if an internal, admissible stress state in equilibrium with the external loads can be found. As a consequence of Heyman assumptions, admissible stress states will correspond to compression-only stress states contained within the envelope of the structure.
The search for admissible stress states in masonry structures has motivated several researchers to model internal forces in masonry structures as thrust lines (e.g., [9,10,11,12,13,14]), or as thrust surfaces (e.g., [15,16,17,18]) or thrust networks (e.g., [19,20,21]) to account for the full 3D mechanical responses of masonry vaults.
This work focuses on the last method, modelling the internal force equilibrium as compressive thrust networks, contained within the vault’s envelope, defined by its intrados and extrados. With such a method, a connected network is considered, in which the compressive forces are lumped along the edges, and the loads are applied to the vertices of the network.
Recent work has framed the search for thrust networks in different optimisation processes [21,22,23,24]. In [25] the main objective was to calculate the geometric safety factor (GSF) values of vaults by directly computing their minimum thicknesses. The GSF is defined as the ratio between the actual thickness of the structure and its limit thickness. The limit, or minimum thickness, is defined as the smallest thickness, as an offset of the initial geometry, for which the structure is still stable; i.e., an admissible stress state can still be found [8]. By calculating the GSF, one can quantify the level of stability of a given masonry structure [5].
Many contributions are available in the literature that deal with the problem of determining the minimum thicknesses of arches, which yields the well-known Couplet problem [14,26]. In [27,28,29], pointed arches were considered, and in [30], the Couplet problem was solved for parametric pointed arches, where the author found that for specific radius-over-length values, the thickness of the arch attains a global minimum when a 7-hinge mechanism in the arch is encountered.
Although the solution of the Couplet problem is well-known for arches, its extension to 3D geometries and particularly for pointed groin vaults remains open in the literature. The extensive literature review on the analysis of groin vaults has shown that the problem in 3D is intricate, since multiple force flows are possible due to the high indeterminacy of the problem [21]. In [31], the minimum thrust of rounded groin vaults was calculated using the kinematic theorem of limit analysis. In [32], a funicular model was used to explore different stress states on cross vaults. In [33], discrete-element modelling (DEM) was used to compute the collapse state of masonry vaults subjected to self weight, and support displacement. Additionally, several works discussed the role of ribs in cross vaults [34,35].
Given the lack of literature about the minimum thickness problem in groin vaults, this paper aims to fill this gap using the thrust network analysis (TNA)-based optimisation framework described in [25]. A parametric investigation is developed describing the vault’s geometry with respect to different radius-over-length ratios and springing angles. This approach allows investigating which the relevant geometric parameters are that influence the stability of groin vaults. Moreover, special attention is paid to connecting the outcome of the proposed research to the 2D parametric analyses available in the literature, particularly [30].
The GSF evaluation is not sufficient by itself to fulfil all requirements for a proper structural assessment [2]. Therefore, to give additional information about the robustness of the structure, in the present paper stability domains are also defined. This domain measures the size of the space of admissible stress states by computing the vault’s minimum and maximum thrusts and observing how these evolve towards the limit state. The stability domain is computed for some relevant specific geometries, extracted from the proposed parametric study.
The implementation of this paper considers the flow of forces, i.e., the topology, and geometry of the thrust network, fixed in its horizontal projection, as in [21]. The equilibrium is computed by making use of independent force densities [36]. Minimum thickness, and minimum and maximum thrusts, are computed by solving appropriate constrained nonlinear optimisation problems. Nonetheless, as an additional parameter of the proposed investigation, different flows of forces (i.e., form diagrams) are considered and compared, giving important insights into the mechanical behaviour of the structures analysed.
The structure of the paper is as follows: a parametric description of the vaults is presented in Section 2; the numerical optimisation problem needed to find the minimum thickness is illustrated in Section 3; the assumptions of the force flow are described in Section 4, where three different topologies are considered; Section 5 presents the results of minimum thickness of the parametric groin vaults obtained; Section 6 presents a stability-domain analysis of selected vaults from the parametric analysis; and finally, Section 7 reports the conclusions.

2. Geometric Description of Groin Vaults

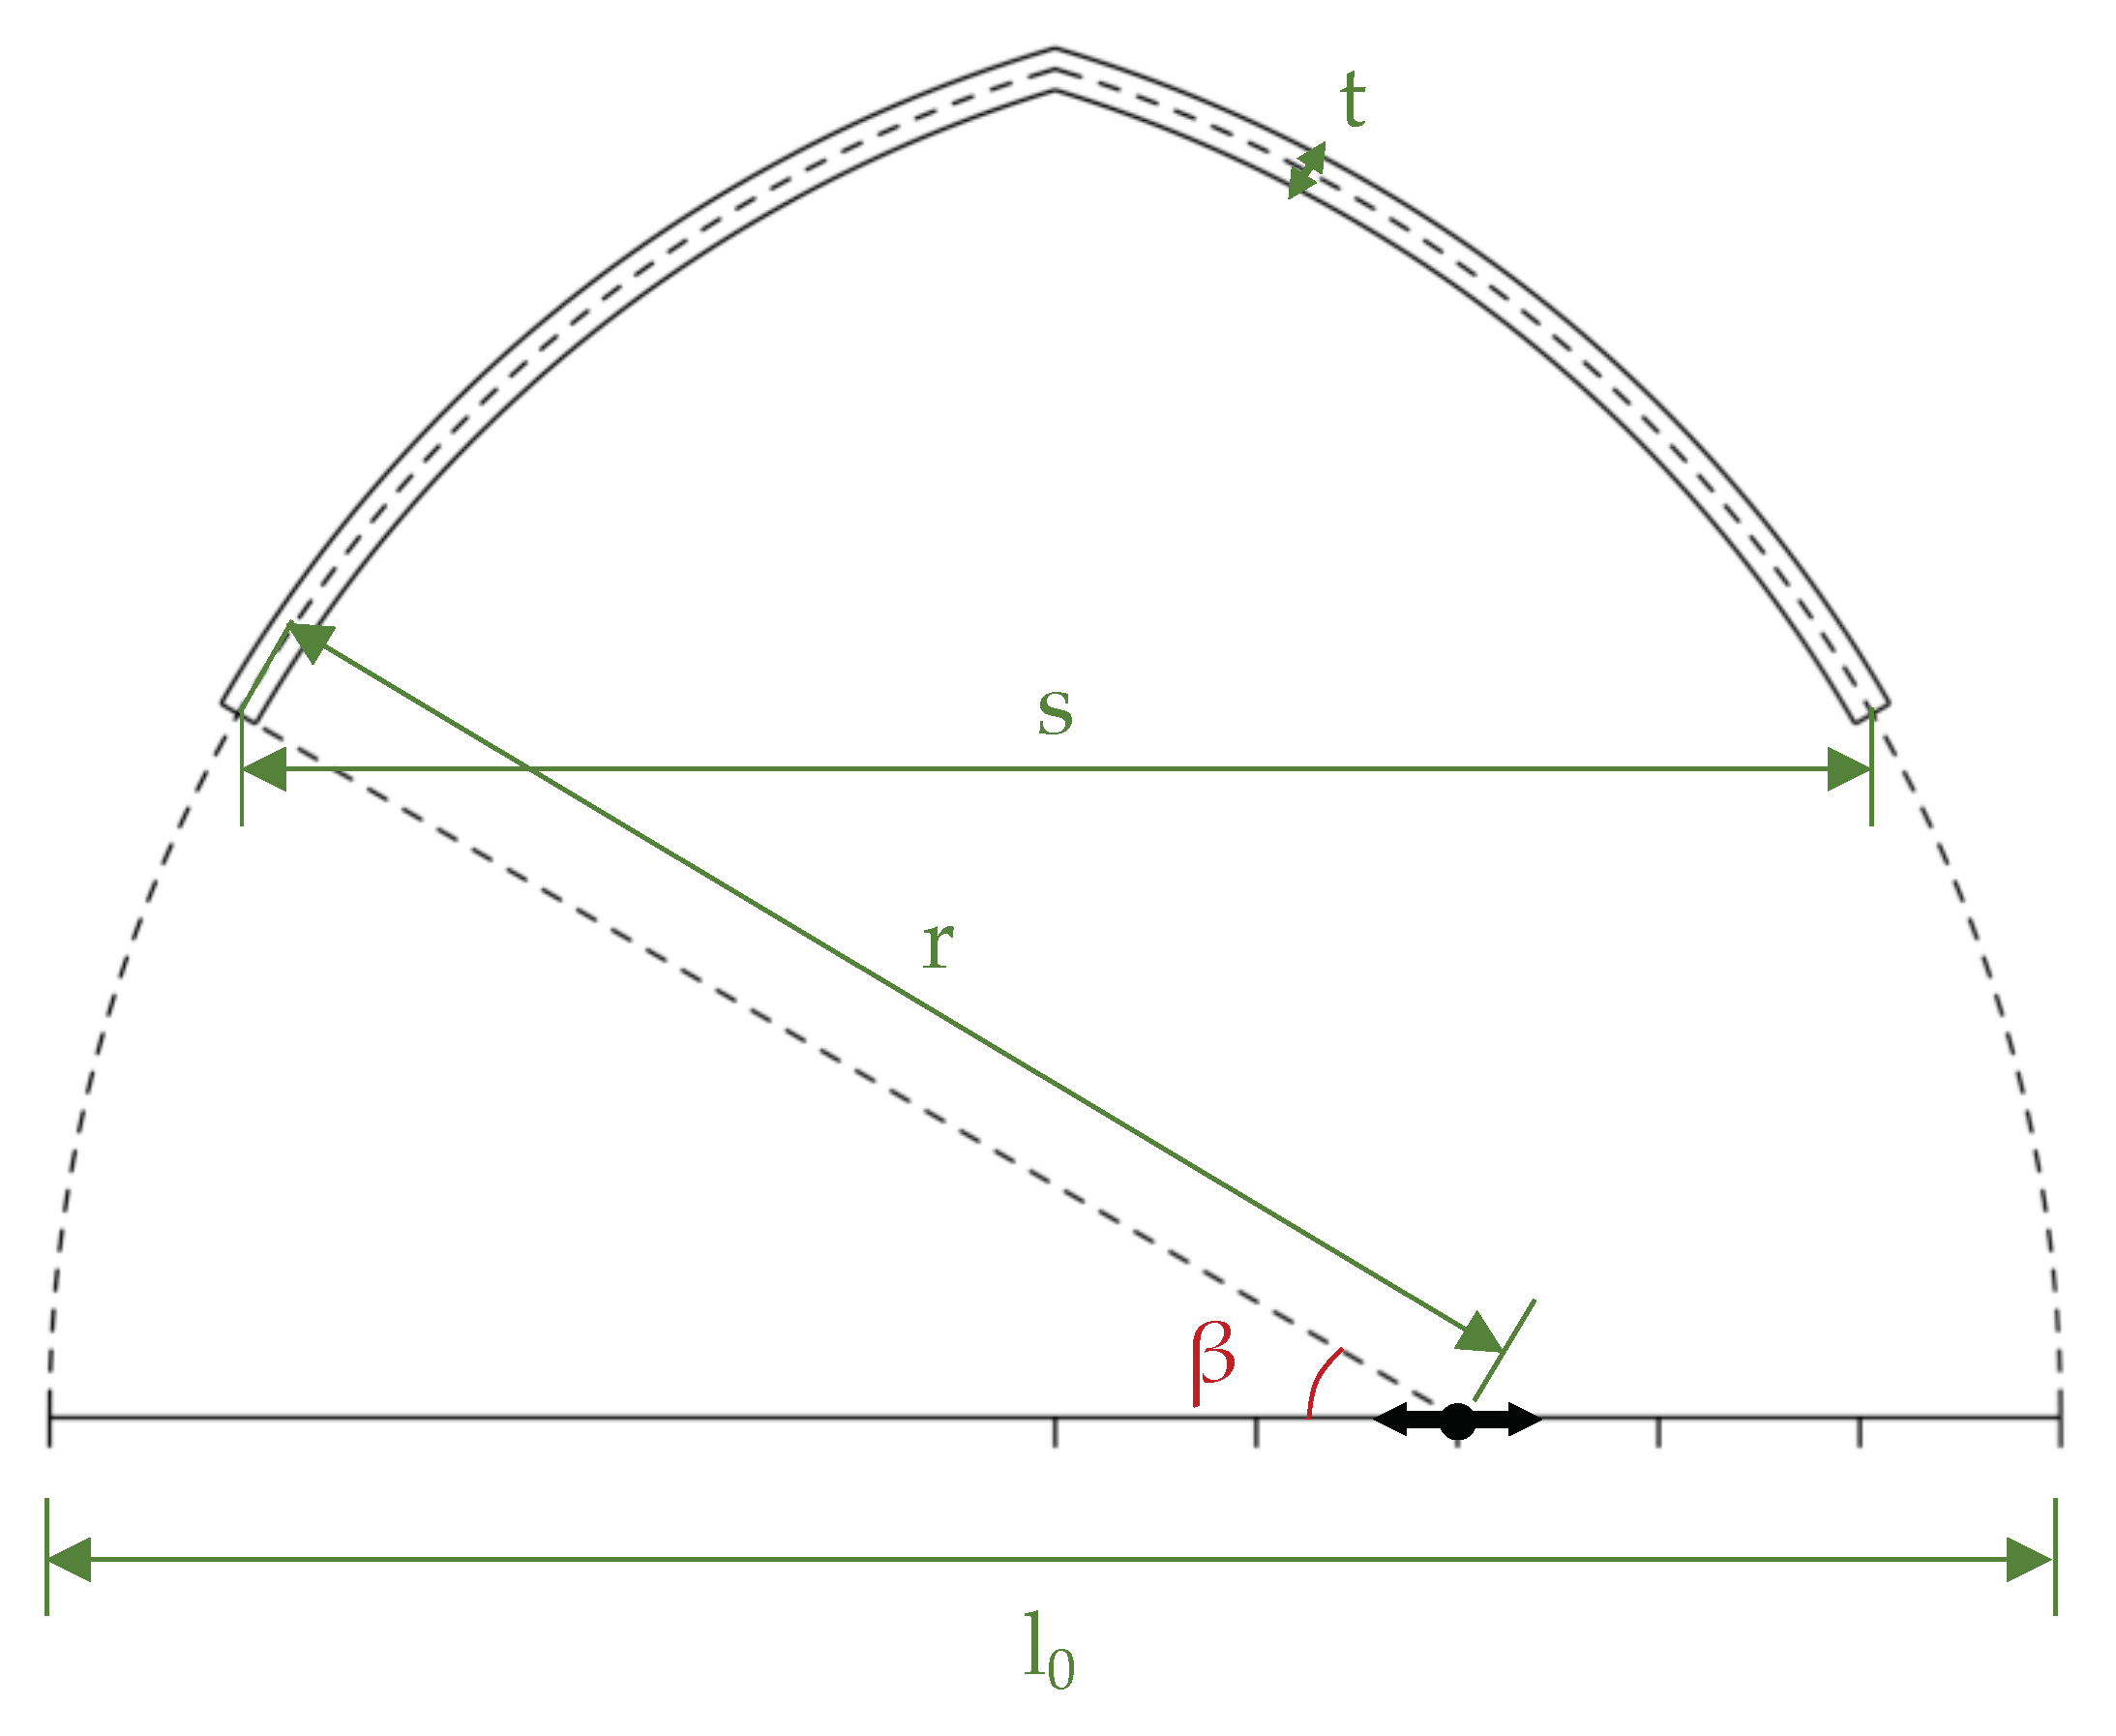
The groin vaults are considered to have a square footprint. Their three dimensional geometry is obtained by the extrusion in two orthogonal directions of the parametric cross-section defined in Figure 1. This cross-section is defined by four parameters: its base length l 0 , the radius r, the springing angle β , and the thickness t (Figure 1).
For convenience of the parametric analysis the following geometrical parameters and their ranges are defined:
  • The radius over length ( r / l 0 ) defines the “pointiness” of the vault. This parameter varies from 0.5 to 1.5, in steps of 0.05. When r / l 0 = 0.5, a rounded cross vault is achieved, and the section becomes a semicircular arch.
  • The springing angle ( β ) denotes the inclination at the impost line. This parameter varies from 0° to 40°, and is considered in steps of 10°; when β = 0 ° , the effective span (s) of the structure is equal to the base length s / l 0 = 1 , and if β > 0 ° the effective span is smaller (i.e., s / l 0 < 1 ) according to Equation (1).
  • The adimensional thickness over span ( t / s ) is used to properly compare and describe the vaults’ thicknesses with different springing angles. The thickness is applied through a homotetical translation in the normal direction of the middle surface defined by the aforementioned parameters, as in Figure 1.
All the results are provided with different “pointiness” values described by r / l 0 , and the minimum thickness are reported in terms of the thickness over span t / s . The relationship among s and l 0 can be described by the following equation:
s l 0 = 2 r l 0 ( cos ( β ) 1 ) + 1 2 ,
The parameters adopted in the proposed analysis, particularly referring to the springing angle β , allow straightforward modelling of the typical fill near the supports of groin vaults. Indeed, once the fill has gone through compacting, it is sufficient for the vault’s stability that the thrust lies within the reduced geometry defined by a given springing angle β , as in [1,27,37].
Figure 2 depicts the three-dimensional geometries obtained for the ranges r / l 0 = [ 0.5 1.0 ] and β = [ 0 ° 40 ° ] , considering increments of 0.05 and 10°, respectively.

3. Computation of Minimum Thickness

The numerical formulation to compute the spatial configuration of thrust networks is based on the equilibrium with independent force densities proposed in [21].
The horizontal projection of the considered networks is kept fixed and this projection is called form diagram [20]. With such a formulation, the spatial equilibrium of the networks can be computed in terms of two sets of parameters: the independent force densities ( q ind ) and the heights of the supports ( z b ). From the vertical equilibrium, the height of any internal node of the network z i can be calculated as:
z i = ( C i T Q C i ) 1 ( p z ( C i T Q C b ) z b ) ,
where C represents the connectivity matrix of the network, defined after [38]. C i and C b are slices of the connectivity matrix corresponding to the internal and boundary/restrained nodes, respectively. The vector p z collects the self weight lumped to the internal nodes of the network (i.e., using the tributary area of each vertex with respect to the middle surface, as illustrated in Section 4). Q = diag( q ), where the vector of force densities q accounts for both dependent ( q dep ) and independent ( q ind ) force densities which are linked by the following horizontal equilibrium equation:
q dep = E dep 1 E ind q ind ,
where E is the equilibrium matrix computed as in [21], and E dep and E ind are slices of the equilibrium matrix considering the dependent and independent force densities, respectively. This mathematical formulation is general; i.e., it is not limited to any specific geometry or support condition, and could be used to model different three-dimensional systems, modelled with different form diagrams. More details about this numerical formulation and the selection of independent edges can be found in [25].
From this numerical formulation, the minimum thickness is calculated as a constrained nonlinear optimisation problem (NLP) considering the analytical description of the vault’s upper and lower bounds, i.e., extrados and intrados. The optimisation problem is described below:
minimise q ind , z b , t t ,
subject to q dep 0 ,
z i LB ( t ) z i ( q ind , z b ) z i UB ( t ) , for i = 1 , 2 , n ,
t 0 .
The linear objective function (4a) considers the structural thickness t only. Constraints (4b) represent the compression-only requirement from Heyman’s assumptions. Constraints (4c) enforce the network to be contained within the bounds of the structure, calculated for the thickness t. Constraint (4d) expresses that the thickness must be positive. The gradients and Jacobian matrix of the problem are computed analytically. For an exhaustive discussion about this NLP formulation, the reader is referred to [25].
To solve this NLP, a combination of two solvers was applied, combining a sequential least squares programming (SLSQP) solver [39], and an interior-point optimisation (IPOPT) solver [40]. Both are suitable to solve constrained NLP, the latter being a more robust solver, which is used to polish the results, and to deal with the problems with larger numbers of variables (e.g., more than 100 variables). The objective function (4a) can be accordingly modified in order to minimise, or maximise the (horizontal) thrust of the structure, once the thickness has been fixed. In particular, a sequence of NLPs is solved for different values of structural thickness in order to construct the stability domains of the vault (Section 6).

4. Assumptions on the Force Flow

As stated in Section 3, form diagrams are kept fixed throughout the optimisation algorithm. As their topology and geometry influence the results, they must be chosen carefully to represent the intended force-flow in the system, and be compatible with the observed boundary conditions and with the presence of eventual existing cracks.
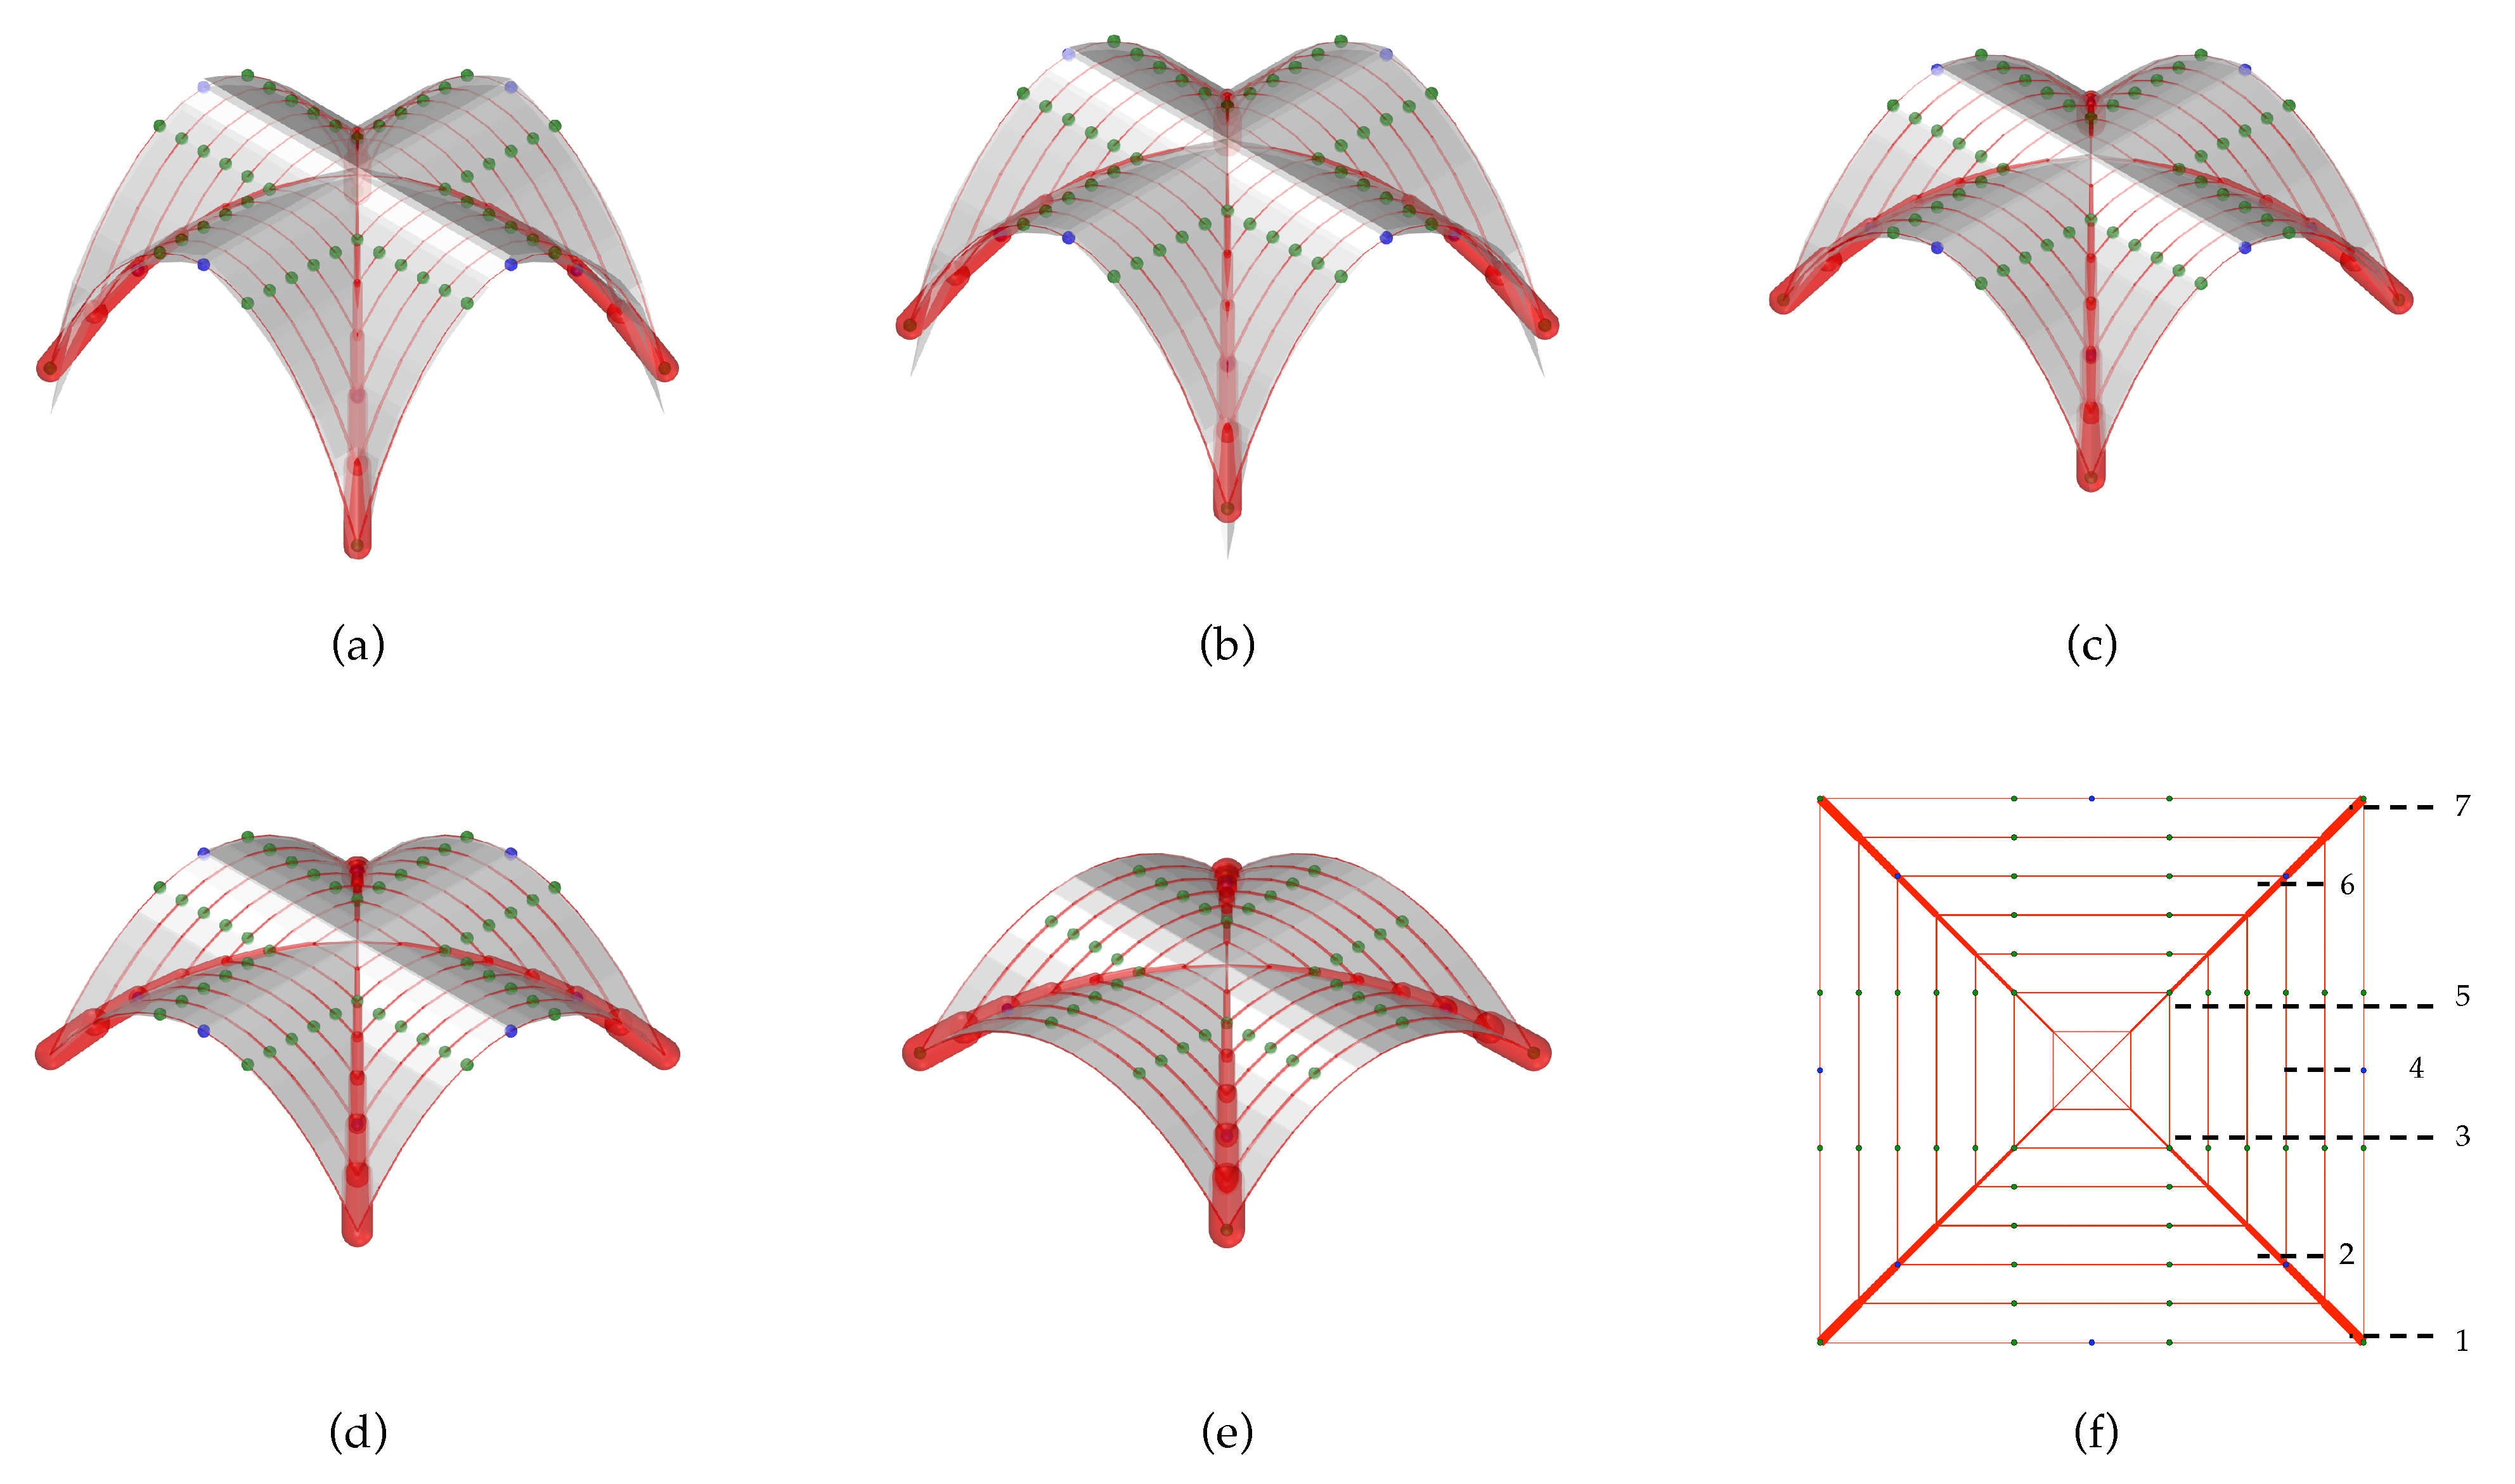
In this work, three different form diagrams are adopted (Figure 3). For each pattern, the four corners of the diagram are defined as restrained nodes (red dots in Figure 3). Therefore, it is assumed that no lateral thrust is transmitted through the unsupported boundary edges.
The fan-like diagram in Figure 3a is composed of 784 edges. This topology links the ridges of the structure directly to the supports; as a result, this topology represents a series of inclined arches spanning from two of the corner supports. This pattern has 30 independent edges, which are taken as parameters in the optimisation problem (Equation (4)), and represent the degrees of freedom associated with the diagram.
The orthogonal diagram in Figure 3b has 448 edges. In this arrangement, arches parallel to the boundary edges carry the loads to the diagonals, which redirect those thrusts and channel them to the four restrained supports. This pattern has 12 independent edges.
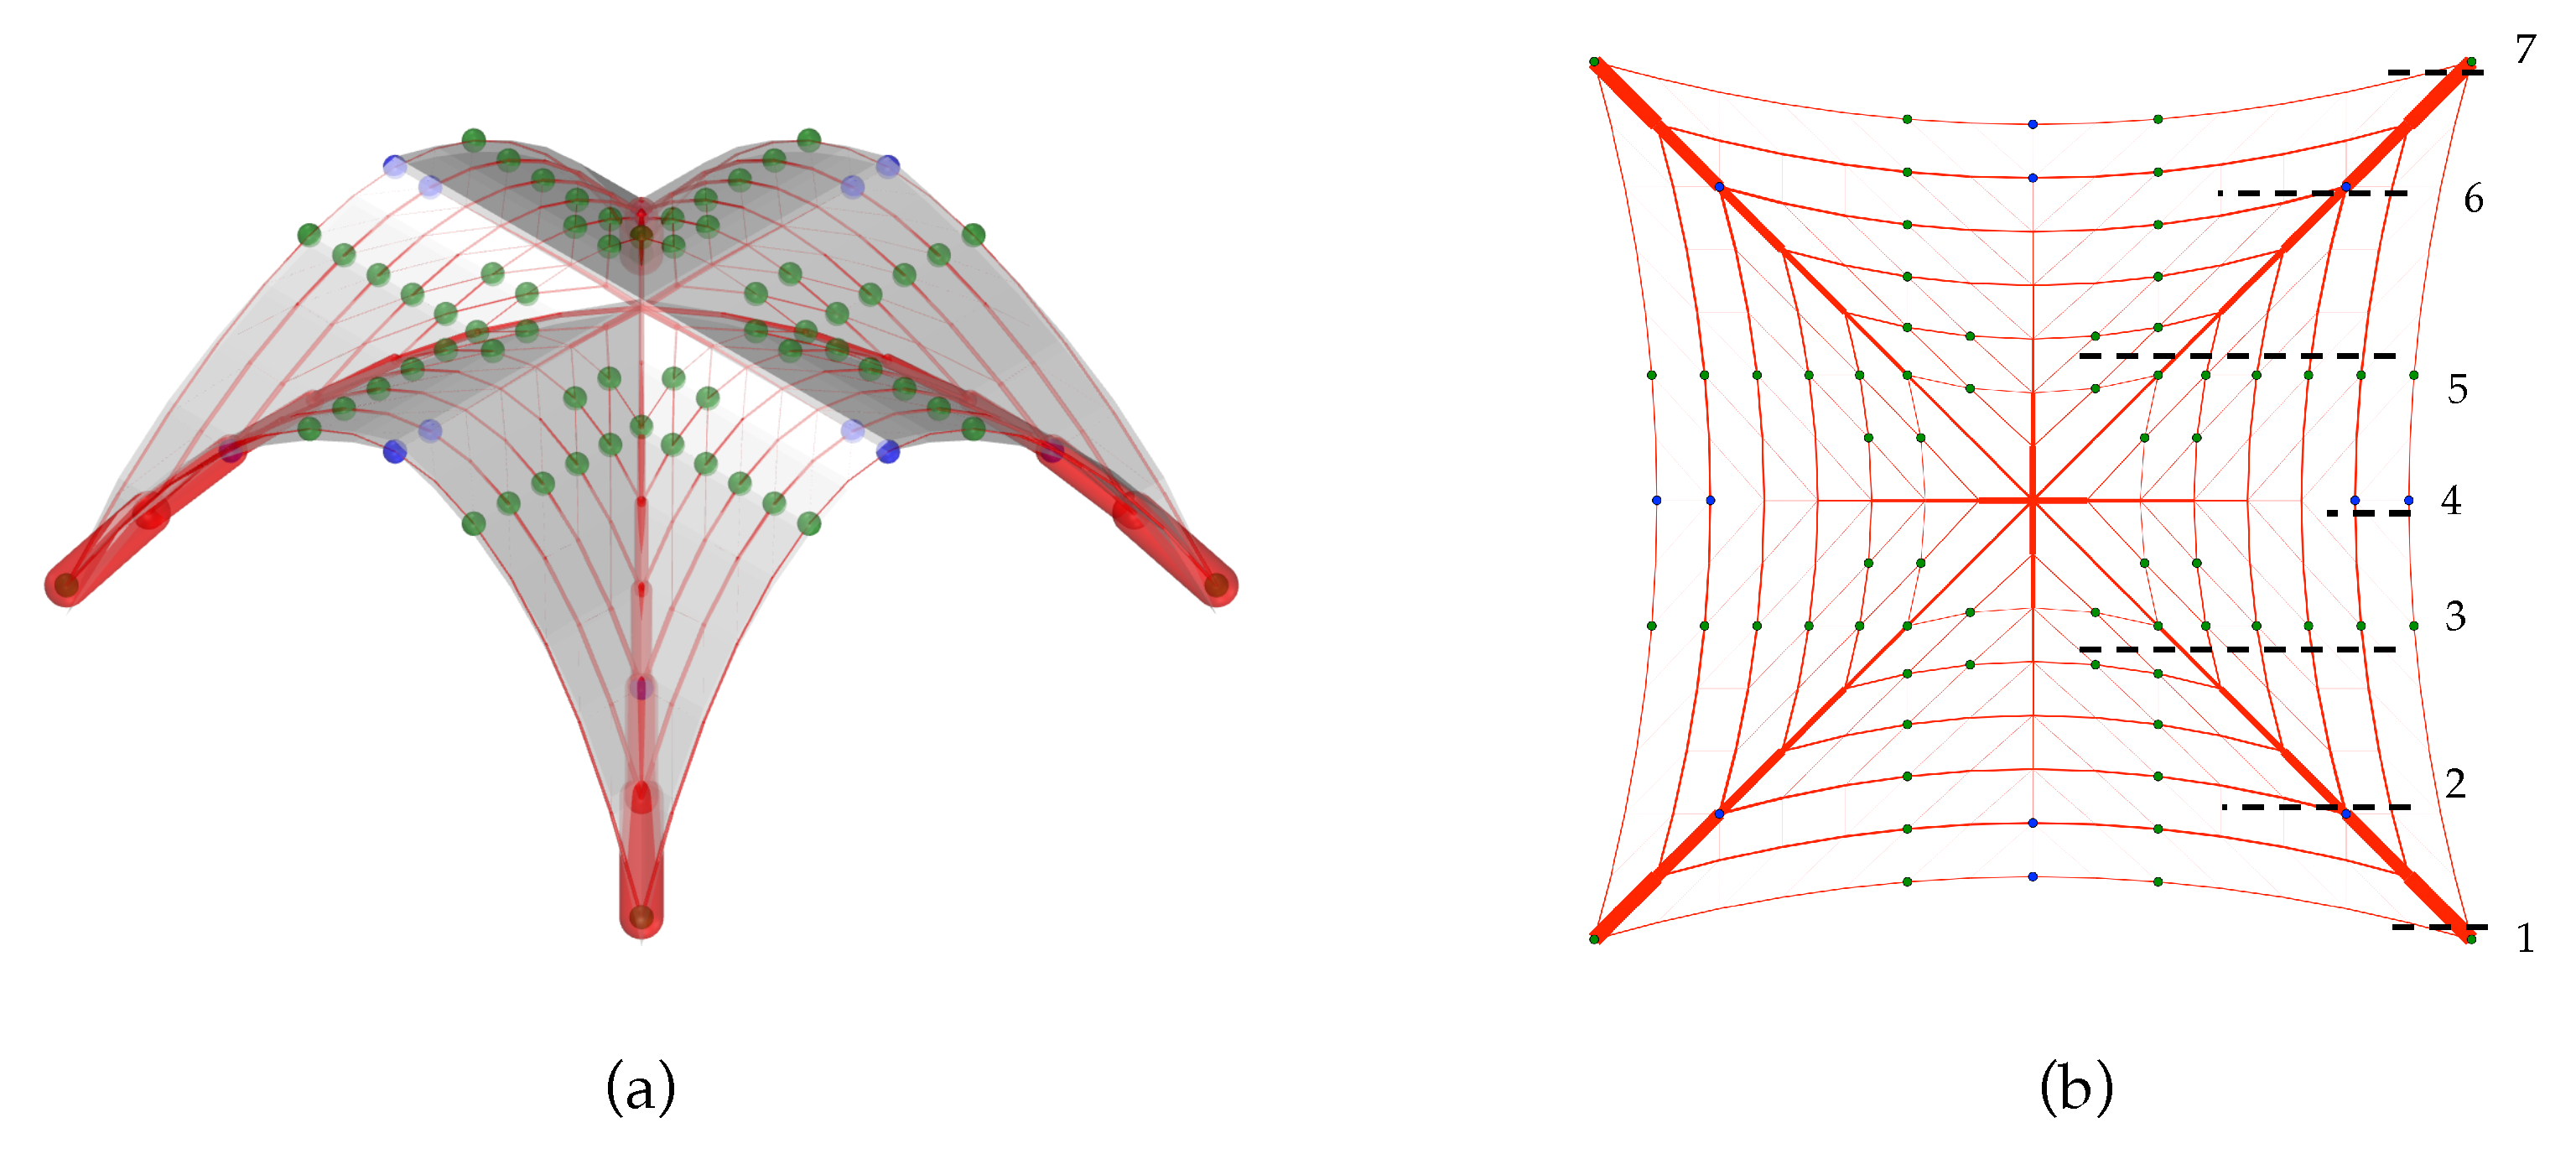
The triangulated curved diagram in Figure 3c has 616 edges. This diagram is obtained by curving the straight arches from the orthogonal diagram, and by adding diagonals oriented towards the supports to its quadrilateral faces. This pattern combines the connection to the main diagonals, available in the orthogonal diagram, with the existence of shortest paths to the supports, as in the fan-like diagram, due to the added modular diagonals. This pattern has 147 degrees of freedom, which considerably increases the number of variables in the optimisation.
A sensitivity study on the density of meshes has been previously executed in [25] for different levels of discretisation. This level of discretisation refers to the modular divisions of the floor plan applied to the patterns. In the diagrams of Figure 3, 14 modules are considered, a value for which convergence on the values of minimum thickness was observed in [25].
After a diagram is chosen, the self weight is applied by computing the tributary area of each vertex onto the middle surface. Different form diagrams will pick up the load in different manners within the middle surface of the vault. Figure 4 shows how the self weight is distributed to the nodes for the three diagrams considering r / l 0 = 0.5 , and β = 0 ° . For the third pattern, the addition of the diagonals does not influence the tributary load, which is computed based on an equivalent pattern without the presence of the diagonals.

5. Minimum Thickness of Parametric Groin Vaults

The results of the parametric study on the minimum thickness of groin vaults are presented, and discussed in this section, considering the three form diagrams in Figure 3. In Section 5.1 and Section 5.2, the fan-like and orthogonal diagram are analysed considering all the values of springing angles ( β ). In Section 5.3, the curved diagram is analysed for the specific case of β = 20 ° . For each section, after presenting the results of the parametric study, a comparison with the results of two-dimensional analyses is proposed.

5.1. Minimum Thickness of Groin Vaults Assuming Fan-Like Form Diagram

Figure 5 shows the results of the parametric analysis for the fan-like form diagram (Figure 3a). The minimum thicknesses are presented as functions of the radius over length and are grouped in five curves corresponding to different springing angles β = [ 0 ° , 10 ° , 20 ° , 30 ° , 40 ° ] .
Figure 5 shows that each curve presents a singular point (cusp), which is also its global minimum. This minimum represents the optimal r / l 0 value for each springing angle, i.e., the best achievable geometry once β has been defined. Overall, increasing β results in lower global values of minimum thickness. However, after a certain r / l 0 is reached, lowering the springing angle will provide reduced minimum thickness values. It is also noticeable that the optimum r / l 0 decreases with increasing spring angles, meaning that for higher springing angles, the optimum r / l 0 is less "pointy". This geometric trade-off can be seen by looking at the geometries in Figure 6, where solutions corresponding to optimal r / l 0 values are reported. In this figure, the network edges have a thickness proportional to the compressive axial force, while edges carrying zero force are not shown. The points where the thrust network touches the intrados and extrados are highlighted in blue and green, respectively. Figure 6 shows the minimum thickness solutions corresponding to the r / l 0 minima per springing angle β . Table 1 lists the r / l 0 ratio at which this minimum point is achieved, and the corresponding minimum thickness over span calculated ( t min / s ).
When β = 0 ° , the minimum thickness is 3.3% of the effective span, and the corresponding vault is defined by r / l 0 = 1.14 (Figure 6a/Table 1), which corresponds to a highly pointed vault. Conversely, for the highest springing angle considered, i.e., β = 40 ° , the minimum thickness corresponds to only 1.1% of the effective span, and this global minimum was found for r / l 0 = 0.62 (Figure 6e/Table 1), which illustrates how this optimal r / l 0 reflects in a less pointed vault cross-section.
The points where the thrust network touches the envelope suggest the location of potential hinges, as noted in [5]. Figure 6 shows that all the geometries corresponding to optimal r / l 0 values show the same global 7-hinge mechanism reported in Figure 6f. Regarding the qualitative distribution of the forces in the structure, the edges connecting the fan segments have zero force, and therefore disappear in Figure 6. This indicates that all the fan lines can be considered as separate arches, spanning from the support to the cross vault’s ridge line. In fact, the only non-negligible connection among these arches can be found along the midspan of the vault. These points coincide with the hinge line number 4 (Figure 6f). Looking at this hinge line, the thrust network touches the vault’s intrados; hence, all nodes on that line have the same height, which means that the resulting horizontal forces along the ridges only provide a horizontal reaction to the thrust of the fan/arrayed arches that does not affect their vertical equilibrium. As a consequence, each of the inclined arches can be analysed as a separate mechanical system; i.e., the equilibrium can be described as a pseudo-3D solution, as is common when using the slicing technique [5,41]. Given the geometry of the cross vault—more specifically, that the webs are singly curved—it is not surprising that this solution appears. A parallel with these results and results from the literature obtained for 2D arches is presented in Section 5.1.1.

5.1.1. The Equivalent Two-Dimensional Problem: A Comparison

The results obtained in Section 5.1 corroborate the qualitative findings in [30], where a 2D analytical analysis using thrust lines showed the same 7-hinge mechanism for the optimal radius over length encountered. In [30], for β = 0 ° , the optimal r / l 0 = 0.94 was obtained, corresponding to a minimum thickness equal to 3.7% of the span. In this section, the last arch of the fan-system is analysed separately, i.e., the arch on the unsupported boundary edge. This analysis was performed by taking the 3D tributary loads (Figure 4a), which vary linearly for this arch. The analysis found the global minimum thickness for r / l 0 = 1.14 , where the minimum thickness was 3.4% of the span. This analysis yielded the same hinge pattern and minimum thickness as the one obtained for the three-dimensional problem. It, however, differs slightly to the values from [30], due to the different load distribution considered. The solution of the 3D, and 2D problem, for β = 20 ° are presented in Figure 7, showing the 7-hinge pattern.
The same solution of Figure 7 was obtained for all the arches in the fan-like form diagram; this happened because tributary loads were equally distributed over all the inclined arches (i.e., equal in regard to a factor). Therefore, modelling the groin vault with the fan-like form diagram is the perfect extension of the 2D pointed arch problem to 3D because all arches behave similarly, achieving the same local mechanism identical to the well-known 2D mechanism for pointed arches.

5.2. Minimum Thickness of Groin Vaults Assuming an Orthogonal Form Diagram

Figure 8 shows the results for the parametric analysis with the orthogonal form diagram (Figure 3b). As in the results for the first pattern, the minimum thickness is presented as a function of radius over length ( r / l 0 ), and is grouped into five curves corresponding to different springing angles β = [ 0 ° , 10 ° , 20 ° , 30 ° , 40 ° ] .
The results present a trend similar to the ones obtained for the fan-like diagram. Each curve has a singular global minimum which identifies the optimal ratio r / l 0 for each springing angle. Similarly to the results for the first diagram, the optimal r / l 0 decreases, for larger springing angles. Moreover, one can observe that after a certain point, decreasing the springing angle is preferred to obtain reduced values of minimum thickness. The solutions for optimal r / l 0 points obtained with the orthogonal form diagram are presented in Figure 9. The points where the thrust network touches intrados and extrados, are highlighted. The values of minimum thickness obtained, and the optimal r / l 0 ratios which connect to each of the plotted solutions, are reported in Table 1.
A comparison of the results shows that the orthogonal form diagram achieves the global minimum for lower r / l 0 , i.e., for vaults that are less pointy (Figure 9a–e). As a comparison to the first diagram, for β = 0 ° , the minimum thickness corresponds to 2.4% of the span (Figure 9a/Table 1), which represents a reduction of 27% in the global minimum thickness achieved with the first diagram; this minimum was achieved for a vault with r / l 0 = 0.72 , instead of the 1.14 observed for the fan-like diagram. For the highest springing angle, β = 40 ° , the minimum thickness obtained corresponds to 0.5% of the span (Figure 9e/Table 1), which occurred for a ratio r / l 0 = 0.53 ; this value represents a reduction of 54% in the value of minimum thickness obtained with the first diagram.
A different hinge configuration was found for the results with the orthogonal diagram (Figure 9f). Since this flow of forces behaves as a series of arches that thrust to the main diagonals, and then towards the supports, these arches have different spans, and do not present the same individual hinge behaviour. Instead, a global 7-hinge mechanism appears in the vault, which is highlighted in Figure 9f. Figure 9f shows that two hinges formed at the supports (1, 7), two hinges points were found in the diagonals (2, 6), two hinge-lines extended through the diagonals (3, 5), and a hinge point was found in the apex of the arch in the boundary (4). In Figure 10, the solution obtained for the springing angle β = 20 ° is compared with the equivalent problem in the 2D arch after the adjustment of the 3D self-weight. Unlike the case of the fan-like diagram (Figure 7), the solution for the sole-standing last arch is not the same as for the vault (Figure 10), and different minimum thicknesses ( ( t min / s ) vault = 1.38%, ( t min / s ) arch = 1.34%) and hinge locations are observed, which reinforces that a global mechanism is encountered in the vault, instead of a series of identical local mechanisms.
The trends for both diagrams show that the orthogonal diagram performs better than the fan-like diagram until a certain point, at which the minimum thickness is the same for both diagrams. This indicates that the vault tends to behave as individual arches for higher values if r / l 0 , while it preferably bears on the diagonals for values before that.
Figure 11a highlights the surface joining the curves of minimum thicknesses for different β , considering both diagrams. The intersection among them is defined by the green curve. Figure 11b presents these results as a projection over the plane β × r / l 0 : for geometrical parameters below the green intersection line, the orthogonal diagram is better performing, and for parameters above this line, the fan-like diagram is preferred. In the following section, this intersection will be discussed in detail for the case of β = 20 ° .

5.3. Minimum Thickness of Groin Vaults Assuming Curved Form Diagram

In this section, the transition among the two initial diagrams is studied, by looking at the curved form diagram (Figure 3c), and performing the parametric minimum thickness analysis for β = 20 ° , which is depicted in Figure 12.
As mentioned in Section 5.2, the orthogonal form diagram is preferred in the initial part of the diagram until a radius over length of 0.71 (Figure 12B). After that, the fan-like diagram takes over. The results obtained with the curved form diagram show that this diagram performs better in the intersection among the orthogonal, and the fan-like diagrams, where a three-dimensional flow of forces seems to be more advantageous, as it yields reduced minimum thickness values. According to this graph, for β ranging from 0.64 to 0.75, this diagram outperforms all others (Figure 12).
The solution for the minimum thickness obtained with the curved diagram is depicted in Figure 13. By looking at the qualitative distribution of the forces (Figure 13b), this diagram behaves as a mix among the two initial diagrams. Indeed, close to the keystone, the loads flow down diagonally, as in the fan arrangement, while towards the lateral openings, the curved arching behaviour is more prominent. Regarding the crack pattern suggested on the limit state, a global 7-hinge mechanism forms. The optimal r / l 0 = 0.65 and the minimum thickness correspond to 1.5% of the span (Table 1).
The results are also compared with the sole standing arch at the boundary. As in the analysis with the orthogonal form diagram, a direct comparison with the results on the arch is not possible. In fact, the minimum thickness attained by the vault ( t min / s ) vault = 1.5 % is inferior to the equivalent two dimensional problem ( t min / s ) arch = 1.7 % , as depicted in Figure 14.

6. Stability Domain Analysis of Groin Vaults

After having shown a minimum thickness parametric analysis on different groin vault geometries, this section is devoted to computing the stability domain for some of them in order to provide a methodology that can give further information on their structural behaviour and robustness.
A meaningful measure of masonry vaults’ stability is provided by the ratio among their minimum and maximum thrusts [27]. The larger this ratio, the more robust the structure, since it indicates that a larger space of admissible stress states (in the present case, admissible thrust networks) exists. At the limit state, where only one equilibrium solution is possible, minimum and maximum thrust coincide, and this factor drops to 1.0.
In [25] a diagram is proposed to observe how the distance between these extreme thrusts evolves towards the collapse state for a given force flow. This diagram together with the GSF provides meaningful information about the robustness, and stability of masonry vaults which is not possible to fully describe just by looking at the GSF [2], but neither by only computing the extreme thrusts for the initial state. In fact, by plotting minimum and maximum thrust curves, the area among the curves measures the space of internal admissible stress states.
To obtain such diagrams, the optimisation problem of Equation (4) is modified with specific objective functions that minimise/maximise the horizontal thrust for a given form diagram and structural thickness. This optimisation is performed recursively for reduced structural thicknesses until the limit state is attained.
To illustrate the proposed methodology, the structural geometries corresponding to points A, B, and C of Figure 12 are selected and assessed, considering a thickness over span t / s = 0.050 . Point A corresponds to the minimum of the orthogonal diagram ( r / l 0 = 0.61 ), where the curved and fan-like diagrams are outperformed in terms of minimum thickness. Point B corresponds to the intersection of the orthogonal and fan-like diagrams (i.e., r / l 0 = 0.71 ), where the curved diagram performs better than the others. Finally, point C represents the fan-like minimum point and occurs for r / l 0 = 0.79 . To gather further information about the structure’s robustness and its extremes of thrust, the stability domain was drawn for these three points.
The stability domains corresponding to these three points are presented in Figure 15, where on the right the perspective of the vaults’ geometry is reported. The stability domain plots the extremes of maximum and minimum thrust as percentages of the vault’s total weight for each form diagram. The curves approach until they coincide at the point which the minimum thickness is found and the GSF is calculated. The stability domain for each vault corresponds to the convex envelope of the different form diagrams analysed.
The stability domains of Figure 15 give a full picture of the stability of the three groin vaults. They also show that a trans-topology analysis, based on different form diagrams, is required to model the intricate structural behaviour of cross vaults.
The stability domain of structure A shows that the maximum and minimum thrust are obtained with the curved and orthogonal diagrams, respectively. This indicates that for the extreme thrust analyses, both diagrams have to be considered. Moreover, the fan-like diagram is found to be entirely contained within the bounds of the other diagrams. Finally, the orthogonal arrangement achieves an overall minimum thickness value, resulting in a GSF of 3.6.
Looking at structure B, both the orthogonal and fan-like diagrams present similar values of minimum thickness (i.e., GSF = 2.1). Nevertheless, their stability domains show different thrust-over-weight values, meaning that they do not refer to the same structural behaviour. Moreover, in terms of maximum thrust and GSF, these two diagrams are outperformed by the curved arrangement, which yields the largest GSF value for the problem, equal to 2.5.
For structure C, the one with the highest r / l 0 value, the fan-like diagram provides the global minimum thickness, resulting in a GSF of 2.4. However, this diagram is not responsible for the observed minimum and maximum overall thrusts, which are encountered assuming the other form diagram topologies.

7. Conclusions

Adopting the safe theorem of limit analysis, this paper presented a parametric study on cross vaults whose internal stress states have been modelled by thrust networks.
The horizontal projection of the networks was assumed fixed, and a nonlinear constrained optimisation problem was formulated to solve the 3D Couplet problem, providing as results the minimum thickness and the corresponding Geometric Safety Factor (GSF). Three different form diagrams were adopted to model the cross vault’s structural response: fan-like, orthogonal, and curved.
The results obtained with the fan-like arrangement showed that vault’s response can be modelled with a series of inclined and independent arches spanning the vault. This diagram is the most effective force flow for high values of radius over length, i.e., for more pointed vaults. The crack pattern obtained with the fan-like diagram shows the same 7-hinge mechanism of 2D analyses already presented in the literature [30]. To clearly illustrate this correlation, a 2D TNA with adjusted self weight was also performed, achieving identical crack patterns and minimum thickness values.
Alternatively, the assumption of a fan arrangement was found to be less efficient to model cross vaults with a less pointy profile. In these cases the orthogonal arrangement is more suitable, since it allows for obtaining lower values of minimum thicknesses. Similarly, a curved diagram was proposed, which allows for higher 3D interaction, by increasing the degrees-of-freedom. This pattern performs better in the transition among the fan-like and orthogonal diagrams.
Besides the minimum thickness (GSF) parametric investigation, a methodology for assessing the robustness of the structure through stability domain analyses was proposed. It was illustrated on three selected vault geometries. Particularly, the stability domain was defined as the result of a sequence of nonlinear optimisation problems and shows how the set of admissible internal states evolves towards the collapse state. In this sense, the area and the shape of the diagrams give meaningful information about the structure’s robustness.
Indeed, it has been observed that the cross vaults can assume different force flows, for different states (i.e., extreme thrusts and minimum thickness), highlighting how these structures are able to adapt to different support displacements, which induce different internal stress states.
Finally, this paper showed that an accurate and combined selection/choice of the form diagrams is crucial to fully describing the structure’s response. It is a delicate, not straightforward, and necessary process for the structural assessment. This indicates how complex and indeterminate the problem of stability at cross vaults is. As argued in [5], it comes as no surprise that cross vaults behave elastically (i.e., a unilateral reversible mechanical system), and are able to adapt to different support displacements, which induce minimum and maximum thrust states. The results obtained in this paper corroborate with such a description. Moreover, the tools offered in this methodology proved to be useful in such analyses, allowing meaningful conclusions about the vault’s structural behaviour.

Author Contributions

Conceptualisation, R.M.A., A.I., and P.B.; data curation, R.M.A. and T.V.M.; formal analysis, R.M.A.; funding acquisition, T.V.M. and P.B.; investigation, R.M.A. and A.I.; methodology, R.M.A. and A.I.; resources, R.M.A. and T.V.M.; software, R.M.A. and T.V.M.; supervision, T.V.M. and P.B.; validation, A.I. and P.B.; visualization, R.M.A.; writing—original draft, R.M.A.; writing—review and editing, R.M.A., A.I., T.V.M., and P.B. All authors have read and agreed to the published version of the manuscript.

Funding

This research was supported by the SNSF—Swiss National Science Foundation. Project grant number 178953: “Practical Stability Assessment Strategies for Vaulted Unreinforced Masonry Structures”.

Conflicts of Interest

The authors declare no conflict of interest.

References

  1. Huerta Fernández, S. Arcos, Bóvedas y Cúpulas. Geometría y Equilibrio en el cálculo Tradicional de Estructuras de Fábrica; Instituto Juan de Herrera: Madrid, Spain, 2004. [Google Scholar]
  2. Gaetani, A.; Monti, G.; Lourenço, P.B.; Marcari, G. Design and Analysis of Cross Vaults Along History. Int. J. Archit. Herit. 2016, 10, 841–856. [Google Scholar] [CrossRef]
  3. Vidal, R.M. The Evolution of the Knowledge of Geometry in Early Gothic Construction: The Development of the Sexpartite Vault in Europe. Int. J. Archit. Herit. 2017, 11, 1005–1025. [Google Scholar] [CrossRef]
  4. Coccia, S.; Como, M.; Carlo, F.D. Wind strength of Gothic Cathedrals. Eng. Fail. Anal. 2015, 55, 1–25. [Google Scholar] [CrossRef]
  5. Huerta, S. Mechanics of masonry vaults: The equilibrium approach. In Proceedings of the 1st International Congress on Structural Analysis of Historical Constructions, Guimaraes, Portugal, 19–21 September 2001; pp. 47–70. [Google Scholar]
  6. Como, M. Statics of Historic Masonry Constructions; Springer: Berlin, Germany, 2013; Volume 1. [Google Scholar]
  7. Tralli, A.; Alessandri, C.; Milani, G. Computational Methods for Masonry Vaults: A Review of Recent Results. Open Civ. Eng. J. 2014, 8, 272–287. [Google Scholar] [CrossRef]
  8. Heyman, J. The stone skeleton. Int. J. Solids Struct. 1966, 2, 249–279. [Google Scholar] [CrossRef]
  9. Poleni, G. Memorie Istoriche Della Gran Cupola del Tempio Vaticano; Nella Stamperia del Seminario: Padova, Italy, 1748. [Google Scholar]
  10. Moseley, H. The Mechanical Principles of Engineering and Architecture; Longman, Brown, Green and Longmans: London, UK, 1856. [Google Scholar]
  11. Milankovitch, M. Beitrag zur Theorie der Druckkurven. Ph.D. Thesis, Dissertation zur Erlangung der Doktorwürde, KK Technische Hochschule, Vienna, Austria, 1904. [Google Scholar]
  12. Heyman, J. The safety of masonry arches. Int. J. Mech. Sci. 1969, 11, 363–385. [Google Scholar] [CrossRef]
  13. Makris, N.; Alexakis, H. The effect of stereotomy on the shape of the thrust-line and the minimum thickness of semicircular masonry arches. Arch. Appl. Mech. 2013, 83, 1511–1533. [Google Scholar] [CrossRef]
  14. Ochsendorf, J. Masonry arch on spreading supports. Struct. Eng. 2006, 84, 29–34. [Google Scholar]
  15. Fraternali, F.; Angelillo, M.; Fortunato, A. A lumped stress method for plane elastic problems and the discrete-continuum approximation. Int. J. Solids Struct. 2002, 39, 6211–6240. [Google Scholar] [CrossRef]
  16. Angelillo, M.; Babilio, E.; Fortunato, A. Singular stress fields for masonry-like vaults. Contin. Mech. Thermodyn. 2013, 25, 423–441. [Google Scholar] [CrossRef]
  17. De Chiara, E.; Cennamo, C.; Gesualdo, A.; Montanino, A.; Olivieri, C.; Fortunato, A. Automatic generation of statically admissible stress fields in masonry vaults. J. Mech. Mater. Struct. 2019, 14, 719–737. [Google Scholar] [CrossRef]
  18. Fraddosio, A.; Lepore, N.; Piccioni, M.D. Thrust Surface Method: An innovative approach for the three-dimensional lower bound Limit Analysis of masonry vaults. Eng. Struct. 2020, 202, 109846. [Google Scholar] [CrossRef]
  19. O’Dwyer, D. Funicular analysis of masonry vaults. Comput. Struct. 1999, 73, 187–197. [Google Scholar] [CrossRef]
  20. Block, P. Thrust Network Analysis: Exploring Three-dimensional Equilibrium. Ph.D. Thesis, Massachusetts Institute of Technology, Cambridge, MA, USA, 2009. [Google Scholar]
  21. Block, P.; Lachauer, L. Three-dimensional Funicular Analysis of Masonry Vaults. Mech. Res. Commun. 2014, 56, 53–60. [Google Scholar] [CrossRef]
  22. Van Mele, T.; Panozzo, D.; Sorkine-Hornung, O.; Block, P. Best-fit Thrust Network Analysis-Rationalization of freeform meshes. In Shell Structures for Architecture: Form Finding and Optimization; Adriaenssens, S., Block, P., Veenendaal, D., Williams, C., Eds.; Routledge: London, UK, 2014. [Google Scholar]
  23. Marmo, F.; Rosati, L. Reformulation and extension of the thrust network analysis. Comput. Struct. 2017, 182, 104–118. [Google Scholar] [CrossRef]
  24. Bruggi, M. A constrained force density method for the funicular analysis and design of arches, domes and vaults. Int. J. Solids Struct. 2020, 193–194, 251–269. [Google Scholar] [CrossRef]
  25. Maia Avelino, R.; Iannuzzo, A.; Van Mele, T.; Block, P. Assessing the Safety of Vaulted Masonry Structures using Thrust Network Analysis. Comput. Struct. 2021. under revision. [Google Scholar]
  26. Couplet, P. Seconde partie de l’examen de la poussée des voûtes. In Mémoires de l’Académie Royale des Sciences Paris; Paris, France, 1730. [Google Scholar]
  27. Romano, A.; Ochsendorf, J.A. The mechanics of Gothic masonry arches. Int. J. Archit. Herit. 2010, 4, 59–82. [Google Scholar] [CrossRef]
  28. Nikolić, D. Thrust line analysis and the minimum thickness of pointed masonry arches. Acta Mech. 2017, 228, 2219–2236. [Google Scholar] [CrossRef]
  29. Cennamo, C.; Cusano, C. The gothic arcade of Santa Maria Incoronata in Naples: Equilibrium of gothic arches. Int. J. Mason. Res. Innov. 2018, 3, 92–107. [Google Scholar] [CrossRef]
  30. Lengyel, G. Minimum thickness of the gothic arch. Arch. Appl. Mech. 2018, 88, 769–788. [Google Scholar] [CrossRef]
  31. Coccia, S.; Como, M. Minimum thrust of rounded cross vaults. Int. J. Archit. Herit. 2015, 9, 468–484. [Google Scholar] [CrossRef]
  32. Andreu, A.; Gil, L.; Roca, P. Computational analysis of masonry structures with a funicular model. J. Eng. Mech. 2007, 133, 473–480. [Google Scholar] [CrossRef]
  33. Lengyel, G. Discrete element analysis of gothic masonry vaults for self-weight and horizontal support displacement. Eng. Struct. 2017, 148, 195–209. [Google Scholar] [CrossRef]
  34. Huerta, S. The debate about the structural behaviour of gothic vaults: From Viollet-le-Duc to Heyman. In Proceedings of the Third International Congress on Construction History, Cottbus, Germany, 20–24 May 2009; Volume 2, pp. 837–844. [Google Scholar]
  35. Lengyel, G.; Bagi, K. Numerical analysis of the mechanical role of the ribs in groin vaults. Comput. Struct. 2015, 158, 42–60. [Google Scholar] [CrossRef]
  36. Mele, T.V.; Block, P. Algebraic graph statics. CAD Comput. Aided Des. 2014, 53, 104–116. [Google Scholar] [CrossRef]
  37. Abraham, P. Viollet-le-Duc et le rationalisme médiéval. Bull. Monum. 1934, 93, 69–88. [Google Scholar] [CrossRef]
  38. Schek, H.J. The force density method for form finding and computation of general networks. Comput. Methods Appl. Mech. Eng. 1974, 3, 115–134. [Google Scholar] [CrossRef]
  39. Kraft, D. A Software Package for Sequential Quadratic Programming; Technical Report DFVLR-FB 88-28; German Aerospace Center—Institute for Flight Mechanics: Koln, Germany, 1988. [Google Scholar]
  40. Wächter, A.; Biegler, L.T. On the implementation of an interior-point filter line-search algorithm for large-scale nonlinear programming. Math. Program. 2006, 106, 25–57. [Google Scholar] [CrossRef]
  41. Block, P.; Ciblac, T.; Ochsendorf, J. Real-time limit analysis of vaulted masonry buildings. Comput. Struct. 2006, 84, 1841–1852. [Google Scholar] [CrossRef]
Figure 1. A groin vault’s section defined by its base length l 0 , radius r, springing angle β , and thickness t. For a proper parametric description, the adimensional radius over length ( r / l 0 ) and thickness over span ( t / s ) are used.
Applsci 11 03560 g001
Figure 2. Overview of the cross vaults obtained for r / l 0 = [ 0.5 1.0 ] , and β = [ 0 ° 40 ° ] . All vaults are displayed with t / s = 0.050 .
Applsci 11 03560 g002
Figure 3. Form diagrams used in the analysis: (a) fan-like, (b) orthogonal, and (c) curved.
Applsci 11 03560 g003
Figure 4. Illustration of the tributary area calculated at the vertices of the network for a vault with r / l 0 = 0.5 , and β = 0 ° , and assuming the (a) fan-like diagram, (b) orthogonal diagram, and (c) curved diagram.
Applsci 11 03560 g004
Figure 5. Minimum thickness over span ( t min / s ) computed with the fan-like form diagram. Curves are grouped considering different springing angles β = [ 0 ° , 10 ° , 20 ° , 30 ° , 40 ° ] .
Applsci 11 03560 g005
Figure 6. Perspective of the solutions obtained with the fan-like diagram for each minimum for β equals (a) 0°, (b) 10°, (c) 20°, (d) 30°, and (e) 40°; (f) the 7-hinge mechanism observed for all solutions.
Applsci 11 03560 g006
Figure 7. A comparison of (a) the three dimensional analysis, and (b) the equivalent 2D problem for the first arch of the network analysed considering the fan-like form diagram, and β = 20 ° . Hinges observed are highlighted and numbered.
Applsci 11 03560 g007
Figure 8. Minimum thickness over span ( t min / s ) computed with the orthogonal form diagram. Curves are grouped considering different springing angles β = [ 0 ° , 10 ° , 20 ° , 30 ° , 40 ° ] .
Applsci 11 03560 g008
Figure 9. Perspective of the solutions obtained with the orthogonal diagram for each minimum for β equals (a) 0°, (b) 10°, (c) 20°, (d) 30°, and (e) 40°; (f) the 7-hinge mechanism observed for all solutions.
Applsci 11 03560 g009
Figure 10. A comparison of (a) the three dimensional analysis, and (b) the equivalent 2D problem for the first arch of the network analysed considering the orthogonal form diagram, and β = 20 ° . Hinges observed are highlighted and numbered.
Applsci 11 03560 g010
Figure 11. (a) Three-dimensional surfaces considering results obtained with orthogonal (pink), and fan-like (blue) diagrams: the three curves highlight the corresponding global minima and the intersection between these two surfaces; (b) Contour plot map of the 2D projection of (a) over the ( β × r / l 0 ) plane showing the minimum thickness obtained considering a combination of the two diagrams.
Applsci 11 03560 g011
Figure 12. Results obtained for β = 20 ° considering the three diagrams studied highlighting points A, B, and C, in which either global minima (A, C) are encountered for one of the series, or an intersection (B) among them is observed.
Applsci 11 03560 g012
Figure 13. Limit solution obtained with the curved diagram for a r / l 0 = 0.65: (a) perspective, and (b) planar view of the forces and hinge locations.
Applsci 11 03560 g013
Figure 14. Comparison of (a) the three dimensional analysis, and (b) the equivalent 2D problem for the first arch of the network analysed considering the curved form diagram with β = 20 ° . Hinges observed are highlighted and numbered.
Applsci 11 03560 g014
Figure 15. Stability domains obtained for groin vaults corresponding to points A, B, and C of Figure 12. Each stability domain shows the extremes maximum and minimum thrust values normalised with respect to the vault’s weight for reduced structural thicknesses. At the limit thickness, the geometric safety factor (GSF) is calculated and plotted in the figures.
Applsci 11 03560 g015
Table 1. Results of minimum thickness obtained for all form diagrams considered. The results are grouped by different springing angles ( β ), and show the optimal pair radius-over-length ( r / l 0 ) and minimum thickness over span ( t min / s ) calculated.
Form DiagramFan-LikeOrthogonalCurved
β r / l 0 t min / s r / l 0 t min / s r / l 0 t min / s
0 1.143.3%0.722.4%--
10 0.972.8%0.682.0%--
20 0.792.1%0.611.4%0.651.5%
30 0.691.5%0.560.9%--
40 0.621.1%0.530.5%--
Publisher’s Note: MDPI stays neutral with regard to jurisdictional claims in published maps and institutional affiliations.

