Abstract
This paper developed a rotatable multi-axis motion platform combined with virtual reality (VR) immersion for flight simulation purposes. The system could simulate the state of the flight operation. The platform was mainly comprised of three crank linkage mechanisms to replace an expensive six degrees of freedom (DoF) Stewart platform. Then, an independent subsystem which could rotate ±180° was installed at the center of the platform. Therefore, this platform exhibited 4-DoF movement, such as heave, roll, pitch, and yaw. In the servo motor control unit, Visual Studio C# was applied as the software to establish a motion control system to interact with the motion controller and four sets of servo motors. Ethernet Control Automation Technology (EtherCAT) was utilized to communicate the commands and orders between a PC and each servo motor. The optimum controller parameters of this system were obtained using Simulink simulation and verified by experiment. The multiple sets of servo motors and crank linkage mechanisms were synchronized with flight VR imagery. For VR imagery, the software Unity was used to design the flying digital content. The controller was used to transmit the platform’s spatial information to meet the direction of the pilot commands and to compensate the direction of the deviation in spatial coordinates. To achieve synchronized response and motion with respect to the three crank linkage mechanism platform and VR imagery on the tester’s goggle view, the relation of the spatial coordinate of VR imagery and three crank linkage mechanisms was transformed to angular displacement, speed and acceleration which were used to command the motor drive system. As soon as the position of the VR imagery changed, the computer instantly synchronized the VR imagery information to the multi-axis platform and performed multi-axis dynamic motion synchronously according to its commanded information. The testers can thus immerse in the VR image environment by watching the VR content, and obtain a flying experience.
1. Introduction
The initial design of the parallel mechanism was proposed by Gough in 1962 [1]. Subsequently, Stewart proposed a Stewart platform with six Degrees of Freedom (DoF) for flight simulators based on a parallel mechanism in 1965 [2]. A few years later, a combination of parallel and series types were proposed to develop a quite wide range of applications in 1990 [3]. Research about the platform has been since developed in many ways [4,5].
Moreover, 3-DoF parallel mechanisms have been more widely studied than 6-DoF. Philip Ethelbert Smit designed a 3-DoF motion platform and analyzed electric drive and hydraulic drive motion control in 2010 [6]. Zhang et al. provided the basics about the selection of parts for the mechanical design of a 3-DoF parallel mechanism, such as hydraulic cylinders, and valves [7]. The design solution, kinematic structure, simulation, and experimental control tests of a hydraulically actuated 3-DoF translational parallel manipulator were also presented by scholars [8]. With the rapid evolution of technology, the development of mechanical and electrical integration was even more brilliant in the industry. Most machine tools usually used closed-loop control methods to realize the machine state which contains direction, position, speed, acceleration, and various automatic control systems [9]. The relay feedback was added to the system to estimate the critical gain and critical frequency, and then the Ziegler–Nichols Proportional–Integral–Derivative (PID) parameter modulation rule was used to obtain the controller parameters [10]. For a multi-axis servo control communication architecture, all communication transmission protocols must be equipped with high anti-interference, remote control, good unit independence, and easy to establish models. The addition of virtual reality (VR) was also a major technology to improve the applicability of the platform, and its available range was very wide; for example, racing, riding, and flying. Valentino K. et al. developed a VR flying simulation of an airplane with simple flight dynamics, limited terrain, and objects [11,12]. In addition, Halim I. et al. even could run VR flight simulators with head-mounted Android mobile devices [13]. The platform was designed by requirements of different VR [14,15]. The most widely known of these was the Stewart platform, which was widely used in a variety of VR. The design of VR was closely related to the dynamic system of the platform, such as for military training [16], for driving training [17,18], and even for rehabilitation. Fung et al. developed a gait rehabilitation system based on a VR sports training system, which was composed of a treadmill combined with a 6-DoF sports platform. The speed of the treadmill was synchronized with the movement of the platform and this virtual environment (VE) was projected on the screen of the walking subject for the testers to watch [19]. Furthermore, many studies have involved VR immersive experiences. Keil, J et al. presented workflows to apply digital elevation data and 3D city model data from OpenStreetMap and the Open. North Rhine-Westphalia (NRW). Through these workflows, they could successfully increase resolution of data to 1 m to make the VR image more detailed [20]. Virtanen, J.-P. et al. studied the use of a 3D virtual world platform Meshmoon to create intelligent open data 3D maps. At the same time, the system could maintain the attribute data related to objects [21]. In the immersive experience, it was also possible to use a handheld controller to measure objects inside the virtual model [22]. Some scholars could also combine a 2D map with a 3D view [23] and improve the immersion through VR [24].
Most of the research focused on a 6-DoF electric linear actuator platform equipped with a monitor to design the simulator. This kind of design was more expensive and exhibited a smaller motion range than those developed in this study. In addition, it also required an expensive control system and a large amount of power supply. Additionally, using a monitor as an image output did not produce an immersive feeling for testers.
In this study, the difference with relative literature was the mechanism design, drive method, and image output. The virtual space synchronous multi-axis motion device for flight simulation was designed and developed in this research. It could be applied in many different simulations, such as tank simulation, boat simulation, physical rehabilitation, and the game industry. This research was focused on aircraft operation simulation. The main structure of the platform was comprised of 3-DoF, inexpensive and simple crank linage mechanisms. Then, an independent system that can rotate ±180° was built at the center of the platform to obtain 4 DoF, such as heave, roll, pitch, and yaw. Through these motion modes, the driving experience can be made more immersive and real to enhance the training experience. In addition, Microprocessor Unit (MPU)-9250 sensors were installed at the middle of platform to acquire motion status to track and monitor the performance evaluation. Ethernet Control Automation Technology (EtherCAT) technology was applied to transmit and receive commands to achieve synchronous simulation between the platform and the VR content to enhance the driving experience with VR content immersion.
2. Experimental Methods
2.1. Specification of Platform
The specifications of the multi-axis platform were designed based on the movement freedoms of heave, roll, pitch, yaw angles. The definition of the platform motion is schematically shown in Figure 1. The roll motion was the angle transformation of the X direction, pitch motion was the angle transformation of the y-axis, and heave motion was the translation of the z-axis. The multi-axis platform also included yaw with a ±180° rotation along the z-axis. The overall specifications of this study are shown in Table 1.
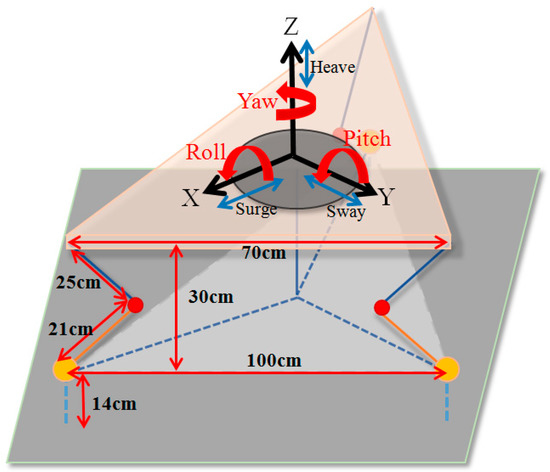
Figure 1.
Definition of the platform motion.

Table 1.
The overall specifications.
2.2. Design of the Platform
The platform design was not only based on the heave, roll, and pitch motion but also needed to consider the supporting weight and payload. Moreover, the inverse kinematics and mathematical calculation software Matlab was used to determine the motion trajectory and motor output angle of the multi-axis motion platform before the conceptual design. Based on the results of calculation, the lengths of proper crank linkage mechanisms could be obtained. After the preliminary design was completed, the mechanical performance of the mechanisms was simulated and characterized through analysis software to determine the required optimal dimension and geometry of the crank linkages. The platform designed in this paper contained four parts: a lower plate (motor and reducer), crank mechanism (crank and linkage), upper plate, and upper rotating disk in the middle (see Figure 1). Each motor was combined with reducer to increase the outputs and connected with the crank by a revolute pair. Both of the cranks and the linkages were connected in the same way by rotating pair. A spherical pair was installed between the upper platform and the linkage. The crank mechanism transmitted input to the upper plate to produce the upper plate motion. The rotating disk above the upper plate could rotate independently by a motor to rotate ±180°. The schematic illustration is shown in Figure 2.
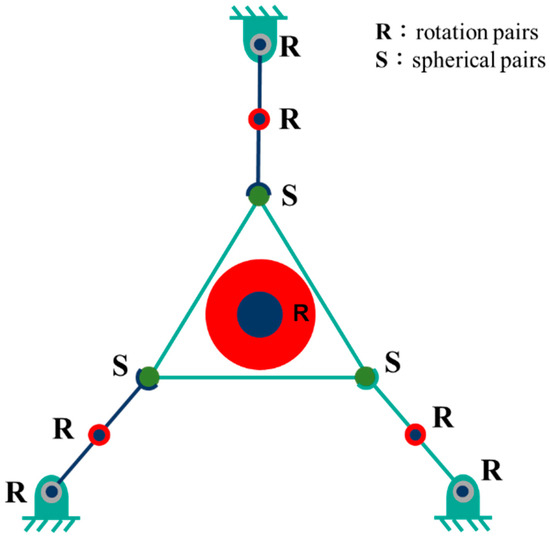
Figure 2.
Schematic illustration of the mechanism platform.
The DoF calculation is described by Equation (1). This platform had nine component pairs, three spherical pairs, and six rotation pairs. This platform was contained at the central axis of rotation, so DoF can be calculated by Equation (1),
where indicated the amount of connecting rods, and was the amount of kinematic pairs which had .
2.3. Central Rotating Mechanism Design
In this study, a ±180° rotatable seat part was installed at the center of the upper platform. The central rotating shaft could be rotated by a belt drive and the force applied for the rotation also could be offset by the supporting unit, where the belt gear ratio of the large and small pulleys was 45:15, the torque magnification was 3 times, and the output power loss was about 9%. In order to facilitate the calculation of the rotating shaft torque, it was assumed there was no friction on the rotation of the central shaft. The loading torque required the driving force to be the product of the tangential friction force applied to the support unit by the load and the distance from the support unit to the central axis of rotation. The free-body diagram is shown in Figure 3. The loading torque was tangent to the support unit. The friction relationship is given by Equation (2). Finally, the torque demand of the central rotation was given by friction force conversion.
where is the central load torque, is the tangential friction of the support unit, is the number of support units installed, is the friction coefficient of the support unit, is the positive force of the support unit relative to the load , and is the distance of the axis.
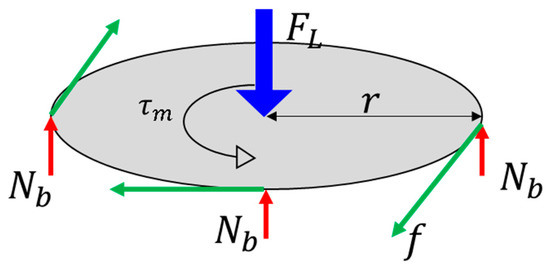
Figure 3.
Central rotational free-body diagram.
2.4. Stress Analysis
In this study, to consider tester safety and supporting a weight of ~400 kg, a platform stress simulation was carried out to verify the stress at a material safety factor (N = 2). In this study, the material S45C was used. The stress simulation can be divided into roll and pitch motion. Both of the roll and pitch motion were loaded with the downward force at the center point and set an upward support force at the three end points of the triangle at the same time to analyze the structural strength. The simulation model was schematically shown in Figure 4a,b.
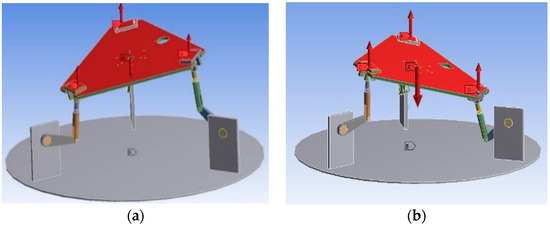
Figure 4.
Stress analysis setting for (a) roll (b) pitch.
2.5. Motion Trajectory
In this part, the platform was divided into the upper platform and the motor output plane. The Cartesian coordinate was set to find the interrelationship of the initial upper platform coordinate , the upper platform coordinates after movement , and the motor output platform coordinate as the basis of the platform motion trajectory. The coordinate relationship was schematically shown in Figure 5.
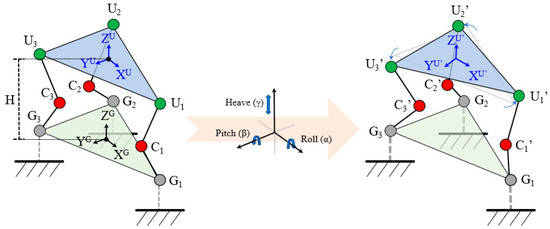
Figure 5.
The basic Cartesian coordinate system of the 3-degrees of freedom (DoF) platform.
Both the motor output platform and the upper platform were designed as equilateral triangles: the length of the motor output platform assumes , the length of the upper platform assumes , and the distance H from the center of mass of the upper platform to the motor output platform were assumed. The upper platform coordinate after movement can be converted by the Euler angle transformation matrix. It was assumed that the coordinate was the coordinate turning angle to the axis and turning angle to the axis as shown in Equation (3). Moreover, was shifted by h as shown in Equation (4). Then, the relationship of coordinate and coordinate was described by Equation (5). The distance from the center of mass to the three vertices was kept in the coordinate . The three vectors of the coordinate could be superimposed to obtain the vector of the coordinate and the final movement position .
After obtaining the position of the upper platform, the position of the crank connecting rod joint could be further derived. Assuming the position , position , crank length , and the connecting rod length were a known condition. The dimension of the platform is shown in Figure 6.
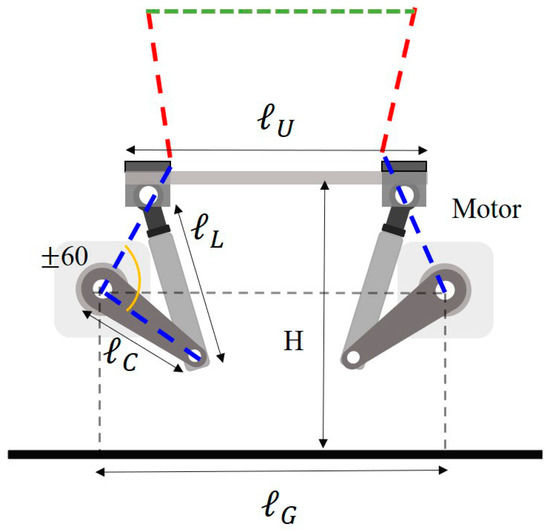
Figure 6.
The dimension of the platform.
According to Figure 7a, the contact relationship is shown in Equations (6) and (7), and through the top view of the platform, the angle θ between the crank and the shaft X was a fixed value as shown in Figure 7b. The geometric relationship was shown in Equation (8). Finally, the coordinate position can be calculated by Equations (6)–(8) to establish the motion trajectory.
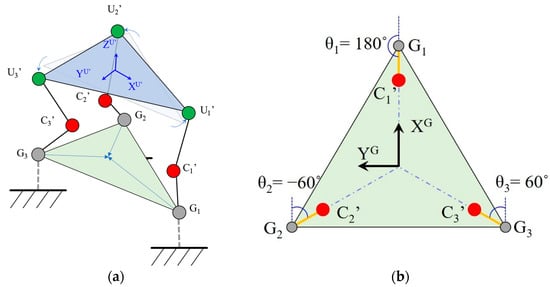
Figure 7.
(a) Platform architecture (b) Top view of the platform.
After obtaining the position , the vector of the connection point between and the upper platform was regarded as the connecting rod length and the motor output platform. The contact connection vector was regarded as the crank length and the vector relation, as shown in Equation (9). The crank length vector was projected to the motor output platform to obtain the vector , as shown in Figure 8. Finally, the motor output angle could be obtained by Equation (10).
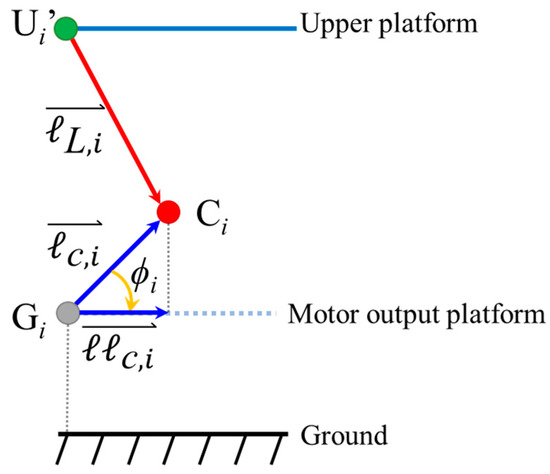
Figure 8.
Vector diagram.
2.6. VR Image Design Method
VR content images can be designed according to customizable requirements. Different content designs could produce different experiences. In this study, VR content was designed for flight training purposes. The design process was first to set the basic terrain, size, and space. Second, the physical system, light field, and gravity conditions for the internal environment were designed to meet the flight conditions of the aircraft. The third step was to set up the 3D model required in the virtual environment by using 3D modeling software Blender and Autodesk 3Ds to create and set the dynamic conditions of the model. The fourth step was to combine the joystick of the aircraft in the external control virtual environment with the dynamic conditions of the aircraft. Finally, the VR equipment was integrated into the cockpit of the aircraft to complete the VR.
2.7. Platform Integrated with VR
The completed platform was integrated with the flight VR image. To immerse in VR, the joystick was installed on the chair and combined with the multi-axis platform to make the experience more real. The tester sat in the middle of the platform and operated the joystick to control the VR image to perform three-axis direction and rotation. The schematic side view is shown in Figure 9.
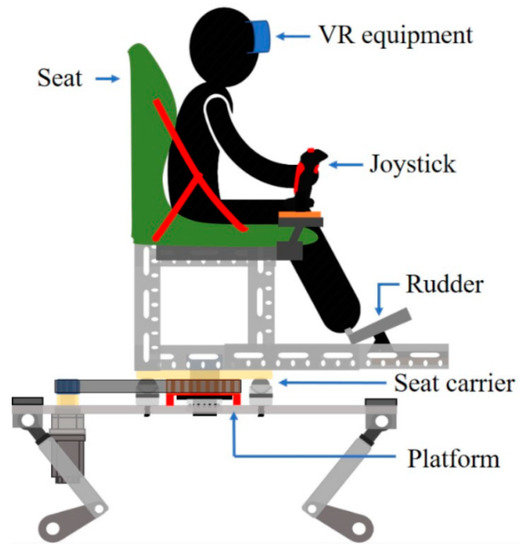
Figure 9.
Schematic side view of the seat platform.
The overall system correlation diagram is shown in Figure 10. The tester controlled the roll, pitch, heave, and yaw motions of the aircraft through the joystick to drive the platform to make the corresponding action-angle. Then, the tester could experience a more realistic flight experience.
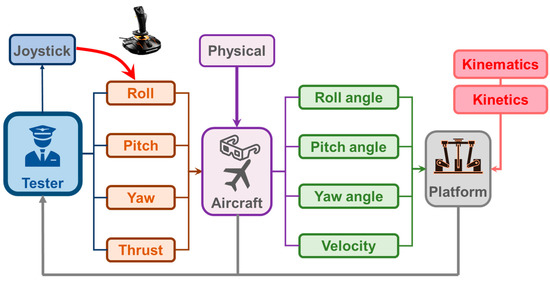
Figure 10.
System integration of association diagram.
3. Results and Discussion
3.1. Multi-Axis Motion Platform Mechanism
The platform design with multi-axis motion mainly consisted of three sets of crank and linkage mechanisms. The servo motor was connected with a reducer to magnify the torque output. In order to increase the stroke of the crank, the output setting position was raised to 21 cm above the ground to avoid the cranks hitting the ground when the platform moved to the lowest point. Then, the output shaft was linked with the crank. After that, the crank and the linkage were connected by a rotating pair, and the upper platform was assembled with a fish-eye joint to connect with the linkage to facilitate motion. The platform limitation of roll and pitch was ±20°, heave stroke was ±20 cm, yaw was ±180° and the supporting weight could not exceed ~400 kg. According to the safety rule, the highest position of the single-person sports platform could not exceed 1.5 m. The prototype of the multi-axis motion platform was shown in Figure 11. The multi-axis motion platform specifications are shown in Table 2.
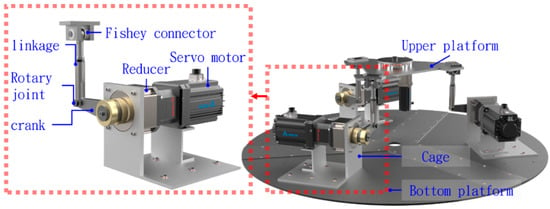
Figure 11.
3D design drawing of multi-axis motion platform.
Table 2.
The multi-axis motion platform specifications.
3.2. Central Rotating Mechanism
The design of the rotation mechanism was mainly by six universal wheels, pulley, and belt, as shown in Figure 12. The supporting weight of this subsystem was ~250 kg, and the required torque was calculated by Equation (2). The result showed the required torque was 188 , and the rated torque of the motor was about 2.39 . The reducer reduction ratio was 1:40. Finally, the drive was combined with the belt, and the reduction ratio was 1:120. Then, we found that the final torque was about 286.8 .
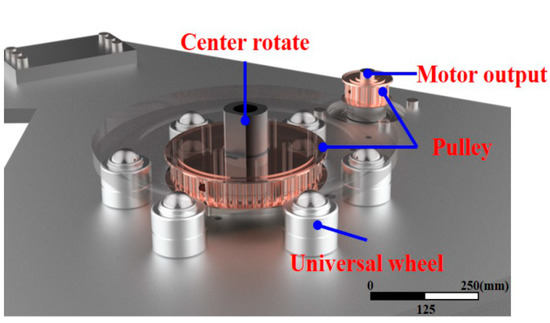
Figure 12.
Central rotating mechanism.
3.3. Stress Analysis Results
The support of the platform was input by total weight of ~400 kg in the analysis. The stress simulation was divided into roll and pitch motion. Among them, the stress of roll motion simulation was analyzed at platform motion angles of 0°, 10°, and 20°. The simulation results showed that the maximum stress was located at the angle of 20° with a maximum stress of 129.63 MPa. The maximum stress analysis result is shown in Figure 13. The roll motion stress trend is shown in Figure 14.
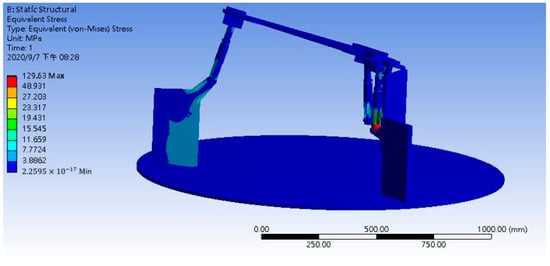
Figure 13.
The maximum stress of the roll motion.
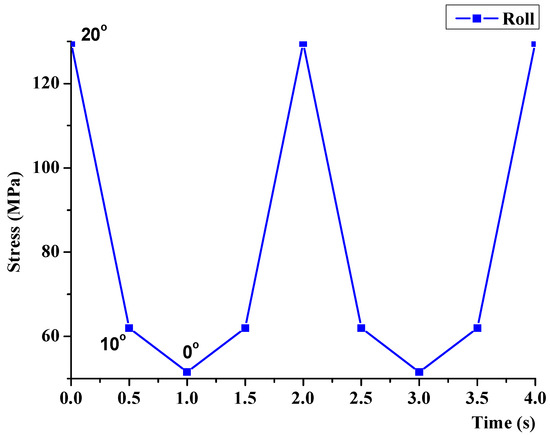
Figure 14.
The stress trend chart of the roll motion.
For the pitch motion, the platform motion angles were 0°, 10°, and 20°. The simulation results showed that the maximum stress was located at the angle of 20° with a maximum stress of 119.79 MPa. The maximum stress analysis result is shown in Figure 15. The pitch motion stress trend is shown in Figure 16.
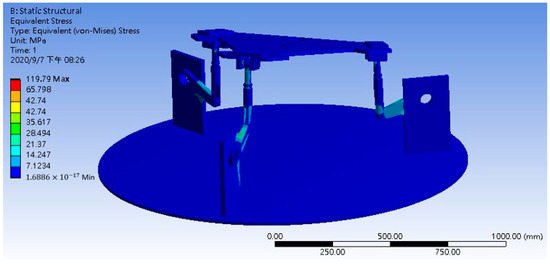
Figure 15.
The maximum stress of the pitch motion.
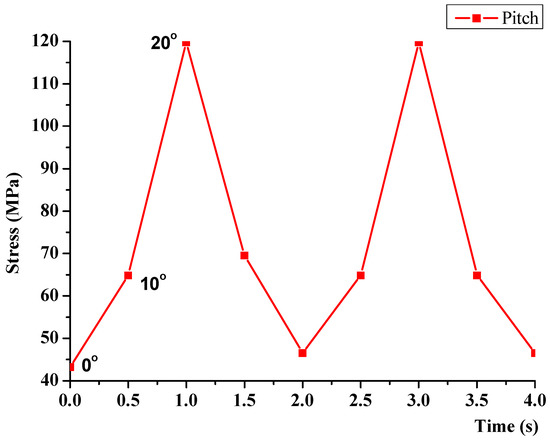
Figure 16.
The stress trend chart of the pitch motion.
According to the analysis results, it can be seen that the multi-axis platform mechanism was safe during movement, the overall stress was within the yield strength 648.5 MPa of material S45C, and the material safety factor N was 2.
3.4. Motion Trajectory Results
In this study, the path of the platform was a mixture of roll and pitch motions. Therefore, the motion trajectory of the platform would be calculated by mathematical simulation analysis software Matlab. In addition, the motion sensor was used to measure the actual movement displacement, speed, and acceleration of the platform motion to verify the consistency of the trajectory trend and platform movement.
The roll and pitch motions were analyzed based on harmonic curves, and the single-cycle period of the path was 4 s. In addition, the motion angle was ±20°. The preset path of roll motion was a cosine curve, as shown in Figure 17a, and the pitch motion was a sine curve, as shown in Figure 17b.
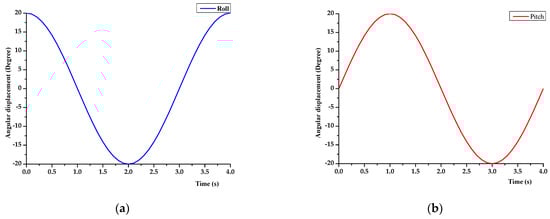
Figure 17.
The trajectory of (a) roll (b) pitch.
The trajectory of the crank and linkage positions of the roll and pitch motion were integrated and combined with the motor output angles of each action point to create a multi-axis motion platform trajectory model by Matlab, as shown in Figure 18. The maximum upward motor output angle was 58.3°, the maximum downward angle was 58.6°, and the total stroke angle was about 117°, as shown in Figure 19. In addition, the maximum motor output velocity was about 7.8 rpm, as shown in Figure 20.
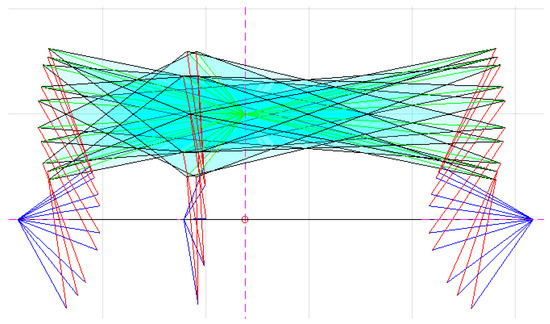
Figure 18.
Multi-axis motion platform trajectory model.
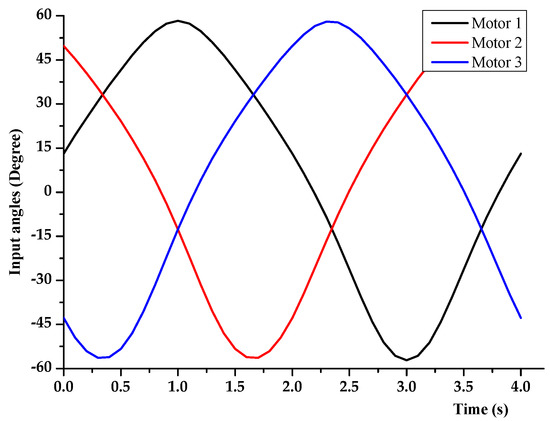
Figure 19.
Motor output angle diagram, total stroke angle was about 117°.
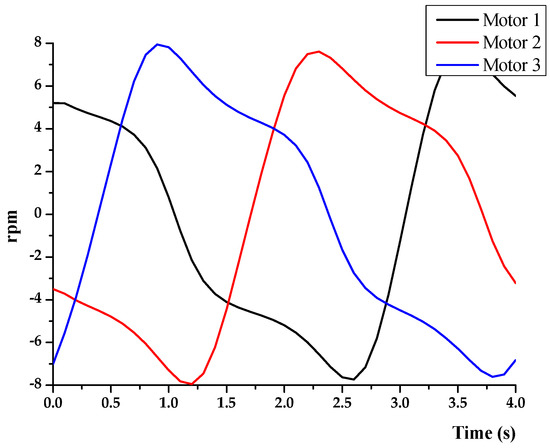
Figure 20.
Motor output speed graph, the maximum velocity was about 7.8 rpm.
Moreover, in order to confirm the error between simulation and test, the roll and pitch motion path were input into the platform and performed for the actual measurement. In roll motion, the maximum angular velocity of the platform simulation was 15.71 rad/s, and the maximum angular velocity of the actual measurement was 14.55 rad/s. The comparison of the velocity for the simulation and the actual measurement is shown in Figure 21a. The maximum angular acceleration of the simulation was 24.67 rad/s2, and the maximum angular acceleration of the actual measurement was 22.8 rad/s2, as shown in Figure 21b.
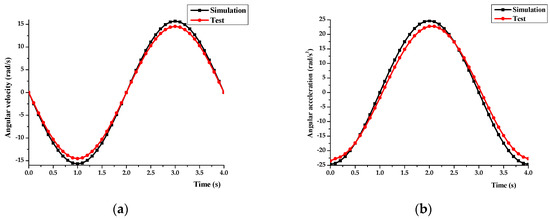
Figure 21.
(a) Angular velocity (b) Angular acceleration comparison chart of the roll motion.
In pitch motion, the maximum angular velocity of the platform simulation was 15.71 rad/s, and the maximum angular velocity of the actual measurement was 14.36 rad/s. The velocity of the simulation and the actual measurement is shown in Figure 22a. The maximum angular acceleration of the simulation was 24.67 rad/s2, and the maximum angular acceleration of the actual measurement was 22.46 rad/s2, as shown in Figure 22b.
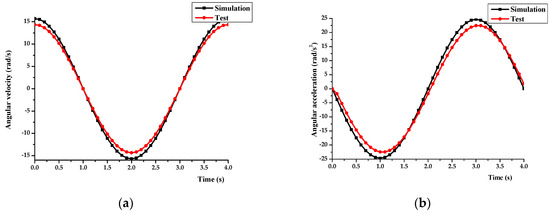
Figure 22.
(a) Angular velocity (b) Angular acceleration comparison chart of the pitch motion.
To sum up, the velocity error during the roll motion was about 7.41%, and the acceleration error was about 7.58%. Thus, the velocity error during the pitch motion was 8.6%, and the acceleration error was about 8.96%. Obviously, the overall trend of those motions was in line with the actual measurement. The small error in the value could be judged as the difference from the load above.
3.5. Motor Angle Trajectory Verification
This part was to verify the angle error between the motor output angle simulation and the actual motor output. In the first place, the motion sensor was installed on the crank. Then, the motor trajectory measurement of the platform roll, and pitch motion was carried out. Among them, the roll and pitch motion were to let the upper platform to obtain the actual crank output angle, the average value of the trajectory error, and the standard deviation of the measurement. The angle trajectory test of the platform is shown in Figure 23.
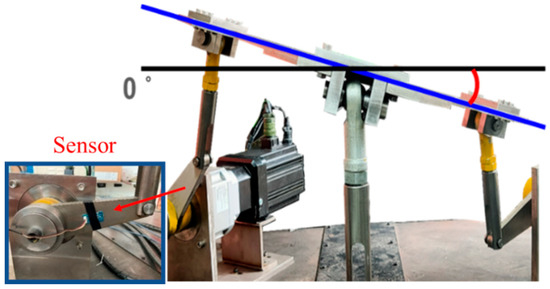
Figure 23.
The angle trajectory test.
Both of the roll and pitch motions tilted the platform at 0°, 5°, 10°, 15°, and 20°. When the testers controlled the movement of the upper platform, the angle of the three sets of driving motors was measured by the motion sensor. Figure 24a,b shows the motor motion simulation trajectory of the roll and pitch motion.
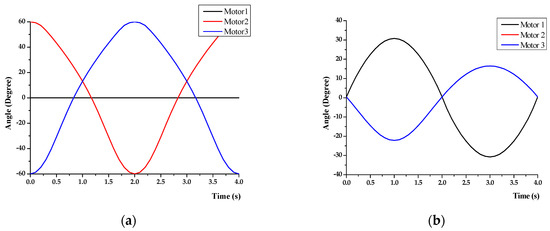
Figure 24.
The (a) roll (b) pitch motor motion input trajectory.
After that, comparing the motor output angle of actual and simulation of roll motion, the error of the output angle of drive motor 1 was 2.95%, motor 2 was 8.5%, and motor 3 was 6.5%. The overall motion error was 7.5%. The comparison chart is shown in Figure 25. Motor 1 during the roll motion was almost static. Therefore, the error of motor 1 was relatively smaller than motor 2 and motor 3. Overall errors might come from mechanism machining accuracy and errors at the moment of the motor start.
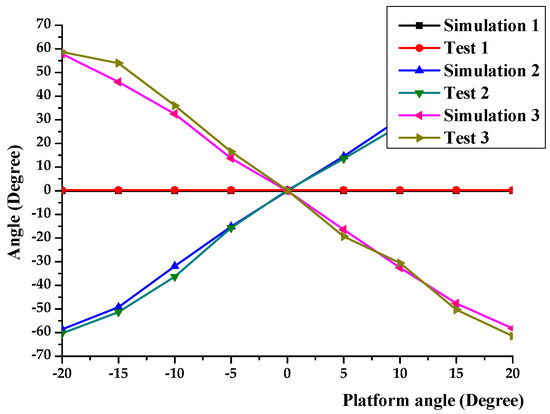
Figure 25.
Comparison chart of actual and simulation of roll motion.
In the pitch motion, the error of the output angle of drive motor 1 was 4%, motor 2 was 3.5%, and motor 3 was 3.5%. The overall motion error was 5.5%. The comparison chart is shown in Figure 26. The motion angle during the pitch motion was small. Overall errors were the same as roll motion. This might also come from mechanism machining accuracy and errors at the moment of the motor start.
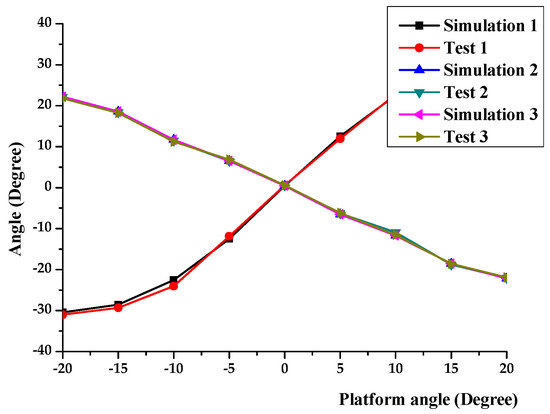
Figure 26.
Comparison chart of actual and simulation of pitch motion.
3.6. Motions Performance Test
This platform performed the heave, pitch, roll, and rotation with limited G forces test. The G force could not exceed 0.9 G. In the heave part, the motion sensor would be installed at the center mass of the upper platform, and a maximum motor speed 7.8 rpm was used to make the upper platform motion from the highest point to the lowest point. After the test, the heave limit G force of the platform was 0.34 G.
In the pitch and roll, the motion sensor was installed on the seat, and a maximum motor speed 7.8 rpm was used to make the upper platform limit angle movement. After the test, the pitch limit G force was 0.53 G, and the roll limit G force was 0.51 G.
In the rotation part, the motion sensor was installed on the round edge of the rotating platform and a maximum motor speed 30 rpm was set up to make seat platform rotate ±180°. The maximum rotational G force was 0.5 G. The motion limit G force test method is shown in Figure 27.
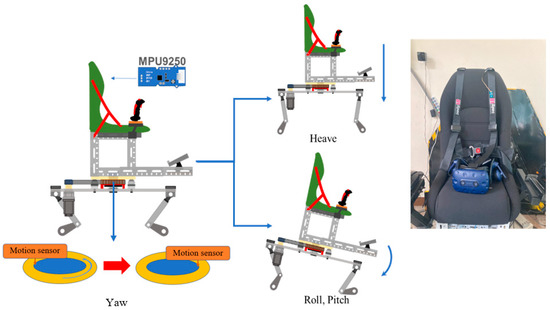
Figure 27.
Heave, roll, and pitch limit G force test method.
3.7. Virtual Image Design
The image was designed for first-person perspective. Final VR content included the image of the aircraft, the outside environment, and the cockpit. The cockpit showed the propulsion power, flight speed, and aircraft altitude, etc. The High Tech Computer (HTC) Vive Pro head-mounted display was set as the pilot’s flight helmet. Therefore, testers could freely watch the outside scenes of the flight through the device, as shown in Figure 28. The content of the flight range was designed to be 1000 m × 1000 m, and the height was 1200 m.
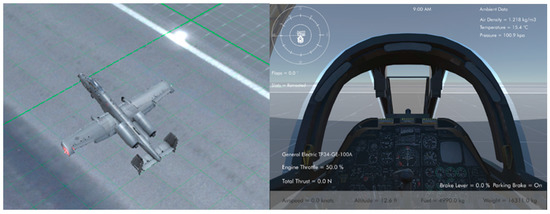
Figure 28.
VR image of aircraft.
3.8. Control System
According to this study, the platform had to synchronize with VR images in real-time. Therefore, the control system needed to build on a high degree of synchronization and high transmission speed. In this study, the high transmission speed serial EtherCAT was selected to control the platform. EtherCAT was used to control 3 sets of 4.5 kW and 1 set of 750 W servo drive equipment in real-time, and collocation with planetary gear reducer with a reduction ratio of 1:50. The system was set up in the Visual Studio C# development environment, and the position control commands were compiled on the upper-axis control card. The compiled instructions were transmitted to the servo drive, and the drive sent the position control to the motors through the received instruction. Then, the motors would make the platform motions, and the multi-axis control was performed between the drives by using the master station and multiple sets of slave stations in series. The control architecture was a three-loop closed-loop system, and the position loop was the main control loop. The communication method is shown in Figure 29.
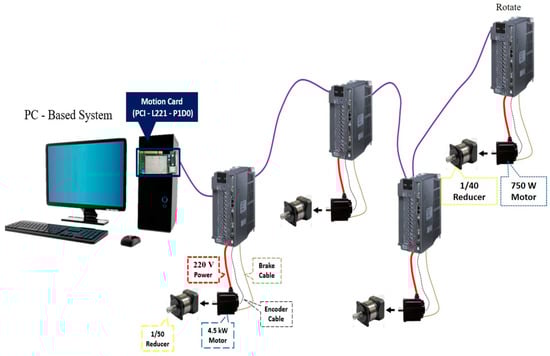
Figure 29.
The communication method of EtherCAT.
3.9. System Reliability
To confirm the reliability of the overall platform in this study, the motion sensor was installed on the center of mass of the multi-axis motion platform and the passenger seat. The installation position is shown in Figure 30. The test method was to input trajectory of roll and pitch motion. After that, the platform motion angle was captured at each time point in the overall trajectory. Finally, the average value with the simulated motion trajectory output by the trajectory kinematics was compared to confirm that the platform moves repeatedly reliability.
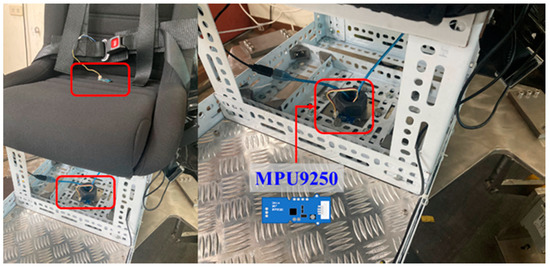
Figure 30.
The installation location of motion sensor.
The trajectory error of roll motion was 0.04~0.91°, the average error was 0.29°, and the measurement standard deviation was 0.17. The comparison of roll motion is shown in Figure 31a. In the pitch motion, the trajectory error was 0.18~0.72°, the average error was 0.4°, and the measurement standard deviation was 0.17. The comparison of pitch motion is shown in Figure 31b. To sum up, the platform’s motion angle return reliability was 97.43%.
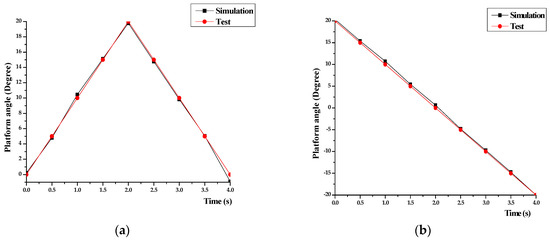
Figure 31.
Comparison of the trajectory error (a) roll (b) pitch.
3.10. Rotatable Multi-Axis Motion Platform Combined with VR
Finally, the rotatable multi-axis motion platform and the VR image were integrated. The angle data of the VR image was converted into the rotation angles of three sets of driving motors. The operating step of this system was that the tester wore a display of VR and controlled the image in the virtual environment through the joystick, throttle, and foot rudder. Then the image’s angle was caught to calculate the drive motor output. According to the angle, the multi-axis motion platform could be operated the heave, roll, pitch, and yaw motions. The comparison with the Stewart platform is shown in Table 3. The complete platform is shown in Figure 32. When the image moved in each direction, the tester would feel movement synchronously in the real world which enhanced real immersion in VR, as shown in Figure 33.
Table 3.
The comparison with Stewart platform.
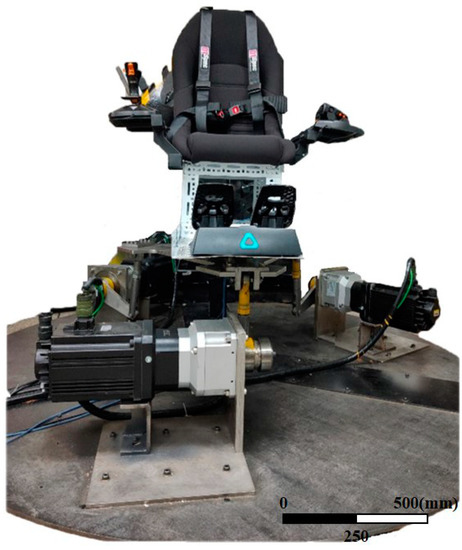
Figure 32.
Complete platform.
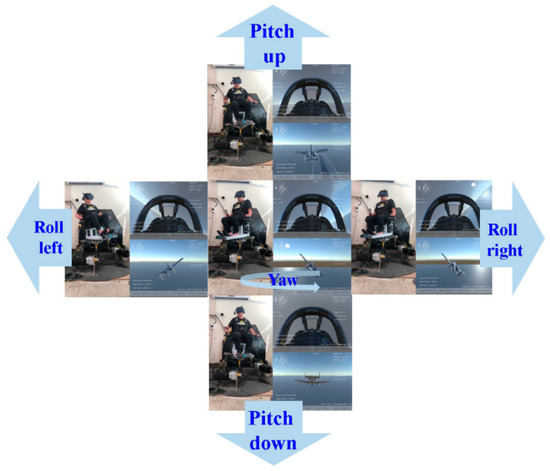
Figure 33.
Operating state of the system.
4. Conclusions and Future Work
Most prior research focused on a 6DoF electric linear actuator platform equipped with a monitor to design the simulator. This kind of design exhibited a smaller motion range than those developed in this study, and the monitor as an image output did not have an immersive feeling for testers. Therefore, this paper developed a rotatable multi-axis motion platform combined with VR digital content. The whole platform system included inverse kinematics, mechanical design, stress analysis, VR development, and interactive control. It allowed testers to achieve immersive VR flight training by watching and controlling VR imagery of a flight and experiencing the feedback brought by the multi-axis motion platform. The main contribution of this study was to design a simple 3-DoF crank linkage mechanism to replace the expensive 6-DoF electric linear actuator Stewart platform and to obtain a comparable movement experience to Stewart system. The three crank linkages with 3 DoF can work out a larger range of motion displacement and be able to support higher loading with lower folding height. Furthermore, the yaw axis with a ±180° rotation was built at the center of the platform to obtain collectively 4-DoF of movement. VR replaced monitor output. The roll and pitch motions of the platform could obtain their overall motion trajectory through inverse kinematics and harmonic curves. Motion sensors were used to verify the position status of the simulated and actual platform. The velocity error during the roll motion was about 7.41%, the acceleration error was about 7.58%, the velocity error during the pitch motion was 8.6%, and the acceleration error was about 8.96%. Due to the acceleration of the actual platform, the platform stress was analyzed at each movement. The result showed that the maximum stress obtained during the roll motion was ~129.63 MPa, and the maximum stress during the pitch motion was ~119.79 MPa. The above-mentioned maximum stress was lower than the yield strength ~648.5 MPa of material S45C. Therefore, the design of the platform would not cause system crash during the motion. The error between the simulated motor output angle and the actual output angle of the overall roll motion error was ~7.5%, and the overall pitch motion error was ~5.5%. This error might come from the mechanism machining accuracy or the errors at the motion of the motor. According to test results, the platform’s motion angle return reliability was ~97.43%. In the final performance test, the maximum ultimate performance of the heave motion was ~0.34 G, the roll motion was ~0.51 G, and the pitch motion was ~0.53 G. In addition, the central rotation performance could achieve ~0.5 G. To sum up, this multi-axis motion platform can provide enough somatosensory feedback and a highly interactive realistic training system by combining the joystick and VR equipment. The testers can immerse in the VR content via movement with the platform to enjoy a flying experience.
In the future, research will be focused on improving the installation methods of cranks, motors, and reducers to upgrade the rigidity of the platform and increase the wider range of motion. In the VR component, weather changes and design of a detailed scene could be added to make the operation more realistic. Through the establishment of different VR scenes and adjustment of the displacement, speed, and acceleration of the platform, this platform can be used not only for flight simulation, but also be applied in many different simulations.
Author Contributions
Conceptualization, P.-Y.S.; Data curation, H.-J.L. and Z.-Y.H.; Formal analysis, P.-Y.S., H.-J.L. and C.-H.H.; Funding acquisition, Z.-Y.H.; Investigation, P.-Y.S., H.-J.L. and C.-H.H.; Methodology, C.-T.P.; Project administration, C.-T.P.; Supervision, C.-T.P. and Y.-L.S.; Validation, Z.-Y.H. and Y.-L.S.; Writing—original draft, P.-Y.S.; Writing—review & editing, P.-Y.S. All authors have read and agreed to the published version of the manuscript.
Funding
This research was funded by grants KSVNSU110-004 from Kaohsiung Veterans General Hospital, MOST 108-2622-E-110-004-CC3 from Ministry of Science and Technology, and Kaohsiung Brogent Technologies Inc.
Institutional Review Board Statement
Not applicable.
Informed Consent Statement
Not applicable.
Data Availability Statement
Not applicable.
Acknowledgments
This work was supported by grants KSVNSU110-004 from Kaohsiung Veterans General Hospital, MOST 108-2622-E-110-004-CC3 from Ministry of Science and Technology, and Kaohsiung Brogent Technologies Inc.
Conflicts of Interest
We declare no competing interests.
References
- Gough, V.; Whitehall, S. Universal tire test machine. In Proceedings of the FISITA 9th International Technical Congress, London, UK, 1 January 1962; Volume 11, pp. 117–137. [Google Scholar]
- Stewart, D. A platform with six Degrees of Freedom. Proceedings of the institution of mechanical engineers. Proc. Inst. Mech. Eng. 1965, 180, 371–386. [Google Scholar] [CrossRef]
- Hurt, K. Structural Kinematics of in Parallel Actuated Robot-Arms. ASME J. Mech. Transm. Autom. Des. 1983, 105, 705–712. [Google Scholar]
- Ammanagi, S.; Poornima, V.; Sera, A.; Sunder, R. Development of a digitally-controlled three-axis earthquake shake table. Curr. Sci. 2006, 91, 190–203. [Google Scholar]
- Itul, T.; Pisla, D. Dynamics of a 3-DoF parallel mechanism used for orientation applications. IEEE Int. Conf. Autom. Qual. Test. Robot. 2008, 2, 398–403. [Google Scholar] [CrossRef]
- Philip, E. Development of a 3-DOF motion simulation platform. Ph.D. Thesis, University of Stellenbosch, Stellenbosch, South Africa, 2010. [Google Scholar]
- Zhang, B.; Li, J.; Jiang, Z.; Wang, C.; Zhang, Z. Kinematics analysis of a 3-DoF hydraulic driven parallel mechanis. In IOP Conf. Series: Materials Science and Engineering; IOP Publishing: Kuala Lumpur, Malaysia, 2018; Volume 324. [Google Scholar]
- Ryszard, D.; Piotr, W. Design of a hydraulically actuated 3-DoF translational parallel manipulator. In Proceedings of the Fourth Huntsville Gamma-Ray Burst Symposium; AIP Publishing: Bydgoszcz, Poland, 2019; Volume 2077, p. 020015. [Google Scholar]
- Sukede, A.K.; Arora, J. Auto tuning of PID controller. In Proceedings of the 2015 International Conference on Industrial Instrumentation and Control (ICIC), Pune, India, 28–30 May 2015; Institute of Electrical and Electronics Engineers (IEEE): Pune, India, 2015; Volume 2015, pp. 1459–1462. [Google Scholar] [CrossRef]
- Astrom, K.; Hagglund, T. Automatic Tuning of Simple Regulators with 12 Specifications on Phase and Amplitude Margins. Automatica 1984, 20, 645–651. [Google Scholar] [CrossRef]
- Valentino, K.; Christian, K.; Joelianto, E. Virtual reality flight simulator. Internetw. Indones. J. 2017, 9, 21–25. [Google Scholar]
- Dominic, M.; Halsmer, P.E. Development of a Virtual Reality Flight Simulator to Assist in the Design of Original Aircraft; ASEE Publishing: Tampa, Florida, 2018. [Google Scholar] [CrossRef]
- Halim, I.; Casey, J.; Baghaei, N. Designing a Virtual Reality Flight Simulator. In Proceedings of the 26th International Conference on Computers in Education (ICCE 2018), Manila, Philippines, 26–30 November 2018. [Google Scholar]
- Åstrom, K.J.; Klein, R.E.; Lennartsson, A. Bicycle Dynamics and Control. IEEE Control Syst. Mag. 2005, 25, 26–47. [Google Scholar]
- Bourke, P. Calculating Stereo Pairs. Retrieved 1999, 12, 2006. [Google Scholar]
- Villacís, C.; Fuertes, W.; Escobar, L.; Romero, F.; Chamorro, S. A New Real-Time Flight Simulator for Military Training Using Mechatronics and Cyber-Physical System Methods. Mil. Eng. 2020. [Google Scholar] [CrossRef]
- Ranky, R.; Sivak, M.; Lewis, J.; Gade, V.; Deutsch, J.E.; Mavroidis, C. VRACK virtual reality augmented cycling kit: Design and validation. In Proceedings of the 2010 IEEE Virtual Reality Conference (VR), Waltham, MA, USA, 22–24 March 2010; pp. 135–138. [Google Scholar]
- Herbuś, K.; Ociepka, P. Integration of the virtual model of a Stewart platform with the avatar of a vehicle in a virtual reality. IOP Conf. Ser. Mater. Sci. Eng. 2016, 145, 042018. [Google Scholar] [CrossRef]
- Fung, J.; Richards, C.L.; Malouin, F.; McFadyen, B.J.; Lamontagne, A. A Treadmill and Motion Coupled Virtual Reality System for Gait Training Post-Stroke. Cyberpsychol. Behav. 2006, 9, 157–162. [Google Scholar] [CrossRef] [PubMed]
- Keil, J.; Edler, D.; Schmitt, T.; Dickmann, F. Creating Immersive Virtual Environments Based on Open Geospatial Data and Game Engines. J. Cart. Geogr. Inf. 2021, 71, 1–13. [Google Scholar] [CrossRef]
- Virtanen, J.-P.; Hyyppä, H.; Kämäräinen, A.; Hollström, T.; Vastaranta, M.; Hyyppä, J. Intelligent Open Data 3D Maps in a Collaborative Virtual World. ISPRS Int. J. Geo-Inf. 2015, 4, 837–857. [Google Scholar] [CrossRef]
- Schmohl, S.; Tutzauer, P.; Haala, N. Stuttgart City Walk: A Case Study on Visualizing Textured DSM Meshes for the General Public Using Virtual Reality. PFG J. Photogramm. Remote Sens. Geoinf. Sci. 2020, 88, 147–154. [Google Scholar] [CrossRef]
- Vainio, T.; Kotala, O. Developing 3D information systems for mobile users: Some usability issues. In Proceedings of the Second Nordic Conference on Human-Computer Interaction, Aarhus, Denmark, 19–23 October 2002; pp. 231–234. [Google Scholar] [CrossRef]
- Hruby, F.; Sánchez, L.F.Á.; Ressl, R.; Escobar-Briones, E.G. An empirical study on spatial presence in immersive geo-environments. PFG J. Photogramm. Remote Sens. Geoinf. Sci. 2020, 88, 155–163. [Google Scholar] [CrossRef]
- Volkaner, B.; Sozen, S.N.; Omurlu, V.E. Realization of a Desktop Flight Simulation System for Motion-Cueing Studies. Int. J. Adv. Robot. Syst. 2016, 13, 85. [Google Scholar] [CrossRef]
- Huang, C.I.; Chang, C.F.; Yu, M.Y.; Fu, L.C. Sliding-mode tracking control of the Stewart platform. In 2004 5th Asian Control Conference; IEEE Cat. No. 04EX904; IEEE: Melbourne, Australia, 2004; Volume 1, pp. 562–569. [Google Scholar]


Publisher’s Note: MDPI stays neutral with regard to jurisdictional claims in published maps and institutional affiliations. |
© 2021 by the authors. Licensee MDPI, Basel, Switzerland. This article is an open access article distributed under the terms and conditions of the Creative Commons Attribution (CC BY) license (https://creativecommons.org/licenses/by/4.0/).