Article

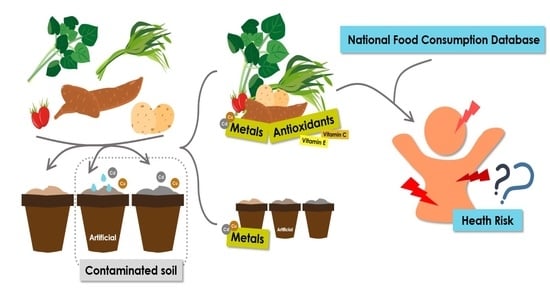
Potential Risk of Consuming Vegetables Planted in Soil with Copper and Cadmium and the Influence on Vegetable Antioxidant Activity

1
Department of Agronomy, College of Agriculture, National Chiayi University, Chiayi City 60004, Taiwan
2
Department of Food Safety/Hygiene and Risk Management, College of Medicine, National Cheng Kung University, Tainan 701, Taiwan
3
Department of Environmental Engineering and Management, Chaoyang University of Technology, Taichung 41349, Taiwan
*
Author to whom correspondence should be addressed.
Appl. Sci. 2021, 11(9), 3761; https://doi.org/10.3390/app11093761
Submission received: 6 April 2021 / Revised: 16 April 2021 / Accepted: 17 April 2021 / Published: 22 April 2021
(This article belongs to the Topic Future Food Analysis and Detection)

Abstract

:
Once in soil and water, metals can enter the food chain, and the consumption of contaminated crops can pose a serious risk to human health. This study used pot experiments to evaluate the accumulation of metal elements and their influence on levels of antioxidants in vegetables. The current study clearly demonstrates that metals accumulated in the five vegetables that were planted in the contaminated soils, especially so for water spinach. Cd accumulation of all of the vegetables planted in the contaminated soils was greater Cu. The low accumulation rate that was seen in sweet potato leaf, potato, and tomato indicated their suitability for planting in suspected contaminated soil, such as at farms nearby metal industries, in replacement of high accumulators, such as leafy vegetables. The non-carcinogenic HI of Cd exposure from water spinach and sweet potato were >1, whereas those for Cu were <1. This study suggests that residents may experience health risks due to vegetable consumption, and that children are vulnerable to the adverse effects of heavy metal ingestion.
Keywords:
metal; risk; Cd; Cu; vegetable

Graphical Abstract

1. Introduction

Toxic heavy metal pollutants are serious global problems, posing health risks to human beings, animals, and plants. Most of the metals concerned occur naturally, but they become concentrated from human industrial activities and accompanying pollution, accumulating in high concentrations in the environment. Once in soil and water, these metals can enter the food chain, and the consumption of contaminated crops can pose a serious risk to human health [1,2,3]. The Taiwan government started to monitor soil quality of agriculture land throughout whole of Taiwan in 1981, revealing that 1024 ha of agricultural land was contaminated, of which 319 ha were reported as heavy metal-contaminated soils [4]. Concern regarding heavy metals has been rising due to their longevity in soils and because they are not easily metabolized after ingestion. Hence, they are easily accumulated in metabolic organs, such as liver and kidney, causing various toxic symptoms [5,6,7,8]. The high dose exposure to cadmium (Cd) by ingestion can cause severe irritation to the stomach, followed by symptoms of vomiting and diarrhea. Long-term exposure to low doses causes kidney disease, which damages the renal tubules and impedes the absorption of calcium (Ca), leading to brittle bones that are less resistant to breakage [9]. Although copper (Cu) is an essential element for the human body, exposure to high doses can cause health problems, such as irritation of the respiratory tract and throat, vomiting, diarrhea, fetal growth retardation, or even an increased risk of Alzheimer’s disease [10,11,12,13].
When plants absorb nutrients and water from the soil through the roots and pores, heavy metals also enter the plant [1,14,15]. Additionally, studies have shown that the uptake of Cd, Cu, manganese (Mn), and zinc (Zn) by plants correlates with increasing levels of soil contamination [16]. The biomass of vegetables has been shown to be negatively affected by metal contaminants in irrigation water [17]. Balkhair and Ashraf [18] carried out field experiments on agricultural land that was adjacent to contaminated sites or by applying untreated sewage to various crops, showing that both natural and man-made pollution had a significant impact on local land and crops. Noor et al. [19] also indicated the high accumulation of metals in rice and in vegetables in four agricultural sites near mining areas in China [20].
Vegetables are valuable sources of many essential micronutrients, such as vitamins C and E [21,22,23]. These vitamins have the potential to inhibit oxidative stress and regulate the immune system in preventing many chronic diseases such as cardiovascular disease and cancer [21,24,25]. However, some studies have shown that the levels of plant antioxidants are changed following exposure to metal elements [26,27].
In the past, studies on the relationship between heavy metal pollution and plant growth were commonly carried out using field and pot experiments. Lai and Chen [28] used pots containing soil that was artificially contaminated with Cd, and showed that the Cd bioaccumulation factor (BAF) of harvested cabbage was raised as Cd concentration in soil increased. Even though they did not discuss the health risks of ingesting the contaminated cabbage, or conduct a risk assessment, they raised concerns of heavy metal exposure through the food chain. In another case, Sipter et al. [29] planted two vegetables (sorrel and amaranth) in pots with contaminated soil that was taken from near an abandoned mine in Hungary, and the accumulated element concentrations indicated that the vegetables that were grown in such soil could have negative health effects on consumers. Pot experiments can be easier, cheaper, and more effective than field experiments, and they can be used to indicate whether land remediation to reduce levels of heavy metals is needed prior to planting. In this study, we used pot experiments to evaluate the accumulation of metal elements in vegetables and their influence on levels of antioxidants. We also finished a risk assessment for humans consuming these contaminated vegetables in proposing a management strategy for farming on contaminated land.

2. Materials and Methods

2.1. Study Design

The study involved two experimental groups and one control group. Experimental group 1 used metal-contaminated soil that was obtained from a contaminated field in Taiwan. Experimental group 2 used compost soil that was artificially contaminated with Cd and Cu additives. The control group used uncontaminated/untreated compost soil. These soils were utilized as a medium to grow five selected vegetables: water spinach (Ipomoea aquatica), sweet potato leaf, potato, sweet potato, and tomato (Lycopersicon esculentum Mill.), all with three replicates. In total, 90 pots were observed (2 metals × 3 groups × 5 vegetables × 3 replicates). At the end of the experiment, analysis of the metals in the soils and vegetables was carried out, and the levels of antioxidants in the vegetables were measured.

2.2. Preparation of Soil Artificially Contaminated with Metals

For the artificially contaminated soil for group 2, 0.42 g of cadmium acetate and 28.0 g of copper chloride were dissolved in 3 L of deionized water separately. The solutions were then sprayed onto 30 kg of different soils, which were then allowed to equilibrate with mixing for one month. The final concentration of Cd and Cu in the contaminated soils was 7 mg/kg and 440 mg/kg, respectively, before the start of planting. The concentration was then expected to be comparable with the limit value in soil for farming in Taiwan regulation.

2.3. Sample Collection and Pre-Treatment

Soils, irrigation water, and harvested vegetables were prepared for the analysis of metal concentration. (a) The soils were sampled before and after planting, and subsequently freeze-dried for 48–72 h in a freeze dryer. They were then sieved and stored in sample vials. (b) The irrigation water was analyzed for metal concentration in pre- and post-pot experiments; however, the Cd levels in all of irrigation waters were non-detectable and all of their Cu levels were lower than the lowest level of calculation range (<0.001 mg/L). The sampled water pH was adjusted to <2 by adding nitric acid and stored in sample vials. (c) The harvested vegetables were thoroughly washed to remove the adhering dirt using deionized water. The potatoes and the sweet potatoes were peeled and the edible parts were subsequently freeze-dried for about 48–72 h in a freeze dryer. They were then pulverized and homogenized in a high-speed mixer and stored in sample bottles.

2.4. Chemicals

Nitric acid ultrapure grade (JT Baker, Canada, 70%,), nitric acid analytical reagent grade (Merck, Germany, 65%,), hydrochloric acid analytical reagent grade (Merck, Germany, 37%), ICP multi-element standard solution VI (Merck, Germany, 1000 mg/L), rhodium ICP standard (Merck, Germany, 1000 mg/L), copper chloride (Alfa Aesar, China, 98%), cadmium acetate (Sigma-Aldrich, India, 98%), methanol (Merck, Germany, 100%), phosphoric acid (Fluka, Poland, 85%), L-ascorbic acid (Sigma-Aldrich, China, 99%), and α-tocopherol (ACROS Inc., 97%) were used in the current study.

2.5. Metals Analysis of Soils, Water, and Vegetables

A total of 0.1 g dry soil, or 0.3 g dry vegetable, was accurately weighed into a digestion vessel. For the digestion, a mixture of 3 mL hydrochloric acid and 1 mL nitric acid was added and mixed uniformly, and the samples were then digested using a 1800 W microwave oven (MarsXpress microwave digestion system, CEM). The digested sample was then filtered (30 mm × 0.45 μm) and additional deionized water was added to make a 50 mL final volume. In addition, 1 mL of water was processed in the same way and then adjusted to the same volume without any digestion. A standard curve was created using serial dilutions of Cd and Cu standard solutions that ranged from 1–50 μg/L and 50–5000 μg/L, respectively. Inductively coupled plasma spectroscopy (ICP-MS NexION® 2000 I, Perkin Elmer, San Jose, California, United States) was used to determine Cd and Cu concentrations in the vegetables and an Avio 200 ICP Optical Emission Spectrometer (ICP-OES, Perkin Elmer, San Jose, California, United States) was used for water and soil samples.

2.6. Vitamin C Analysis in Vegetables

The analysis protocol followed that of Orsavova et al. [25] with modifications. A total of 0.5 g dry vegetable was weighed and extracted by methanol and then shaken in an ultrasonic water bath for 60 min. at 40 °C in dark. After extraction, the sample was filtered (30 mm × 0.45 μm) and the eluate was collected in a dark tube. The sample was analyzed by high-performance liquid chromatography (HPLC) for measuring vitamin C concentration (Ascentis® C18 column: 25 cm × 4.6 mm, 5 μm C18, mobile phase consisting methanol: phosphoric acid: deionized water in the ratio 99: 0.5: 0.5, flow rate: 0.8 mL/min., injection volume: 20 μL, wavelength: 275 nm). L-ascorbic was used as a standard solution to create the standard curve with a concentration range of 10–800 mg/L.

2.7. Vitamin E Analysis in Vegetables

The protocol was the same as for vitamin C analysis [25]. The HPLC parameters were: Ascentis® C18 column: 25 cm × 4.6 mm, 5 μm C18, mobile phase: methanol: deionized water in the ratio 98:2, flow rate: 1.0 mL/min., injection volume: 20 μL, wavelength: 230 nm. The standard solution was formulated with α-tocopherol at concentrations ranging from 0.5–50 mg/L.

2.8. Bioaccumulation Factor of Heavy Metals in Vegetables

BAF is defined as the ratio of the heavy metal concentration in the edible parts of vegetables to that in the corresponding soil. BAF is used to confirm the translocation capability of different heavy metals through soils to vegetables. The BAF for the heavy metals was calculated, as follows [28]:
BAF = C p C s
where Cp = heavy metal concentration in the vegetable (mg/kg) and Cs = heavy metal concentration in the soil (mg/kg).

2.9. Statistical Analysis

Microsoft Office Excel managed the results, and the descriptive statistics (mean ± standard deviation) were run using SPSS Statistics v20.0 software. All of the data were presented as arithmetic means with standard error. In addition, analytical statistics included the Kruskal–Wallis test utilized to investigate whether there were any significant differences in heavy metal or antioxidant concentration in the five different vegetables that were cultivated in the different contaminated soils. In addition, the Spearman correlation was used for assessing the correlations between the heavy metal, antioxidant concentration in the five different vegetables, and metal concentration in the cultivation soils.

2.10. Health Risk Assessment

The health risk assessment for the heavy metals in five different vegetables for different age consumers was estimated according to the food intake data and metal concentrations in the cultivated plants [30,31]. The food intake data were obtained from the Taiwan National Consumption Database. The average daily dose (ADD) was used to measure the amount of daily metal intake that is associated with local inhabitants’ vegetable consumption. The formula used for calculating ADD for a single heavy metal through the diet was:
ADD = C × IR × AF BW
  • ADD: average daily dose via ingestion pathway (mg/kg b.w./day)
  • C: concentration of metal in the vegetable (mg/kg)
  • IR: daily intake of vegetable (kg/day)
  • AF: absorption rate (%), set as 100%
  • BW: average body weight (kg)
It explicitly quantifies the variability and uncertainty that are given by each parameter probability function with an iteration size of 10,000 via the random sampling method (stability condition) to obtain a 95% confidence interval (CI) (MCS P95). Lognormal distribution and normal distribution models were used to determine the input parameters of Cd and Cu concentrations, food consumption data, and BW. The health risk assessment was performed using the Monte Carlo simulation with @Risk 7.5.1 (Palisade Corporation, Ithaca, NY, USA) to estimate each variable’s uncertainty.
Furthermore, the hazard quotient (HQ) was chosen to reflect a non-carcinogenic risk that was dependent on daily average exposure dose and reference dose (RfD) of the metal exposure. The total non-carcinogenic risk hazard index (HI) is the sum of the HQs exposed to the same pollutant by consuming different foods. HI < 1 indicates a non-carcinogenic risk of the substance and a less significant impact on human health. The formulas to estimate HQ and HI are:
HQ = ADD RfD
HI =   HQ
RfD for Cd: 0.001 mg/kg/day; for Cu: 0.04 mg/kg/day

3. Results and Discussion

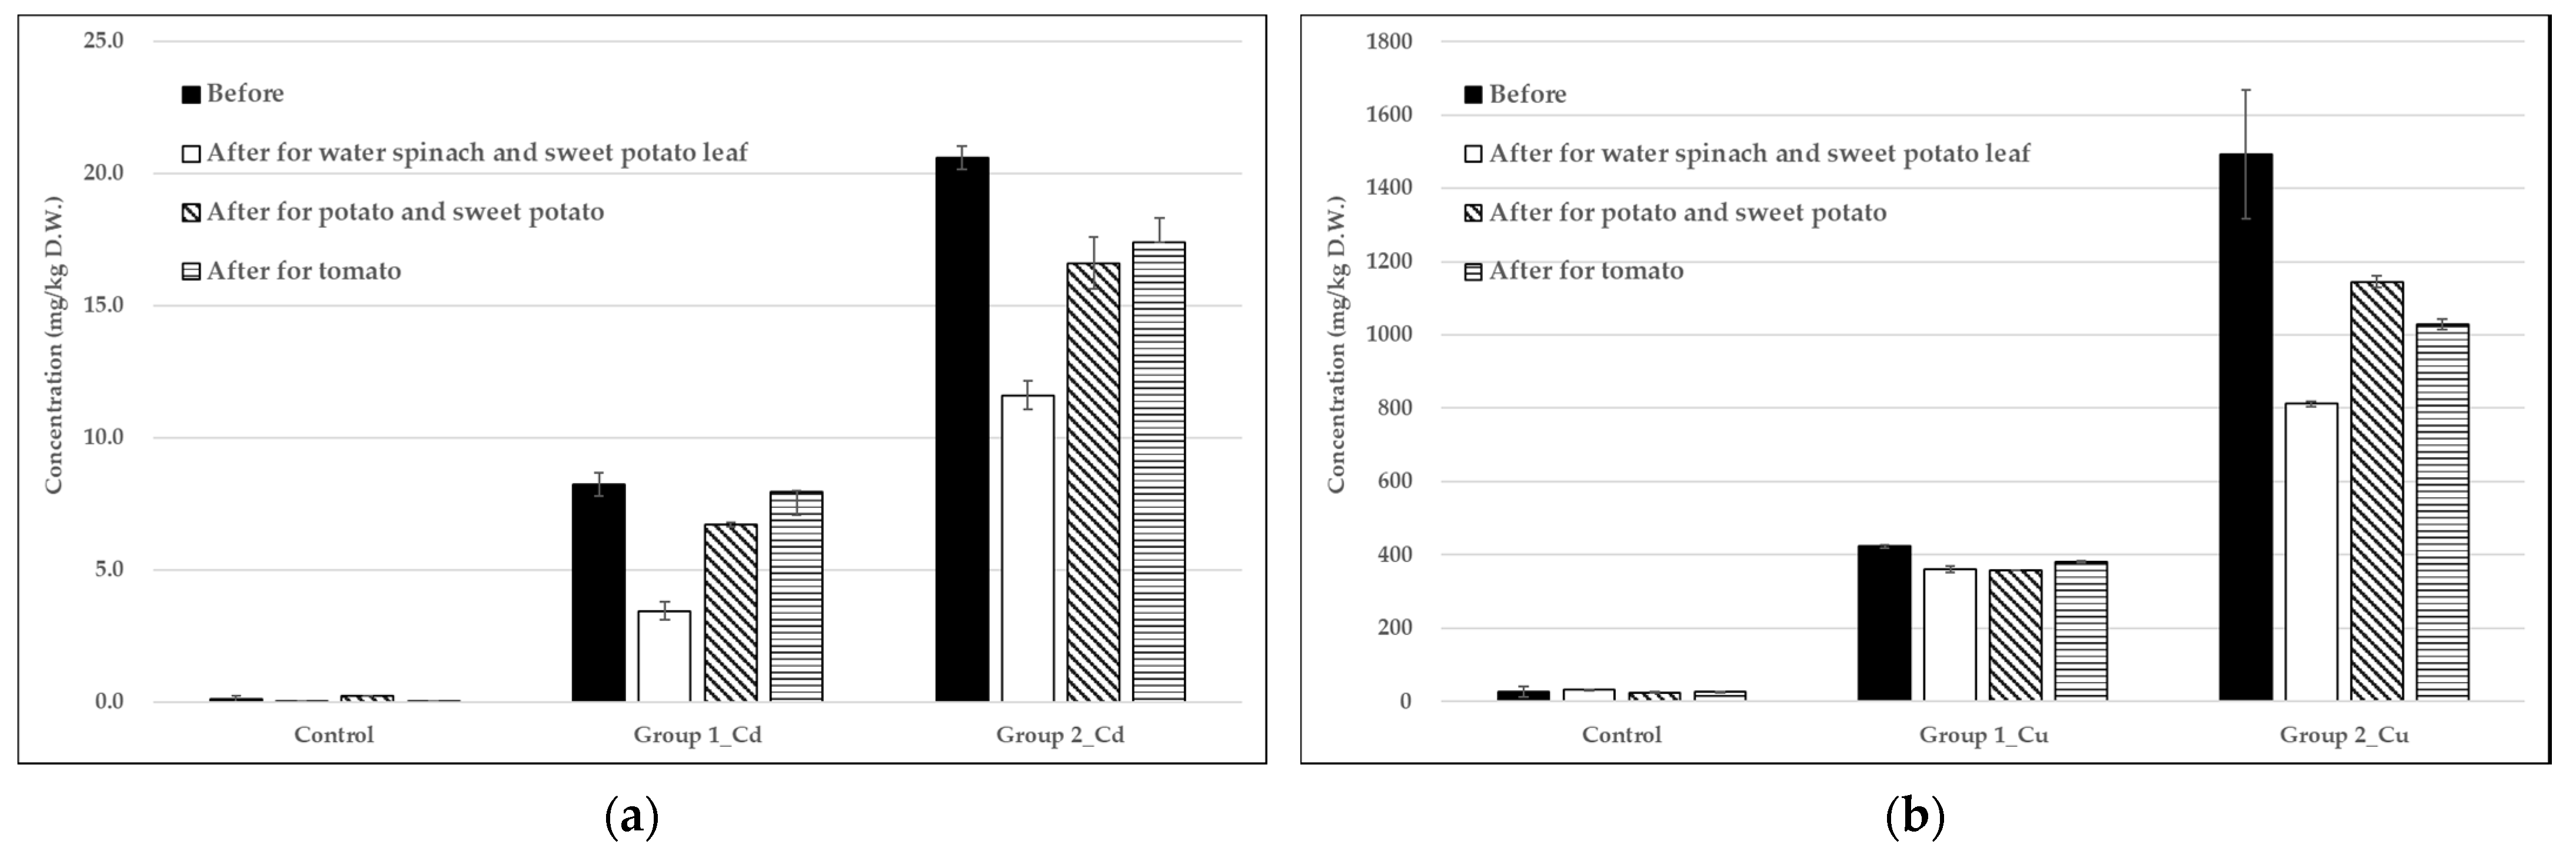
3.1. Heavy Metal Concentrations in Soil and Water

Figure 1 presents the concentrations of Cd and Cu in the soil for the experimental and control groups before and after planting the various vegetables. Pre-planting, Cd concentrations in group 1, group 2, and control were 8.24, 20.6, and 0.11 mg/kg d.w. (dry weight), respectively. At the end of the growing period, Cd concentration in the soil decreased by 58%, 18%, and 4% in group 1 and decreased by 44%, 19%, and 16% in group 2 after planting spinach/sweet potato leaves, potato/sweet potato, and tomato, respectively. In pre-planting soils, the Cu concentrations were 423 ± 3.74, 1492 ± 175, and 27.1 ± 1.47 mg/kg in group 1, group 2, and control, respectively. Overall, at the end of the growing period, the Cu concentration in the soils of group 1 decreased by 15%, 15%, and 10% in water spinach/sweet potato leaf, potato/sweet potato, and tomato, respectively, and then decreased by 46%, 23%, and 31%, respectively, in the soils of group 2 for the same vegetable categories. To account for any interference from additional metals in the irrigation water during the pot experiment, Cd and Cu concentrations were also monitored in the first, second, and third phases of the pot experiments. The Cd and Cu concentrations were non-detectable in all of the samples, which indicated that the results should not be affected by water pollution during the experiment.
The Cd and Cu contamination ranges in the soils in the current study were comparable with those in other studies. Zeng et al. [32] analyzed heavy metal concentrations in selected agricultural land that was adjacent to industrial areas in the eastern, western, and central regions of China. Cd was considered to be the most toxic (0.00–16.8 mg/kg), and Cu was found to contaminate the central area (4.43–217 mg/kg). In Taiwan, Lin et al. [33] also reported soil contamination by Cd in Taoyuan (1.90–19.4 mg/kg) and Taichung (0.48–3.89 mg/kg). These results suggest that health risks should be taken into consideration for the food safety of local crops. Overall, the investigation of industrial waste treatment and pollution distribution of these heavy metals is necessary and it should be carried out by the government.

3.2. Vegetable Growth

Growth data for the vegetables were obtained in all groups to evaluate whether the growth of vegetables was affected by metal contamination. The growth rate of water spinach and sweet potato leaf in the experimental groups was slower than that in the control group from the third week to harvest time. The harvest quantity for potato and sweet potato in the control groups was significantly higher than in the experimental groups (Table 1). The greatest negative effect on growth was in tomato during the last period before harvesting time (p < 0.05). In the Cu contamination group, we found that all of the vegetables in the control groups grew higher than all of the experimental groups by harvest time (Table 2).
The crop weights at harvest for potatoes, sweet potatoes, and tomatoes were greater in the control group than the experimental groups. This result is consistent with Hou et al. [27], who reported that growth declined in carrot and pakchoi under greenhouse cultivation conditions with exposure to metals in the soil. Additionally, the harvest weight of water spinach and sweet potato leaf were lower in group 1 as compared to the control group, and similarly for sweet potato (p < 0.05).
To monitor Cd accumulation in vegetables grown in Cd-contaminated soils, Sun et al. [34] planted Solanum nigrum L. in soils that were contaminated with Cd at different concentrations. They found that the concentration of Cd in the vegetables ranged from 122 (standard deviation (SD): 38.2) to 387 (SD: 84.9) mg/kg. The height and quantity of vegetables did not decrease if the Cd concentration was <10 mg/kg in soil, while there was a reduction in the plant height and shoot dry biomass when the plants were grown at Cd concentration >25 mg/kg [34,35]. In the current study, there was a negative impact of Cd contamination on the growth (height) and quantity of vegetables at harvest for soil concentrations in the range 8.24–20.6 mg/kg. Xie et al. [3] also demonstrated that the yield of rice decreased with an increase in Cd concentration in each group using artificially heavy metal-contaminated soils in China; comparing plant growth with Cd- and Cu-contaminated irrigation water at same dose, Cu produced a slight decrease in growth parameters, but Cd had a high impact on plant growth [36], and Cd exposure seriously inhibited the root growth as compared to other metals [37].
Overall, heavy metal-polluted soils have a significant effect on the growth of plants or vegetables. In this study, in addition to soil texture and species, we also found that the soil organic matter, electrical conductivity, and total nitrogen content of each soil differed among the three soil groups (Supplementary Materials Table S1). All of these factors may affect the nutrient content and water transport capacity of vegetables in different groups, which results in differences in the growth and development of each vegetable [38].

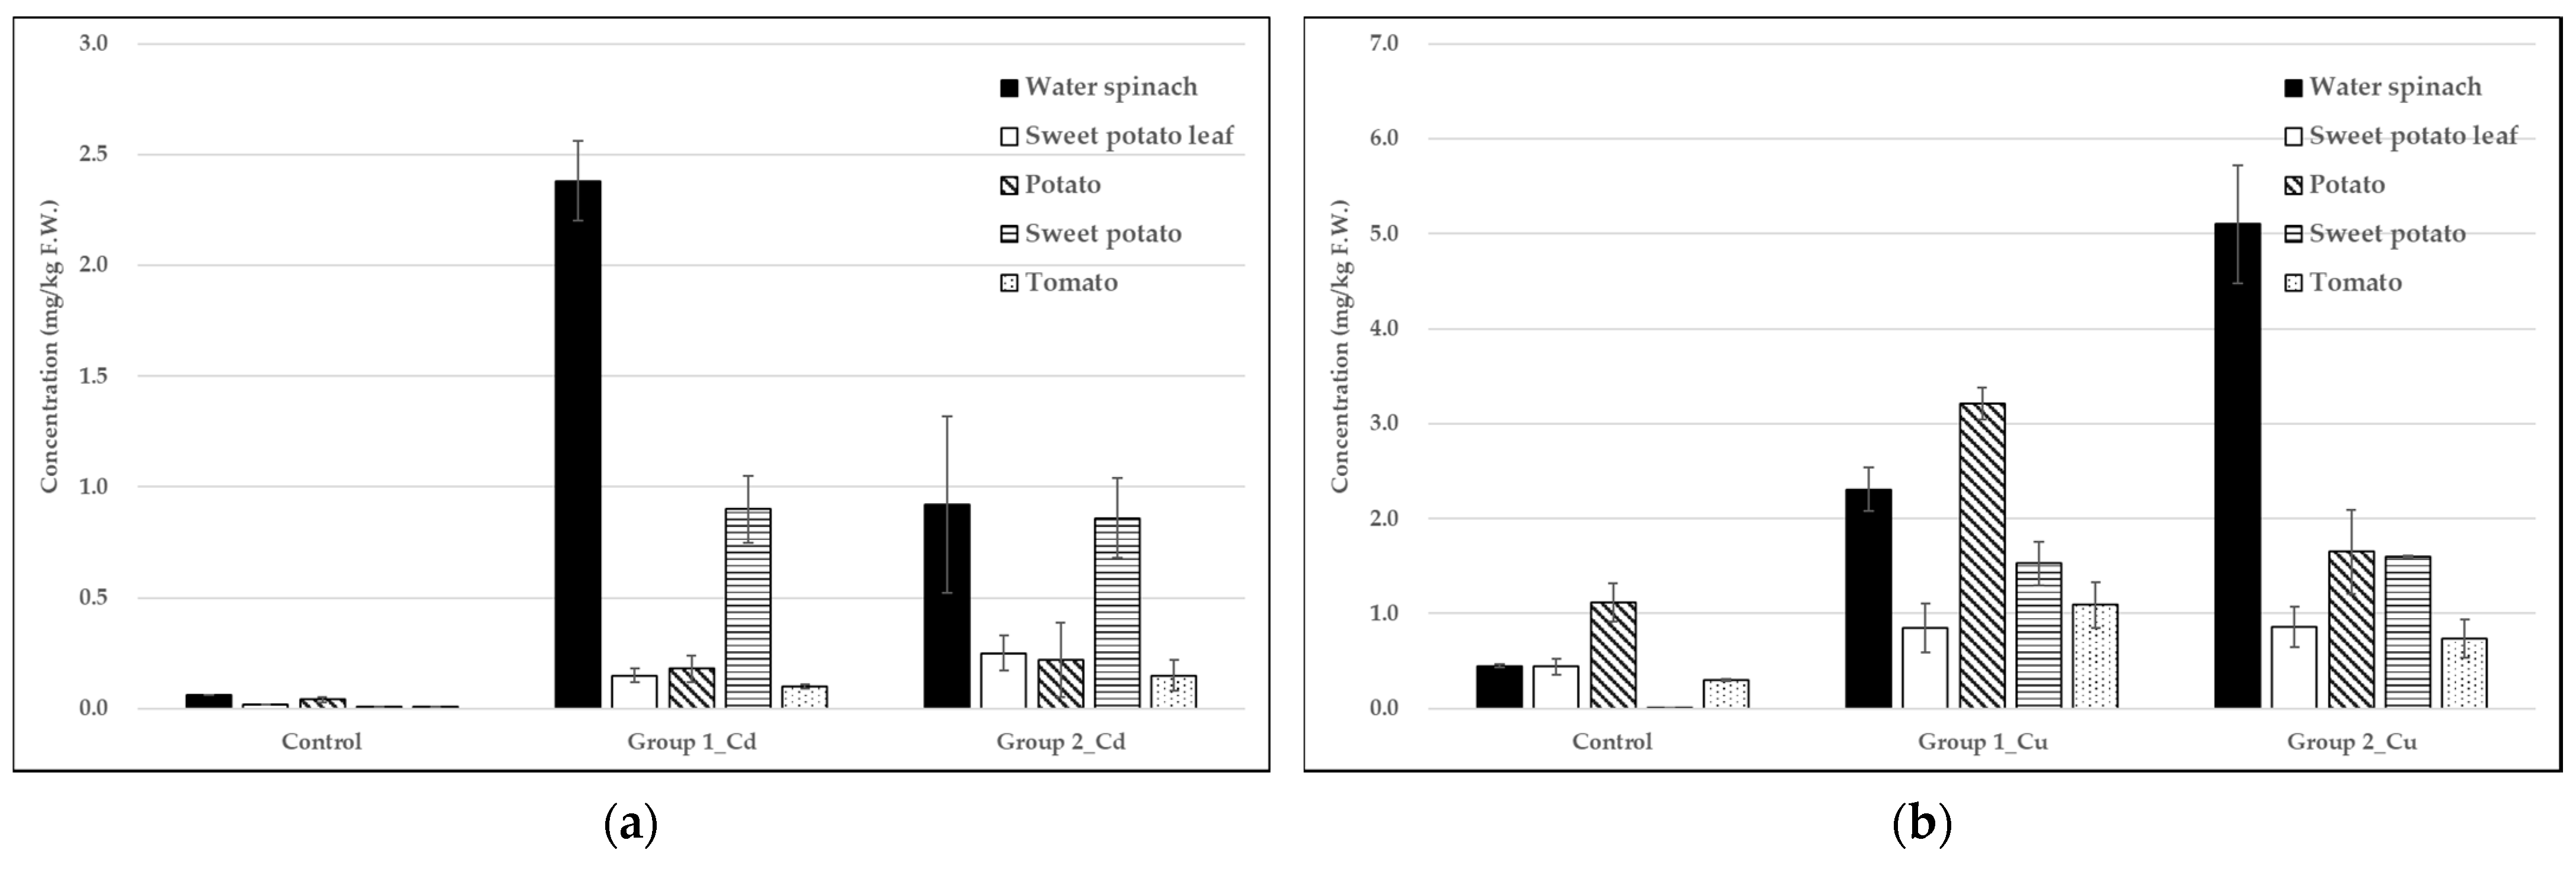
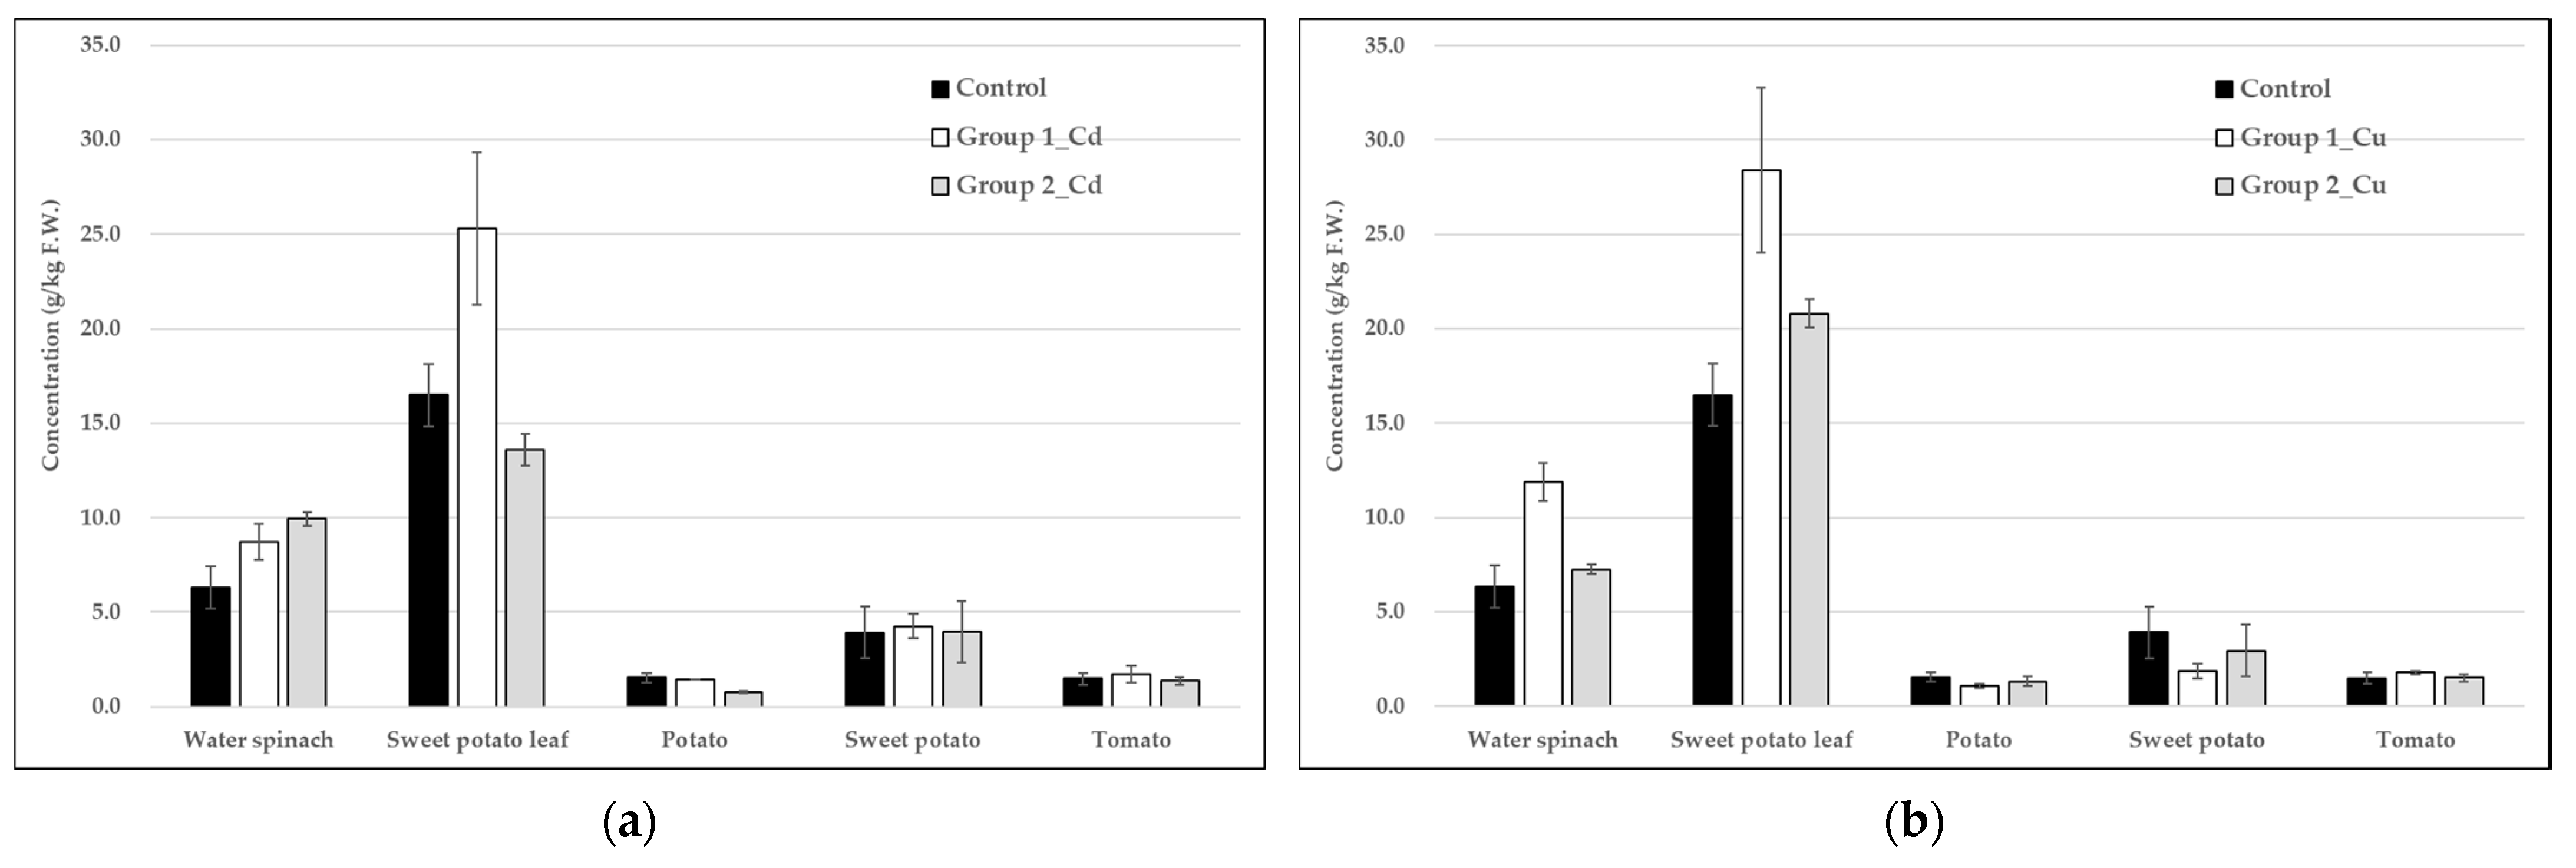
3.3. Analysis of Heavy Metals in Vegetables

Figure 2a presents the distribution of Cd concentrations in vegetables of the experimental and control groups. Briefly, the Cd concentrations of all vegetables in group 1 ranked in the order: water spinach (2.38 mg/kg) > sweet potato (0.90 mg/kg) > potato (0.18 mg/kg) > sweet potato leaves (0.15 mg/kg) > tomato (0.10 mg/kg). The Cd concentrations in group 2 ranked in the order: water spinach (0.92 mg/kg) > sweet potato (0.86 mg/kg) > sweet potato leaves (0.25 mg/kg) > potato (0.22 mg/kg) > tomato (0.15 mg/kg). A very low Cd concentration was found in all types of vegetable in the control group. Significantly different Cd concentrations were found in all of the investigated vegetables among the three soil contaminant soils, with the results indicating that water spinach becomes the most polluted with Cd as compared to the other vegetables in all experimental groups.
The Cu concentrations in group 1 (Figure 2b) were: potato (3.21 mg/kg) > water spinach (2.31 mg/kg) > sweet potato (1.53 mg/kg) > tomato (1.09 mg/kg) > sweet potato leaves (0.85 mg/kg). In group 2, the Cu concentrations ranked in the order: water spinach (5.10 mg/kg) > potato (1.65 mg/kg) > sweet potato (1.60 mg/kg) > sweet potato leaves (0.86 mg/kg) > tomato (0.74 mg/kg). These results show that potato and water spinach were most polluted by Cu among all of the observed vegetables.
Sarker et al. [39] monitored the heavy metal concentrations in different kinds of vegetables from agricultural fields in neighboring industrial areas in Bangladesh. Cd was found at significant levels in leafy vegetables, tubers, and fruits (0.003–1.60, 0.001–0.71, and 0.001–0.16 mg/kg, respectively), with the Cu concentrations being 0.86–5.80, 0.27–1.60, and 0.46–2.40, respectively. Zhuang et al. [20] carried out a similar analysis for vegetables in agricultural land near mining areas, showing that the bioaccumulation of heavy metals was significantly higher in leafy than in non-leafy vegetables. This is reflected in our results, where water spinach accumulated abundant Cd as compared to other plants. Khan et al. [40] highlights the potential health risks that are associated with vegetables cultivated in wastewater-contaminated soils, in particular the consumption of leafy vegetables that contain Cd, Cr, Ni, and Pb; and, Li et al. [41] showed a higher bioaccumulation factor (BAF) for Cd in leaf and root vegetables than in fruit vegetables. Our results were in agreement with those of Sarker et al. [39] and Zhuang et al. [20], and they clearly showed that leafy vegetables are more likely to accumulate heavy metals when compared to other vegetables. Sengar et al. [42] reported that, at the lethal concentration of Pb, the barriers in the root endodermis will be broken and cause Pb enter the vascular tissues. That may further affect the mineral nutrition and water balance, inactivate the enzymes activities, change the hormonal status, and then affect the membrane structure and permeability. Wang, Angle, Chaney, Delorme, and Reeves [43] reported that a lower pH influenced the metal uptake by plant, since Cd and Zn are more soluble at decreasing pH. Meanwhile, this may be due to the short growth period and fast growth rate of leafy vegetables, so the osmotic effect and absorption of nutrients from the soil are strong. During the growing period, exposure to harmful metals, such as Cd, may result in those metals participating with plant-specific metal transporters and competing with essential metal elements, such as iron, Ca, and Mn for active transport and accumulation in plants.

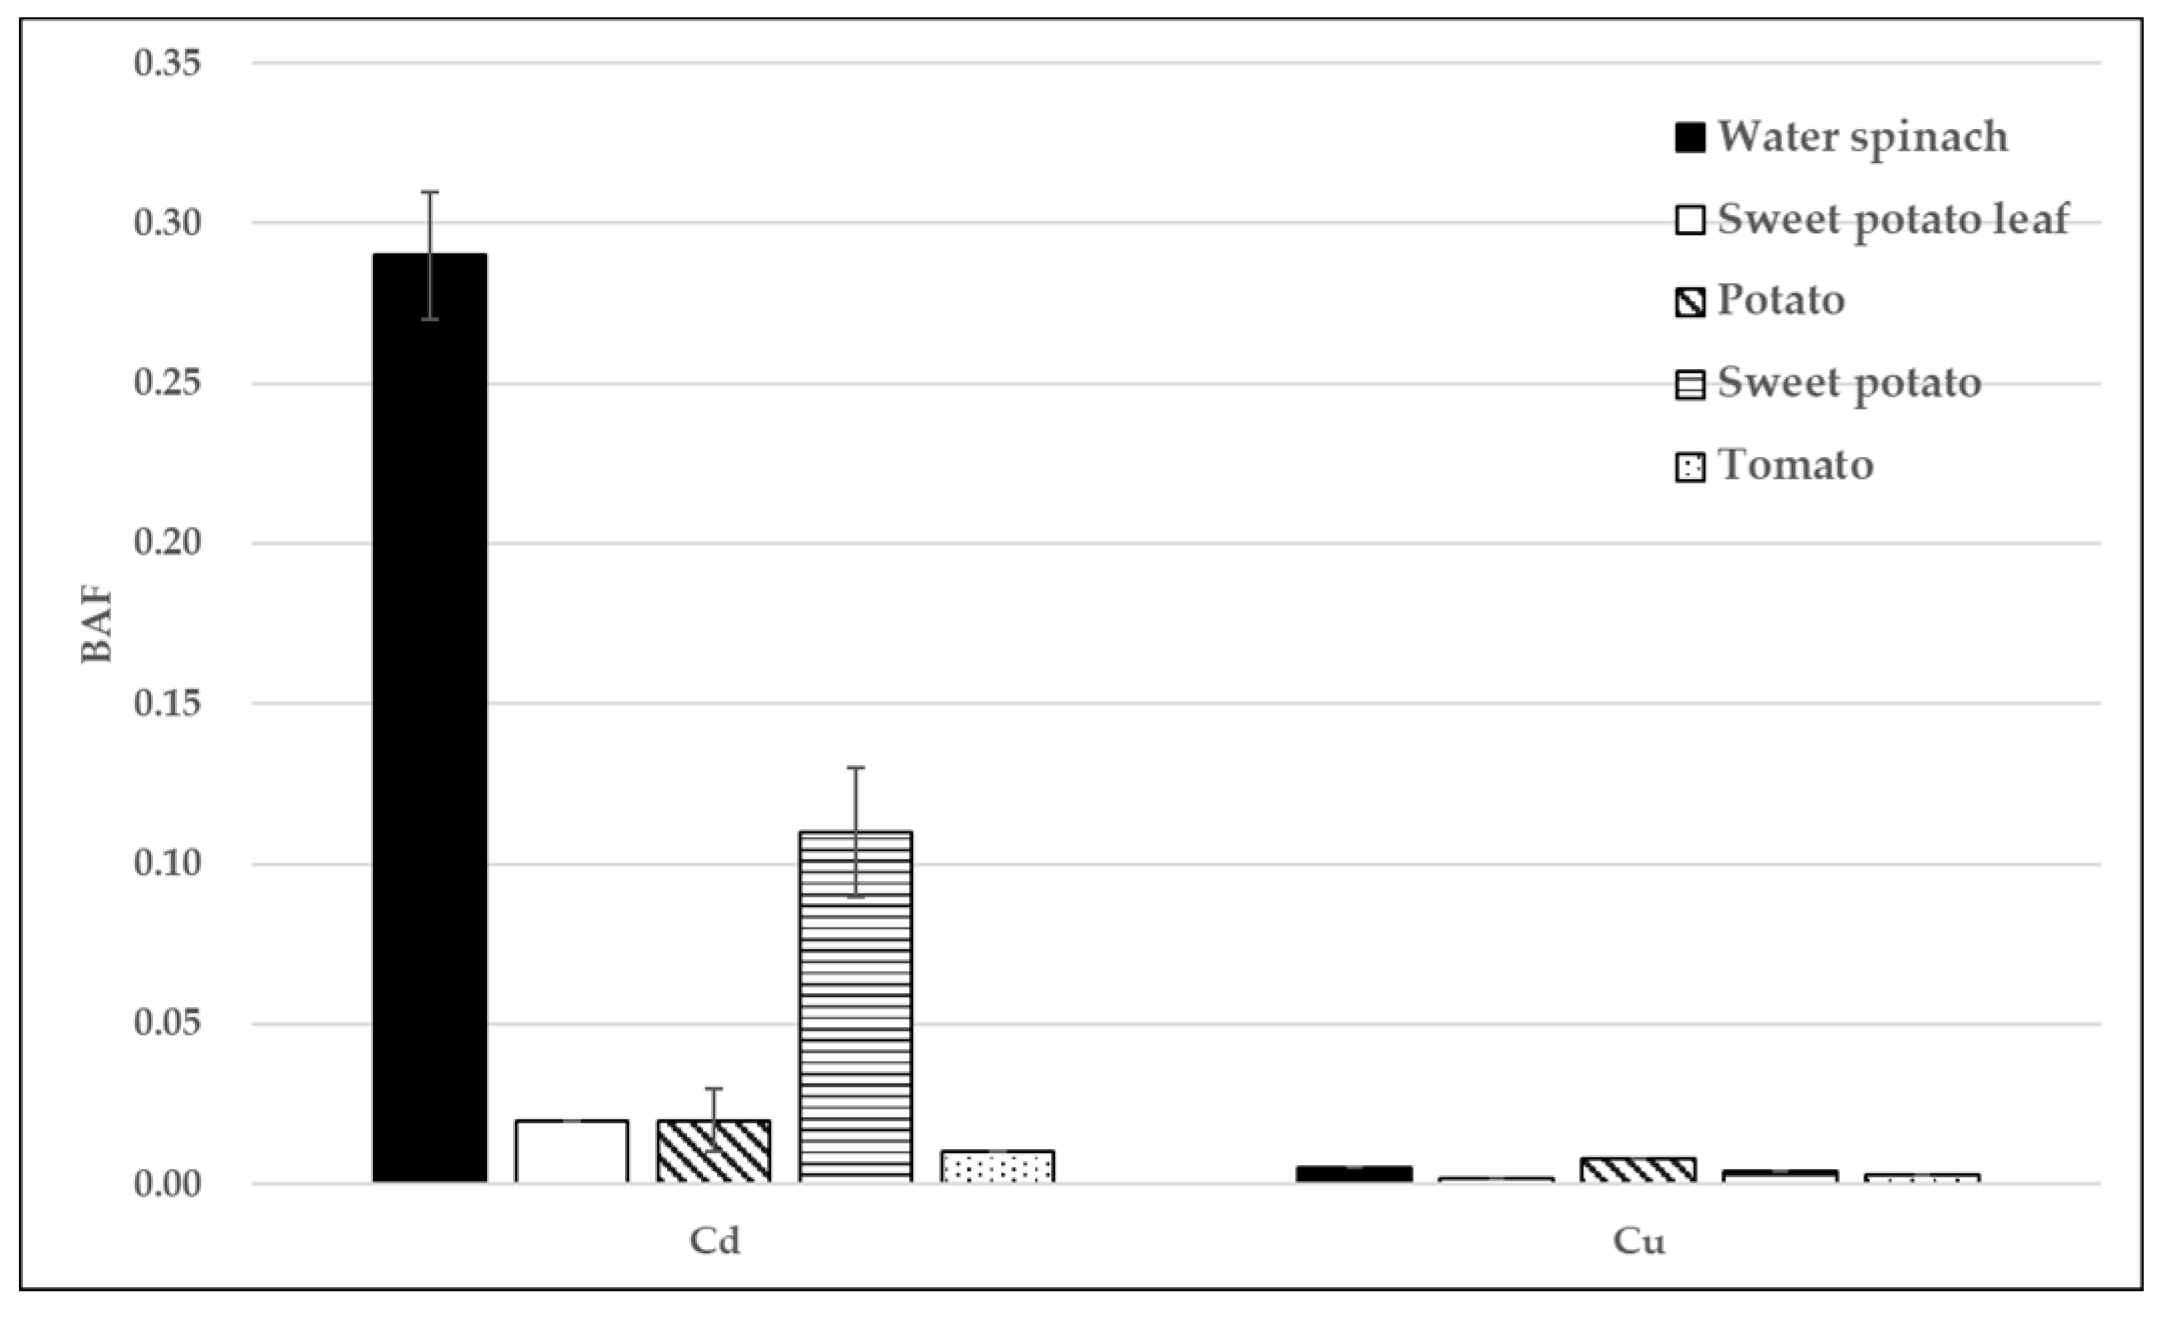
3.4. Bioaccumulation Factors of Heavy Metals in Vegetables

Metal BAF and Translocation Factor (TF) can used to evaluate metal uptake and transport by plant tissues, and TF values > 1 indicate the accumulation of metals under natural conditions [44].
Figure 3 shows the BAF of both Cd and Cu for all of the observed vegetables in group 1. The highest BAF for Cd was in water spinach (0.29), and the highest BAF for Cu was in potato (<0.01). Fan et al. [45] indicated that Cu was mainly accumulated in the root and leaf parts. It is well known that BAF variation depends on the metal, the plant species, soil pollution level, and soil acidity [29]. For example, BAF values were found to be >1 for Cr, Cd, Cu, Mn, Pb, and Zn in berseem clover (Trifolium alexandrinum) [44], which indicated that berseem was a suitable accumulator of these metals in natural conditions. Yari et al. [46] indicated that the TF value for Pb was >1 in maize shoots in three different soil textures. However, BAF for Cr, Ni, Cu, Cd, and Pb in cabbage leaves and broccoli heads were all <1, which revealed that cabbage and broccoli were poor accumulators [47]. We can conclude that BAF and TF are dependent on vegetable species and each metal. In the present study, although the BAF values in all plants were <1, the accumulation of Cd was higher than Cu specifically, consistent with reports from previous studies [16,48,49], as well as TF for Cd was also higher than for Cu [50]. In addition, Katrien [51] indicated that the solid–water distribution coefficient (Kd) of different metals influenced the distribution of chemicals migration into water from soil when Kd is low. For example, the uptake of Cd by Indian mustard and lettuce varied because of the larger root system in mustard and the planting season [52]. In conclusion, BAF varied depending on the properties of the observed heavy metals and vegetables.
The soil characteristics may influence the absorption ability of metal contaminants. For example, the components of clay, silt, and sand are relevant to the superficial content of soil, and positively related to the metal accumulation [53]; the ratio of clay > silt > sand of Cd-contaminated soil might provide high superficial content and high accumulation of Cd as compared to Cu. Meanwhile, high organic matter will cause a high adsorption of metals in soil, reducing their migration to cultivated plants [54]. The present study also showed a correlation between organic matter and Cd in water spinach, and organic matter and Cu in tomato and potato by Spearman correlation analysis (Tables S2-1 to S2-10). Therefore, the different components and characteristics of soil will influence the transportation and accumulation of metals.

3.5. Antioxidant Analysis in the Vegetables

We also measured the concentrations of antioxidants, such as vitamins C and E, in all samples in the experimental groups (Figure 4 and Figure 5). The respective vitamin C concentration in groups 1 and 2 with Cd exposure were significantly higher in sweet potato leaves (25.3 vs. 13.6 g/kg) and water spinach (8.72 vs. 9.94 g/kg) than in the control group (16.5 and 6.63 g/kg, respectively) (Figure 4a). In addition, significantly higher levels of vitamin C were found in the sweet potato leaves (28.4 vs. 20.8 g/kg) and water spinach (11.9 vs. 7.26 g/kg) in groups 1 and 2 with Cu contaminant as compared to the control group (Figure 4b). When comparing Vitamin C levels in Cd and Cu contaminant groups, vitamin C was active in sweet potato leaf and in water spinach in both contaminated scenarios.
Figure 5 presents the distribution of vitamin E concentrations in all vegetables of the contaminated soil groups for both Cd and Cu. The respective vitamin E concentrations in groups 1 and 2 with Cd exposure were similar, but higher in tomato (17.1 vs. 18.0 mg/kg) and sweet potato (17.0 vs. 27.3 mg/kg) than in water spinach (14.2 vs. 13.6 mg/kg), sweet potato leaves (9.61 vs. 2.32 mg/kg), and potato (5.58 vs. 3.78 mg/kg) as compared to the control group. Kongkachuichai et al. [55] found 15 local crops that were rich in various active natural substances, such as vitamin C (3.46–109 mg/100 g) and vitamin E (0.10–4.35 mg/100 g), in different types of leafy vegetables, as well as vitamin C at 15.2–101 mg/100 g in leaf vegetables [56], and vitamin E at 0.43–12.85 mg/kg in fruits [25], in order to establish a dietary guide for local people in Thailand. In another study, Collin et al. [26] carried out a pot experiment using artificial additives heavy metal (Cd and Cu) treated soils planted two hydroponic potted plants and analyzed the antioxidant levels for chlorophyll, carotenoids, vitamin C, and vitamin E after harvesting. In the Cd-contaminated soils, the concentrations of vitamin E increased significantly. Meanwhile, in the Cu-contaminated soils, the concentrations of vitamin C and vitamin E increased simultaneously. However, another study mentioned that there was a 70.58% reduction in vitamin C content in pakchoi shoots that were exposed to a mixture of Cd (20 mg/kg) and Cu (400 mg/kg) [27]. In the present study, we also found that vitamin C increased in sweet potato leaf and water spinach plants exposed to heavy metals, as well as an increase in vitamin E in most crops. Our results were in agreement with Collin et al. [26], who speculated that vitamin C and E aided in the tolerance to metals, and in particular that vitamin E was better than vitamin C during exposure to Cd.

3.6. Exposure Dose of Heavy Metals

Table 3 presents the P50-P95 exposure dose of Cd in different age groups. The highest Cd exposure dose was found in water spinach in different age groups of the Taiwan population, except for 0–3 years old. However, the highest exposure dose for 0–3 years was in sweet potato (0.0027–0.0086 mg/kg b.w./day), because sweet potato can be used as a by-product formula for infants and young children and, so, for the intake of this age group, is larger when compared to other types of vegetable.
Table 4 shows P50-P95 of Cu exposure doses from consuming vegetables in different age groups. The highest exposure dose for Cu was found in 0–3 years old for consuming sweet potato (0.0043–0.0137 mg/kg b.w./day). The highest exposure doses in the different age groups were not consistent, possibly because the Cu concentrations in water spinach, potato, and sweet potato are not significantly different.
Table 5 shows the P50-P95 of hazard quotient (HQ) for Cd from consuming different vegetables. The levels for 0–3 years old were 4.80–11.6 (all HQs being >1), while all HQs for Cu were <1 (Table 6). The intake of water spinach was identified as a major contributor to the estimated daily intake of two metals by the residents. Many researchers have identified that vegetables that are cultivated in soil with metals can pose a potential health risk for consumers [20,49,57], but Zhou et al. [58] suggested that the concentrations of metals decreased in the order: leafy vegetables > stalk vegetables/root vegetables/solanaceous vegetables > legume vegetables/melon vegetables. The current study also provided evidence of the risk within the safe range when consuming sweet potato leaf, potato, or tomato, indicating that the high accumulators (leafy vegetables) were unsuitable for being planted on contaminated soil.

4. Conclusions

This study clearly demonstrates that heavy metals accumulated in the five vegetables that were planted in the contaminated soils, especially so for water spinach. Meanwhile, Cd accumulation of all vegetables planted in the contaminated soils was greater than Cu accumulation. In Cd-contaminated soils, there was a significant effect on the growth and yield of potato and sweet potato, and there was also a significant effect on the growth and yield of sweet potato in the Cu-contaminated soils. In addition, our findings also demonstrated that, when the concentration of vitamins C and E significantly increased in water spinach and sweet potato leaves while it was planted in heavy metal-contaminated soils, in contrast, it significantly decreased in sweet potato and tomato.
The non-carcinogenic HI of Cd exposure from water spinach and sweet potato were >1, whereas those for Cu were <1. The current study suggests that vegetable consumers may experience health risks, and that children are the most vulnerable to the adverse effects of heavy metal ingestion. Meanwhile, the low accumulation rate that was seen in sweet potato leaf, potato, and tomato indicated their suitability for planting in suspected contaminated soil, such as at farms nearby metal industries, in replacement of other leafy vegetables with high accumulated character for metal contaminants, such as water spinach.

Supplementary Materials

The following are available online at https://www.mdpi.com/article/10.3390/app11093761/s1, Table S1: Demographic data of soil property of experiment group with Cd and Cu contaminants, Tables S2-1 to S2-10: Spearman correlation (r) between metal levels in soil and different vegetables, and Vitamins in different vegetables.

Author Contributions

Methodology, W.-H.C.; formal analysis, H.-Y.L.; resources, W.-L.H. and S.-F.C.; writing—original draft preparation, H.-Y.L. and H.-L.C.; writing—review and editing, H.-L.C.; funding acquisition, H.-L.C. All authors have read and agreed to the published version of the manuscript.

Funding

This research was funded by National Cheng Kung University (D108-F2523).

Institutional Review Board Statement

Not applicable.

Informed Consent Statement

Not applicable.

Conflicts of Interest

The authors declare no conflict of interest.

References

  1. Li, P.; Wang, X.; Zhang, T.; Zhou, D.; He, Y. Effects of several amendments on rice growth and uptake of copper and cadmium from a contaminated soil. J. Environ. Sci. 2008, 20, 449–455. [Google Scholar] [CrossRef]
  2. Akpor, O.; Muchie, M. Remediation of heavy metals in drinking water and wastewater treatment systems: Processes and applications. Int. J. Phys. Sci. 2010, 5, 1807–1817. [Google Scholar]
  3. Xie, L.; Hao, P.; Cheng, Y.; Ahmed, I.M.; Cao, F. Effect of combined application of lead, cadmium, chromium and copper on grain, leaf and stem heavy metal contents at different growth stages in rice. Ecotoxicol. Environ. Saf. 2018, 162, 71–76. [Google Scholar] [CrossRef]
  4. EPA. 2018 Annual Report Soil and Groundwater Pollution Remediation; EPA: Washington, DC, USA, 2018.
  5. Chmielnicka, J.; Cherian, M.G. Environmental exposure to cadmium and factors affecting trace-element metabolism and metal toxicity. Biol. Trace Element Res. 1986, 10, 243–262. [Google Scholar] [CrossRef]
  6. Levenson, C.; Janghorbani, M. Long-Term Measurement of Organ Copper Turnover in Rats by Continuous Feeding of a Stable Isotope. Anal. Biochem. 1994, 221, 243–249. [Google Scholar] [CrossRef]
  7. Huff, J.; Lunn, R.M.; Waalkes, M.P.; Tomatis, L.; Infante, P.F. Cadmium-induced Cancers in Animals and in Humans. Int. J. Occup. Environ. Health 2007, 13, 202–212. [Google Scholar] [CrossRef] [PubMed] [Green Version]
  8. Andujar, P.; Bensefa-Colas, L.; Descatha, A. Acute and chronic cadmium poisoning. La Rev. Méd. Interne 2010, 31, 107–115. [Google Scholar] [CrossRef] [PubMed] [Green Version]
  9. Matovic, V.; Buha, A.; Bulat, Z.; Dukic-Cosic, D. Cadmium toxicity revisited: Focus on oxidative stress induction and interactions with zinc and magnesium. Arch. Ind. Hyg. Toxicol. 2011, 62, 65–76. [Google Scholar] [CrossRef] [PubMed] [Green Version]
  10. Pinto, A.P.; Mota, A.; De Varennes, A.; Pinto, F. Influence of organic matter on the uptake of cadmium, zinc, copper and iron by sorghum plants. Sci. Total. Environ. 2004, 326, 239–247. [Google Scholar] [CrossRef] [PubMed]
  11. Yamada, M.; Asakura, K.; Sasaki, S.; Hirota, N.; Notsu, A.; Todoriki, H.; Miura, A.; Fukui, M.; Date, C. Estimation of intakes of copper, zinc, and manganese in Japanese adults using 16-day semi-weighed diet records. Asia Pac. J. Clin. Nutr. 2014, 23, 465–472. [Google Scholar] [PubMed]
  12. Kendall, N.R.; Holmes-Pavord, H.R.; Bone, P.A.; Ander, E.L.; Young, S.D. Liver copper concentrations in cull cattle in the UK: Are cattle being copper loaded? Vet. Rec. 2015, 177, 493. [Google Scholar] [CrossRef] [PubMed] [Green Version]
  13. Wu, M.; Han, F.; Gong, W.; Feng, L.; Han, J. The effect of copper from water and food: Changes of serum nonceruloplasmin copper and brain’s amyloid-beta in mice. Food Funct. 2016, 7, 3740–3747. [Google Scholar] [CrossRef] [PubMed]
  14. Sipter, E.; Rózsa, E.; Gruiz, K.; Tátrai, E.; Morvai, V. Site-specific risk assessment in contaminated vegetable gardens. Chemosphere 2008, 71, 1301–1307. [Google Scholar] [CrossRef] [PubMed]
  15. Qadir, M.; Wichelns, D.; Raschid-Sally, L.; McCornick, P.; Drechsel, P.; Bahri, A.; Minhas, P. The challenges of wastewater irrigation in developing countries. Agric. Water Manag. 2010, 97, 561–568. [Google Scholar] [CrossRef] [Green Version]
  16. Intawongse, M.; Dean, J.R. Uptake of heavy metals by vegetable plants grown on contaminated soil and their bioavailability in the human gastrointestinal tract. Food Addit. Contam. 2006, 23, 36–48. [Google Scholar] [CrossRef] [PubMed] [Green Version]
  17. Anwar, S.; Nawaz, M.F.; Gul, S.; Rizwan, M.; Ali, S.; Kareem, A. Uptake and distribution of minerals and heavy metals in commonly grown leafy vegetable species irrigated with sewage water. Environ. Monit. Assess. 2016, 188, 541. [Google Scholar] [CrossRef] [PubMed]
  18. Balkhair, K.S.; Ashraf, M.A. Field accumulation risks of heavy metals in soil and vegetable crop irrigated with sewage water in western region of Saudi Arabia. Saudi J. Biol. Sci. 2016, 23, S32–S44. [Google Scholar] [CrossRef] [Green Version]
  19. Hussain, A.; Alamzeb, S.; Begum, S. Accumulation of heavy metals in edible parts of vegetables irrigated with waste water and their daily intake to adults and children, District Mardan, Pakistan. Food Chem. 2013, 136, 1515–1523. [Google Scholar]
  20. Zhuang, P.; McBride, M.B.; Xia, H.; Li, N.; Li, Z. Health risk from heavy metals via consumption of food crops in the vicinity of Dabaoshan mine, South China. Sci. Total. Environ. 2009, 407, 1551–1561. [Google Scholar] [CrossRef]
  21. Monsen, E.R. Dietary Reference intakes for the antioxidant nutrients: Vitamin C, vitamin E, selenium, and carotenoids. J. Am. Diet. Assoc. 2000, 100, 637–640. [Google Scholar] [CrossRef]
  22. Kuhnlein, H.; Barthet, V.; Farren, A.; Falahi, E.; Leggee, D.; Receveur, O.; Berti, P. Vitamins A, D, and E in Canadian Arctic traditional food and adult diets. J. Food Compos. Anal. 2006, 19, 495–506. [Google Scholar] [CrossRef]
  23. Ambrosini, G.L.; De Klerk, N.H.; Fritschi, L.; Mackerras, D.; Musk, B. Fruit, vegetable, vitamin A intakes, and prostate cancer risk. Prostate Cancer Prostatic Dis. 2007, 11, 61–66. [Google Scholar] [CrossRef] [PubMed] [Green Version]
  24. Haard, N.F. Postharvest physiology and biochemistry of fruits and vegetables. J. Chem. Educ. 1984, 61, 277–283. [Google Scholar] [CrossRef] [Green Version]
  25. Orsavová, J.; Hlaváčová, I.; Mlček, J.; Snopek, L.; Mišurcová, L. Contribution of phenolic compounds, ascorbic acid and vitamin E to antioxidant activity of currant (Ribes L.) and gooseberry (Ribes uva-crispa L.) fruits. Food Chem. 2019, 284, 323–333. [Google Scholar] [CrossRef] [PubMed]
  26. Collin, V.C.; Eymery, F.; Genty, B.; Rey, P.; Havaux, M. Vitamin E is essential for the tolerance of Arabidopsis thaliana to metal-induced oxidative stress. Plant Cell Environ. 2007, 31, 244–257. [Google Scholar] [CrossRef]
  27. Hou, S.; Zheng, N.; Tang, L.; Ji, X. Effects of cadmium and copper mixtures to carrot and pakchoi under greenhouse cultivation condition. Ecotoxicol. Environ. Saf. 2018, 159, 172–181. [Google Scholar] [CrossRef] [PubMed]
  28. Lai, H.-Y.; Chen, B.-C. The Dynamic Growth Exhibition and Accumulation of Cadmium of Pak Choi (Brassica campestris L. ssp. chinensis) Grown in Contaminated Soils. Int. J. Environ. Res. Public Health 2013, 10, 5284–5298. [Google Scholar] [CrossRef] [Green Version]
  29. Sipter, E.; Auerbach, R.; Gruiz, K.; Mathe-Gaspar, G. Change of Bioaccumulation of Toxic Metals in Vegetables. Commun. Soil Sci. Plant Anal. 2009, 40, 285–293. [Google Scholar] [CrossRef]
  30. Chang, W.H.; Liu, S.C.; Chen, H.L.; Lee, C.C. Dietary intake of 4-nonylphenol and bisphenol A in Taiwanese population: Integrated risk assessment based on probabilistic and sensitive approach. Environ. Pollut. 2019, 244, 143–152. [Google Scholar] [CrossRef]
  31. Lee, C.C.; Chang, W.H.; Chen, H.L. Dietary exposure and risk assessment of exposure to hexabromocyclododecanes in a Taiwan population. Environ. Pollut. 2019, 249, 728–734. [Google Scholar] [CrossRef]
  32. Zeng, X.-B.; Li, L.-F.; Mei, X.-R. Heavy Metal Content in Chinese Vegetable Plantation Land Soils and Related Source Analysis. Agric. Sci. China 2008, 7, 1115–1126. [Google Scholar] [CrossRef]
  33. Lin, Y.-W.; Liu, T.-S.; Guo, H.-Y.; Chiang, C.-M.; Tang, H.-J.; Chen, H.-T.; Chen, J.-H. Relationships between Cd concentrations in different vegetables and those in arable soils, and food safety evaluation of vegetables in Taiwan. Soil Sci. Plant Nutr. 2015, 61, 983–998. [Google Scholar] [CrossRef] [Green Version]
  34. Sun, Y.; Zhou, Q.; Diao, C. Effects of cadmium and arsenic on growth and metal accumulation of Cd-hyperaccumulator Solanum nigrum L. Bioresour. Technol. 2008, 99, 1103–1110. [Google Scholar] [CrossRef] [PubMed]
  35. EPA. 2016 Annual Report Soil and Groundwater Pollution Remediation; EPA: Washington, DC, USA, 2016.
  36. Ahada, C.; Patel, A. Effects of Heavy Metals (Cu and Cd) on Growth of Leafy Vegetables Spinacia oleracea and Amaranthus caudatus. Int. Res. J. Environ. Sci. 2015, 4, 63–69. [Google Scholar]
  37. Peralta, J.R.; Gardea-Torresdey, J.L.; Tiemann, K.J.; Gomez, E.; Arteaga, S.; Rascon, E.; Parsons, J.G. Uptake and effects of five heavy metals on seed germination and plant growth in alfalfa (Medicago sativa L.). Bull. Environ. Contam. Toxicol. 2001, 66, 727–734. [Google Scholar] [CrossRef] [PubMed]
  38. Li, Z.; Schneider, R.L.; Morreale, S.J.; Xie, Y.; Li, C.; Li, J. Woody organic amendments for retaining soil water, improving soil properties and enhancing plant growth in desertified soils of Ningxia, China. Geoderma 2018, 310, 143–152. [Google Scholar] [CrossRef]
  39. Islam, M.S.; Khanam, M.S.; Sarker, N.I. Health risk assessment of metals transfer from soil to the edible part of some vegetables grown in Patuakhali province of Bangladesh. Arch. Agric. Environ. Sci. 2018, 3, 187–197. [Google Scholar] [CrossRef]
  40. Khan, S.; Aijun, L.; Zhang, S.; Hu, Q.; Zhu, Y.-G. Accumulation of polycyclic aromatic hydrocarbons and heavy metals in lettuce grown in the soils contaminated with long-term wastewater irrigation. J. Hazard. Mater. 2008, 152, 506–515. [Google Scholar] [CrossRef]
  41. Li, R.; Zhou, Z.; Xie, X.; Li, Y.; Zhang, Y.; Xu, X. Effects of Dissolved Organic Matter on Uptake and Translocation of Lead in Brassica chinensis and Potential Health Risk of Pb. Int. J. Environ. Res. Public Health 2016, 13, 687. [Google Scholar] [CrossRef] [Green Version]
  42. Sengar, R.S.; Gautam, M.; Garg, S.K.; Sengar, K.; Chaudhary, R. Lead Stress Effects on Physiobiochemical Activities of Higher Plants. Rev. Environ. Contam. Toxicol. 2008, 196, 73–93. [Google Scholar] [CrossRef]
  43. Wang, A.S.; Angle, J.S.; Chaney, R.L.; Delorme, T.A.; Reeves, R.D. Soil pH Effects on Uptake of Cd and Zn by Thlaspi caerulescens. Plant Soil 2006, 281, 325–337. [Google Scholar] [CrossRef]
  44. Bhatti, S.S.; Kumar, V.; Sambyal, V.; Singh, J.; Nagpal, A.K. Comparative analysis of tissue compartmentalized heavy metal uptake by common forage crop: A field experiment. Catena 2018, 160, 185–193. [Google Scholar] [CrossRef]
  45. Fan, Y.; Li, Y.; Li, H.; Cheng, F. Evaluating heavy metal accumulation and potential risks in soil-plant systems applied with magnesium slag-based fertilizer. Chemosphere 2018, 197, 382–388. [Google Scholar] [CrossRef] [PubMed]
  46. Yari, M.; Rahimi, G.; Ebrahimi, E.; Sadeghi, S.; Fallah, M.; Ghesmatpoor, E. Effect of Three Types of Organic Fertilizers on the Heavy Metals Transfer Factor and Maize Biomass. Waste Biomass Valoriz. 2016, 8, 2681–2691. [Google Scholar] [CrossRef]
  47. Antonious, G.F.; Kochhar, T.S.; Coolong, T. Yield, quality, and concentration of seven heavy metals in cabbage and broccoli grown in sewage sludge and chicken manure amended soil. J. Environ. Sci. Health Part A 2012, 47, 1955–1965. [Google Scholar] [CrossRef]
  48. Wang, Y.; Qiao, M.; Liu, Y.; Zhu, Y. Health risk assessment of heavy metals in soils and vegetables from wastewater irrigated area, Beijing-Tianjin city cluster, China. J. Environ. Sci. 2012, 24, 690–698. [Google Scholar] [CrossRef]
  49. Bi, C.; Zhou, Y.; Chen, Z.; Jia, J.; Bao, X. Heavy metals and lead isotopes in soils, road dust and leafy vegetables and health risks via vegetable consumption in the industrial areas of Shanghai, China. Sci. Total. Environ. 2018, 619, 1349–1357. [Google Scholar] [CrossRef]
  50. Alam, M.; Snow, E.; Tanaka, A. Arsenic and heavy metal contamination of vegetables grown in Samta village, Bangladesh. Sci. Total. Environ. 2003, 308, 83–96. [Google Scholar] [CrossRef]
  51. Katrien, D. Voluntary risk assessment of copper, copper ii sulphate pentahydrate, copper(i)oxide, copper(ii)oxide, dicopper chloride trihydroxide Euro. In Union Risk Assessment Report; JRC: Brussels, Belgium, 2008. [Google Scholar]
  52. Manciulea, A.; Ramsey, M.H. Effect of scale of Cd heterogeneity and timing of exposure on the Cd uptake and shoot biomass, of plants with a contrasting root morphology. Sci. Total. Environ. 2006, 367, 958–967. [Google Scholar] [CrossRef]
  53. Anderson, P.R.; Christensen, T.H. Distribution coefficients of Cd, Co, Ni, and Zn in soils. J. Soil Sci. 1988, 39, 15–22. [Google Scholar] [CrossRef]
  54. Mayer, L.M.; Xing, B. Organic Matter-Surface Area Relationships in Acid Soils. Soil Sci. Soc. Am. J. 2001, 65, 250–258. [Google Scholar] [CrossRef]
  55. Kongkachuichai, R.; Charoensiri, R.; Yakoh, K.; Kringkasemsee, A.; Insung, P. Nutrients value and antioxidant content of indigenous vegetables from Southern Thailand. Food Chem. 2015, 173, 838–846. [Google Scholar] [CrossRef]
  56. Gupta, S.; Prakash, J. Studies on Indian Green Leafy Vegetables for Their Antioxidant Activity. Plant Foods Hum. Nutr. 2008, 64, 39–45. [Google Scholar] [CrossRef] [PubMed]
  57. Li, B.; Wang, Y.; Jiang, Y.; Li, G.; Cui, J.; Wang, Y.; Zhang, H.; Wang, S.; Xu, S.; Wang, R. The accumulation and health risk of heavy metals in vegetables around a zinc smelter in northeastern China. Environ. Sci. Pollut. Res. 2016, 23, 25114–25126. [Google Scholar] [CrossRef]
  58. Zhou, H.; Yang, W.-T.; Zhou, X.; Liu, L.; Gu, J.-F.; Wang, W.-L.; Zou, J.-L.; Tian, T.; Peng, P.-Q.; Liao, B.-H. Accumulation of Heavy Metals in Vegetable Species Planted in Contaminated Soils and the Health Risk Assessment. Int. J. Environ. Res. Public Health 2016, 13, 289. [Google Scholar] [CrossRef] [PubMed] [Green Version]
Figure 1. The comparison of metal levels in soils of control, group 1 and group 2: (a) Cd level; and, (b) Cu level.
Applsci 11 03761 g001
Figure 2. The comparison of metal levels in different vegetables of control, group 1 and group 2: (a) Cd level; and, (b) Cu level (mg/kg F.W.).
Applsci 11 03761 g002
Figure 3. BAF of Cd and Cu in different vegetables in contaminant soils.
Applsci 11 03761 g003
Figure 4. The comparison of Vitamin C levels in different vegetables of control, group 1 and group 2: (a) Cd level; (b) Cu level (g/kg F.W.).
Applsci 11 03761 g004
Figure 5. The comparison of Vitamin E levels in different vegetables of control, group 1 and group 2: (a) Cd level; (b) Cu level (g/kg F.W.).
Applsci 11 03761 g005
Table 1. The growth data of the vegetables in both contaminated-Cd groups and control group.
Planting Time (Week)Water SpinachSweet Potato Leaf
Group 1_CdGroup 2_CdControlp-ValueGroup 1_CdGroup 2_CdControlp-Value
Planting height (cm)1st0.00 ± 0.001.33 ± 1.531.33 ± 1.150.2347.67 ± 1.157.67 ± 1.538.00 ± 2.650.870
2nd3.67 ± 1.153.67 ± 2.083.67 ± 1.530.98811.0 ± 1.0016.3 ± 1.1517.3 ± 2.080.054
3rd8.67 ± 1.159.67 ± 1.1513.7 ± 1.530.048 *21.7 ± 1.1526.3 ± 2.5233.3 ± 7.640.050
4th27.0 ± 1.0023.0 ± 2.0030.7 ± 5.510.82029.0 ± 5.2942.7 ± 5.5147.7 ± 8.080.051
5th34.0 ± 2.6530.0 ± 2.6541.0 ± 5.290.047 *34.0 ± 9.6456.0 ± 10.864.0 ± 12.20.079
Harvest weight (g)44.2 ± 5.1056.0 ± 25.552.8 ± 6.880.39351.0 ± 6.6362.0 ± 15.155.1 ± 3.270.491
Planting time (month)PotatoSweet potatoTomato
Group 1_CdGroup 2_CdControlp-valueGroup 1_CdGroup 2_CdControlp-valueGroup 1_CdGroup 2_CdControlp-value
Harvest weight (g)15.5 ± 5.7227.2 ± 2.1982.8 ± 20.40.027 *62.0 ± 12.125.0 ± 21.1143 ± 9.610.032 *39.5 ± 11.231.8 ± 16.260.4 ± 13.20.184
Number of
harvested
912150.074125230.025 *1514280.084
Note: 1. all data were showed as mean ± standard deviation (n = 3 and 1 plant in each pot); 2. : number of harvested” was sum of three pots; *: p < 0.05
Table 2. The growth data of the vegetables in both contaminated-Cu groups and control group.
Planting Time (Week)Water SpinachSweet Potato Leaf
Group 1_CuGroup 2_CuControlp-ValueGroup 1_CuGroup 2_CuControlp-Value
Planting height (cm)1st0.00 ± 0.001.00 ± 1.001.33 ± 1.150.2116.33 ± 1.539.67 ± 1.538.00 ± 2.650.194
2nd2.67 ± 1.152.67 ± 1.533.67 ± 1.530.5659.67 ± 2.0815.3 ± 2.5217.3 ± 2.080.048 *
3rd7.67 ± 2.0810.7 ± 1.5313.7 ± 1.530.047 *23.3 ± 4.1628.0 ± 4.0033.3 ± 7.640.172
4th25.3 ± 2.5220.0 ± 3.6130.7 ± 5.510.05430.0 ± 8.8940.0 ± 4.5847.7 ± 8.080.172
5th29.3 ± 2.5227.0 ± 1.7341.0 ± 5.290.05041.0 ± 12.855.0 ± 8.0064.0 ± 12.20.172
Harvest weight (g)52.0 ± 2.9572.4 ± 10.552.8 ± 6.880.06344.2 ± 15.372.5 ± 32.055.1 ± 3.270.329
Planting time (month)PotatoSweet potatoTomato
Group 1_CuGroup 2_CuControlp-valueGroup 1_CuGroup 2_CuControlp-valueGroup 1_CuGroup 2_CuControlp-value
Harvest weight (g)77.6 ± 39.128.1 ± 3.8282.8 ± 20.40.066107 ± 24.618.2 ± 3.83143 ± 9.610.027 *30.7 ± 12.233.5 ± 19.760.4 ± 13.20.118
Number of
harvested
1012150.463214230.048 *1715280.146
Note: 1. all data were showed as mean ± standard deviation (n = 3 and 1 plant in each pot); 2. : number of harvested” was sum of three pots; *: p < 0.05
Table 3. 50th–95th percentile of dietary exposures (mg/kg b.w./day) to Cd by consuming vegetables in all age groups.
AgeWater SpinachSweet Potato LeafPotatoSweet PotatoTomato
0–30.0014–0.00430.0001–0.00030.0001–0.00030.0027–0.00860.0001–0.0005
3–60.0014–0.00420.0001–0.00030.0001–0.00020.0005–0.00140.0002–0.0006
6–120.0018–0.00580.0001–0.00040.0002–0.00060.0007–0.00220.0001–0.0004
12–160.0009–0.00280.0001–0.00020.0001–0.00040.0003–0.00080.0001–0.0003
16–180.0013–0.00390.0001–0.00030.0001–0.00030.0003–0.00080.0001–0.0002
19–650.0024–0.00700.0002–0.00050.0000–0.00020.0004–0.00110.0001–0.0004
>650.0033–0.00970.0002–0.00060.0001–0.00020.0005–0.00160.0001–0.0003
Table 4. 50th–95th percentile of dietary exposures (mg/kg b.w./day) to Cu by consuming vegetables in all age groups.
AgeWater SpinachSweet Potato LeafPotatoSweet PotatoTomato
0–30.0013–0.00420.0005–0.00170.0016–0.00510.0043–0.01370.0015–0.0049
3–60.0013–0.00400.0005–0.00160.0011–0.00320.0008–0.00230.0020–0.0061
6–120.0017–0.00570.0007–0.00220.0035–0.01130.0011–0.00370.0013–0.0042
12–160.0008–0.00260.0003–0.00110.0024–0.00770.0004–0.00130.0010–0.0031
16–180.0012–0.00380.0005–0.00150.0017–0.00520.0004–0.00140.0007–0.0022
19–650.0023–0.00670.0009–0.00270.0009–0.00260.0006–0.00170.0015–0.0046
>650.0031–0.00930.0012–0.00370.0011–0.00340.0008–0.00240.0011–0.0034
Table 5. Hazard index of Cd intake by age groups.
AgeWater SpinachSweet Potato LeafPotatoSweet PotatoTomatoHI
0–31.40–4.360.09–0.280.09–0.292.70–8.690.15–0.454.80–11.6
3–61.42–4.190.09–0.270.06–0.190.47–1.410.19–0.572.40–5.44
6–121.81–5.820.12–0.380.19–0.650.68–2.260.12–0.393.18–7.77
12–160.87–2.750.06–0.180.13–0.440.25–0.820.09–0.291.52–3.65
16–181.27–3.960.08–0.260.09–0.290.27–0.850.07–0.211.88–4.74
19–652.38–7.020.15–0.450.05–0.150.36–1.080.14–0.423.20–7.97
>653.27–9.630.21–0.620.06–0.190.52–1.540.10–0.314.36–10.8
Table 6. Hazard index of Cu intake by age groups.
AgeWater SpinachSweet Potato LeafPotatoSweet PotatoTomatoHI
0–30.03–0.110.01–0.040.04–0.130.11–0.340.04–0.120.26–0.56
3–60.03–0.100.01–0.040.03–0.080.02–0.060.05–0.150.16–0.31
6–120.04–0.140.02–0.060.09–0.280.03–0.090.03–0.110.23–0.52
12–160.02–0.070.01–0.030.06–0.190.01–0.030.02–0.080.14–0.30
16–180.03–0.090.01–0.040.04–0.130.01–0.030.02–0.060.13–0.26
19–650.06–0.170.02–0.070.02–0.070.01–0.040.04–0.110.17–0.33
>650.08–0.230.03–0.090.03–0.090.02–0.060.03–0.080.21–0.40
Publisher’s Note: MDPI stays neutral with regard to jurisdictional claims in published maps and institutional affiliations.

