Article

The Effect of Cu (II) on Swelling and Shrinkage Characteristics of Sodium Bentonite in Landfills

1
Faculty of Engineering, China University of Geosciences, Wuhan 430000, China
2
College of Civil Engineering and Architecture, Guilin University of Technology, Guilin 541000, China
3
Nanning City Investment Group Modern Industrial Park Development Co., Ltd., Nanning 530000, China
*
Authors to whom correspondence should be addressed.
Appl. Sci. 2021, 11(9), 3881; https://doi.org/10.3390/app11093881
Submission received: 20 March 2021 / Revised: 16 April 2021 / Accepted: 19 April 2021 / Published: 25 April 2021

Abstract

:
Wastes in municipal landfills will release heavy metal cations over a long period of time. Therefore, the objective of this paper was to investigate the effect of copper (Cu) in the leachate from landfill on the swell-shrinking potential of bentonite liner. Copper sulfate solution with 4 different groups of concentrations (0 g/L, 2.5 g/L, 5 g/L, 10 g/L) were added to bentonite for conducting a series of swelling and shrinkage experiments. Then the Does Response model was used to describe the swelling and shrinkage process of bentonite in different copper sulfate solutions and the applicability of the model was evaluated. At the same time, clay mineral analysis experiments (XRD and XRF) were carried out to analyze the variation of interlayer space and element content of montmorillonite. The results show that the swell volume of bentonite decreases with the increase of the concentration of Cu (II). The rate of swelling was high and inversely proportional to the concentration of Cu (II). The shrinkage curve of bentonite could be divided into uniform velocity stage, variable velocity stage, and stable stage. The shrinkage rate at the uniform velocity stage and shrinkage at the stable stage decreased with the increase of the concentration of Cu (II). The model was suitable for describing swelling (or shrinkage) curves with smaller expansibility (or shrinkage). Results of XRD and XRF show that the erosion of Cu (II) led to the decrease of Na+ content in sodium bentonite, and then narrowed interlayer space of montmorillonite. When the solution concentration increases, both values of interlayer space of montmorillonite and Na+ content in sodium bentonite become lower, and that led to swelling and shrinkage of bentonite liner was getting smaller and smaller.

1. Introduction

Landfilling is the most common way to eliminate solid municipal wastes. Consequently, the issue of the production of leachates was accompanying [1]. Leachate, referred to as a kind of liquid with complex composition and a great threat to the ecological environment, was formed by the infiltration of groundwater and surface water due to garbage centralized in landfills and that had been buried. Furthermore, the liquid in waste by anaerobic decomposition were also produced [2,3,4,5,6]. In this process, heavy metals and various organic compounds were the main pollutants in leachate, in which, many heavy metals such as cadmium (Cd), lead (Pb), arsenic (As), and copper (Cu) can be found [7]. Once those copper intruded into the soil, they may be absorbed by plants and then enriched, which can cause great harm to human health [8,9,10]. Therefore, it was important to control the seepage of leachate and avoid the pollutants from erosion. As clays, such as bentonite, show many advantages in cost-effectivity, a wide range of sources, and practicality, it was considered as one of the commonly used raw materials to make impervious buffer liner [11,12,13]. Herein, bentonite was a layered silicate clay with a large specific surface area, and its main component was montmorillonite. Bentonite shows extremely high swelling ability due to its microstructure: when it reacts with water, leading to the squeeze of the volume of micro-pore in the clay, and caused a great decrease in permeability [14,15,16,17,18]. There were many exchangeable cations between layers of montmorillonite [19], which had strong cation exchange capacity and were prone to unequal cation substitution. It also can effectively adsorb heavy metal ions in water [8]. Therefore, the discharge and leakage of pollutants were effectively controlled.
The performance of bentonite liner was highly affected by the swell-shrinkage characteristic of bentonite. When the swelling property of bentonite decreased, the compaction response of the micro-pore in the liner becomes weaker and the permeability becomes higher, which weakens its buffer effect [20,21]. At the same time, the insufficient swelling property of bentonite proved that the interlayer space of montmorillonite in bentonite was relatively narrow, and the cation exchange capacity was impaired as well.
The adsorptive capacity of bentonite can be influenced by many factors [22]. The swelling and shrink properties of bentonite are related to the adsorption capacity. Usually, the leachate contained many different heavy metal ions, the competition among them would take place at the same adsorption sites in the mineral structure. Consequently, some certain heavy metal ions were adsorbed preferentially, which influences the treatment effect of different heavy metal ions [8,22,23,24]. Previous studies had shown that the action of competitive adsorption can be changed due to the presence of H+ under different pH conditions. When the pH ranged from 2 to 9, bentonite would preferentially adsorb copper ions over lead and cadmium ions. Once pH was less than 4, heavy metal ions were easily desorbed by clay due to the protonation of Si-O- and Al-O- on the clay surface [25,26]. When the pH is higher than 9, the Si and Al in the bentonite are dissolved, which can reduce the expansibility and increase the permeability [27].
Aiming at the mechanical behavior of the bentonite, many studies can be found in literature including compactibility, expansibility, permeability, and so on [28,29]. However, the influence of heavy metal pollution on the swelling and shrinkage behavior of the clay is seldomly reported. Therefore, our work in this paper focuses on understanding the effect of Cu (II) on the swelling and shrinkage characteristics of sodium bentonite. The Dose Response model was used to predict the swelling and shrinkage behavior. The results of XRD and XRF further revealed the influence of Cu on the expansibility, which can provide the guideline of implementation of liner in landfills.
The structure of this paper is as follows: the details of sample preparation and experimental setup are described in Section 2. The experimental results and discussions are presented in Section 3. Section 4 explained the erosion mechanism of metal Cu (II) in bentonite, and the conclusions of this study are presented in Section 5.

2. Materials and Methods

2.1. Preparation of Materials and Samples

Sodium bentonite was widely used in landfill anti-seepage for its well swelling ability and low permeability [30]. The raw materials applied in the experiment were commercial sodium bentonite from Henan Province, China. The oven-dry method was conducted in this study. The 100 g bentonite was taken and drying in an oven at a temperature of 105 °C for 24 h. The soil properties and water content calculated of bentonite were calculated and summarized in Table 1. The remaining sodium bentonite which had been dried was prepared for the free swelling rate experiment.
To introduce the Cu2+, CuSO4 solutions were prepared by mixing pure CuSO4·5H2O. The added water in the solution preparation was deionized water. According to the content of CuSO4·5H2O, four concentrations of the solution were prepared: 0 g/L, 2.5 g/L, 5 g/L, and 10 g/L. The pure NaCl solution with a concentration of 5% was dispensed by the pure sodium chloride crystals, which was prepared for the free swelling rate experiment. To achieve a homogeneous and stable state of solution, all the prepared solutions were placed under the room temperature of 23 °C ± 1 °C for 12 h. The pH of stabilized CuSO4 solution was measured and listed in Table 2.
With the prepared pH value, Cu (II) was absorbed preferentially by bentonite, so that it can effectively reduce the interference of other ions in the experiment [26,27,31,32]. The samples for the shrinkage experiment and non-load swelling experiment were prepared by mixed with CuSO4 solution. The initial water content of the sample was 23%. The samples were sealed and cured for 30 days at an indoor temperature of 23 ± 1 °C.

2.2. Free Swell Ratio (FSR) Experiment

The purpose of free swell ratio testing was to determine the swelling potential of clay in unstructured conditions. In the experiment, the dried bentonite was put into the neckless funnel and made it freely drop. The distance between the bottom of the funnel and the top of the soil cup was 10 mm, and the volume of the soil cup was 10 mL. Once the bentonite overflow from the soil cup, the soil is scraped from the lip of the cup with fine wire and is weighed in the cup, then was poured into the funnel again. The above experimental steps were repeated until the difference of weight between the two measurements was less than 0.1 g. The weight of all soil samples obtained were 8.4 g ± 0.05 g. 30 mL CuSO4 solution and 5 mL NaCl solution were injected into the volumetric cylinder. Then the bentonite in the soil cup was slowly poured into the volumetric cylinder. The prepared volumetric cylinders filled with a solution were placed under the indoor temperature of 23 °C for 24 h. The height of clay in each volumetric cylinder was measured every 2 h until the height of the clay was less than 0.2 mL within 6 h. The samples were divided into four groups with a concentration of 0 g/L, 2.5 g/L, 5 g/L, and 10 g/L. Three measurements were conducted to ensure the repeatability of the observation.

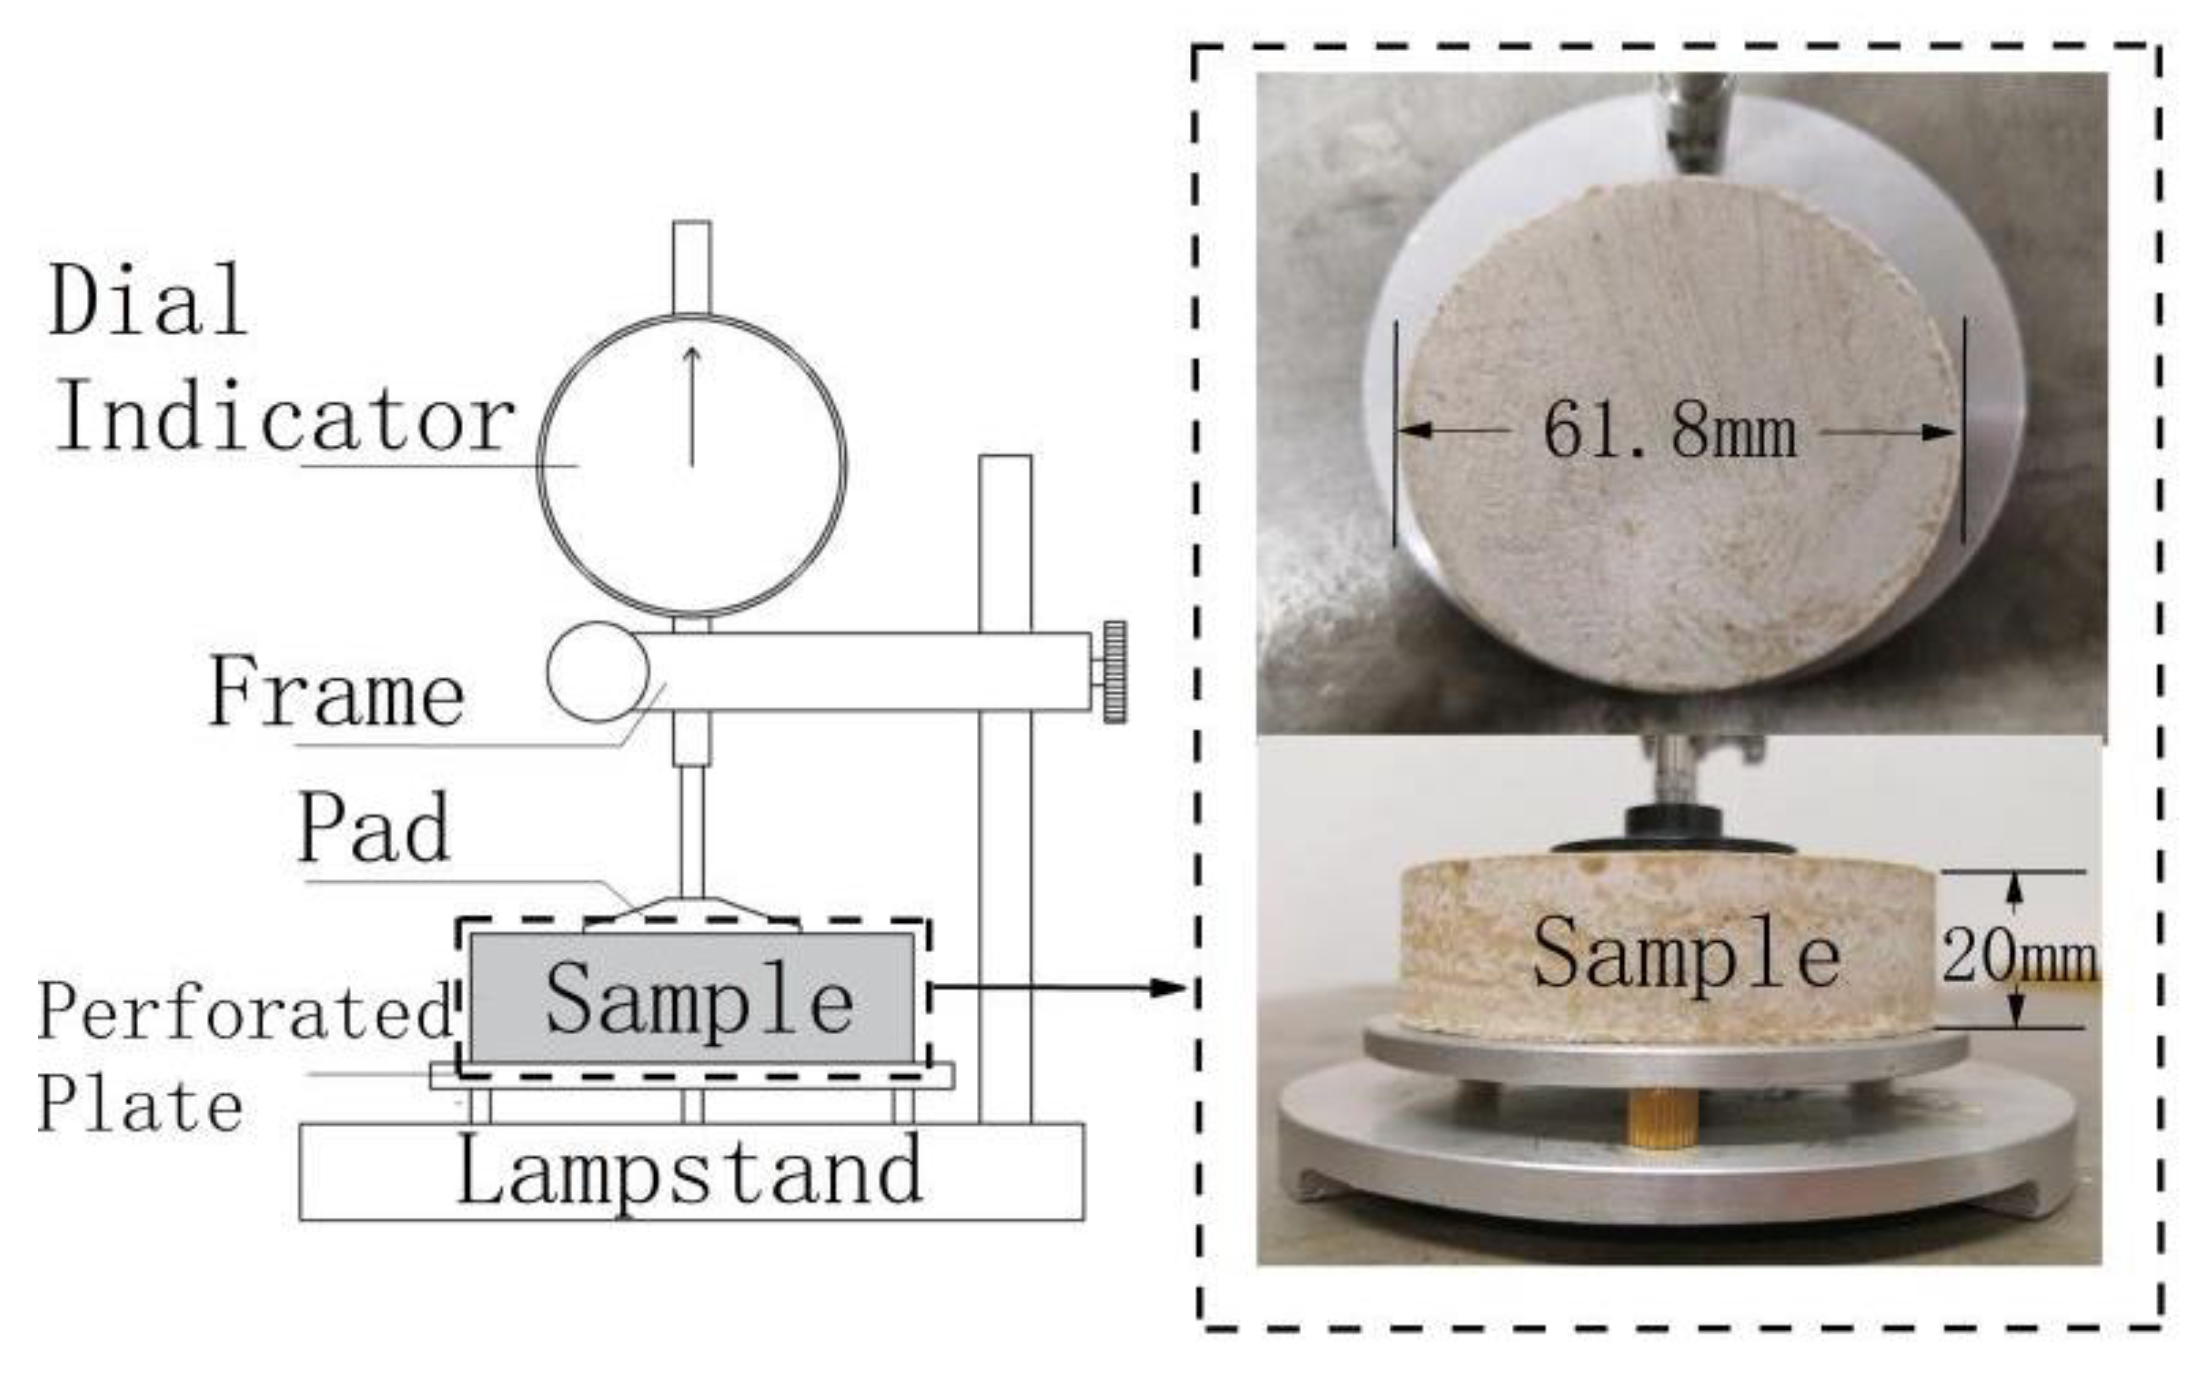
2.3. Non-Load Swell Ratio Experiment

To understand the swell behavior of bentonite eroded by Cu (II), the non-load swelling test was designed and conducted under the condition of lateral restraint and no vertical load. The instrument used in this experiment was modified from WG single lever consolidation instrument from Nanjing Soil Instrument Factory. The soil samples with a diameter of 61.8 mm and a height of 12 mm were prepared by pressing the clay with an initial water content of 23%, see Figure 1. The initial dry density of the samples was 1.3 g/cm3. Different concentration of CuSO4 solutions was injected into the tank, and the samples were completely immersed by the solution. Three control groups were set for each concentration. To obtain a non-load swelling curve, the time interval of 2 min was used for the first hour of the experiment. Afterward, the time interval was increased to 30 min. Then the time interval of 2 h was used after 24 h. If the deformation within 6 h was less than 0.01 mm, the experiment should be terminated. The experimental setup is shown in Figure 1.

2.4. Shrinkage Test

The instrument used in the shrinkage experiment was SS-1 manufactured by Nanjing Soil Instrument Factory. The experimental setup was shown in Figure 2. The testing procedure and samples were the same as those in Section 2.3. But the time interval of the measurement was different.
In this experiment, data were recorded at a time interval of 2 h within 48 h from the beginning of the experiment. After 48 h, the time interval was changed to 16 h. Once shrinkage remained constant for 32 h, the experiment was terminated. During the whole experiment process, samples and instruments were maintained in the thermostat with the temperature of 28 ° ± 1 °C, and the humidity of 67 ± 3%.

2.5. Clay Mineralogy

The clay mineralogy in this paper included XRD and XRF. The instrument used in the XRD test was TTR III, from Rigaku, Japan. The radiation source of the instrument was the Cu target. The emission slit and scattering slit were 1 degree, and the acceptance slit was 0.3 mm. The scanning speed was 2°(2θ)/min, and the corresponding resolution was 0.02°(2θ). The scanning range was from 2.6° to 30°. The type of instrument used in the XRF test was ZSX Primus II, from Rigaku, Japan.
Bentonite used in XRD and XRF tests was processed from the clay samples collected after the FSR. As the crystallinity of quartz affects the diffraction peaks of other minerals, the quartz can be dislodged from samples according to Stocks settlement theory. The detailed sample preparation for XRD and XRF follows the Chinese standard, more information can be found in China’s Code GB/T 50123-1999 (China 1999). Firstly, the collected clay samples were dried for 12 h at temperatures of less than 60 °C, then poured the dry sample into a 100 mL beaker. Secondly, the deionized water was added into the beaker, then put it into the ultrasound comminuter. Thirdly, the obtained turbid liquid was kept steadily for 4 h, then 40 mL supernatant was extracted from it. The three steps above were repeated three times to get the treated supernatant. After deposit the treated supernatant in a plastic centrifugal cup for 48 h, the supernatant was poured out, and the leftover sediments were treated by ultrasound comminuter again. Then 0.5 mL suspension was extracted by syringe and dripped onto a glass carrier. After the suspension was air-dried naturally, the remaining clay was made into an orientation image for X-ray scanning. Samples for XRF were prepared by washing and filtering the clay samples from FSR.

3. Results

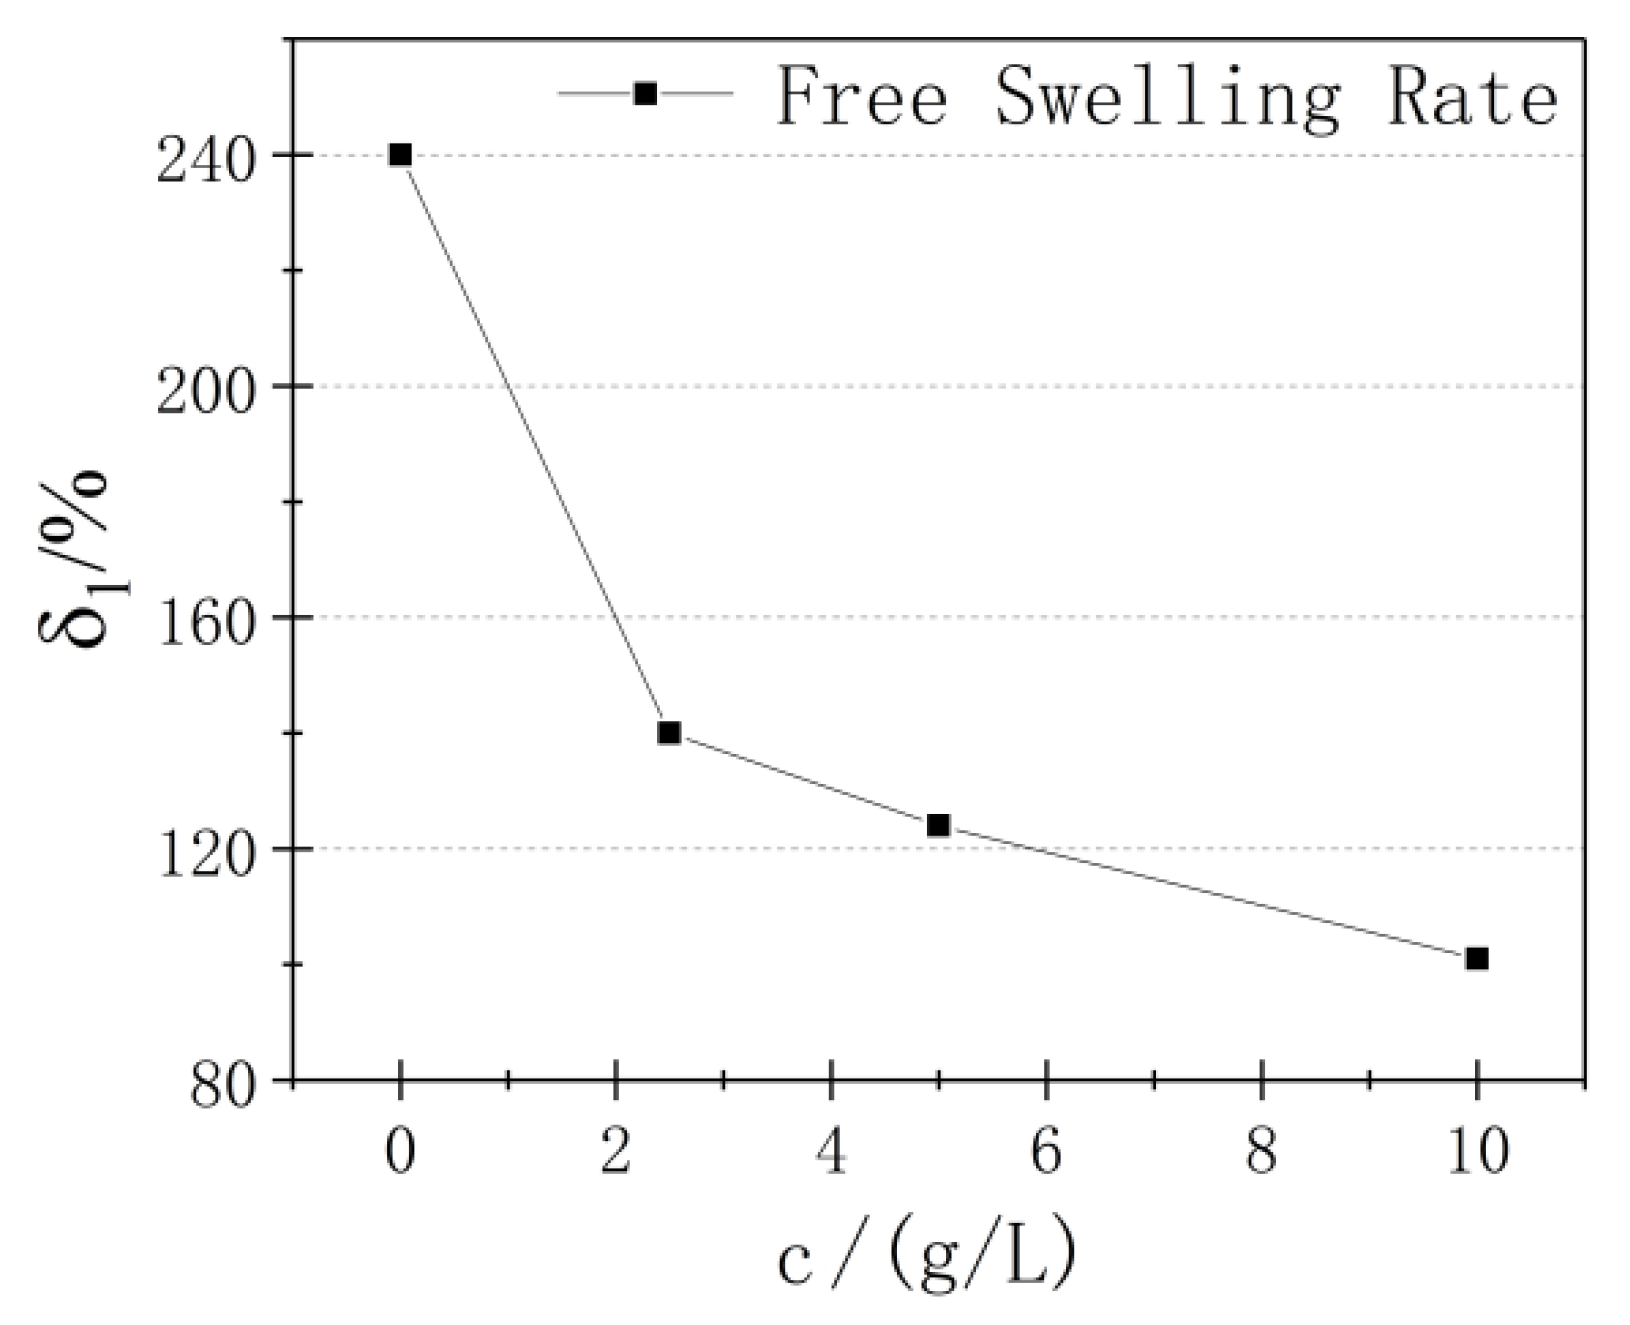
3.1. Free Swell Rate

Free expansion rate was highly related to mineral composition, colloidal content, and environmental factor, and it can obviously reflect the relationship between swelling ability and hydrophilicity of clay, which in turns impact the performance of the bentonite liner. Therefore, it was one of the most important indexes to evaluate the swelling ability of clay. The relationship between the concentration of CuSO4 solution and the FSR of bentonite was illustrated in Figure 3. In this figure, c represents the concentration of the solution. δ1is the free expansion rate.
As shown in Figure 3, the free swelling rate of bentonite was inversely proportional to the concentration of Cu (II). The presence of Cu will cause dramatic decrease in the free swelling rate. When the increase of concentration of CuSO4 solution increased from 0 g/L to 2.5 g/L, the free swelling rate decreases from 240% to 140%. While the concentration of CuSO4 solution continues to increase, though the FWR still decreases, the relatively low decreasing rate is observed, and the rate is constant. As the clay in the vacuum cylinder was completely dispersed and immersed in solution, the structure of clay can be neglected. So, the reduction of the height of clay in the vacuum cylinder turns into the supernatant. It indicates that the hydrophilicity of bentonite also decreases with the increase of the concentration (Cu). When the hydrophilicity of bentonite was low, the water would permeate freely through the bentonite liner. Therefore, the erosion of copper (II) will cause a great negative impact on the isolating performance of bentonite liner.

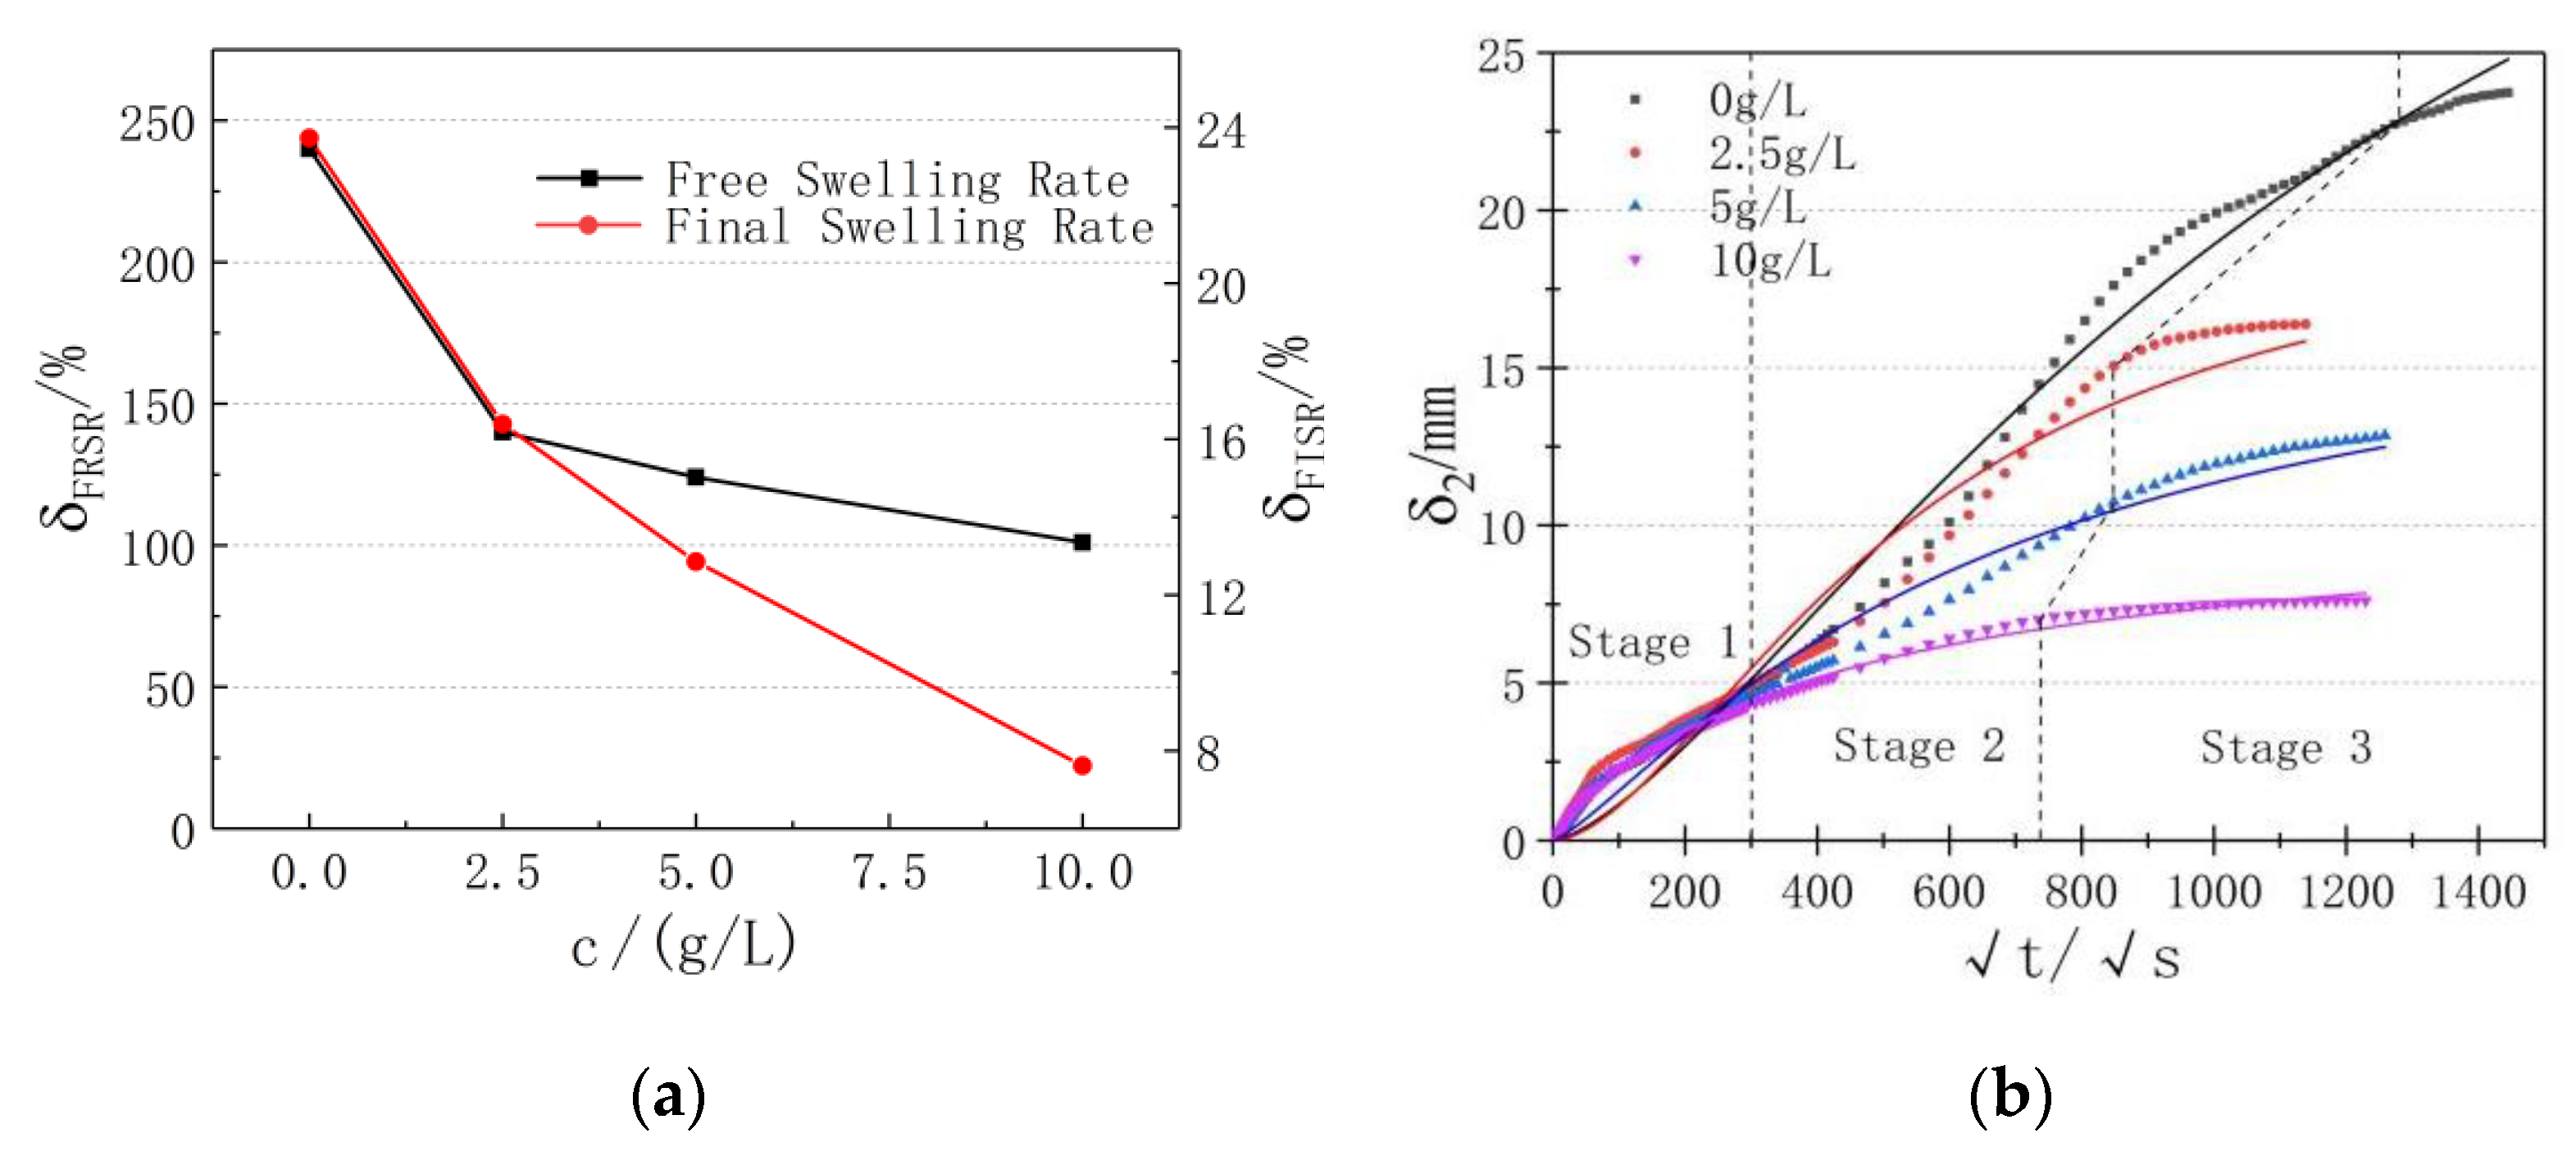
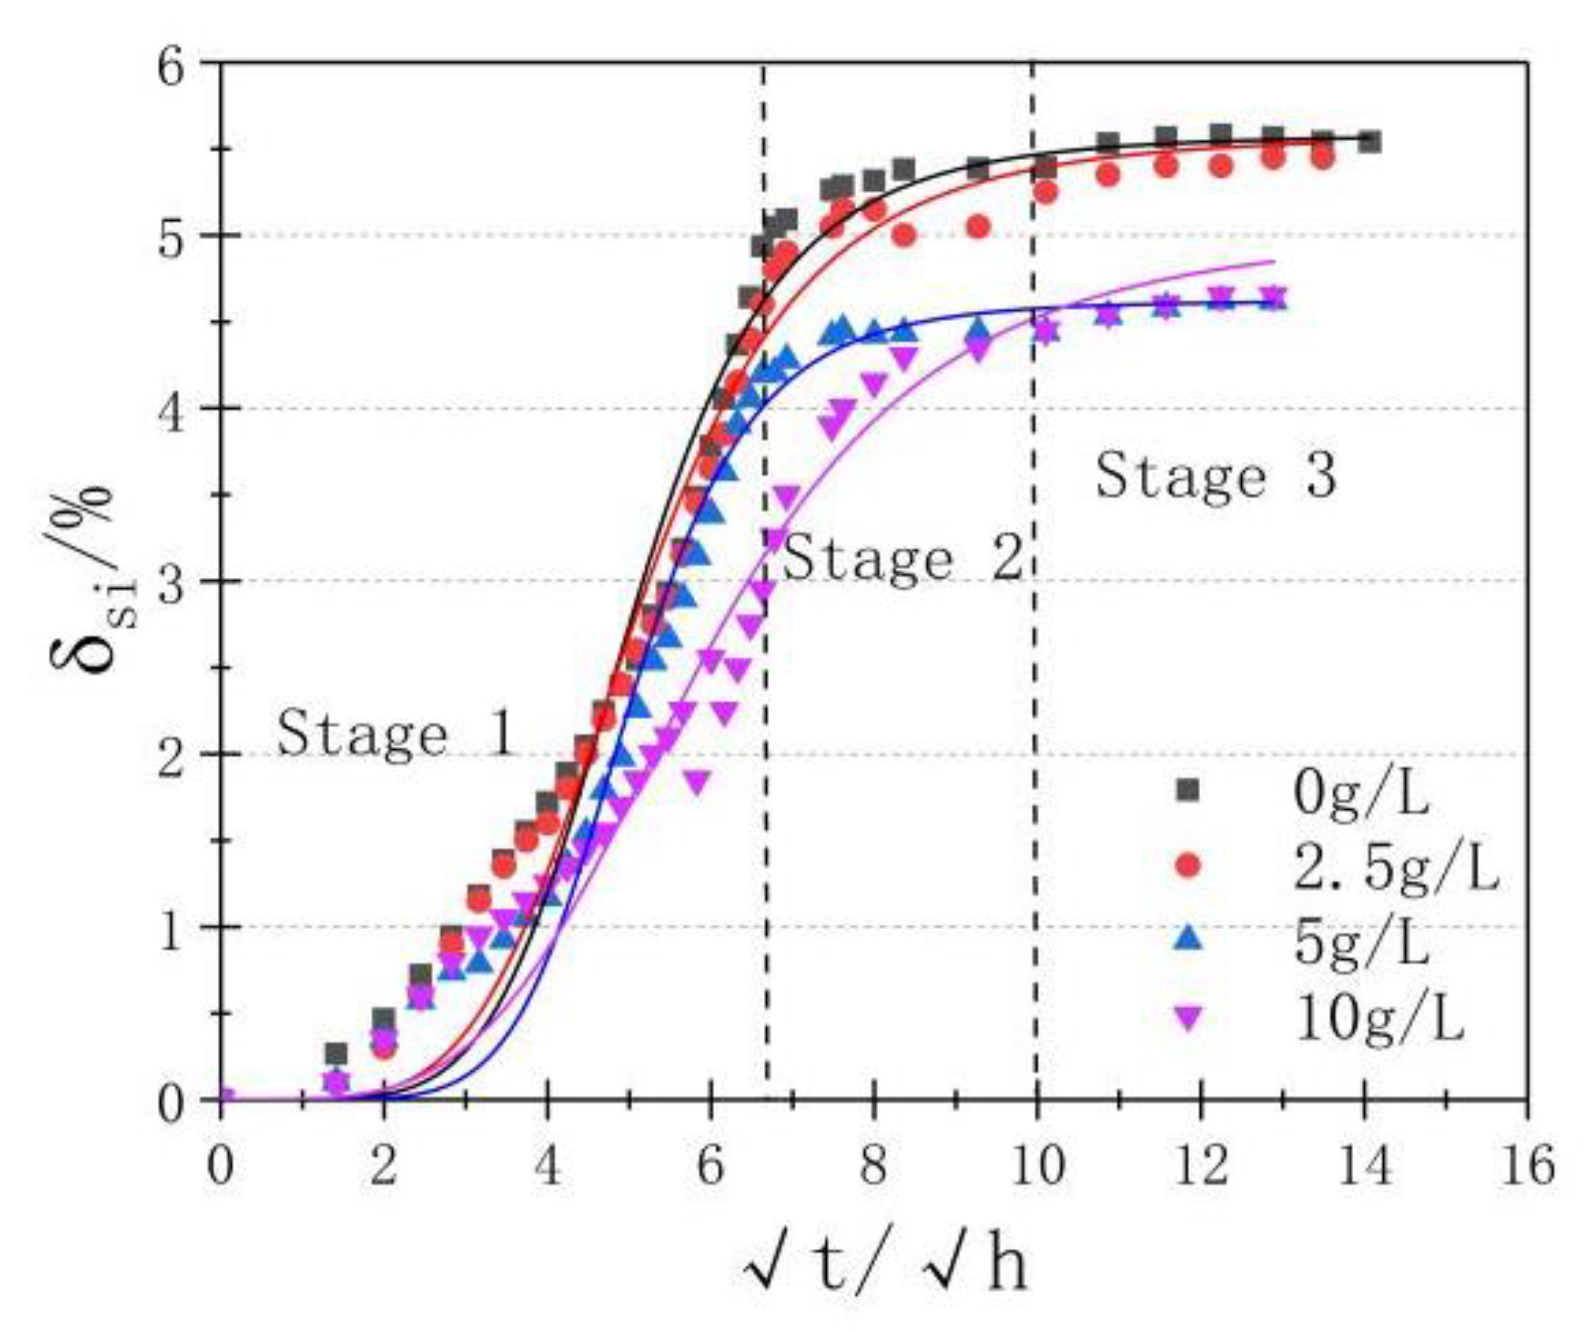
3.2. Non-Load Swell Rate
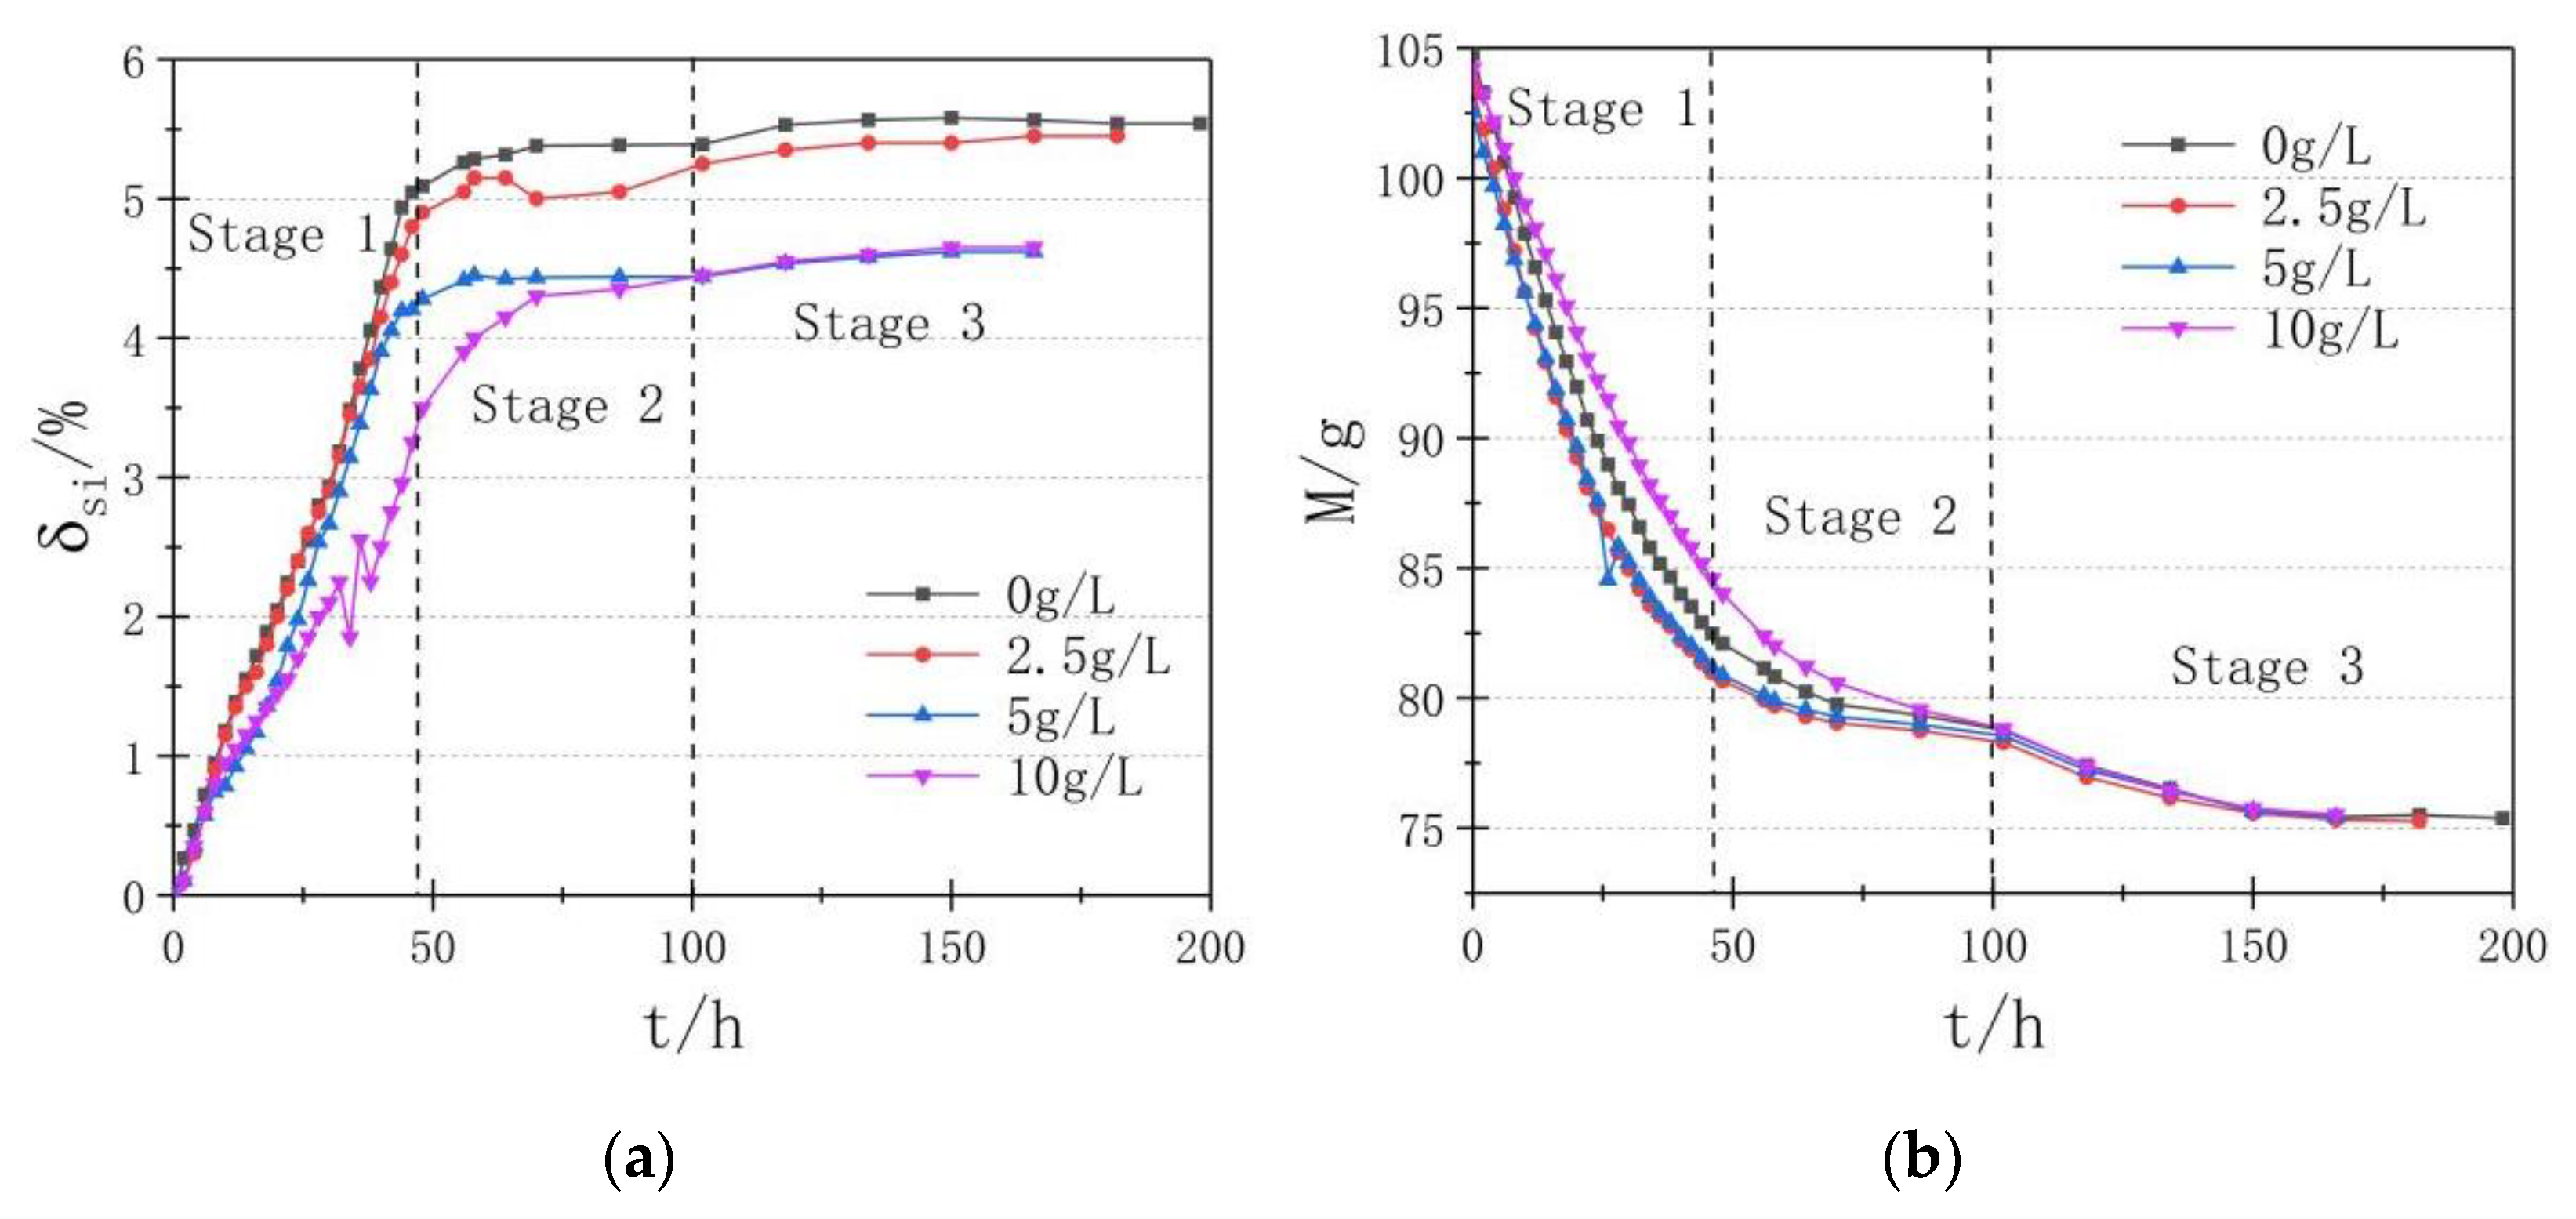
The bentonite liner is fabricated by compressed clay. Thus, the non-load swell rate is used to evaluate the performance of the clay structure. The non-load swelling curve of bentonite with different concentrations of CuSO4 solution was shown in Figure 4. The comparison of FSR and the final swelling rate was illustrated in Figure 4b. The overall trend between them agrees well with each other. The deflection point happened in the concentration of 2.5 g/L.
As shown in Figure 4, the testing time of non-load swell rate experiments with different concentrations of CuSO4 were 580 h, 360 h, 440 h, and 420 h, respectively. With the increase of the concentration of Cu, less testing time is required. As mentioned in Section 3.1, Cu can reduce the FSR. Similar trends can be observed in the non-load swell ratio. It was proved that Cu (II) could significantly weaken the swelling performance of bentonite. The swelling curve of bentonite can be divided into uniform velocity stage, accelerating stage, and steady stage. The gradient of the swelling curve represented the swelling speed of the samples. The swelling speed of the four samples shows slightly different within 300 h because of the large swelling potential. However, after 300 h, the swelling rate in the low Cu (II) concentration group is getting larger. Finally, it entered the stable stage. It confirmed that the increase of concentration of salt solution could inhibit the swelling deformation of clay [33].
The dose-response logarithmic model is adapted as shown in Equation (1), which was usually used to describe the swelling process of the clay. In this case, the model was adapted to fit the non-load swelling curve:
δ 2 = A 1 A 2 1 + ( t / t 0 ) p + A 2
where, A1 and A2 were undetermined parameters, respectively; P represented the index. t0 corresponds to the time of δ2. The coefficients in Equation (1) were derided based on Figure 4 and summarized in Table 3.
Based on the Dose-Response model, when t is approaching infinity or zero, the corresponding δ converges towards A2 or A1, respectively. Consequently, the curve-based model can be described as S-type (see Equation (1)). However, in reality, the profile of obtained curve is not obvious S-type because the swell process of bentonite itself is very fast. To this end, does the response logarithmic model is not applicable to characterize the swelling behavior of bentonite. However, with the increase of concentration of Cu, the swell performance has been impaired significantly. Then the S-type of the non-load swelling curve can be observed again, especially in the case of 10 g/L. Therefore, the dose-response logarithmic model was only suitable for the curve at a high concentration of Cu (II).

3.3. Shrinkage

The shrinkage of samples was calculated by Equation (2),
δ s i = Z i Z 0 h 0 × 100
where, δsi was the rate of shrinkage at a certain time, Zi and Z0 were shrinkages of two adjacent moments. The shrinkage curve was illustrated in Figure 5. In which, the time-dependent shrinkage rate and mass loss were plotted, respectively.
As shown in Figure 5, with the increase of Cu (II) concentration, the shrinkage of bentonite decreased, and the required testing time decreased as well. Therefore, the shrinkage curves of bentonite can be divided into uniform, deceleration, and stabilization stages. The maximum shrinkage of the bentonite sample was 1.108 mm. The shrinkage rate was 5.54%. Though the swell and shrinkage will not happen simultaneously, a similar tendency is observed. The reason for the less shrinkage in this experiment may be caused by the constraint on the top and bottom sides of the sample in the process of saturation. Therefore, the adsorbed water by bentonite in a fixed volume was limited, leading to small shrinkage. The change of the shrinkage corroded by different Cu (II) concentrations reveals that the hydrophilicity decreased, eventually causing the decay in the swell and shrinkage performance.
The mass variation curves show similar behavior as the shrinkage curve, which indicated that the temperature and humidity conditions were well controlled during the experiment. Among the four groups of samples, the loss rate of mass was slightly different before 100 h due to the different shrinkage rates. Once the loss rate of water and absorption rate of the samples reaches a dynamic balance status, the mass variation curves tend to be stable.
The swell and shrinkage processes of clay usually show the same behavior, so the dose-response model can also be applicable. In this case, the logarithmic coordinate was used, and the shrinkage curves were replotted in Figure 6, and the correlation coefficient and undetermined coefficient were shown in Table 4.
Comparing with Figure 6, it can be observed that the shrinkage rate of bentonite samples was high at the initial shrinkage stage. However, the dose-response model was relatively stable at this stage, which could result in a relatively low estimation of the correlation coefficient. And also, the bentonite usually has very strong shrinkage. Therefore, the dose-response model will not be applicable in unconstrained conditions or the clay of great swelling and shrinkage performance. While with the consideration of constraints and weak swelling and shrinkage, the swelling and shrinkage variation curve of bentonite tended to be “S” type, and the dose-response model will be suitable.

3.4. Mineralogy Results

The results from the mineral analysis included XRD and XRF. The d (001) diffraction peak of montmorillonite was obtained by small-angle diffraction. The experimental diffraction pattern was shown in Figure 7. The content of elements in sodium bentonite was determined by XRF.
Figure 7 shows that the d (001) diffraction peak intensity of quartz was low, which indicates that the removal treatment was effective. The position of d (001) diffraction peak of different groups were 5.2°, 6.24°, 7.12°, and 7.16°. It shows that with the increase of Cu (II) concentration, the position of d (001) peak of montmorillonite shifts to the right. According to Bragg’s theory: the high expansion of sodium bentonite was usually observed in the low interlayer space of montmorillonite [24,34]. The results show that the swelling ability of bentonite was weakened due to the changes of the interlayer space of montmorillonite. The differences in the width of the characteristic peaks can be observed because of the error from sample preparation.
The content of various elements in bentonite were measured by XRF and can be used for evaluating the erodibility of Cu (II) which happens between clay particles and ions in surrounding electrolytes. The content of each element obtained from the experiment were shown in the form of oxide. The results were shown in Figure 8.
The variation of elements Ca, Fe, K, Mn, P, Ti, Al, Na, Mg, and Si were analyzed in this experiment. Figure 8 shows that Ca, Fe, K, Mn, P, Ti, and Al did not change significantly in four environments of different concentration, and the corresponding variation of these elements were not less than 0.1%. However, the elements of Na, Mg, and Si changed significantly. Herein the change rate of Na is the most significant with 2.4%. Meanwhile, the content of Mg and Si in a high concentration environment (5 g/L and 10 g/L) were lower than that in a low concentration environment (0 g/L and 2.5 g/L), which indicates that Mg and Si only participated in the reaction in high concentration environment.
The decrease of Na and Mg shows that some interlayer cations such as Na+, Mg2+ were involved in ion exchange reactions [35]. It caused the reduction of the involved element content. Especially for sodium bentonite, the main interlayer cation of montmorillonite was Na+. So change of Na element was the most obvious. The decrease of Si was caused by the partial existence of Cu (II) in solution with the form of [Cu(H2O)6]2+. The structure of [Cu(H2O)6]2+ was octahedral which shows strong bonding ability in X and Y axes. When pH > 4, the Si-O pressed on the surface of clay particles adhere to [Cu(H2O)6]2+ [36,37]. The following reaction happens:
Si-O-Si + Cu ( OH ) + + H 2 O Si-O-CuOH + Si ( OH ) + H +

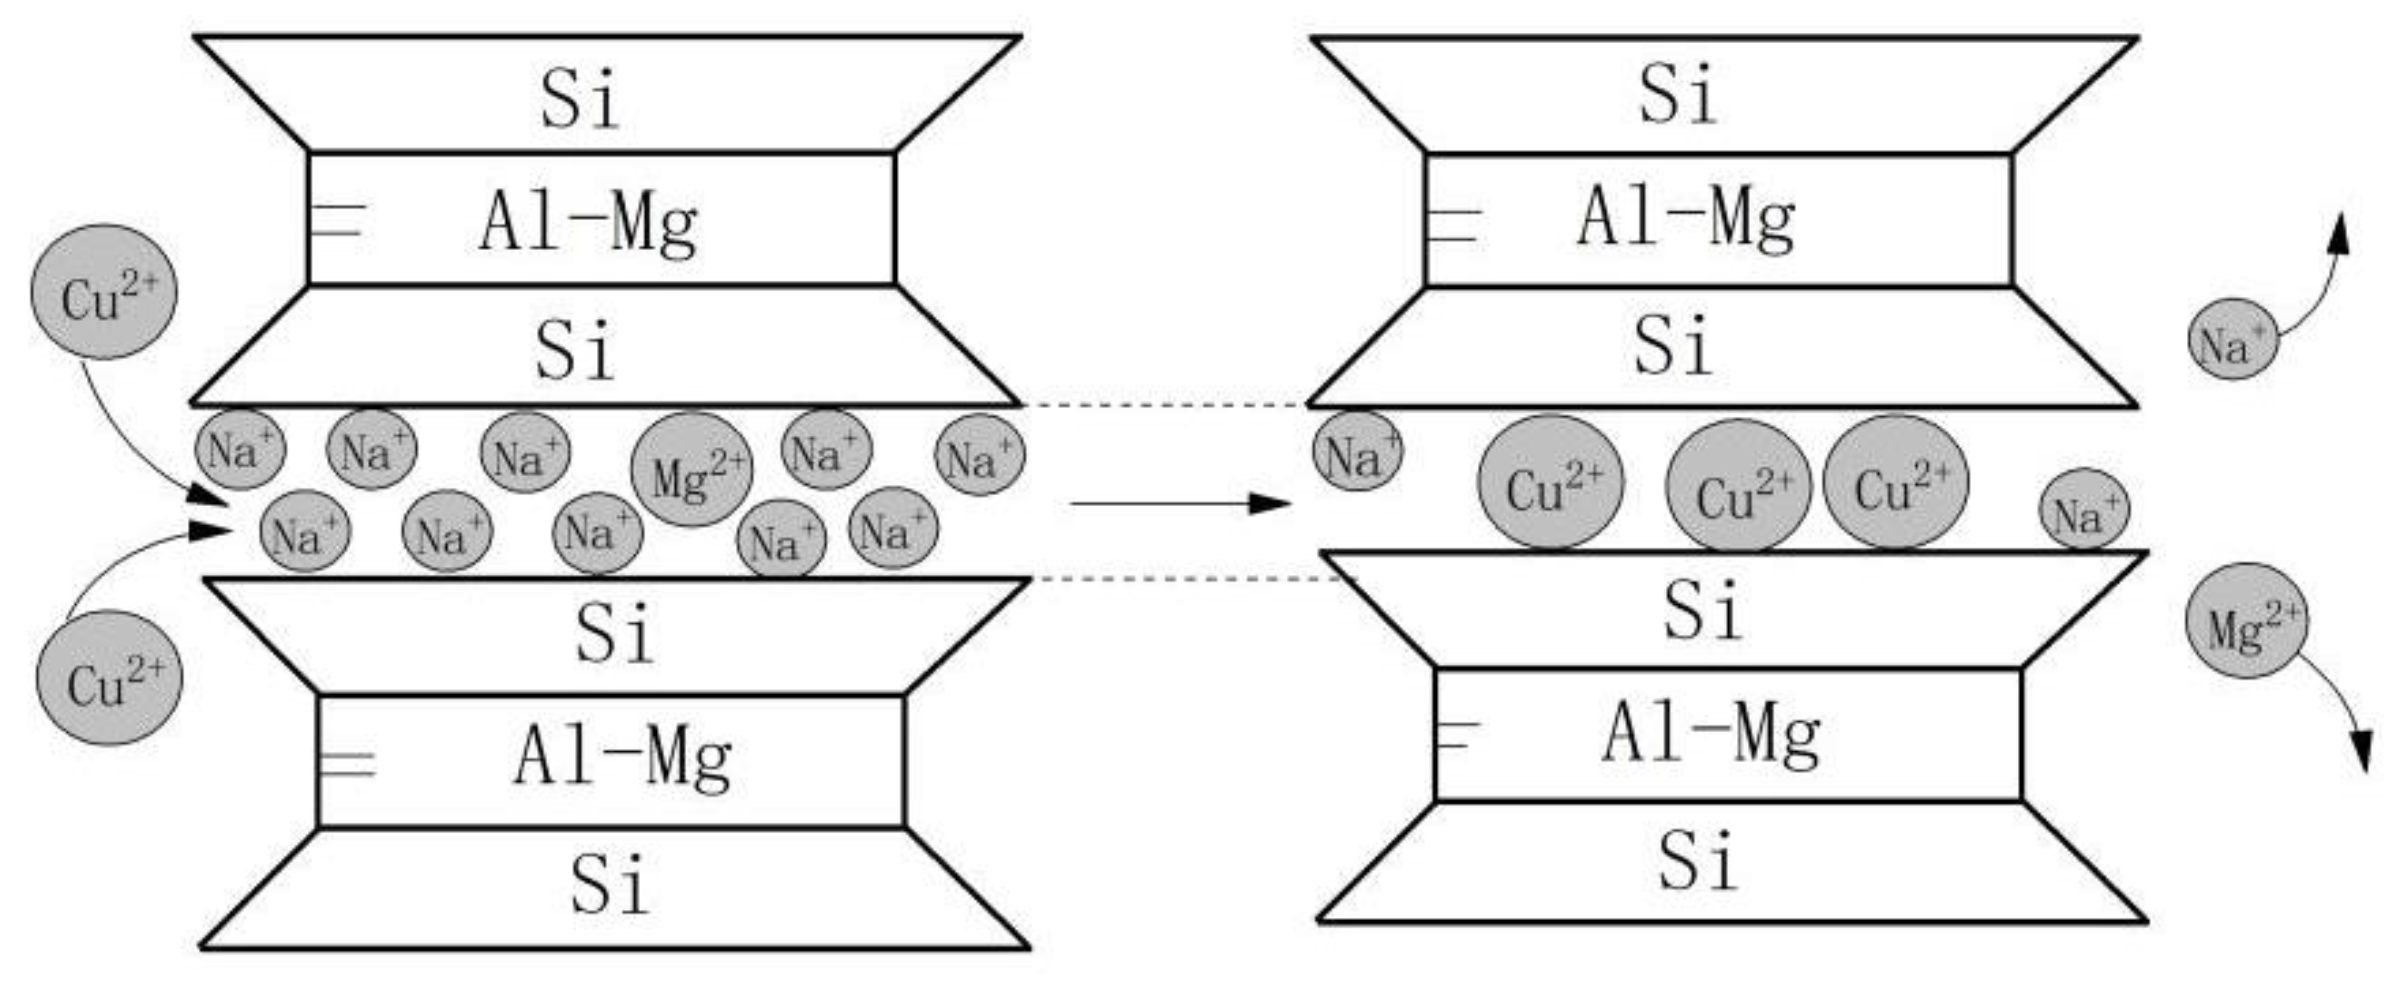
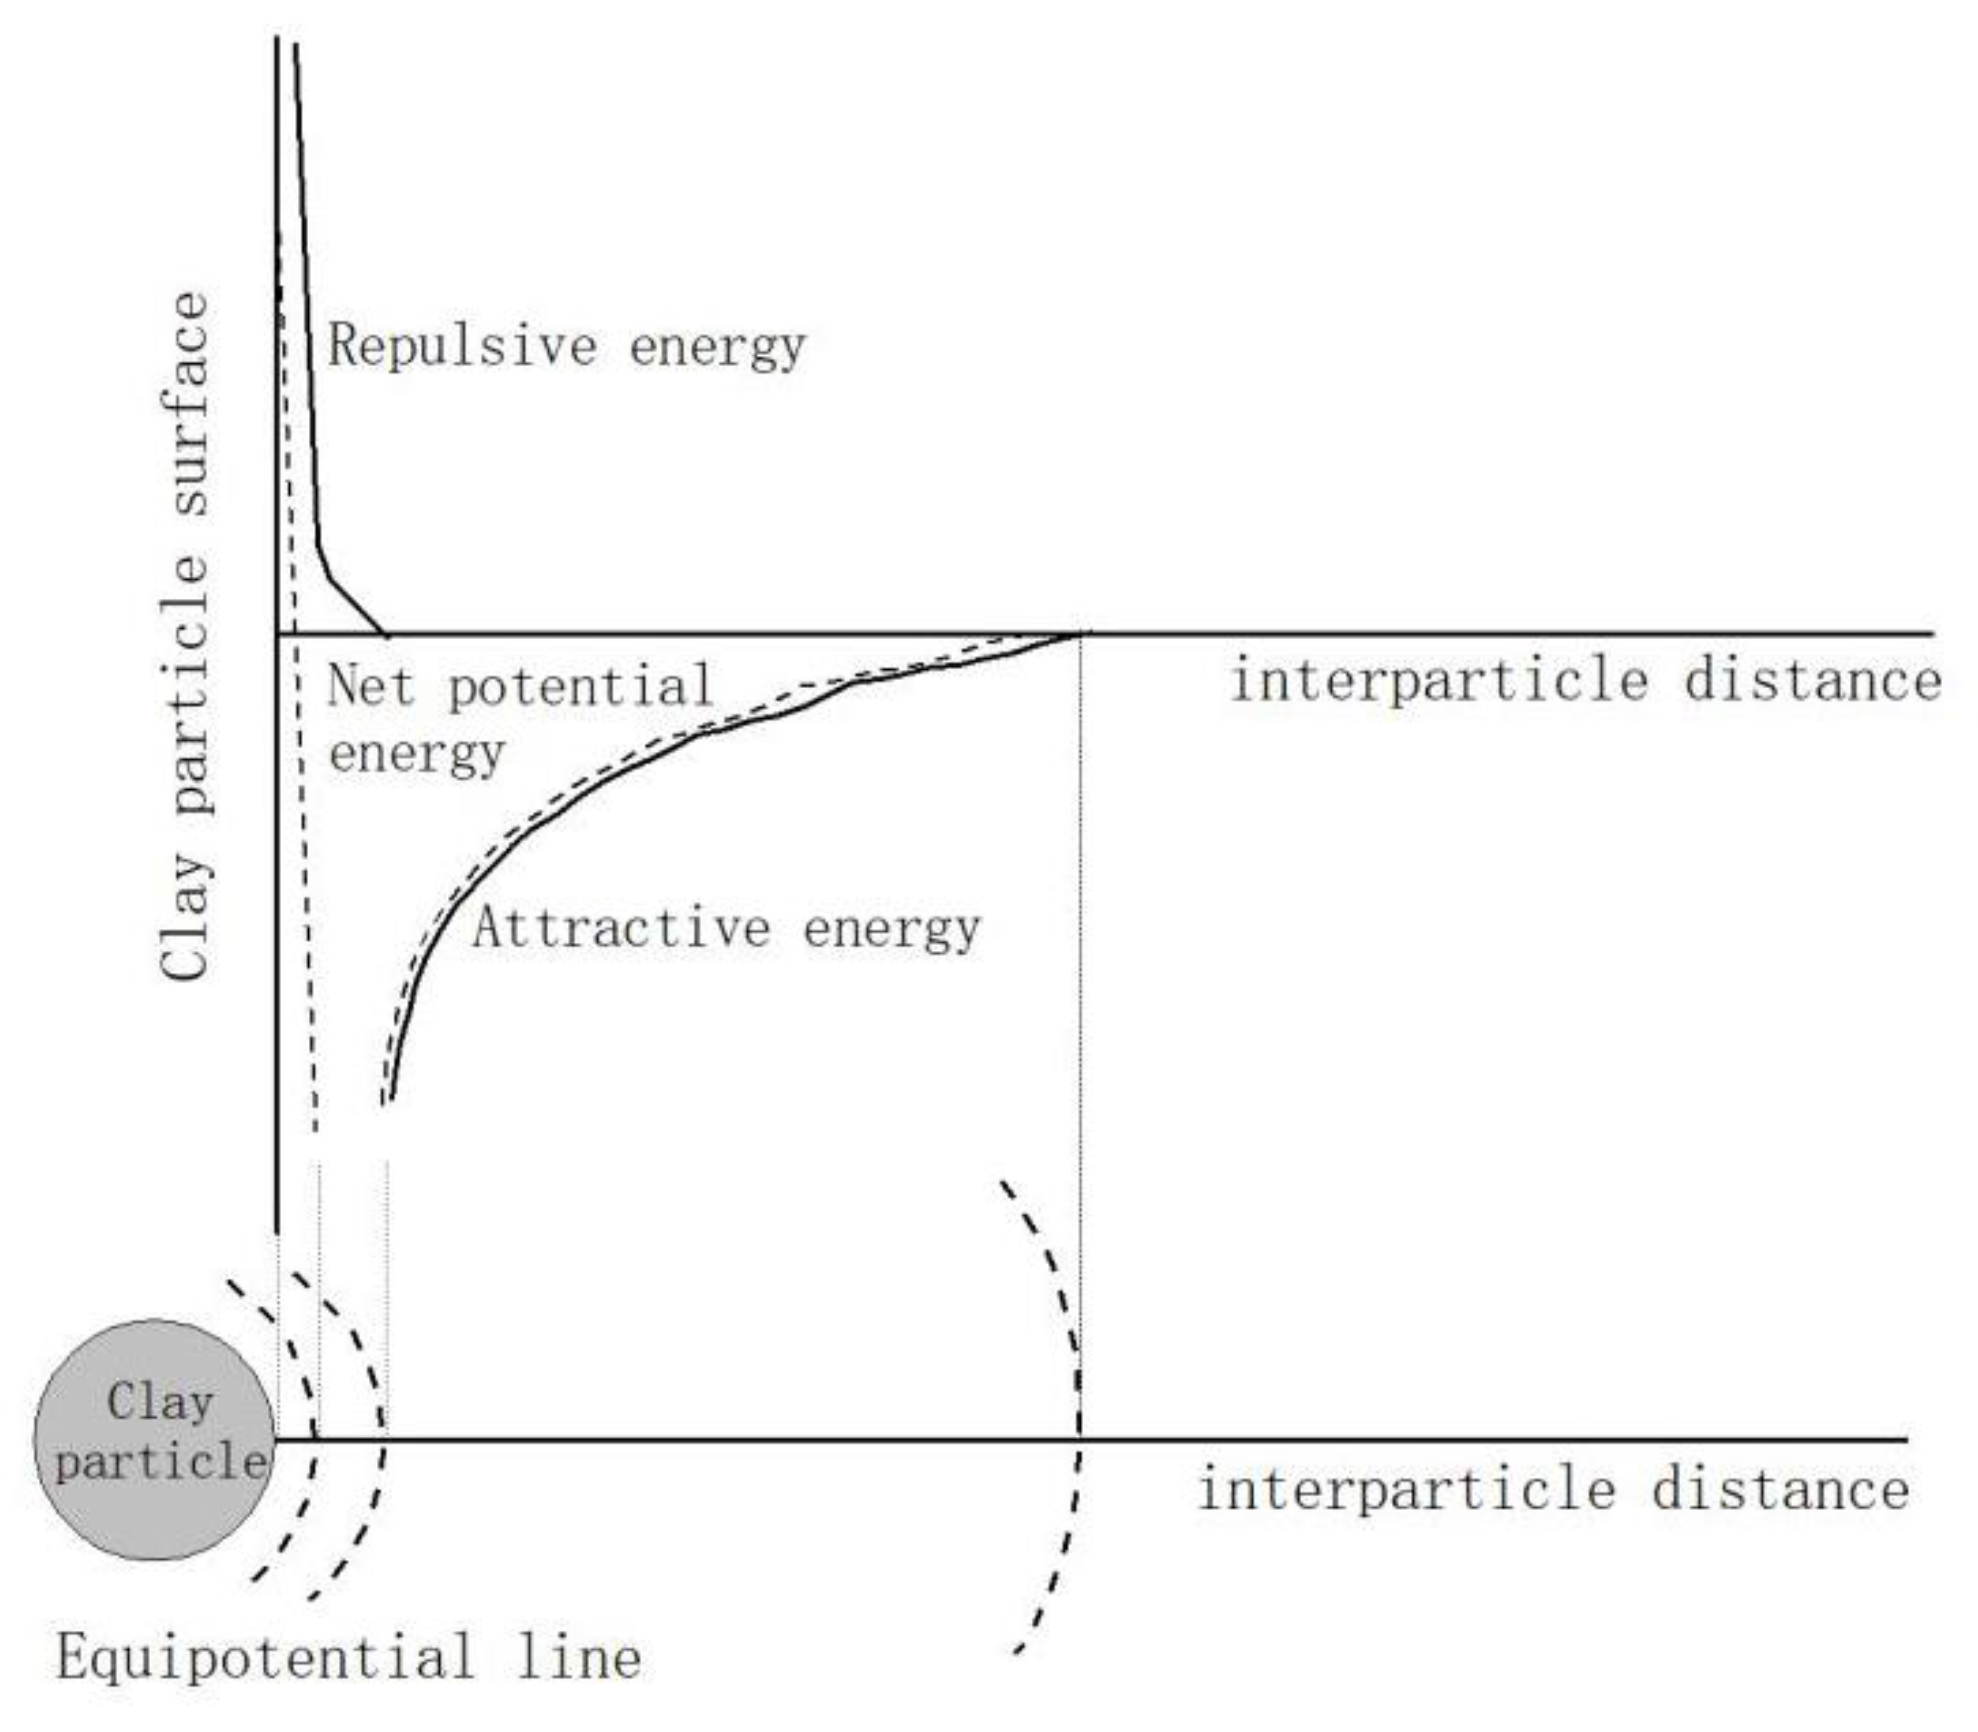
4. Mechanism of Bentonite Erosion Caused by Cu (II)

Montmorillonite was the main clay mineral in bentonite. Al3+ was replaced by Mg2+ in the octahedron of this clay mineral. As a result, the balance of internal charge was changed, and the negative charges appeared between layers. The external charges were demanded to balance the negative charges. Generally, the negative charges between layers were mainly balanced by Ca2+, Mg2+, Na+, and H+. For sodium bentonite, the interlayer cation was mainly Na+, which were easily exchanged by other ions; so, bentonite was widely used in the adsorption treatment of heavy metal. But once the sodium bentonite was corroded by Cu (II), Na+ of montmorillonite were exchanged by Cu (II), resulted in a decrease of the interlayer space. This process can be illustrated in Figure 9. When the concentration of Cu (II) increased, the ion exchange reaction increased, leading to a great reduction in swelling and shrinkage of bentonite. Furthermore, the performance of the liner has been weakened.
In general, when clay particles interacted with the surrounding electrolyte, the surface won’t only attracted water molecules to form an adsorption layer, but also attracted cations and hydrated cations to form a diffusion double layer. Molecular thermal movement as the driven force attempted to make the ions adsorbed on the surface of soil particles evenly, so these ions tended to diffuse outward. Therefore, the diffusive electric double layer could be divided into the inner layer and outer layer according to the ion diffusion orientation around soil particles. Because of the higher valence of Cu (II) in CuSO4 solution, the diffusive double layer formed by a water molecule, the copper ion, and other ions that were attracted to the surface of clay particles by the negative charge becomes thinner. The layout of soil particles was therefore more compact. Consequently, the hydrophilicity of bentonite in CuSO4 solution and the swelling performance decreased. The relation between potential energy and particle spacing can be illustrated in Figure 10.
As shown in Figure 10, according to the potential energy theory in the soil-water-ion system, when the ion concentration of the environment was high, the potential energy curve was dominated by attracting energy. When the particles were close to each other due to Brownian motion, the particles were condensed rapidly. While the ion concentration of the environment was low, clay particles were difficult to be agglomerated due to the. At this point, the kinetic energy of particles should be large enough to break through the barrier to agglomerate [38,39]. Therefore, the swell rate of bentonite with a high concentration of copper ions was low. It can be concluded that the landfill liner with bentonite as raw material encountered waste liquid with a high concentration of heavy metal, the swell performance of soil particles would be significantly reduced, and its ability to prevent pollutants can weaken accordingly.

5. Conclusions

To evaluate the performance of the bentonite liner as a chemical barrier, comprehensive experimental studies are conducted aiming at the properties of swell, shrinkage, and mineral change, the conclusions were drawn as below:
The free swell rate of bentonite was inversely proportional to the concentration of Cu (II). In the high concentration of Cu (II) solution, the FSR is low, which allows the water to permeate easily through the liner. Similar to FSR observation, the non-load swell rate and swell speed of bentonite as the indicator of the performance of structured clay decreased with the increase of Cu (II) concentration. The commonly used dose model has been proved unsuitable in the low concentration of Cu (II); however, it is applicable in the high concentration. The results of mineralogy show that the interlayer space of montmorillonite decreased with the increase of Cu (II) concentration. The Cu (II) weakens the expansibility of bentonite by changing the interlayer space of montmorillonite. Moreover, the ion exchange of Cu (II) and Na+ between layers is the main reason for impairing the barrier performance of bentonite liner. The diffusive double layer formed by water molecule copper ion and other ions that were attracted to the surface of soil particles become thinner, hence the swelling performance of bentonite in the environment with Cu (II) solution decreased. Because the potential energy curves of soil particles in different concentration environments were different, the higher the concentration of Cu (II), the smaller the expansibility. The paper provides insight into the relationship between Cu (II) and the performance of bentonite linear.

Author Contributions

Conceptualization, G.X. (Guangli Xu) and G.X. (Guiyuan Xiao); writing—original draft preparation, G.X. (Guiyuan Xiao) and T.W.; writing—review and editing, W.L. and L.Z.; project administration, J.Z.; All authors have read and agreed to the published version of the manuscript.

Funding

This research received no external funding.

Institutional Review Board Statement

The study did not involve humans or animals.

Informed Consent Statement

The study did not involve humans.

Data Availability Statement

The date presented in this study are available on request from the corresponding author.

Conflicts of Interest

The authors declare no conflict of interest.

References

  1. Morselli, L.; Luzi, J.; De Robertis, C.; Vassura, I.; Carrillo, V.; Passarini, F. Assessment and comparison of the environmental performances of a regional incinerator network. Waste Manag. 2007, 27, S85–S91. [Google Scholar] [CrossRef]
  2. Kjeldsen, P.; Barlaz, M.A.; Rooker, A.P.; Baun, A.; Ledin, A.; Christensen, T.H. Present and long-term composition of MSW landfill leachate: A review. Crit. Rev. Environ. Sci. Technol. 2002, 32, 297–336. [Google Scholar] [CrossRef]
  3. Chofqi, A.; Younsi, A.; Lhadi, E.K.; Mania, J.; Mudry, J.; Veron, A. Environmental impact of an urban landfill on a coastal aquifer (El Jadida, Morocco). J. Afr. Earth Sci. 2004, 39, 509–516. [Google Scholar] [CrossRef]
  4. Wang, Y. Leachate Management in the Aftercare Period of Municipal Waste Landfills. Ph.D. Thesis, Aalto University, Espoo, Finland, 2013. [Google Scholar]
  5. Gupta, A.; Zhao, R.; Novak, J.T.; Goldsmith, C.D. Variation in organic matter characteristics of landfill leachates in different stabilisation stages. Waste Manag. Res. 2014, 32, 1192–1199. [Google Scholar] [CrossRef] [PubMed]
  6. Brennan, R.B.; Clifford, E.; Devroedt, C.; Morrison, L.; Healy, M.G. Treatment of landfill leachate in municipal wastewater treatment plants and impacts on effluent ammonium concentrations. J. Environ. Manag. 2017, 188, 64–72. [Google Scholar] [CrossRef] [Green Version]
  7. Wang, Q.; Shaheen, S.M.; Jiang, Y.; Li, R.; Slaný, M.; Abdelrahman, H.; Kwon, E.; Bolan, N.; Rinklebe, J.; Zhang, Z. Fe/Mn- and P-modified drinking water treatment residuals reduced Cu and Pb phytoavailability and uptake in a mining soil. J. Hazard. Mater. 2021, 403, 123628. [Google Scholar] [CrossRef] [PubMed]
  8. Kaya, A.; Ren, A.H. Adsorption of zinc from aqueous solutions to bentonite. J. Hazard. Mater. 2005, 125, 183–189. [Google Scholar] [CrossRef] [PubMed]
  9. Cooper, Z.; Bringolf, R.; Cooper, R.; Loftis, K.; Bryan, A.L.; Martin, J.A. Heavy metal bioaccumulation in two passerines with differing migration strategies. Sci. Total Environ. 2017, 592, 25–32. [Google Scholar] [CrossRef] [PubMed] [Green Version]
  10. Zhang, H.; Gao, Z.; Liu, Y.; Ran, C.; Mao, X.; Kang, Q.; Dai, J. Microwave-assisted pyrolysis of textile dyeing sludge, and migration and distribution of heavy metals. J. Hazard. Mater. 2018, 355, 128–135. [Google Scholar] [CrossRef]
  11. De Stefanis, A.; Tomlinson, A.A.G.; Steriotis, T.A.; Charalambopoulou, G.C.; Keiderling, U. Study of structural irregularities of smectite clay systems by small-angle neutron scattering and adsorption. Appl. Surf. Sci. 2007, 253, 5633–5639. [Google Scholar] [CrossRef]
  12. Birmili, W.; Charron, A.; Harrison, R. Treatment of Textile Wastewater using Bentonite Clay as a Natural Coagulant. Pediatr. Transplant. 2014, 11, 895–900. [Google Scholar] [CrossRef]
  13. Xiang, G.; Ye, W.; Yu, F.; Wang, Y.; Fang, Y. Surface fractal dimension of bentonite affected by long-term corrosion in alkaline solution. Appl. Clay Sci. 2019, 175, 94–101. [Google Scholar] [CrossRef]
  14. Suzuki, S.; Prayongphan, S.; Ichikawa, Y.; Chae, B.G. In situ observations of the swelling of bentonite aggregates in NaCl solution. Appl. Clay Sci. 2005, 29, 89–98. [Google Scholar] [CrossRef]
  15. Segad, M.; Hanski, S.; Olsson, U.; Ruokolainen, J.; Åkesson, T.; Jönsson, B. Microstructural and swelling properties of Ca and Na montmorillonite: (in situ) observations with Cryo-TEM and SAXS. J. Phys. Chem. C 2012, 116, 7596–7601. [Google Scholar] [CrossRef]
  16. Xu, Y.; Xiang, G.; Jiang, H.; Chen, T.; Chu, F. Role of osmotic suction in volume change of clays in salt solution. Appl. Clay Sci. 2014, 101, 354–361. [Google Scholar] [CrossRef]
  17. Chen, Y.G.; Zhu, C.M.; Ye, W.M.; Cui, Y.J.; Chen, B. Effects of solution concentration and vertical stress on the swelling behavior of compacted GMZ01 bentonite. Appl. Clay Sci. 2016, 124–125, 11–20. [Google Scholar] [CrossRef]
  18. Widomski, M.K.; Stępniewski, W.; Musz-Pomorska, A. Clays of Different Plasticity as Materials for Landfill Liners in Rural Systems of Sustainable Waste Management. Sustainability 2018, 10, 2489. [Google Scholar] [CrossRef] [Green Version]
  19. Slaný, M.; Jankovič, L.; Madejová, J. Structural characterization of organo-montmorillonites prepared from a series of primary alkylamines salts: Mid-IR and near-IR study. Appl. Clay Sci. 2019, 176, 11–20. [Google Scholar] [CrossRef]
  20. Manikandan, R.; Ramamurthy, K. Swelling characteristic of bentonite on pelletization and properties of fly ash aggregates. J. Mater. Civil. Eng. 2009, 21, 578–586. [Google Scholar] [CrossRef]
  21. Camillis, D.M.; Emidio, D.G.; Bezuijen, A.; Verástegui-Flores, R.D. Hydraulic conductivity and swelling ability of a polymer modified bentonite subjected to wet–dry cycles in seawater. Geotext. Geomembr. 2016, 44, 739–747. [Google Scholar] [CrossRef]
  22. Zhou, S.W.; Xu, M.G.; Ma, Y.B.; Chen, S.B.; Wei, D.P. Aging mechanism of copper added to bentonite. Geoderma 2008, 147, 86–92. [Google Scholar] [CrossRef]
  23. Gomes, P.C.; Fontes, M.P.F.; Silva, D.A.G.; Mendonça, D.S.E.; Netto, A.R. Selectivity sequence and competitive adsorption of heavy metals by Brazilian soils. Soil Sci. Soc. Am. J. 2001, 65, 1115–1121. [Google Scholar] [CrossRef]
  24. Hu, W.; Lu, S.; Song, W.; Chen, T.; Hayat, T.; Alsaedi, N.S.; Liu, H. Competitive adsorption of U (VI) and Co (II) on montmorillonite: A batch and spectroscopic approach. Appl. Clay Sci. 2018, 157, 121–129. [Google Scholar] [CrossRef]
  25. Batchelor, B. Leach models for contaminants immobilized by pH-dependent mechanisms. Environ. Sci. Technol. 1998, 32, 1721–1726. [Google Scholar] [CrossRef]
  26. Tahervand, S.; Jalali, M. Sorption and desorption of potentially toxic metals (Cd, Cu, Ni and Zn) by soil amended with bentonite, calcite and zeolite as a function of pH. J. Geochem. Explor. 2017, 181, 148–159. [Google Scholar] [CrossRef]
  27. Zhang, H.; Tong, Y.; Jia, Q. Corrosion of GMS bentonite by diffusion of strong alkaline solution. Chin. J. Rock Mech. Eng. 2020, 39, 166–176. [Google Scholar] [CrossRef]
  28. Ito, H. Compaction properties of granular bentonites. Appl. Clay Sci. 2006, 31, 47–55. [Google Scholar] [CrossRef]
  29. Hoffmann, C.; Alonso, E.E.; Romero, E. Hydro-mechanical behaviour of bentonite pellet mixtures. Phys. Chem. Earth 2007, 32, 832–849. [Google Scholar] [CrossRef] [Green Version]
  30. Gleason, M.H.; Daniel, D.E.; Eykholt, G.R. Calcium and sodium bentonite for hydraulic containment applications. J. Geotech. Geoenviron. Eng. 1997, 123, 438–445. [Google Scholar] [CrossRef]
  31. Yang, S.; Ren, X.; Zhao, G.; Shi, W.; Montavone, G.; Grambowe, B.; Wang, X. Competitive sorption and selective sequence of Cu (II) and Ni (II) on montmorillonite: Batch, modeling, EPR and XAS studies. Geochim. Cosmochim. Acta 2015, 166, 129–145. [Google Scholar] [CrossRef]
  32. Yan, C.; Li, G.; Xue, P.; Wei, Q.; Li, Q. Competitive effect of Cu (II) and Zn (II) on the biosorption of lead (II) by Myriophyllum spicatum. J. Hazard. Mater. 2010, 179, 721–728. [Google Scholar] [CrossRef]
  33. Turer, D. Effect of heavy metal and alkali contamination on the swelling properties of kaolinite. Environ. Geol. 2007, 52, 421–425. [Google Scholar] [CrossRef]
  34. Liu, Z.R.; Uddin, M.A.; Sun, Z.X. FT-IR and XRD analysis of natural Na-bentonite and Cu (II)-loaded Na-bentonite. Spectrochim. Acta Part A Mol. Biomol. Spectrosc. 2011, 79, 1013–1016. [Google Scholar] [CrossRef]
  35. Unuabonah, E.I.; Adebowale, K.O.; Olu-Owolabi, B.I.; Yang, L.Z.; Kong, L. Adsorption of Pb (II) and Cd (II) from aqueous solutions onto sodium tetraborate-modified Kaolinite clay: Equilibrium and thermodynamic studies. Hydrometallurgy 2008, 93, 1–9. [Google Scholar] [CrossRef]
  36. Mercier, L.; Detellier, C. Preparation, characterization, and applications as heavy metals sorbents of covalently grafted thiol functionalities on the interlamellar surface of montmorillonite. Environ. Sci. Technol. 1995, 29, 1318–1323. [Google Scholar] [CrossRef] [PubMed]
  37. Kraepiel, A.M.L.; Keller, K.; Morel, F.M.M. A model for metal adsorption on montmorillonite. J. Colloid Interface Sci. 1999, 210, 43–54. [Google Scholar] [CrossRef] [PubMed] [Green Version]
  38. Agassi, M.; Shainberg, I.; Morin, J. Effect of electrolyte concentration and soil sodicity on infiltration rate and crust formation. Soil Sci. Soc. Am. J. 1981, 45, 848–851. [Google Scholar] [CrossRef]
  39. Kazman, Z.; Shainberg, I.; Gal, M. Effect of low levels of exchangeable sodium and applied phosphogypsum on the infiltration rate of various soils. Soil Sci. 1983, 135, 184–192. [Google Scholar] [CrossRef]
Figure 1. Schematic diagram of non-load swelling experiment.
Applsci 11 03881 g001
Figure 2. Schematic diagram of shrinkage experiment.
Applsci 11 03881 g002
Figure 3. Relation between free swelling ratio and the solution concentration(c represents the concentration of solution).
Applsci 11 03881 g003
Figure 4. (a) The non-load swelling curve of bentonite (b) the comparison between free swell rate and final swell rate.
Applsci 11 03881 g004
Figure 5. (a) Shrinkage curve (b) mass loss curve.
Applsci 11 03881 g005
Figure 6. Logarithmic curve of shrinkage.
Applsci 11 03881 g006
Figure 7. X-ray diffraction spectrum.
Applsci 11 03881 g007
Figure 8. Element content of bentonite: (a) Ca, Fe, K, Mn, P, and Ti (b) Al and Na, (c) Mg (d) Si.
Applsci 11 03881 g008
Figure 9. Diagram of interlayer cation exchange.
Applsci 11 03881 g009
Figure 10. Relation between potential energy and particle spacing.
Applsci 11 03881 g010
Table 1. The material properties of bentonite.
Physical PropertiesValue
Specific gravity2.73
Liquid limit 126.1%
Plastic limit44.1%
Plasticity index82
Cation exchange capacity0.407 mEq/g
Content of montmorillonite65.2%
Table 2. pH Value of CuSO4 Solution.
Solutionc (g/L)
02.5510
pH6.854.504.474.42
Table 3. The undetermined parameters and correlation coefficient.
Coefficient c(g/L)
02.5510
A10.9550.7310.034−0.012
A234.41070.740254.13311.700
t0907.5113008.98455,932.723530.176
P1.8451.1610.7580.893
R20.9860.9870.9960.997
Table 4. Summary of correlation coefficient and undetermined coefficient.
Coefficientc(g/L)
02.5510
A10.6100.4110.4490.410
A25.6985.5804.6595.045
t05.3505.2675.2366.199
p5.6404.9076.7444.082
R20.9800.9830.9880.973
Publisher’s Note: MDPI stays neutral with regard to jurisdictional claims in published maps and institutional affiliations.

