Abstract
Wavefront shaping through a multi-core fiber (MCF) is turning into an attractive method for endoscopic imaging and optical cell-manipulation on a chip. However, the discrete distribution and the low number of cores induce pixelated phase modulation, becoming an obstacle for delivering complex light field distributions through MCFs. We demonstrate a novel phase retrieval algorithm named Core–Gerchberg–Saxton (Core-GS) employing the captured core distribution map to retrieve tailored modulation hologram for the targeted intensity distribution at the distal far-field. Complex light fields are reconstructed through MCFs with high fidelity up to 96.2%. Closed-loop control with experimental feedback denotes the capability of the Core-GS algorithm for precise intensity manipulation of the reconstructed light field. Core-GS provides a robust way for wavefront shaping through MCFs; it facilitates the MCF becoming a vital waveguide in endoscopic and lab-on-a-chip applications.
1. Introduction
Wavefront shaping has emerged as a powerful tool due to the progress of spatial light modulators (SLMs) enabling program control of light. Specifically, structured illumination facilitates microscopic resolution improvement beyond the diffraction limit [1,2]. Digital optical phase conjugation (DOPC), which back-projects the conjugated phase of the measured light field for focusing through a scattering medium, enables imaging through deep tissues [3,4] or intact bones [5,6] and the monitoring of micromotors [7]. Advances in wavefront shaping through step-index multi-mode fibers [8,9,10] enables deep brain imaging with minimum invasiveness [11,12], providing higher degree of freedom for optical manipulation of microparticles [9] or biological cells [13]. Introduced in [13], a dynamic modulated double-lobe mode profile through a few-mode fiber leads to the rotation of biological cells in a dual-beam trap. However, the decoupled mode from the multi-mode fiber depends on the polarization, fiber length and bending radius [14], which requires complex calibration procedure [8]. The multi-core fiber (MCF) is a bundle of single-mode fiber cores with a diameter around several hundred micrometers. Individually modulating phase of cores transforms the MCF to a phased-array for precise wavefront shaping in the region of interest (ROI) close to the diffraction limit. Recently, it is investigated that the performance of a precisely-twisted MCF is not affected by fiber bending [15], which shows the potential of MCFs becoming a more flexible waveguide beyond multi-mode fibers. Nevertheless, DOPC is required to compensate for the optical path difference between cores which can lead to phase distortion when light propagating through an MCF [16,17,18]. Focus scanning employing simple wavefront shaping through MCFs is thus achieved [19,20,21,22], paving the way to lensless endoscopy. Besides, dynamic wavefront control in an MCF-based dual-beam trap enables optical manipulation of the cell-orientation. However, the discrete distribution and lower number of cores induce strong spatial sampling when the modulated light is coupled into the MCF, leading to spatial aliasing in the fiber output. Especially for complex wavefront shaping through MCFs, the spatial aliasing can cause strong distortions in the output light field.
We propose a novel phase retrieval algorithm named Core–Gerchberg–Saxton (Core-GS) which is specialized for complex wavefront shaping through an MCF. The experimentally captured core distribution map is implemented for simulating the spatial core sampling on the MCF facet, overcoming the limitations from the pixelation of MCFs. Complex light fields can thus be formed at the distal far-field of MCFs with high fidelity. Closed-loop control with on-the-fly experimental feedback enables precise intensity control of the wavefront shaping. Benefiting from the rather small diameter of the MCF, our approach can open new perspectives for MCFs becoming a vital waveguide in nanotechnologies and biophotonics, for instance, lab-on-a-chip applications.
2. Phase Distortion Compensation in a Multi-Core Fiber
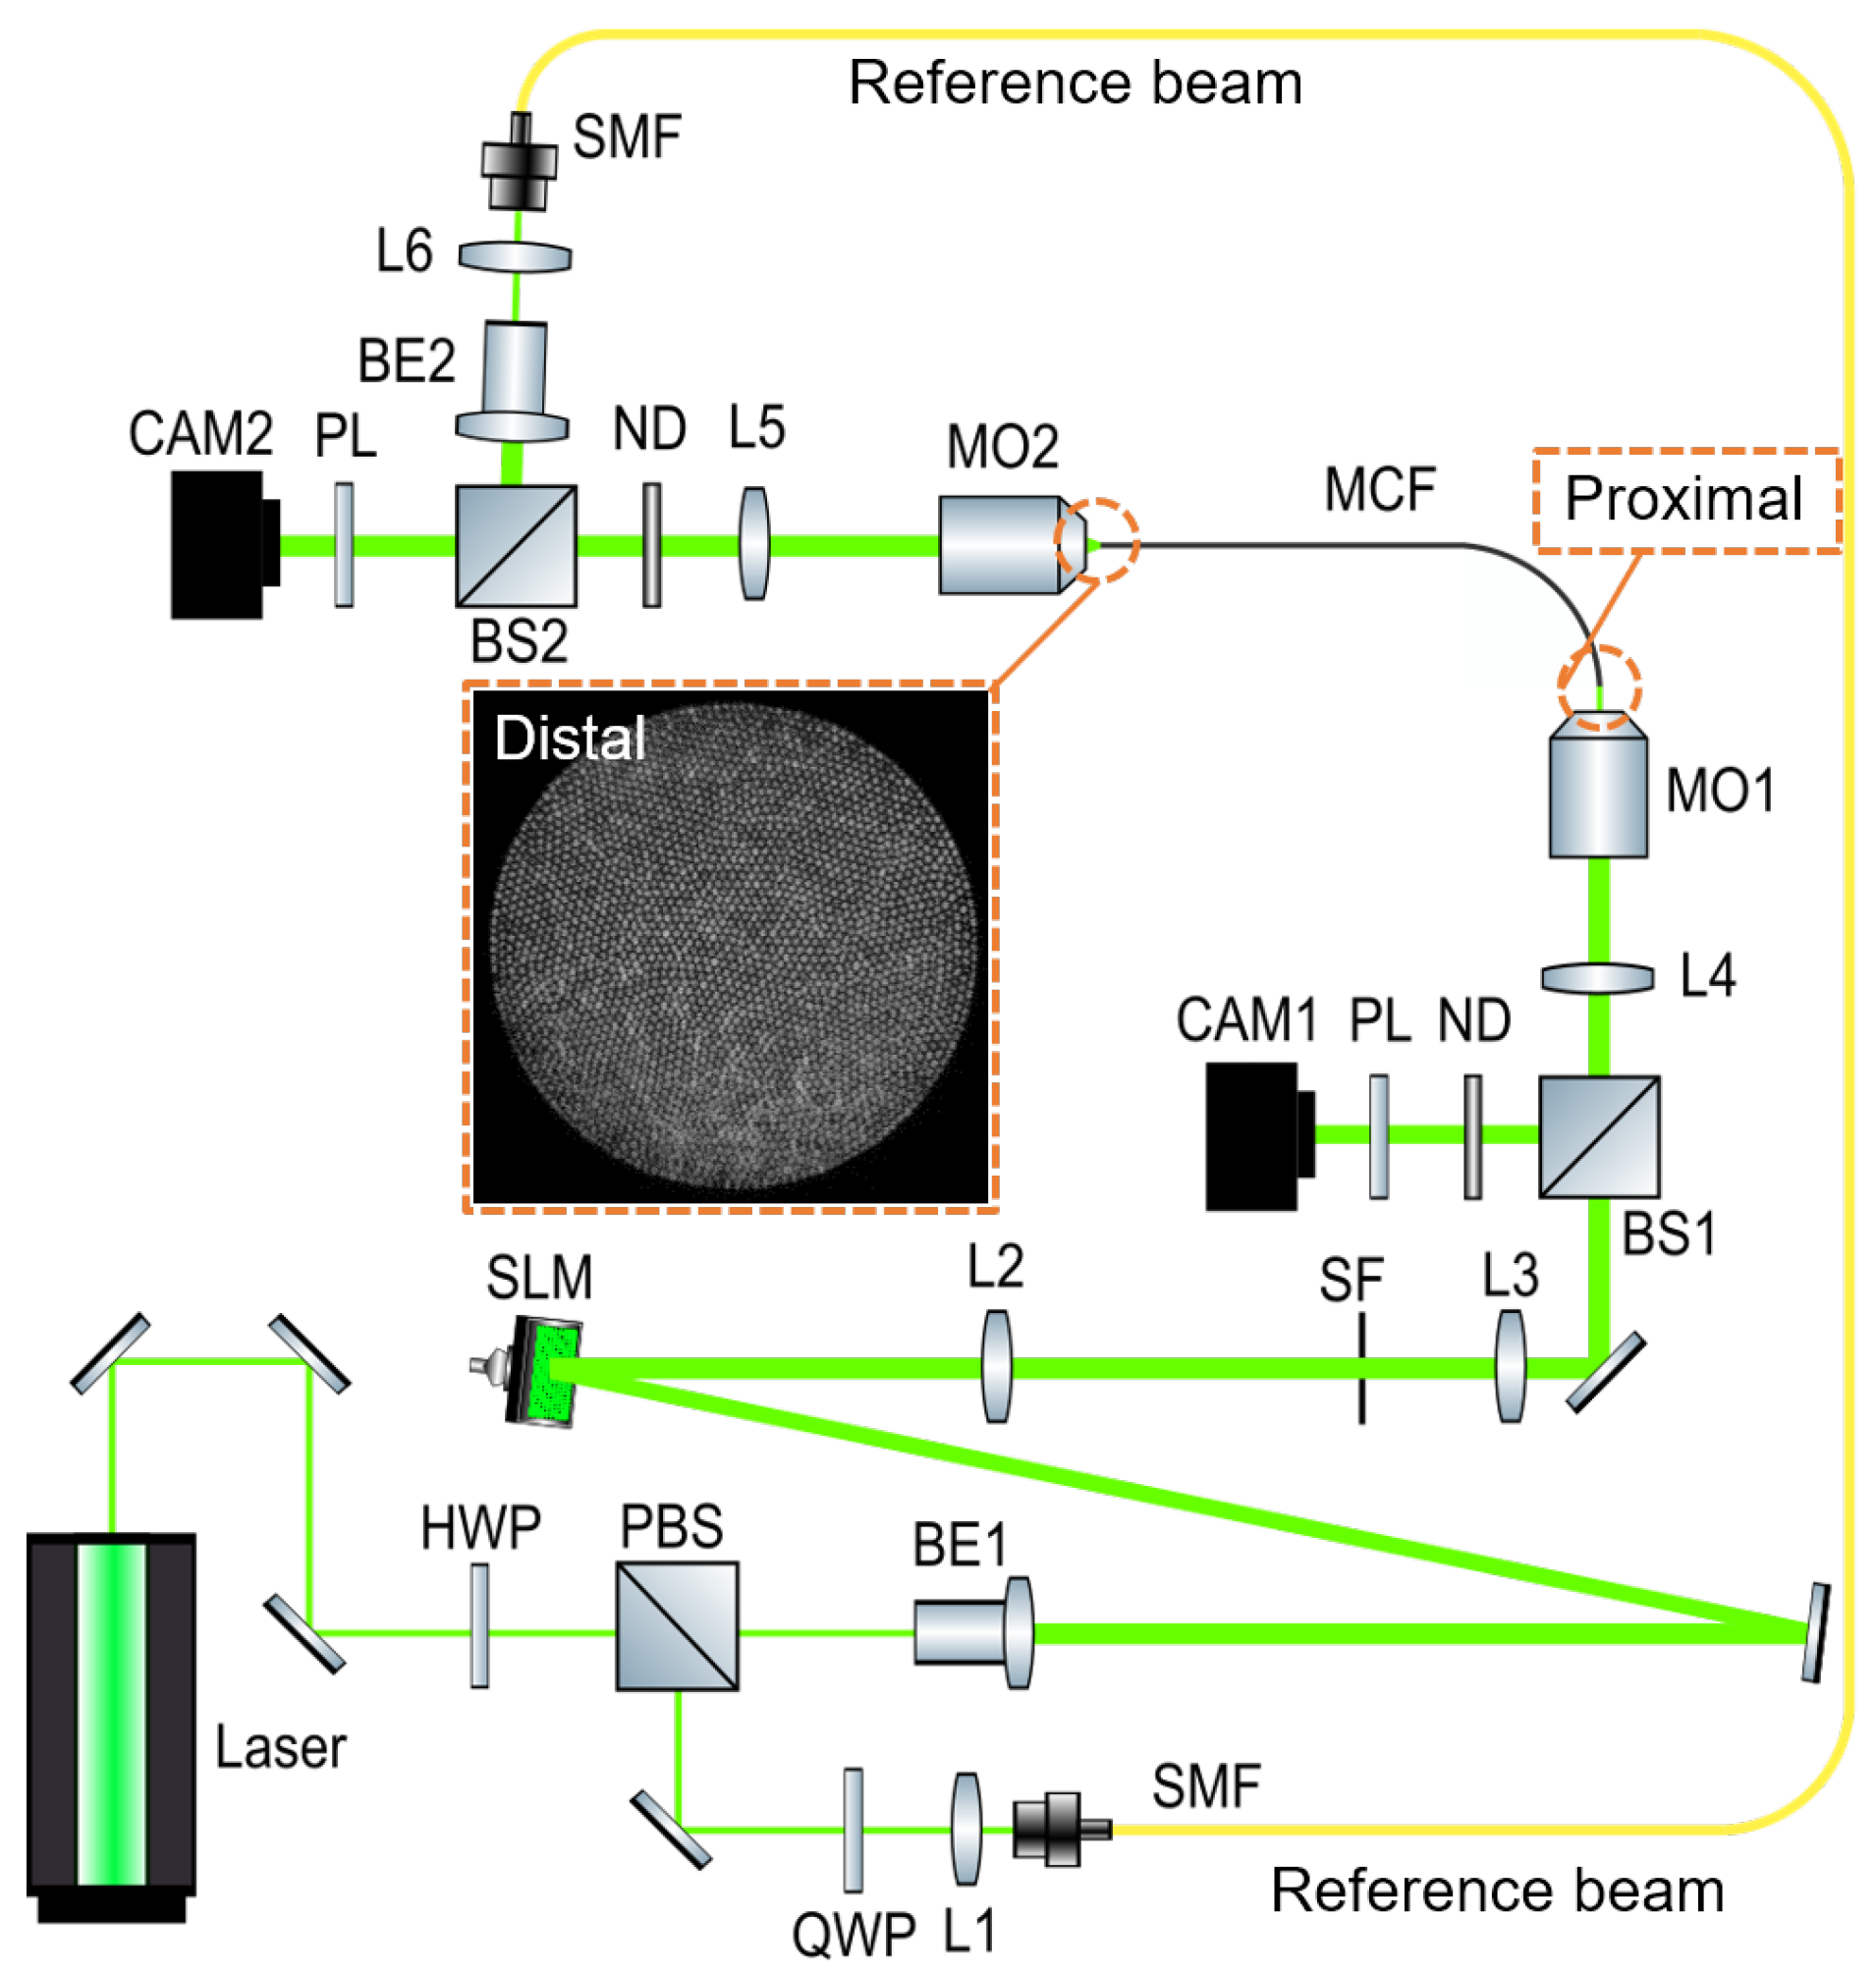
A multi-core fiber (MCF) consists of about 10,000 single-mode cores with a diameter of 350 µm. Modulating the input phase of each core by the spatial light modulator (SLM) at the proximal side, the MCF is thus functioned as a phased-array waveguide for tailored light field delivery. However, due to the optical path difference between individual cores, a plane-wave illumination at the proximal facet results in a random speckle pattern at the distal output. DOPC [23,24] is implemented to compensate the phase distortion [16,17,18]. The phase delay of each core is measured at the distal side using off-axis holography, and the conjugated phase is then displayed on the SLM to precompensate for the phase distortion. The experimental setup is shown in Figure 1. The laser beam from a 532-nm diode-pumped solid-state laser (Verdi, Coherent Inc., Santa Clara, CA, USA) is split by the polarizing beamsplitter, the intensity ratio of both beams can be adjusted by rotating the half-wave plate. One of the beams is coupled into the single-mode fiber (SMF) as the reference beam, and the quarter-wave plate is used to isolate the back-reflected light. The other beam is expanded and illuminates the liquid crystal panel of the SLM (PLUTO, Holoeye Photonics AG, Munich, Germany). For higher diffraction efficiency, a blazed grating is displayed on the SLM. The phase modulated light passes through a 4-f telescope system (L2-L3) and the first diffraction order is filtered out by the spatial filter (iris diaphragm, Thorlabs, Germany) [25,26]. The diameter of the beam is further minified by a microscope system (L4, MO1) and the phase modulation is thus projected on the proximal MCF (FIGH-10-350S, Fujikura, Japan) facet. Assuming the intensity distribution of the in-coupling light is homogeneous, the phase delay in the MCF is , the light field at the distal facet can be expressed as
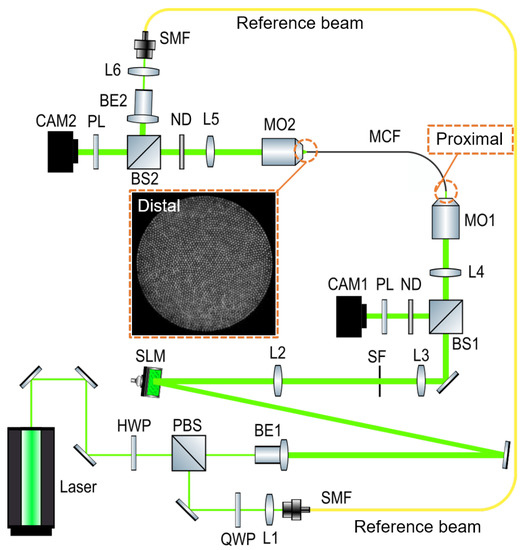
Figure 1.
Sketch of the experimental setup. A microscopic image of the distal facet of the MCF is shown in the middle of the figure. HWP, half-wave plate; PBS, polarizing beamsplitter; BE, beam expander; QWP, quarter-wave plate; L, lenses; SMF, single-mode fiber; SLM, spatial light modulator; SF, spatial filter; BS, beamsplitter; ND, neutral density filters; CAM, CMOS cameras; MO, microscope objectives; MCF, multi-core fiber; PL, polarizer.
The distal facet is imaged on the CMOS camera (CAM2) by a microscope system (MO2, L5) and interfered with the reference beam which is slightly tilted for off-axis holography [27,28]. To measure the phase delay , a Gaussian beam is illuminated on the proximal facet. The phase at the distal facet is thus reconstructed from the off-axis hologram by the angular spectrum method [29]. The measured phase delay is conjugated and displayed on the SLM to precompensate for the phase distortion.
where c is a constant. The phase delays of cores are thus compensated at the distal facet, and the compensated light field is
As the phase delays can be compensated by the DOPC, it is thus possible for simple wavefront shaping through the MCF. For instance, a focus can be generated in the distal far-field with a tailored Fresnel lens. For a core centered at in the coordinate system of the SLM, the phase modulation value for the Fresnel lens is
where a is the SLM pixel pitch, M is the microscopic magnification rate from the SLM and to the proximal fiber facet, f is the focal length, and is the center position of the SLM. Figure 2a demonstrates the light field at 600 µm away from the distal fiber facet with and without DOPC when a tailored Fresnel lens is displayed on the SLM. A high-quality focus with a 29 dB peak-to-background ratio (PBR) and close to diffraction limit full-width half maximum (FWHM) is achieved. The peak-to-background ratio (PBR) for an amplitude image is determined as
where the P is the peak amplitude of the image. To characterize the stability of the wavefront shaping through the MCF, the focus is captured by the camera every 10 s for 50 h under lab conditions. The standard deviation of the measured FWHM is only 0.55%, which denotes a robust wavefront shaping in our system. A similar approach was employed for focus scanning [22] and simple wavefront shaping [19] through the MCF. For complex wavefront shaping using SLMs, both the intensity and phase information at the target plane are required to reconstruct the desired light field. However, the phase information of the desired light field is often unknown for a complex light field. Therefore, a method which can calculate the phase directly from the intensity information is rather essential [30].

Figure 2.
(a,b) Distal far-field of MCF with and without DOPC for a tailored Fresnel lens input at the proximal side. The focus after the compensation has a peak-to-background ratio of 29 dB. The scale bar indicates a length of 5 µm. (c) The stability of the wavefront shaping through an MCF is characterized by the FWHM of the focus in 50 h. The standard deviation of the FWHM in 50 h is only 0.55%.
3. Complex Wavefront Shaping through a Multi-Core Fiber
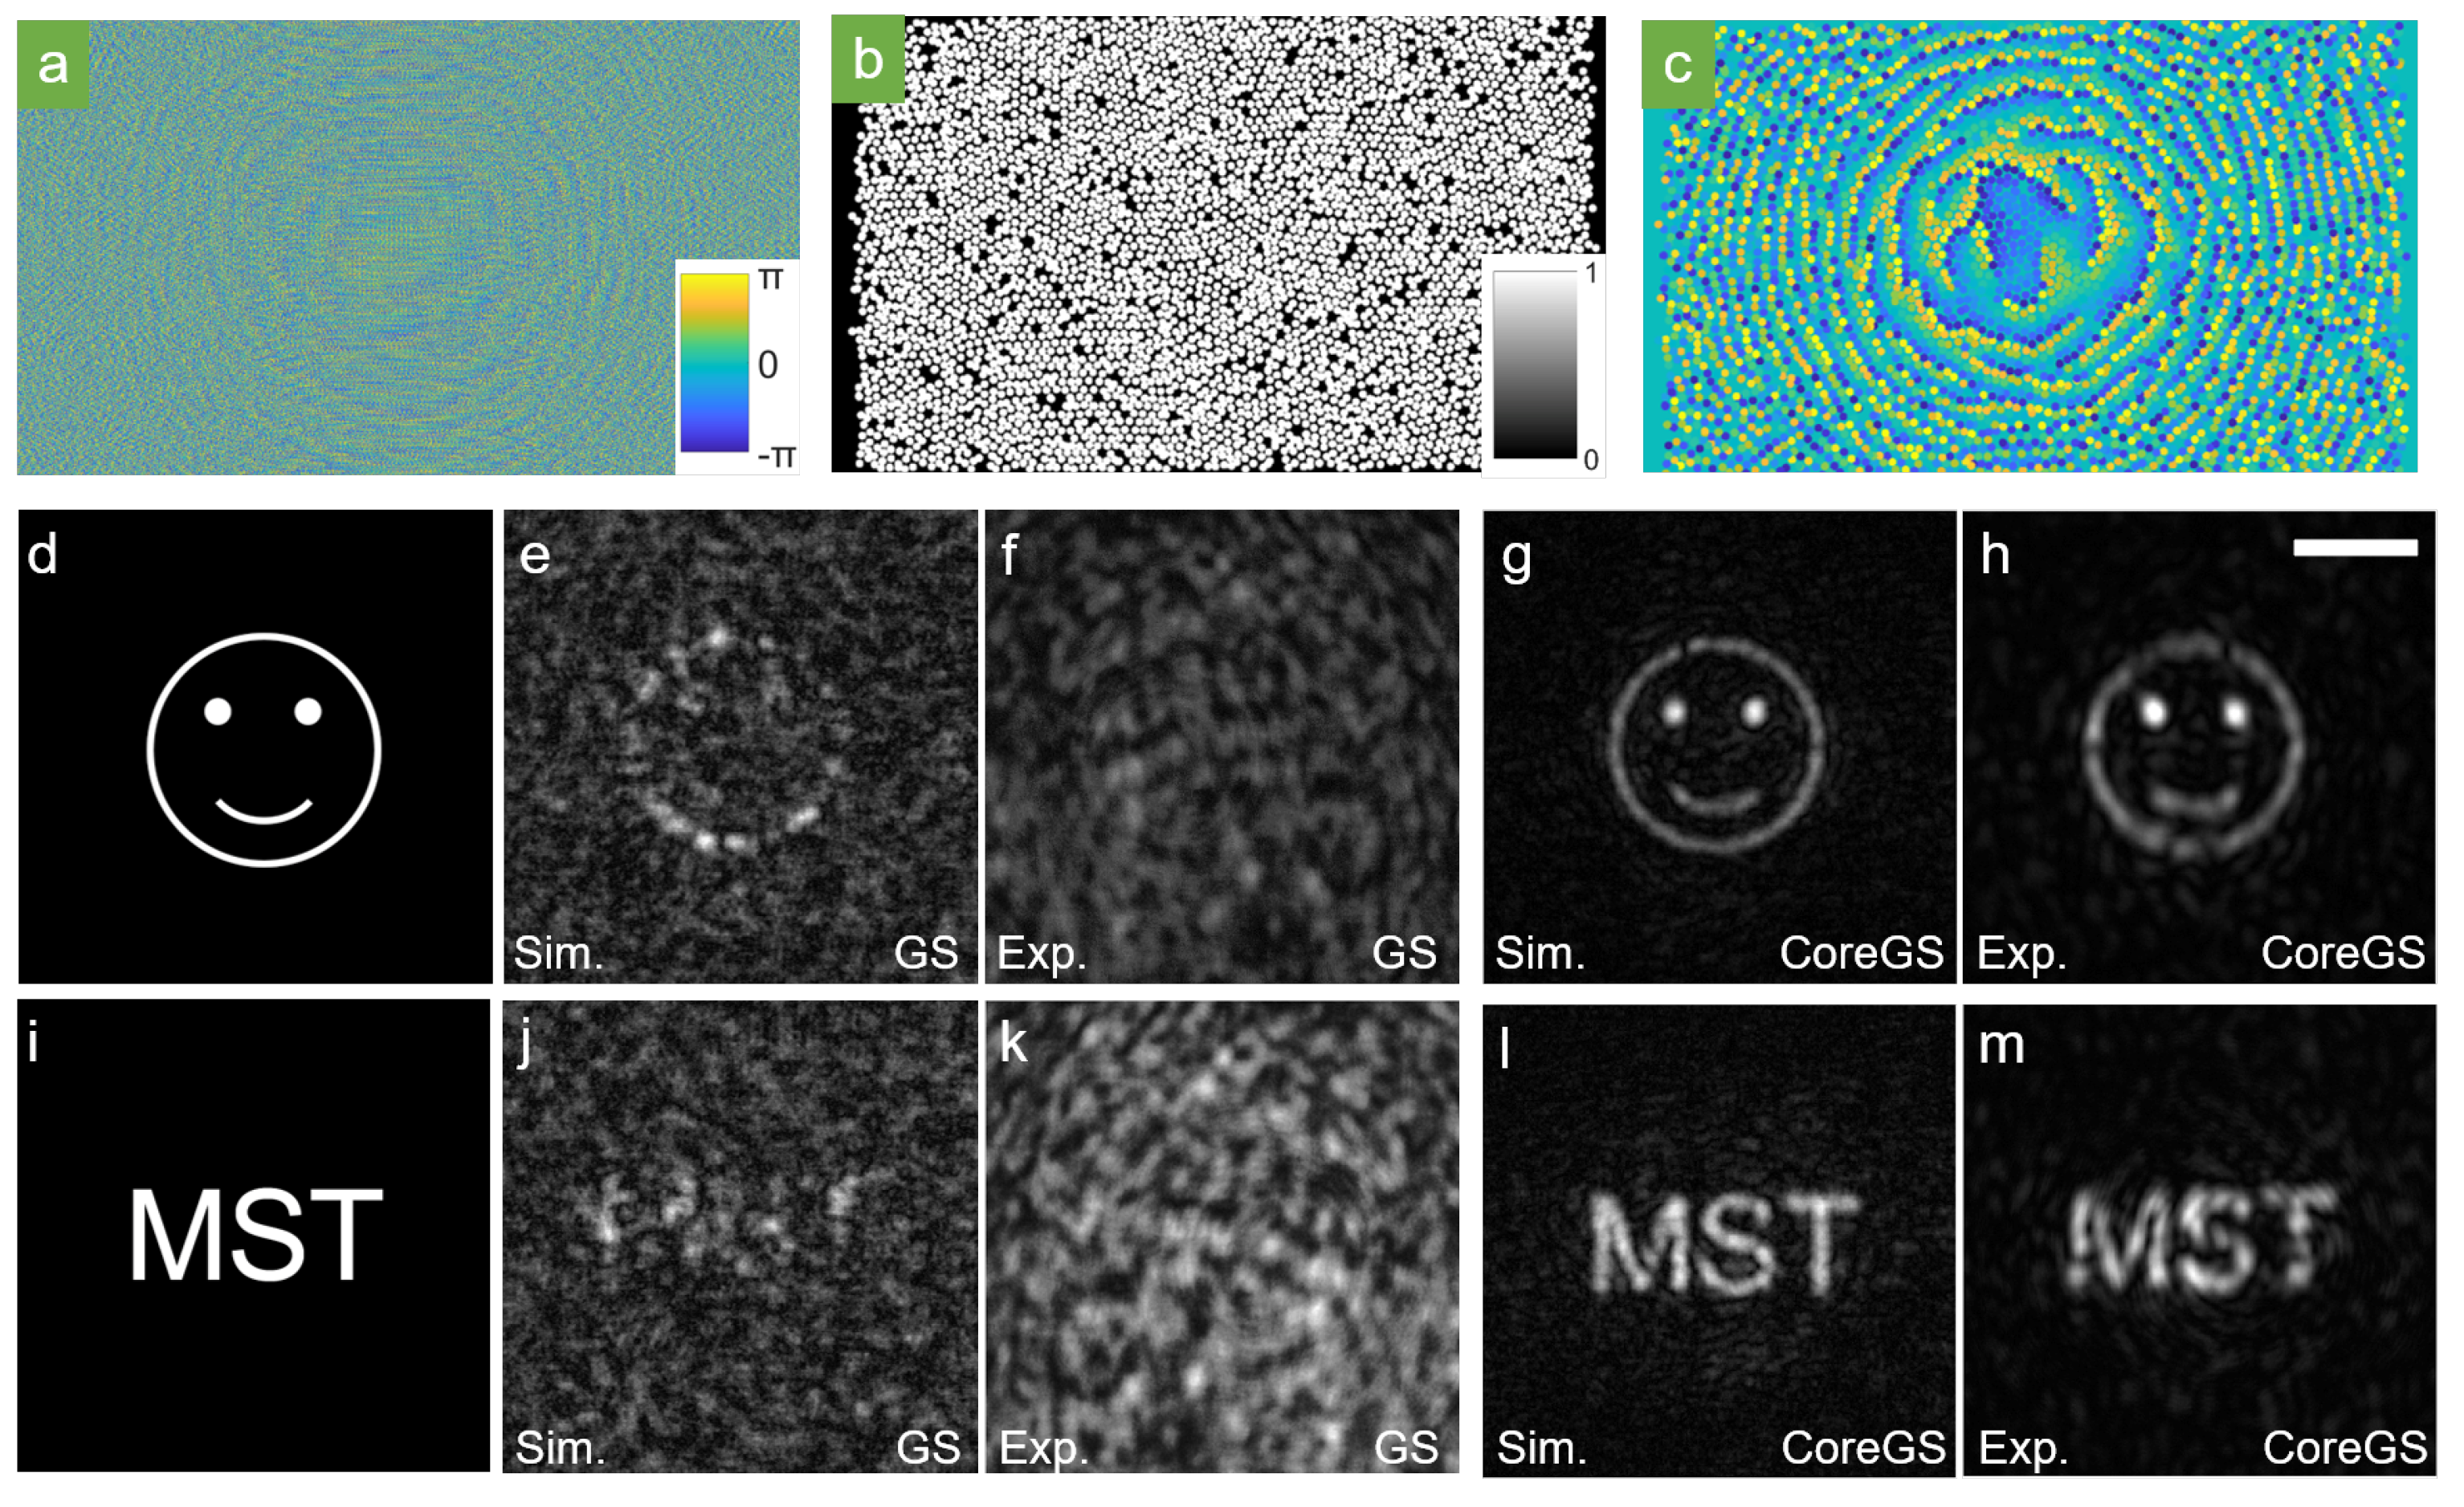
Gerchberg–Saxton (GS) algorithm [31,32] is an iterative phase retrieval approach, which is employed to retrieve the phase at the source plane from the intensity image at the target plane. Boosted progresses of SLMs make the GS algorithm a widely used approach to generate the precise modulation hologram of SLMs for reconstructing a complex light field at far-field [33,34]. Generally, this is an adequate approach for wavefront shaping employing SLMs [33]. However, the discrete distribution and the much lower number of cores than the pixel number of the SLM lead to spatial sampling when the modulated light is coupled into the MCF. This can result in strong image distortions at the distal far-field. To simulate the light field propagation through an MCF, the location of each core is detected from the image of the fiber facet, and the corresponding location of cores on the SLM is obtained by the affine transformed coordinate system of the camera. In the simulation, a GS algorithm generated phase (Figure 3a) is spatially sampled by the binary image of the core distribution map (Figure 3b). The simulated light fields at the target plane (Figure 3e,j) are strongly distorted and the experimental light fields transmit through a calibrated MCF (Figure 3f,k) are even indistinguishable.
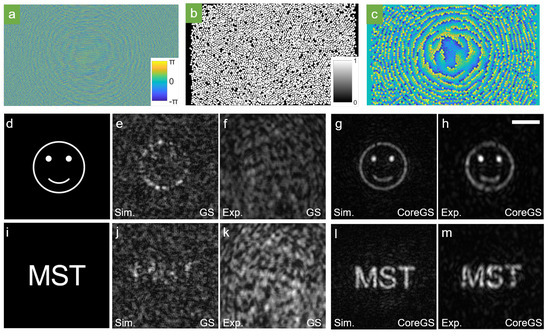
Figure 3.
(a) Normal Gerchberg–Saxton (GS) algorithm calculated hologram which can generate a smile face light field in the region of interest (ROI). (b) Binary image of the core distribution on the MCF facet. (c) Tailored hologram for the smile face light field employing the CoreGS algorithm. (d,i) The targeted distal far-field intensity distribution at 600 µm away from the MCF distal facet. (e,j) The simulated far-field intensity distribution employing the GS algorithm calculated hologram. (f,k) Experimental distal far-field intensity distribution through a MCF employing the GS algorithm calculated hologram. (g,l) The simulated distal far-field intensity distribution employing the Core-GS algorithm calculated hologram. (h,m) The experimental distal far-field intensity distribution through a MCF employing the Core-GS algorithm calculated hologram. The correlation coefficient between the experimental and simulated light field is 96.2% for the smiling face and 90.7% for the MST logo. The scale bar indicates a length of 20 µm.
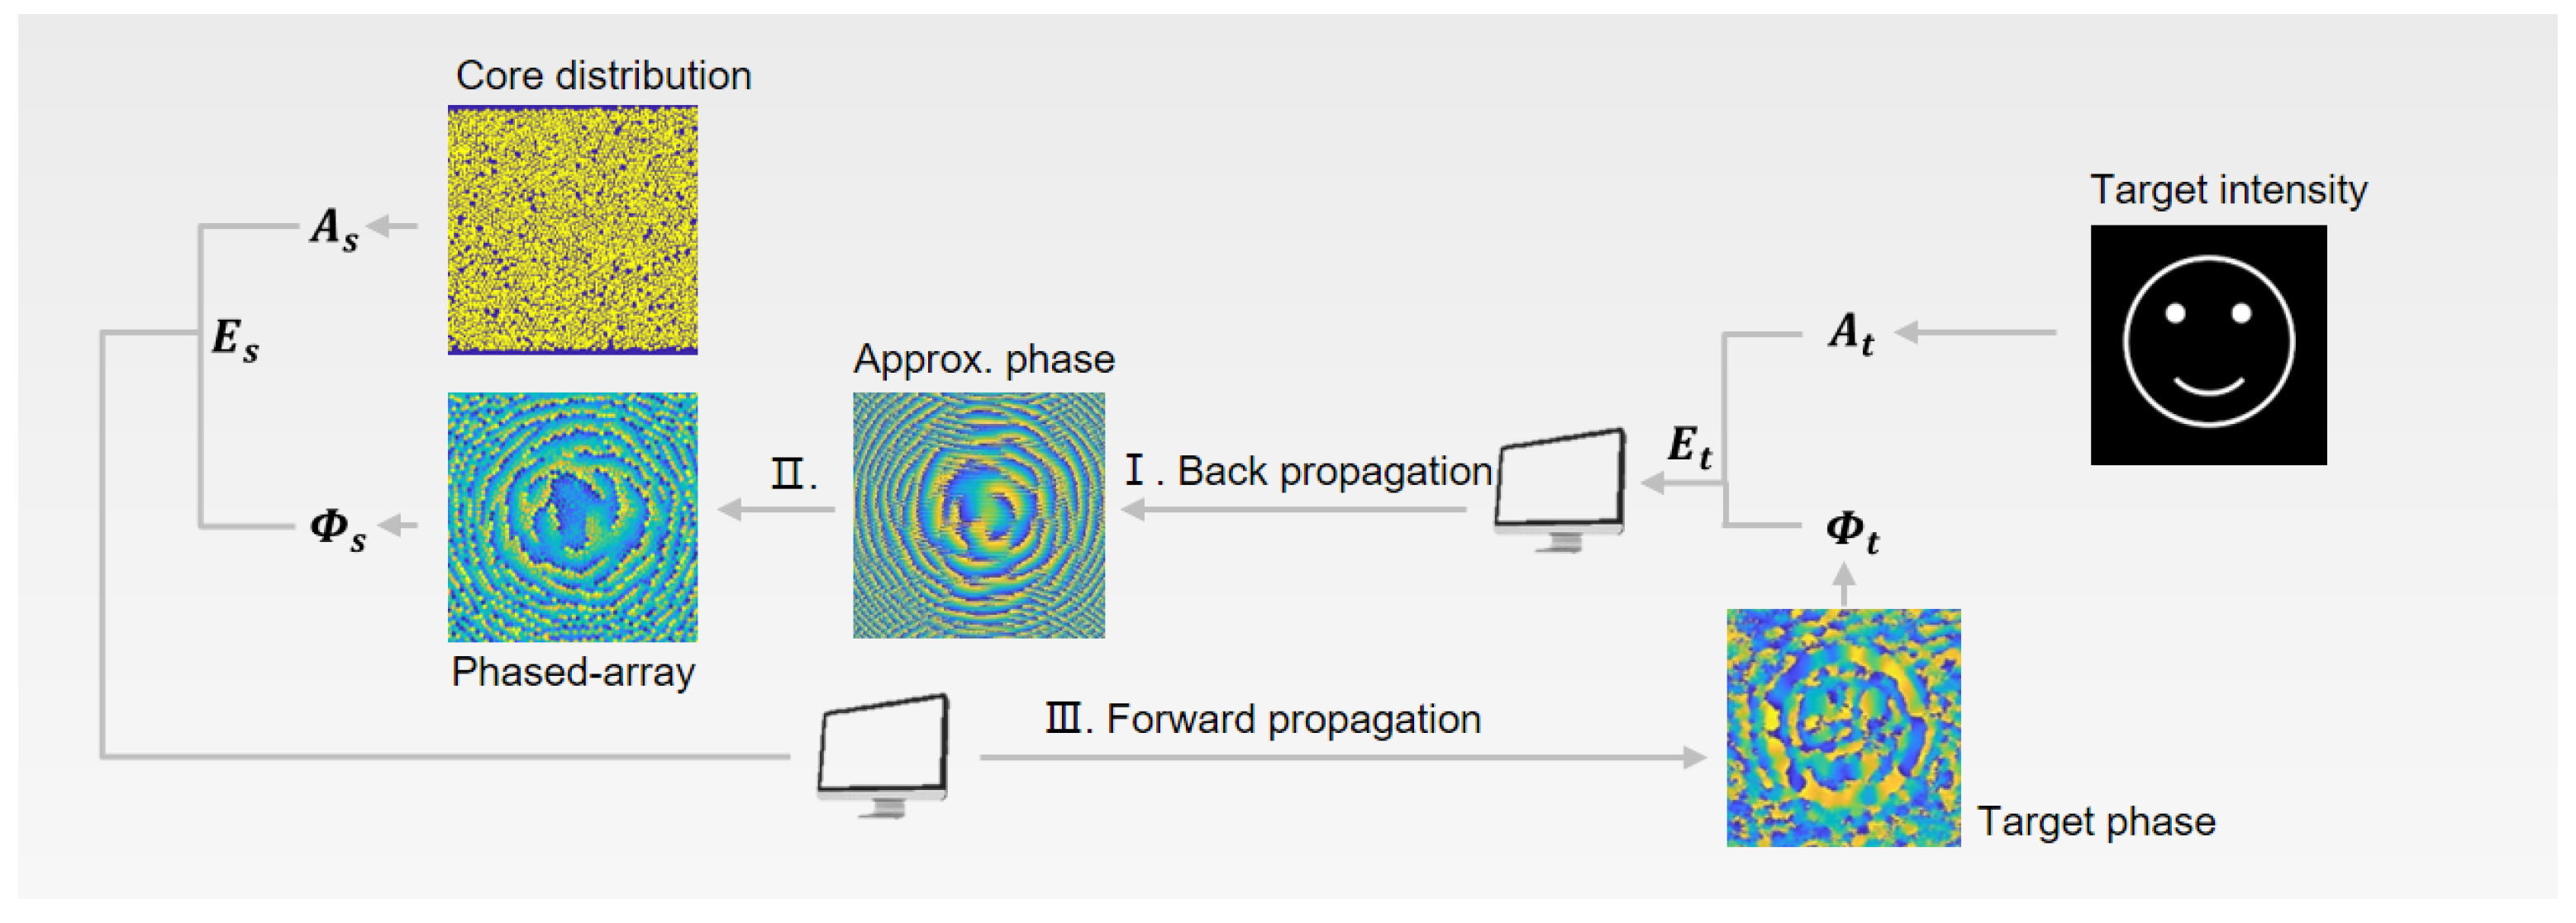
We propose an optimized algorithm named Core-GS, which is specialized for phase retrieval through MCFs. The source phase and intensity are spatially sampled by the core distribution map (Figure 4) in each iteration for better simulation of the propagation through the MCF.
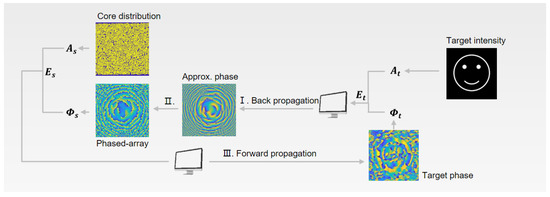
Figure 4.
Principle of the Core-GS algorithm. Intensity distribution and a random phase constitute the light field at the target plane, which is numerically back propagated to the source plane for retrieving the approximated phase at the source plane. A core distribution map is applied on both amplitude and phase image at the source plane for better simulation of the light propagation through the MCF. The complex light field is then forward propagated to the target plane to get the approximated phase image, which is used to constitute the complex light field at the target plane for the next iteration. The iteration stops while the correlation between forward propagated and the targeted intensity distribution reaches the threshold.
Shown in Figure 4, to retrieve the source phase for a target intensity , a random phase is generated and constitutes the complex light field at the target plane
The composed light field at the target plane is numerically backpropagated with fast Fourier transform (FFT) and inverse fast Fourier transform (iFFT) for phase retrieving
, are the spatial frequencies, z is the distance between the target and source plane. An experimental measured binary core distribution map is superposed on both intensity and phase image at the source plane for simulating the spatial sampling process through the MCF facet. The light field at the source plane is
which is then forward propagated to the target plane for updating the target phase
The correct phase at the source plane can be retrieved after about 20 iterations, which is then displayed on the SLM for complex wavefront shaping through the MCF.
The simulation results demonstrate that the Core-GS algorithm retrieved phase (Figure 3c) can reconstruct the complex light field with much higher quality (Figure 3g,l). The experimental results present the distal light field transmitted through a 50 cm long calibrated MCF (Figure 3h,m). Implementing the image correlation evaluation method introduced in [35], the experimental reconstructed distal far-field employing the Core-GS algorithm has a fidelity of 96.2% for the smiling face and 90.7% for the MST logo compared with the simulation. Hence, we demonstrate a robust phase retrieval algorithm for complex wavefront shaping through an MCF with high fidelity.
4. On-the-Fly Closed-Loop Control of Rotating Profile
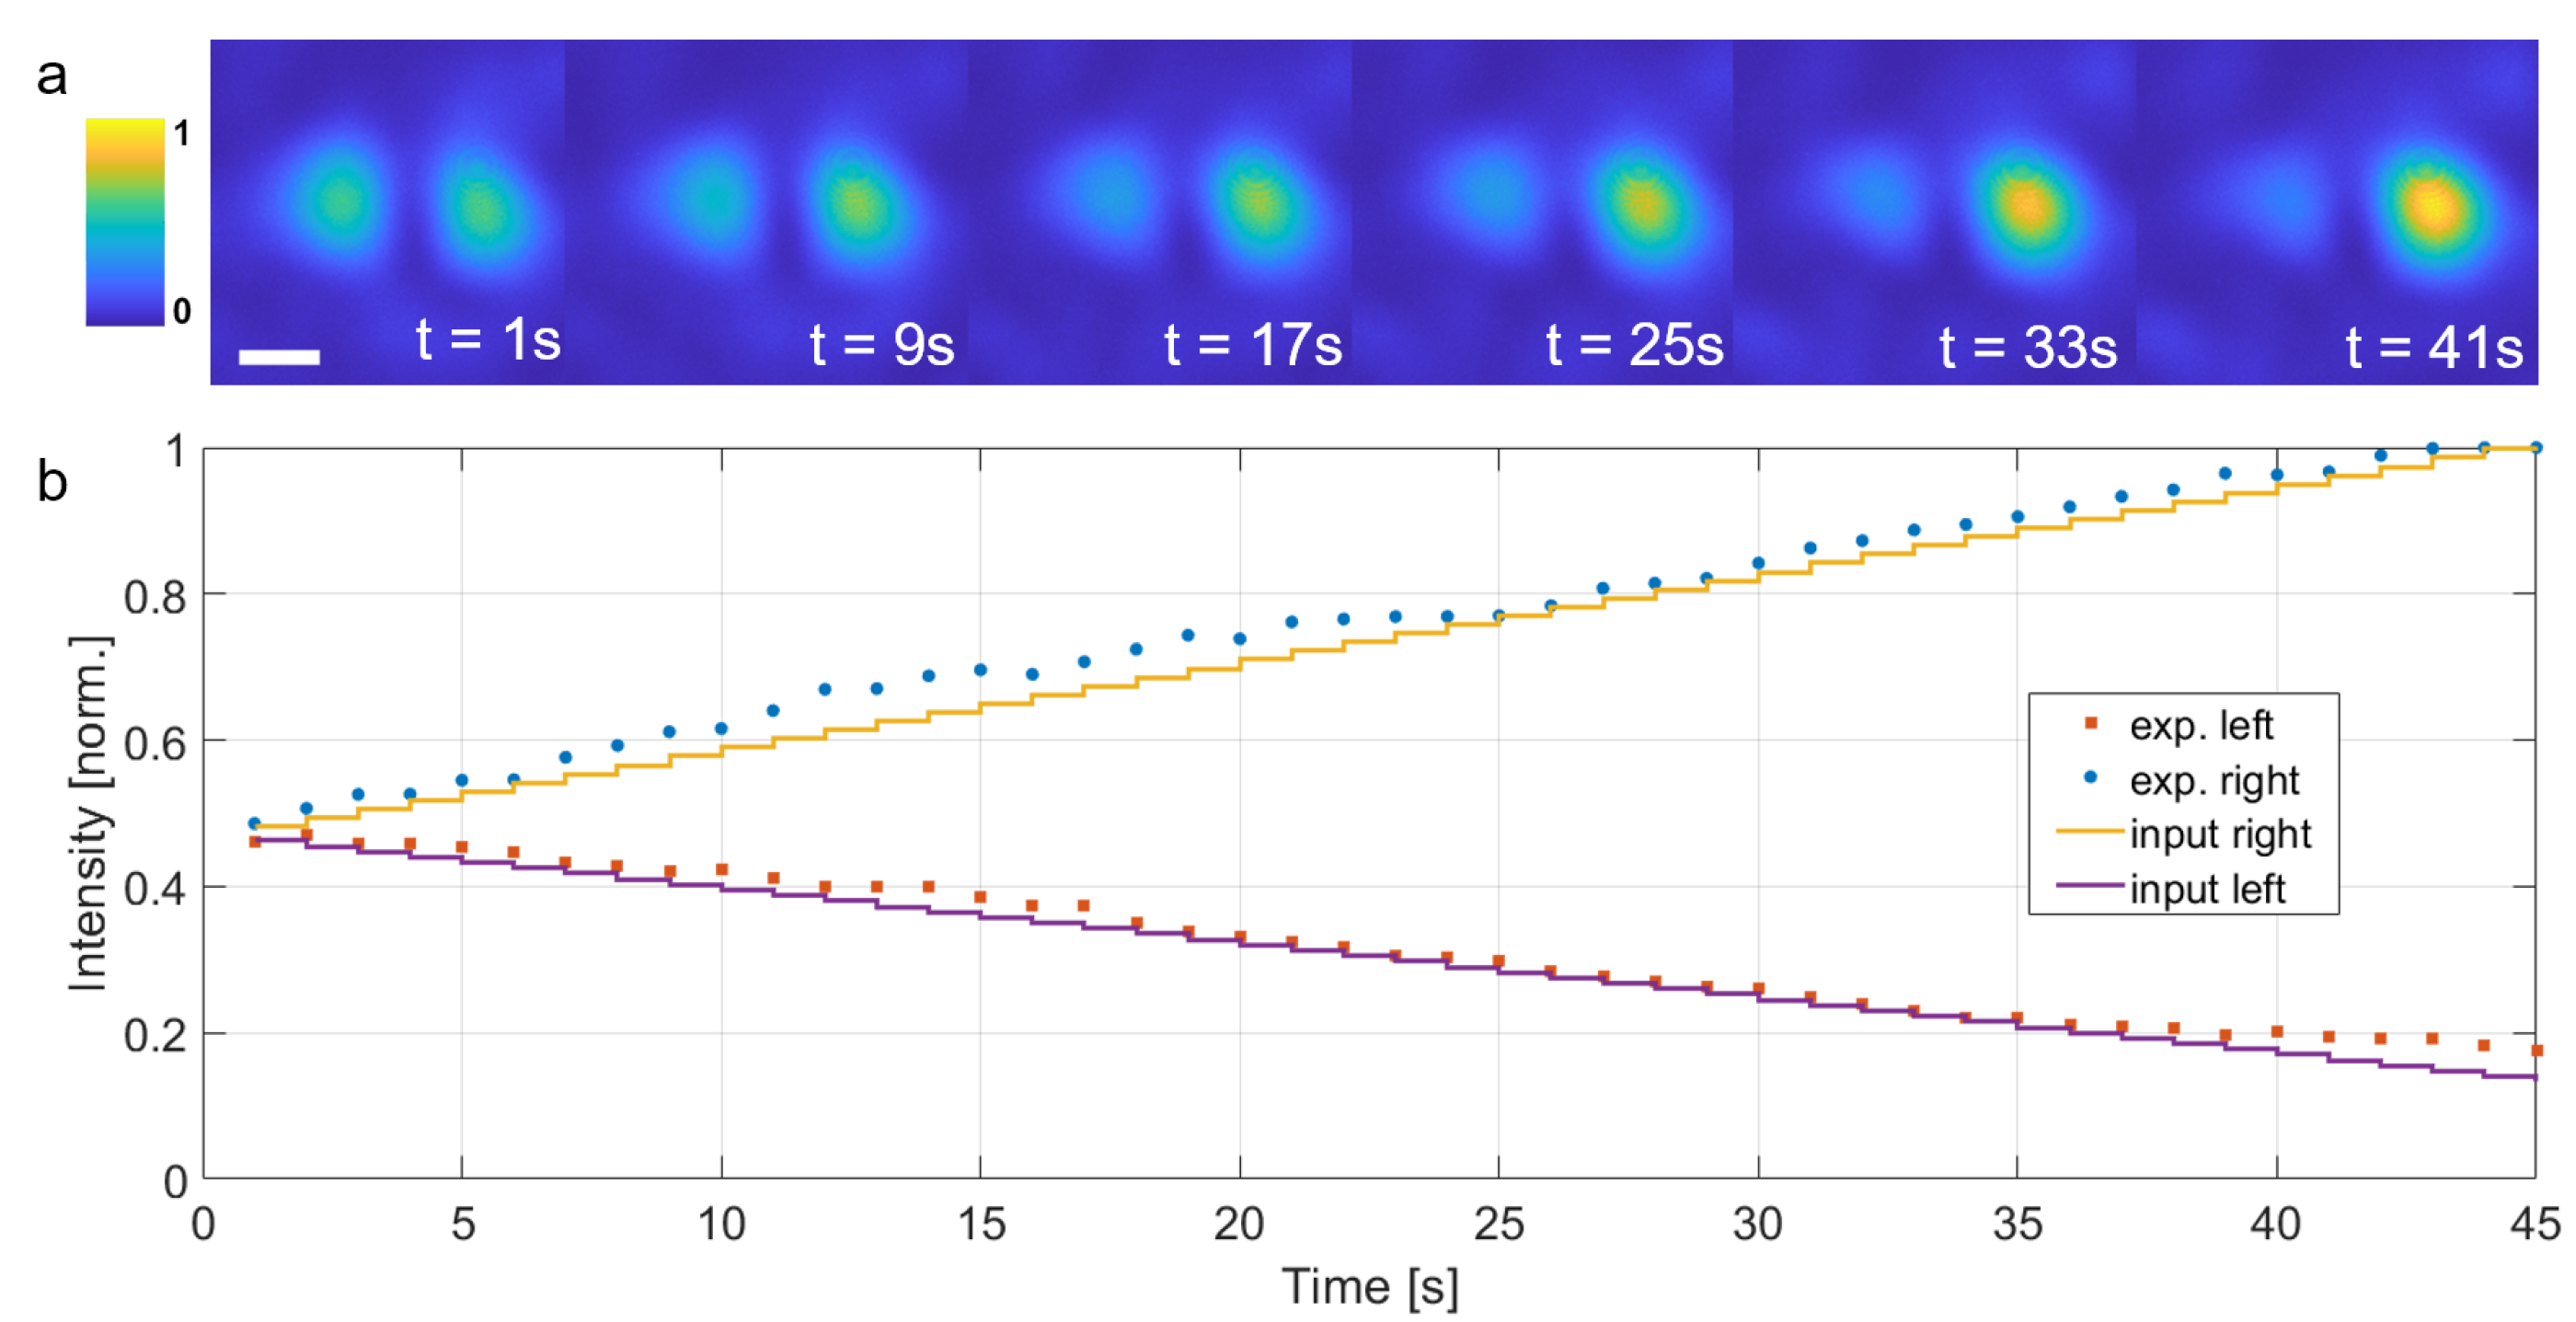
Complex wavefront shaping through an MCF can be a vital tool for MCF-based optical manipulation. We reported that the orientation of the cell can be controlled by a dynamically modulated asymmetric intensity profile. Due to the optical force depending on the intensity of the beam, precise intensity modulation of the asymmetric beam profile leads to optical force control. This provides higher degree of freedom for biological optical manipulation and can be implemented for cell mechanical measurements [36]. Since the Core-GS algorithm demonstrates powerful capability for manipulating the distal far-field intensity distribution, it is capable of manipulating the magnitude of the asymmetric intensity in the targeted light field. To demonstrate this, a dual-spot profile, for which the orientation and intensity can be characterized intuitively, is employed as the input intensity image. The intensity difference between both spots can be step modulated numerically. The experimental distal far-field through the MCF (Figure 5) characterized the robust intensity modulation employing the Core-GS algorithm.
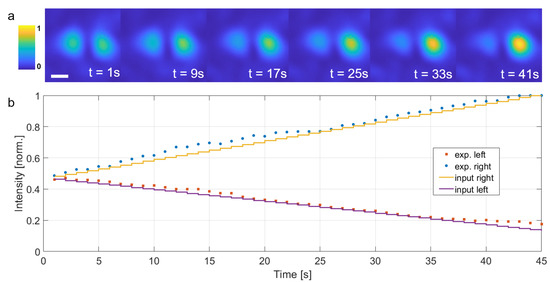
Figure 5.
(a) Intensity modulated dual-spot light field through a multi-core fiber employing Core-GS algorithm. The scale bar shows a length of 5 µm. (b) Normalized mean intensity of both spots and the corresponding modulated input target intensity.
A similar double-lobe intensity profile is reported in [13], using wavefront shaping through a few-mode fiber. However, intensity unbalanced double-lobe beam profile could lead to unstable cell rotation around more than one axis and unwanted movements of the cell. Due to the precise intensity modulation capability of the Core-GS algorithm, MCF-based dual-beam traps can have an advantage in complex wavefront control and intensity modulation in the trapping region with resolution close to diffraction limit. Therefore, we implement Core-GS algorithm to retrieve the modulation hologram for a rotating double-spot light field at the distal field. However, the internal intensity differences between both spots during the rotation are still obvious (Figure 8d) due to the minor inter-core crosstalk [37] and discrepancies of the calibration quality between cores.
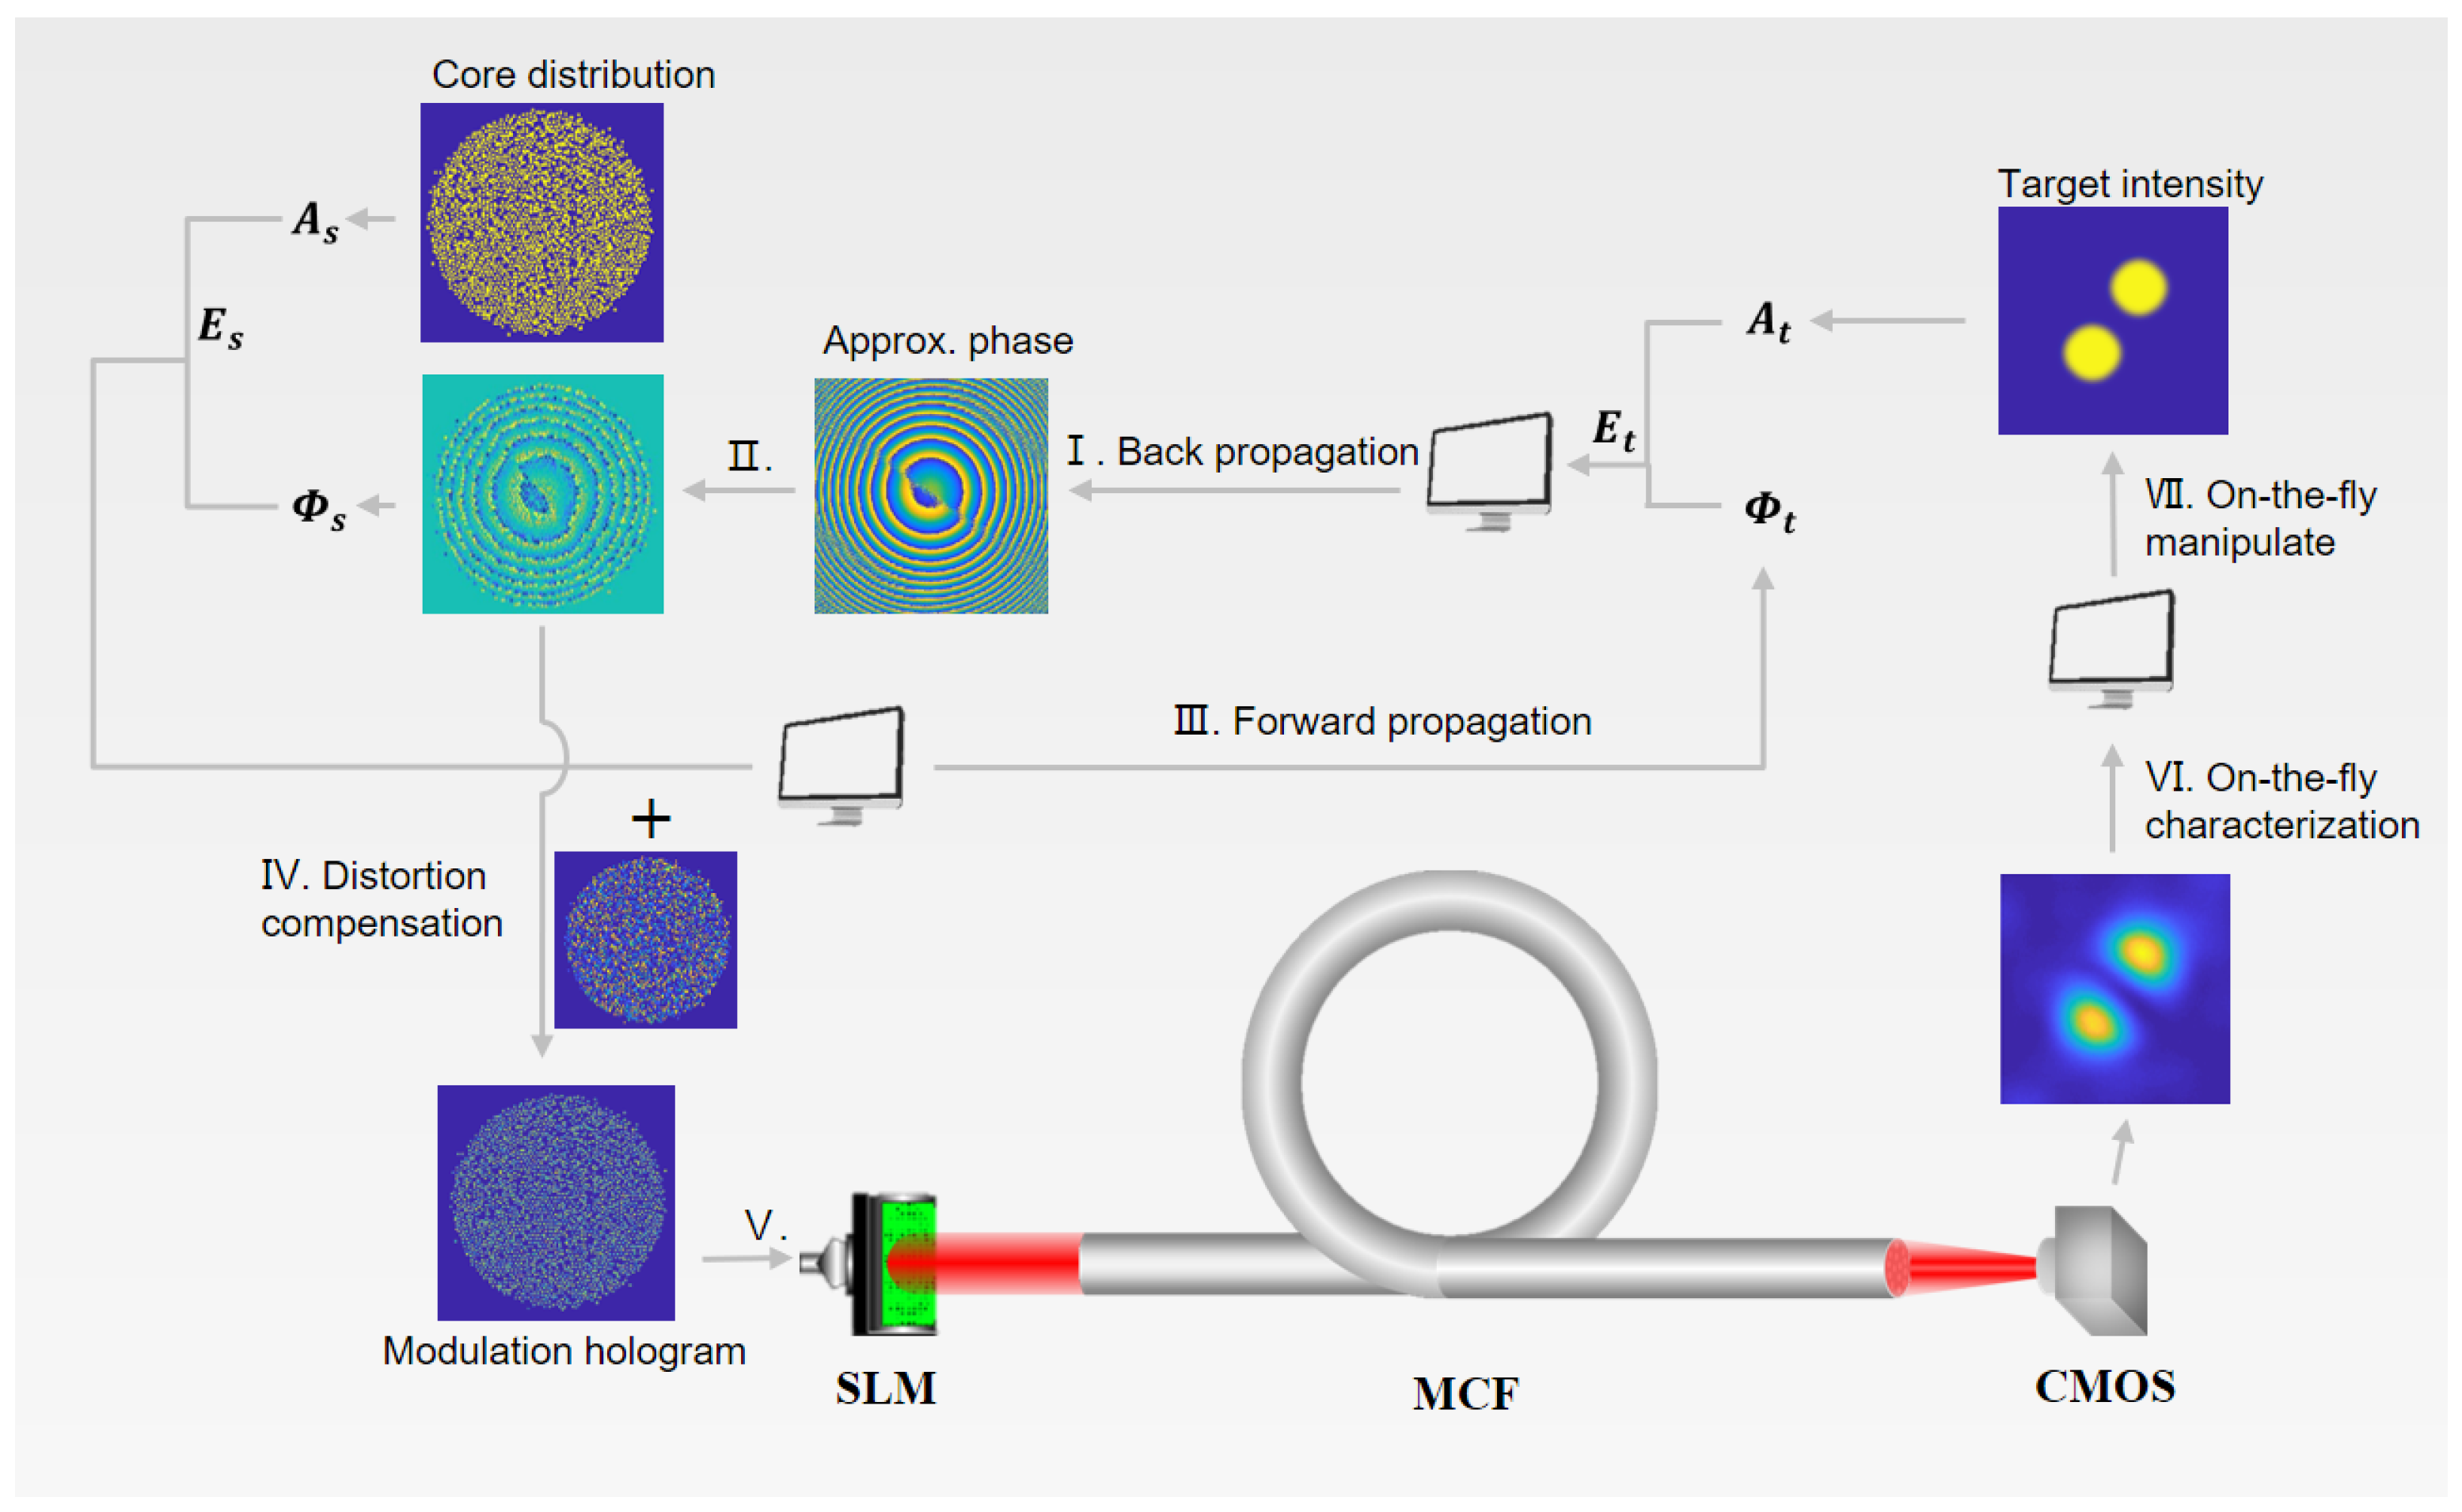
Therefore, we demonstrate a closed-loop control of the rotating dual-spot profile with the Core-GS (Figure 6IV–VII). The retrieved source phase in each iteration is combined with the distortion compensation hologram and displayed on the SLM immediately. The camera captured distal light field is on-the-fly evaluated with digital imaging processing. The internal intensity difference between both spots is employed as the feedback for closed-loop control; therefore, the target intensity for the next iteration is modulated accordingly. This method enables individual intensity control of both spots for a near-perfect rotation of a dual-spot with balanced intensity.
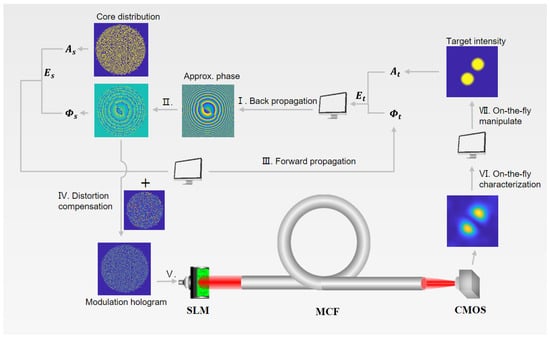
Figure 6.
Principle of the on-the-fly closed-loop control with Core-GS algorithm. To achieve two intensity-balanced spots at distal side of the MCF, the calculated phase image at the source plane and the distortion compensating phase image constitutes the modulation hologram which is displayed on the SLM in real-time. The modulated light transmits through the MCF and the dual-spot intensity profile is captured by the distal CMOS camera, and the intensity difference between the two spots is on-the-fly evaluated and determines the targeted amplitude image for the next iteration.
To specify the process, the retrieved source phase is sampled by the core distribution map and constitutes the modulation hologram on the SLM with the DOPC phase and the blazed grating
which is the experimental input light field at the proximal MCF facet (Figure 6IV,V). The distal far-field is captured and transported to a PC for real-time processing through a camera interface (uEye Interfaces, IDS) (Figure 6VI). Each spot is segmented from the background and the mean intensity and of each spot is characterized as the feedback in the closed-loop control. The target intensity for the next iteration is on-the-fly manipulated accordingly (Figure 6VI), defining the manipulated mean intensity of each spot in the updated target intensity is and respectively
where is a scale factor to prevent oscillation of the intensity difference. Nevertheless, the overall intensity which is the mean intensity of both spots at different orientations still fluctuates. Assuming a mean intensity of both spots of is desired, while the measured mean intensity is . An external spot with a lower intensity of
is generated at the target intensity image out of the region of interest to further compensate for the overall intensity variation. The on-the-fly manipulated iteration converges when both an optimum internal and overall intensity difference are reached.
Continuous and homogeneous rotation of the dual-spot from 0° to 90° in 1°-steps is achieved with the on-the-fly closed-loop control with the Core-GS algorithm. To prove the flexible application of the MCF as a waveguide, a MCF was bent for 90° in the setup. The image sequence of the distal output dual-spot light field and the corresponding phase modulation is demonstrated in Figure 7.

Figure 7.
Rotation control of light field through a multi-core fiber with a spatial light modulator. The image sequence on the top row is captured from a experimental rotation of the output dual-spot profile at the distal far-field of the multi-core fiber. The scale bar shows a length of 5 µm. The image sequence on the bottom row is the corresponding phase modulation generated from the on-the-fly controlled Core-GS algorithm. Both image sequences are sampled from a continuous rotation from 0° to 90° in 1°-steps. (See Video S1).
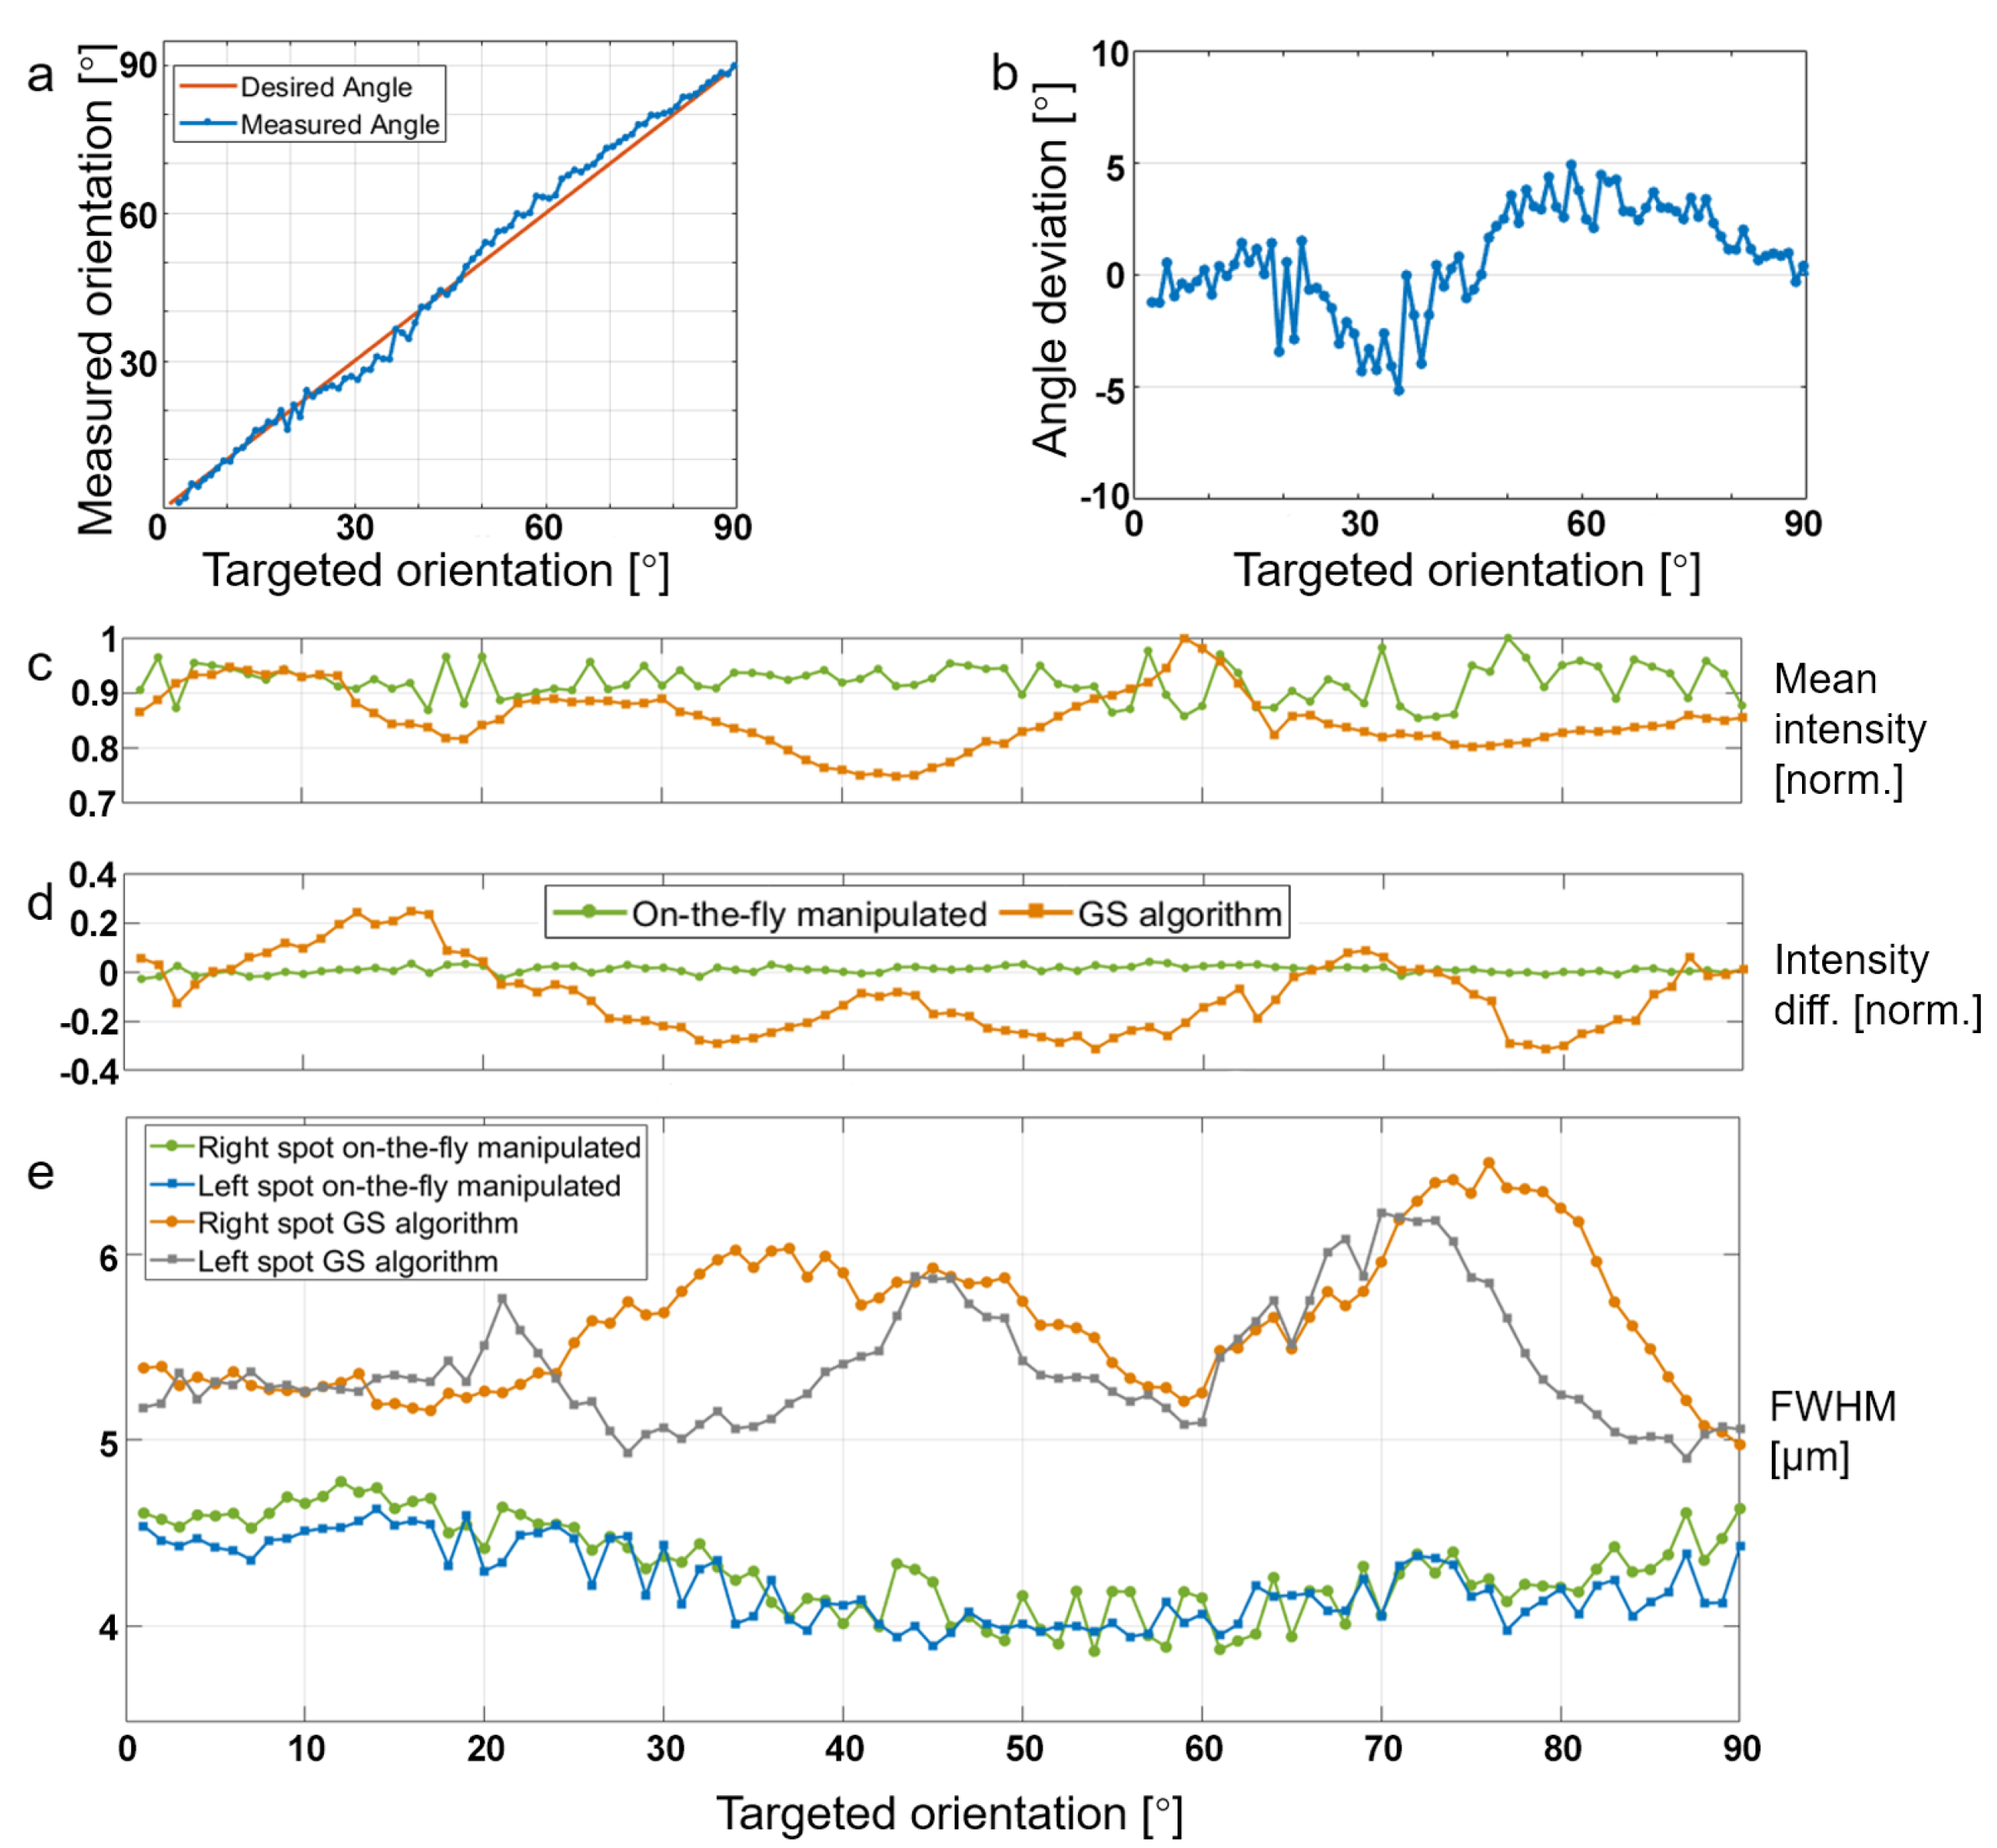
The internal and overall intensity of the dual-spot light field at different orientations is characterized in Figure 8c,d. Obviously, the intensity distribution of the two spots is well balanced with the proposed on-the-fly closed-loop control, a mean difference of 1.4% was achieved (Figure 8d). The overall intensity fluctuation over the rotation is compensated as well, but due to the systematic temporal phase fluctuation, the intensity fluctuation is still visible over the beam rotation (Figure 8c). Nevertheless, the standard deviation of the overall intensity decreased from 5.5% to 3.2%, demonstrating a robust rotation of the light field with homogeneous intensity distribution. The uniformity of both spots is also an important criterion for the cell-rotation by optical manipulation, which affects the direction of the optical force [13,38,39]. Both spots are fitted to a Gaussian distribution respectively for each orientation, and the corresponding full-width half-maximum (FWHM) in the rotation axis is measured to characterize the uniformity of the dual-spot over rotation (Figure 8e). The on-the-fly manipulated dual-spot shows an FWHM closer to the diffraction limit with a uniform shape in the rotation. The accuracy of the orientation control is an essential criterion for tomographic reconstruction [40], which denotes discrepancies between the rotation angle of the dual-spot and the desired angle should be as small as possible. As demonstrated (Figure 8a,b), a minor deviation of rotation angle with a mean value of was achieved. Therefore, we demonstrate an on-the-fly closed-loop control approach for wavefront shaping, enabling a homogeneous rotating dual-spot light field for precise optical cell-manipulation.
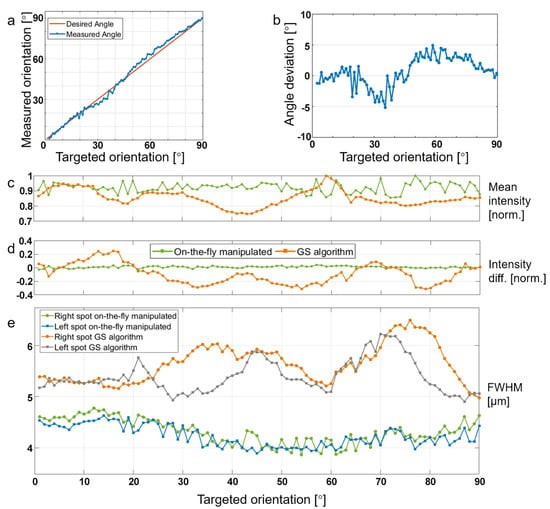
Figure 8.
Analysis of the experimental rotation of the fiber output dual-spot profile from to in -steps. (a) Comparison of the desired and the experimental rotation angle of the dual-spot. (blue-experimental rotation angle; red-desired rotation angle). (b) The deviation between the desired and experimental rotation angle, while the mean deviation is 1.9° and the maximum deviation is 5.1°. (c) Comparison of normalized mean intensity at various rotation angles employing Core-GS algorithm with and without on-the-fly manipulation. The standard deviation of the mean intensity decreased from to and the maximum deviation from to with the on-the-fly manipulation. (d) Normalized difference between the mean intensity of the two spots (background noise removed). The mean intensity difference strongly dropped from to and the maximum difference from to with the on-the-fly manipulation. (e) Full width half maximum (FWHM) of each spot with and without on-the-fly manipulation at different orientations. The standard deviation of the FWHM of the right spot optimized from 0.37 µm to 0.24 µm, and for the left spot from 0.32 µm to 0.2 µm.
5. Discussion
The core-GS algorithm provides a robust way for complex wavefront shaping through a 10,000 core MCF with high fidelity. Combining with the on-the-fly closed-loop control of the light field intensity facilitates a homogeneous dynamic rotating dual-spot profile, which can lead to more precise optical manipulation of biological cells [13]. Recent progresses in MCF amplifiers [41,42,43] open new perspectives for wavefront shaping through MCFs. Our approach could become a phase-only way for generating structured light and manipulating the intensity of the light field for an MCF amplifier with a large number of cores.
It may be a concern that many computational efforts can be taken for iterative generation of a large amount of light field, for instance, phase retrieval of the dual-spot at various orientations. A benefit from the similarity of the light field at neighboring orientations, instead of using a random phase as the input, is that the target phase from the last orientation is used as the input for iteration. This can reduce the iteration time from 20 to 5, resulting in 80% less computational time. The current computation is run on a conventional CPU (i5-6500); it takes about 13 s to generate each phase modulation frame on average. The computational speed can be boosted with GPU acceleration. The bandwidth of the on-the-fly control can be further increased by using SLM with higher speed.
The quality of the wavefront shaping through the MCF is strongly influenced by the phase distortion compensation. In this work, the phase distortion is measured at the distal fiber facet, which demands optical access to both fiber tips. In situ calibration of the MCF could employ our previously reported procedure [44] to compensate for the bending and temporal phase distortions without distal access. An alternative way could be employing the recently reported specially twisted MCF which is invariant in conformation and its performance is independent of fiber bending [15]. The quality of the wavefront shaping can be further improved by using MCFs with more cores; however, that will also increase the complexity of the modulation hologram and require more iteration times.
6. Conclusions
We proposed a novel phase retrieval algorithm for the MCFs called Core-GS, facilitating robust wavefront shaping for complex light fields through MCFs, which leads to a paradigm shift in light control through MCFs. The spatial sampling problem induced by the discrete core distribution is thus overcome, enabling complex wavefront shaping through a 50 cm long bent MCF with fidelity up to 96.2%. High-quality phase distortion compensation with DOPC optimizes the stability of the wavefront shaping through the MCF for a long time. Dynamic on-the-fly closed-loop control of the light field leads to a near-perfect homogeneous rotating dual-spot profile with a mean internal intensity difference of 1.4%, which paves the way for precise optical manipulation of cells employing MCFs for lab-on-a-chip applications.
Supplementary Materials
The following are available at https://www.mdpi.com/article/10.3390/app11093949/s1, Video S1: Rotation of the on-the-fly controlled dual-spot beam profile. A supporting video article is available at doi: link.
Author Contributions
J.W.C. and N.K. contribute the concept of using multi-core fiber as a phased-array for complex wavefront shaping. J.S. designed, built, programmed, and characterized the simulation and experiments and it was supervised by N.K. J.W.C. supervised the whole research work. J.S. wrote the manuscript. N.K. and J.W.C. revised the manuscript. All authors have read and agreed to the published version of the manuscript.
Funding
This research was funded by Deutsche Forschungsgemeinschaft (DFG) grant number (CZ 55/40-1). We accept Open Access Funding by the Publication Fund of the TU Dresden.
Institutional Review Board Statement
Not applicable.
Informed Consent Statement
Not applicable.
Data Availability Statement
The data that support the findings of this study are available from the corresponding author upon request.
Acknowledgments
Special thanks to Nils Dunkelberg for valuable assistance on the software. The authors appreciate the helpful discussions and suggestions of Jochen Guck, Robert Kuschmierz, and Elias Scharf.
Conflicts of Interest
The authors declare no conflict of interest.
References
- Gustafsson, M.G.; Shao, L.; Carlton, P.M.; Wang, C.R.; Golubovskaya, I.N.; Cande, W.Z.; Agard, D.A.; Sedat, J.W. Three-dimensional resolution doubling in wide-field fluorescence microscopy by structured illumination. Biophys. J. 2008, 94, 4957–4970. [Google Scholar] [CrossRef] [PubMed]
- Rubinsztein-Dunlop, H.; Forbes, A.; Berry, M.V.; Dennis, M.R.; Andrews, D.L.; Mansuripur, M.; Denz, C.; Alpmann, C.; Banzer, P.; Weiner, A.M.; et al. Roadmap on structured light. J. Opt. 2016, 19, 013001. [Google Scholar] [CrossRef]
- Wang, D.; Zhou, E.H.; Brake, J.; Ruan, H.; Jang, M.; Yang, C. Focusing through dynamic tissue with millisecond digital optical phase conjugation. Optica 2015, 2, 728–735. [Google Scholar] [CrossRef] [PubMed]
- Koukourakis, N.; Fregin, B.; König, J.; Büttner, L.; Czarske, J.W. Wavefront shaping for imaging-based flow velocity measurements through distortions using a Fresnel guide star. Opt. Express 2016, 24, 22074–22087. [Google Scholar] [CrossRef]
- Koukourakis, N.; Kreysing, M.; Czarske, J. Wavefront shaping method to focus through mouse skull. Adapt. Opt. Anal. Methods Syst. Opt. Soc. Am. 2018, OW2J-3. [Google Scholar] [CrossRef]
- Forouhesh Tehrani, K.; Koukourakis, N.; Czarske, J.; Mortensen, L.J. In situ measurement of the isoplanatic patch for imaging through intact bone. J. Biophotonics 2021, 14, e202000160. [Google Scholar] [CrossRef]
- Aziz, A.; Medina-Sánchez, M.; Koukourakis, N.; Wang, J.; Kuschmierz, R.; Radner, H.; Czarske, J.W.; Schmidt, O.G. Real-time IR tracking of single reflective micromotors through scattering tissues. Adv. Funct. Mater. 2019, 29, 1905272. [Google Scholar] [CrossRef]
- Plöschner, M.; Tyc, T.; Čižmár, T. Seeing through chaos in multimode fibres. Nat. Photonics 2015, 9, 529–535. [Google Scholar] [CrossRef]
- Leite, I.T.; Turtaev, S.; Jiang, X.; Šiler, M.; Cuschieri, A.; Russell, P.S.J.; Čižmár, T. Three-dimensional holographic optical manipulation through a high-numerical-aperture soft-glass multimode fibre. Nat. Photonics 2018, 12, 33–39. [Google Scholar] [CrossRef]
- Rothe, S.; Radner, H.; Koukourakis, N.; Czarske, J.W. Transmission matrix measurement of multimode optical fibers by mode-selective excitation using one spatial light modulator. Appl. Sci. 2019, 9, 195. [Google Scholar] [CrossRef]
- Turtaev, S.; Leite, I.T.; Altwegg-Boussac, T.; Pakan, J.M.; Rochefort, N.L.; Čižmár, T. High-fidelity multimode fibre-based endoscopy for deep brain in vivo imaging. Light. Sci. Appl. 2018, 7, 1–8. [Google Scholar] [CrossRef] [PubMed]
- Ohayon, S.; Caravaca-Aguirre, A.; Piestun, R.; DiCarlo, J.J. Minimally invasive multimode optical fiber microendoscope for deep brain fluorescence imaging. Biomed. Opt. Express 2018, 9, 1492–1509. [Google Scholar] [CrossRef] [PubMed]
- Kreysing, M.; Ott, D.; Schmidberger, M.J.; Otto, O.; Schürmann, M.; Martín-Badosa, E.; Whyte, G.; Guck, J. Dynamic operation of optical fibres beyond the single-mode regime facilitates the orientation of biological cells. Nat. Commun. 2014, 5, 5481. [Google Scholar] [CrossRef] [PubMed]
- Shemirani, M.B.; Mao, W.; Panicker, R.A.; Kahn, J.M. Principal modes in graded-index multimode fiber in presence of spatial-and polarization-mode coupling. J. Light. Technol. 2009, 27, 1248–1261. [Google Scholar] [CrossRef]
- Tsvirkun, V.; Sivankutty, S.; Baudelle, K.; Habert, R.; Bouwmans, G.; Vanvincq, O.; Andresen, E.R.; Rigneault, H. Flexible lensless endoscope with a conformationally invariant multi-core fiber. Optica 2019, 6, 1185–1189. [Google Scholar] [CrossRef]
- Kim, Y.; Warren, S.C.; Stone, J.M.; Knight, J.C.; Neil, M.A.; Paterson, C.; Dunsby, C.W.; French, P.M. Adaptive multiphoton endomicroscope incorporating a polarization-maintaining multicore optical fibre. IEEE J. Sel. Top. Quantum Electron. 2015, 22, 171–178. [Google Scholar] [CrossRef]
- Warren, S.C.; Kim, Y.; Stone, J.M.; Mitchell, C.; Knight, J.C.; Neil, M.A.; Paterson, C.; French, P.M.; Dunsby, C. Adaptive multiphoton endomicroscopy through a dynamically deformed multicore optical fiber using proximal detection. Opt. Express 2016, 24, 21474–21484. [Google Scholar] [CrossRef]
- Kogan, D.; Sivankutty, S.; Tsvirkun, V.; Bouwmans, G.; Andresen, E.R.; Rigneault, H.; Oron, D. Phase retrieval in multicore fiber bundles. Opt. Lett. 2017, 42, 647. [Google Scholar] [CrossRef]
- Stasio, N.; Conkey, D.B.; Moser, C.; Psaltis, D. Light control in a multicore fiber using the memory effect. Opt. Express 2015, 23, 30532–30544. [Google Scholar] [CrossRef]
- Porat, A.; Andresen, E.R.; Rigneault, H.; Oron, D.; Gigan, S.; Katz, O. Widefield lensless imaging through a fiber bundle via speckle correlations. Opt. Express 2016, 24, 16835–16855. [Google Scholar] [CrossRef]
- Conkey, D.B.; Stasio, N.; Morales-Delgado, E.E.; Romito, M.; Moser, C.; Psaltis, D. Lensless two-photon imaging through a multicore fiber with coherence-gated digital phase conjugation. J. Biomed. Opt. 2016, 21, 045002. [Google Scholar] [CrossRef] [PubMed]
- Scharf, E.; Dremel, J.; Kuschmierz, R.; Czarske, J. Video-rate lensless endoscope with self-calibration using wavefront shaping. Opt. Lett. 2020, 45, 3629–3632. [Google Scholar] [CrossRef] [PubMed]
- Czarske, J.W.; Haufe, D.; Koukourakis, N.; Büttner, L. Transmission of independent signals through a multimode fiber using digital optical phase conjugation. Opt. Express 2016, 24, 15128–15136. [Google Scholar] [CrossRef]
- Büttner, L.; Thümmler, M.; Czarske, J. Velocity measurements with structured light transmitted through a multimode optical fiber using digital optical phase conjugation. Opt. Express 2020, 28, 8064–8075. [Google Scholar] [CrossRef]
- Davis, J.A.; Cottrell, D.M.; Campos, J.; Yzuel, M.J.; Moreno, I. Encoding amplitude information onto phase-only filters. Appl. Opt. 1999, 38, 5004–5013. [Google Scholar] [CrossRef]
- Sarkadi, T.; Kettinger, Á.; Koppa, P. Spatial filters for complex wavefront modulation. Appl. Opt. 2013, 52, 5449–5454. [Google Scholar] [CrossRef]
- Cuche, E.; Marquet, P.; Depeursinge, C. Spatial filtering for zero-order and twin-image elimination in digital off-axis holography. Appl. Opt. 2000, 39, 4070–4075. [Google Scholar] [CrossRef]
- Neutsch, K.; Schnitzler, L.; Sun, J.; Tranelis, M.J.; Hofmann, M.R.; Gerhardt, N.C. In-depth particle localization with common-path digital holographic microscopy. Practical Holography XXXIV: Displays, Materials, and Applications. Int. Soc. Opt. Photonics 2020, 11306, 113060A. [Google Scholar]
- Yu, L.; Kim, M.K. Wavelength-scanning digital interference holography for tomographic three-dimensional imaging by use of the angular spectrum method. Opt. Lett. 2005, 30, 2092–2094. [Google Scholar] [CrossRef]
- Yang, G.z.; Dong, B.z.; Gu, B.y.; Zhuang, J.y.; Ersoy, O.K. Gerchberg–Saxton and Yang–Gu algorithms for phase retrieval in a nonunitary transform system: A comparison. Appl. Opt. 1994, 33, 209–218. [Google Scholar] [CrossRef] [PubMed]
- Gerchberg, R. Holography without fringes in the electron microscope. Nature 1972, 240, 404–406. [Google Scholar] [CrossRef]
- Saxton, W. Computer Techniques for Image Processing in Electron Microscopy; Academic Press: Cambridge, MA, USA, 2013; Volume 10. [Google Scholar]
- Jesacher, A.; Maurer, C.; Schwaighofer, A.; Bernet, S.; Ritsch-Marte, M. Near-perfect hologram reconstruction with a spatial light modulator. Opt. Express 2008, 16, 2597–2603. [Google Scholar] [CrossRef]
- Xia, J.; Yin, H. Three-dimensional light modulation using phase-only spatial light modulator. Opt. Eng. 2009, 48, 020502. [Google Scholar] [CrossRef]
- Rothe, S.; Zhang, Q.; Koukourakis, N.; Czarske, J.W. Deep learning for computational mode decomposition in optical fibers. Appl. Sci. 2020, 10, 1367. [Google Scholar] [CrossRef]
- Strasser, F.; Moser, S.; Ritsch-Marte, M.; Thalhammer, G. Direct measurement of individual optical forces in ensembles of trapped particles. Optica 2021, 8, 79–87. [Google Scholar] [CrossRef]
- Rademacher, G.; Luís, R.S.; Puttnam, B.J.; Awaji, Y.; Wada, N. Crosstalk dynamics in multi-core fibers. Opt. Express 2017, 25, 12020–12028. [Google Scholar] [CrossRef]
- Neto, P.M.; Nussenzveig, H. Theory of optical tweezers. EPL Europhys. Lett. 2000, 50, 702. [Google Scholar] [CrossRef]
- Ashkin, A.; Dziedzic, J.M.; Bjorkholm, J.E.; Chu, S. Observation of a single-beam gradient force optical trap for dielectric particles. Opt. Lett. 1986, 11, 288–290. [Google Scholar] [CrossRef]
- Müller, P.; Schürmann, M.; Guck, J. ODTbrain: A Python library for full-view, dense diffraction tomography. BMC Bioinform. 2015, 16, 1–9. [Google Scholar] [CrossRef]
- Abedin, K.; Taunay, T.; Fishteyn, M.; DiGiovanni, D.; Supradeepa, V.; Fini, J.; Yan, M.; Zhu, B.; Monberg, E.; Dimarcello, F. Cladding-pumped erbium-doped multicore fiber amplifier. Opt. Express 2012, 20, 20191–20200. [Google Scholar] [CrossRef] [PubMed]
- Lin, D.; Carpenter, J.; Feng, Y.; Jain, S.; Jung, Y.; Feng, Y.; Zervas, M.N.; Richardson, D.J. Reconfigurable structured light generation in a multicore fibre amplifier. Nat. Commun. 2020, 11, 1–9. [Google Scholar] [CrossRef] [PubMed]
- Lhermite, J.; Suran, E.; Kermène, V.; Louradour, F.; Desfarges-Berthelemot, A.; Barthélémy, A. Coherent combining of 49 laser beams from a multiple core optical fiber by a spatial light modulator. Opt. Express 2010, 18, 4783–4789. [Google Scholar] [CrossRef] [PubMed]
- Kuschmierz, R.; Scharf, E.; Koukourakis, N.; Czarske, J.W. Self-calibration of lensless holographic endoscope using programmable guide stars. Opt. Lett. 2018, 43, 2997–3000. [Google Scholar] [CrossRef] [PubMed]
Publisher’s Note: MDPI stays neutral with regard to jurisdictional claims in published maps and institutional affiliations. |
© 2021 by the authors. Licensee MDPI, Basel, Switzerland. This article is an open access article distributed under the terms and conditions of the Creative Commons Attribution (CC BY) license (https://creativecommons.org/licenses/by/4.0/).

