Abstract
The influence of different bend curvatures on the detonation wave propagation was analyzed by an advanced numerical simulation system. The mechanism of propagation properties is revealed by cellular structure, internal and external boundary pressure distribution, propagation process of detonation wave and chemical reaction. The cellular structure and detonation wave front of bend with different curvature are very different. The simulation results show that the detonation wave with regular cell structure propagating through the curved parts induces detonation cell size increased by diffraction near the inner wall while detonation reflected on the bottom surface resulting in decrease of cell size. Detonation wave was affected by the rarefaction wave and compression wave in the bent pipe. The pressure distribution of the bend shows that the peak pressure in the 450 curvature is the largest, which should be paid more attention in industrial design. The chemical reaction could indicate the propagation characteristics of detonation wave, and different propagation characteristics have different profiles of chemical components.
1. Introduction
Gaseous detonation is very complicated. It is usually considered to be composed of induced shock waves followed by a reaction zone [1]. Gaseous detonation technology has a good application prospect in engine [2,3,4,5,6]. Most of the experimental studies and numerical simulation in the gaseous detonation wave focus on cell structure evolution and the influence of initial conditions in a straight pipe [7,8,9,10,11,12,13,14].
In daily life, combustible gas pipelines often have the connection sections of bends which is more complex, while experimental research and numerical simulation of the propagation mechanism in pipe have been reported in recent years, but there are still many deficiencies to be further studied [15,16,17,18]. The cellular structure evolution of detonation wave in bends is more complex, when the detonation wave go through the bend, different curvature leads to different cellular structure, pressure distribution and chemical reaction morphology. Study on the evolution process of detonation cellular structure in bends is helpful to understand the mechanism of interaction among the induced shock, chemical reaction zone and wall geometry. Numerical simulation is a good approach to understand the specific physical and chemical mechanisms which can put forward some constructive opinions in industrial pipeline design, prevent and restrain accidents as well as protect the property and life safety of country and citizen. There is a lot of literature following this subject. Edwards [19] studied the shock wave propagation in 90-degree bend by experiment and points out the relationship between the shock wave velocity and the curvature of the pipe. Frolov [20,21] investigated the detonation wave propagation characteristics of the U-bend tubes by experiment and numerical simulation Uchida [22] explored a comparative study on detonation wave propagation in 90° straight tube and bend and points out two locations in pipe where pressure values are greater than those in the straight tube. One location is in the outer wall surface of bend and the other appears in the downstream of the bend exit because of the effect of transverse waves. Kudo, Y. [23] studied the effects of initial pressure and radius of curvature on oblique detonation wave in a rectangular bend. Wang, L.Q. [24] showed the detonation behavior of detonation wave with different diameters and shapes. Sugiyama, Y. [25] numerically investigated the characteristics of detonation wave propagating in two-dimensional curved channel and discusses the limit of stable propagation. Two propagation modes are discovered, one is stable propagation mode, the other is a kind of repeated decay and initiation process model. Shi, X. [26] researched the propagation characteristics and different combustion modes of hydrogen/air mixture in a closed chamber. Gwak, Min-cheol [27] performed the characteristics of DDT (Detonation Deflagration Transition) in S bend by numerically and the acceleration or inhibit of the flame is caused by complex constraints of geometrical boundary in S tube. Zhenhua Pan [28] analyzed three detonation propagation modes and the effect of initial pressure in a helical detonation channel. Otsuka [29] performed numerical simulation on detonation wave propagation in the U-bend and found that detonation quenching near the entrance of U tube while-initiation in the U tube exit. It is found that the mall pipe use of the U-bend with small channel width and curvature radius can induce fast DDT. Liang, Z. [30] conducted experiments on the structural response of detonation in the 90-degree bend. S. Gallier [31] showed no difference between numerical simulation and experimental results in hydrogen–oxygen–argon mixtures. Goodwin [32] studied the deflagration to detonation transition (DDT) in rectangular tubes with different obstruction ratios. Two mechanisms are revealed, one with DDT occurring due to the creation of a hot spot in a gradient of reactivity that forms behind a Mach reflection and another in which DDT arises from energy focusing as shocks converge. Mark Short [33] examined numerically the influence of detonation front curvature on the cellular structure and the evolution dynamics from unstable detonation to stable detonation. They found that for sufficiently wide arcs, the angular speed and structure of the detonation front was influenced only by a flow region near the inner arc surface known as the detonation driving zone (DDZ). Smaller inner arc radii and lower activation energies increase the range of stable solutions. Li Jian [34] used Additive Runge–Kutta methods to research the change of detonation cellular structure and proved that the stiffly accurate additive Runge–Kutta methods can capture the discontinuity well and describe the detonation complex wave configurations exactly, especially the typical characteristics such as triple wave structure, cellular cell, diffraction and reflection. Tomotaka Niibo [35] studied the effect of mesh resolution and high order accuracy scheme on detonation cellular structure. With the decrease of mesh size and the higher order accuracy scheme, irregular cellular structure is obtained and unburned gas pockets and circulation structures caused by Kelvin–Helmholtz instability appear behind the detonation front. Xueqiang Yuan [36] analyzed the diffraction of a cellular detonation wave by numerical and theoretical method. They found that diffracted detonation can sustain coupling for a certain distance when propagating over curved wall and curved wall can promote reinitiation and even make detonation propagate stably without decoupling. Zhenjuan Xia [37] simulated the effects of curvature radius, domain width and stagnation pressure on propagation process of the detonation wave. The results indicate that the decoupling and reinitiation occur repeatedly during the unstable propagation mode of the RDW, and the angular velocities of leading shock wave vary accordingly. Xia [38] carried out a numerical study on the rotating detonation wave in plane–radial structure and compared with the experimental results. Due to the influence of curvature, the detonation wave is strengthened near the outer concave boundary and weakened near the inner convex one.
In conclusion, most cellular structures of detonation waves propagating in the bend were obtained by experiment [39,40,41], mainly using the 90° angle. Meanwhile the different mechanisms of propagation of detonation waves and change rule in different bending angles are not revealed. The numerical simulation is an important method to explore detonation mechanism. Therefore, this paper solves these problems by numerical simulation of gas detonation.
2. Numerical Model
In this paper, the phenomenon of detonation reflection is described by Euler equation [42] without considering dissipation effects such as viscosity, heat conduction and diffusion. An Additive Runge–Kutta (ARK) time step method is used to integrate the governing equations to avoid rigidity of chemical sources. A 9 species, 48 reaction mechanism is adopted. The reacting species are H2, O2, H, O, OH, HO2, H2O2, H2O and Ar. A fifth-order Weighted Essentially Non-Oscillatory scheme is used to integrated on convective terms.
Either with commercial software or self-developed software, the grid subdivision is crucial for discrete area in calculation. At the same time, the grid subdivision is closely related to the calculation format. Thus, the grid subdivision quality has direct influence on the accuracy of the calculation result. The object discussed in this paper is smooth bend with different curvatures and the structure is not regular, which is different from wedge surface and treated as series of micro yuan of wedge surface with continuously changing angle. This is a more complex structure. The wall boundary conditions are difficult to give out in high precision calculation with rectangular grid format and rules. Thus, the body-fitted curve coordinate system is adopted and the curve coordinate will be transformed to the isometric partitioning coordinates in calculation. This can simplify the treatment to geometric boundary conditions. In the curve coordinates, the reaction Euler equation is as follows:
where J is Jacobi determinant; ζx, ζy, ηx, ηy are transforming coefficients of curvilinear coordinates and calculating coordinates, respectively; others are similar to traditional Euler equations.
The whole bent pipe is composed of a turning angle section, a straight pipe section before the turning angle and a straight pipe section after the turning angle. The turning angle among θ = 15°,20°,30°,40°,45°, 60° respectively. The channel width is five times of the cell width and divided into1500 × 300 grids with size of 0.1 mm. The initial conditions are set the same as [43]: the concentration is stoichiometric H2/O2 mixture diluted with 70% argon. The numerical simulation we consider is the evolution of the cellular detonation wave propagating through realistic smooth pipe bends of different angle in two space dimensions at an initial pressure and temperature of 6.67 kPa and 298 K, respectively. In order to simplify the computational initialization process, a cellular detonation is located on the left. The entrance is extrapolation boundary, the exit is Neumann boundary and other boundaries are solid wall. Figure 1 shows a schematic view of the bend.
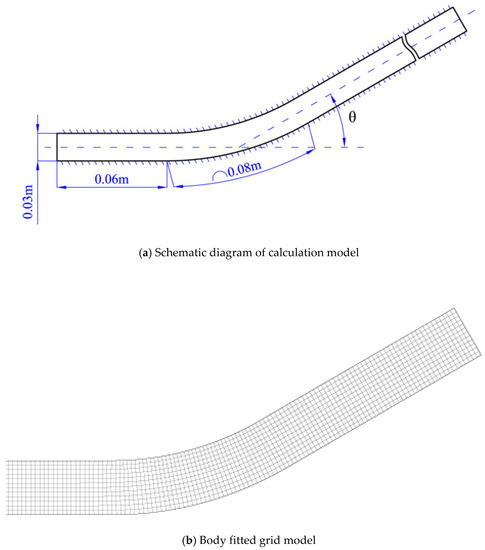
Figure 1.
A schematic view of the bend.
3. Numerical Method
3.1. Finite Difference Schemes
The Steger warming vector flux splitting method is used to decompose the physical fluxes F and G [44], and then the semidiscrete scheme of the governing equations can be written as follows:
where, represent the numerical flux on grid boundary and can be obtained by the WENO reconstruction with the grid values of Fij, Gij. A addtive Runge–Kutta scheme method [45] is used to couple the Euler equations to the chemical reactions. According to the work of Araújo, Kennedy C.A., Inmaculada Higueras [46,47,48], additional Runge–Kutta explicit implicit algorithm can be used to handle the following ordinary differential equations:
In this paper, the Euler equation is divided into the convection term and the reaction term. N in the equation is set to 2.
where The constant is the Butcher coefficient.
The reaction Euler equation is written as:
It refers to both the nonrigid convection term and the rigid reaction term. The IMEX ARK2 method is adopted in which, ERK (display Runge–Kutta) method are used for the nonrigid term, and the rigid term is treated by ESDIRK (rigid diagonal explicit/implicit Runge–Kutta) method.
The above equation is written as and is iteratively solved. is the unit matrix.
3.2. Detailed Chemical Kinetics Model
A detailed chemical reaction model comprised of 9 species and 48 elementary reactions was employed for describing hydrogen–oxygen–argon detonation, as shown in Table 1 [49]. The reacting species are H2, O2, H, O, OH, HO2, H2O2, H2O and Ar. The chemical reactions can be expressed as:
where and are the reactant and product chemical stoichiometric coefficients, denotes the specie, and are the forward and backward reaction rate constants, respectively, they can be work according to the Arrhenius law and the chemical equilibrium conditions. and follow the Arrhenius law and satisfy the chemical equilibrium conditions:
where , is the universal gas constant, is the atmospheric pressure, is the entropy at the standard state, is the pre-exponential constant, is the temperature power and is the activation energy. The finite production rate for the i-th specie is calculated under the assumption that all involved reactions are elementary reactions,
where and are the molecular weight and the molar concentration of i-th species (), respectively, and represents the third body coefficients for the i-th species and k-th equations.

Table 1.
Reaction mechanism and some related parameters (cm3-mol-sec-cal).
4. Code Verifications
4.1. Validation of Numerical Scheme
Diffusion reaction equation is shown in the following:
is the stiffness factor, which shows the stiff intensity of the equation. The initial condition is set as and the periodic boundary condition is adopted. The analytical solution of the equation is . The fifth order WENO difference scheme is used to discretize the convection term and the explicit processing is carried out while the reaction term is treated implicitly. The results are shown in Figure 2.
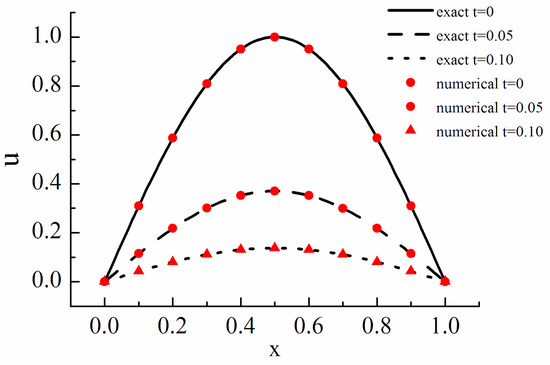
Figure 2.
Diffusion reaction equation.
Figure 2 shows the cases of t = 0, 0.05 and 0.1. The results show that the numerical solution is in good agreement with the analytical solution, and the ARK method is effective.
Time accuracy is a measurement of time. To test the time accuracy of the equation, use the equation as follows:
where is the time accuracy and is the numerical error presented by the absolute value of the difference between the exact solution and the numerical solution. The time accuracy test results are shown in the following Table 2:
Table 2.
Time accuracy test.
It can be seen from the table that the fluctuation range of ARK method in different time steps is not very large, which shows that it has high time precision.
4.2. Validation of the Physical Model
In order to prove the validation of the physical model, the numerical simulation results are compared with the experimental results.
A comparison of the detonation reflection on a 30° wedge between experiment and simulation is conducted. The numerical cellular detonation cell pattern and the experimental smoked foil record are presented together in the figure as follows. It is obvious that the wave front near the wedge is overdriven due to the shock reflection and the Mach stem detonation causes smaller detonation cells behind it. The very similar characteristics exist both in the smoked foil image in Figure 3a and numerical results in Figure 3b.
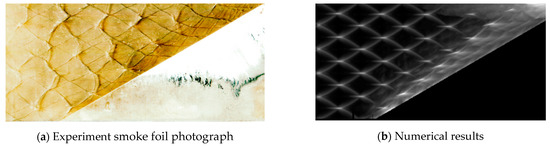
Figure 3.
Detonation reflection over 30° angle.
A comparison of the detonation reflection on a 90° bend between experiment and simulation is conducted. The numerical cellular detonation cell pattern and the experimental smoked foil record are presented together in the figure as follows. The cellular structure disappears in the detonation failure region and the cellular structure is regular in the stable detonation regular. The very similar characteristics exist both in the smoked foil image in Figure 4a and numerical results in Figure 4b.
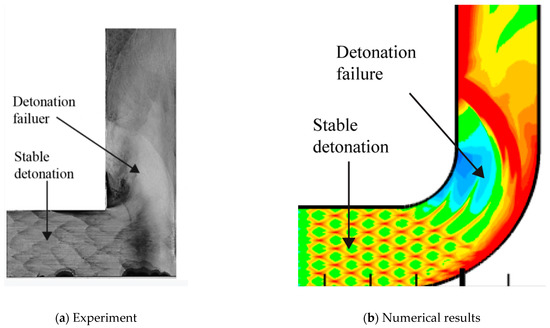
Figure 4.
Detonation reflection over 90° angle.
4.3. The Effect of Resolution on the Results
We verify the influence of grid resolution on the computation. With the improvement of the grid resolution in the induction region, the triple structure can be resolved more clearly. There is no difference between 20 and 30, so we choose 20, which can be seen in the Figure 5.
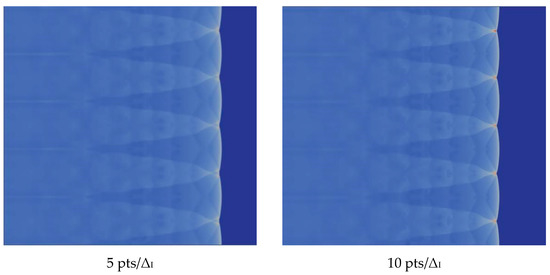
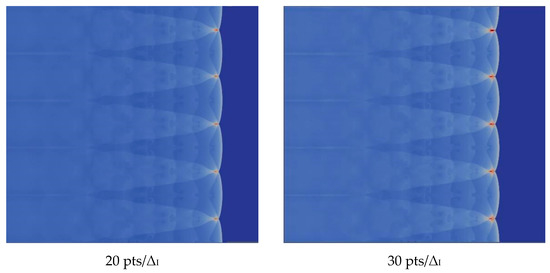
Figure 5.
Triple structure comparison results.
5. Results and Discussion
5.1. Cell Structure
Comparing Figure 6 = 15°, = 20°, = 30° with = 40°, = 45°, = 60°, a great difference is found between the results of these two groups. In the same pipe distance, the stable cell structure of the first group is destroyed and the size of cell becomes inhomogeneous after being affected by the curvature of the pipe. However, the cellular detonation wave can spread continuously. The second group is so heavily affected by the curvature of the pipe that a wide range of cell seven disappear completely on the surface of the pipe wall.
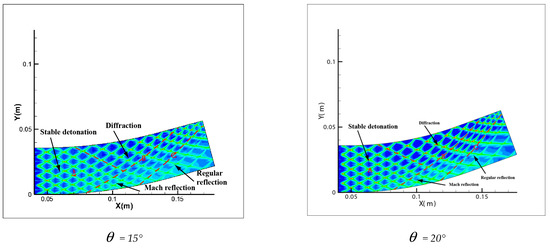
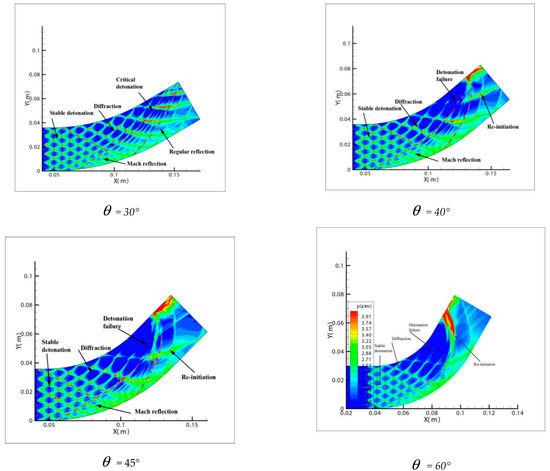
Figure 6.
Cellular structure of different bend angles.
Figure 6 shows different propagation characteristics of detonation wave in the bend pipe, which can be explained by the change of cellular structure. The cellular structure plays an important role in the investigation of detonation propagation mechanism. The detonation wave propagation is able to form a regular cellular structure and this is mainly driven by the chemical reaction. The disappearance of cellular structure indicates that the energy supplied by the chemical reaction is insufficient to maintain the structure and the chemical reaction surface is gradually decoupled from the detonation wave front. The increase of cellular structure shows that the driving energy supplied by chemical reaction is less than the requirement of the stable cell and the detonation wave is under driven. The decrease of cellular structure implies that the energy supplied by the chemical reaction is greater than the needs of stable cell and the detonation wave is over driven. The decrease of the chemical energy is generated by the rarefaction wave on the up wall, which causes the pressure and temperature drop behind the detonation, while the increase is due to the compression wave on the lower wall, which causes the pressure and temperature increases behind the detonation. The disappearance of the cellular structure also indicates the detonation is extinguished. The stable structure must have periodic transverse wave structure. However, the rarefaction wave generated in the upper wall makes the transverse wave decay rapidly near the edge of the wall. Thus, the quenching area is generated.
A comparison between Figure 6 = 15°, = 20° and = 30° shows that the whole pipe is divided into A, B and C regions. The structure in A region is regular and the propagation of detonation is stable. Cellular structure in B region becomes irregular, where the cell size increases in the upper half while it decreases in the lower half. The reason is that the detonation wave is diffracted on the upper wall, and the pressure of the detonation wave reduced by the rarefaction makes it instable. This leads to the increasing of cellular structure. However, the Maher reflection happens between the pipe and detonation wave in the lower wall and induces increase of the pressure and temperature correspondingly after the Maher. With the increase of the detonation wave intensity, the cell structure is reduced. In contrast to B region, the cell size in C region decreases in the upper part while it increases in the lower part. The result is that along with the propagation of detonation waves spreading to downstream of the bend, the three wave structure interacts among the others at the same time, the Maher reflection between the detonation and the pipe is stopped. Unlike = 15° and = 20°, the results of = 30° show that there is a critical detonation in the B region (the transition curvature between the presence of quenching and absence of quenching).
Comparison between Figure 6 = 40°, = 45° and = 60° shows that a quenching area exists in B region. The cellular structure disappears in this area. With the increase of the curvature of the bend in = 40°, = 45° and = 60°, the no cell area moves to the upstream bend. = 40° has the smallest area in the farthest distance, while = 60° has the largest area in the nearest distance. Figure 7 reveals the effect of the curvature of the bend on the quenching position. Then, as the detonation wave leaves the elbow section, = 40°, = 45° and = 60° in the downstream position close to the upper wall has a range of pressure concentration, in which the detonation is reinitiated. The reason is when the detonation wave comes out gradually from the elbow section, the pressure experiences significant reinitiation because of the collision of three wave structure. Similar to DDT, a strong detonation wave is formed and then the steady detonation wave is restored slowly.
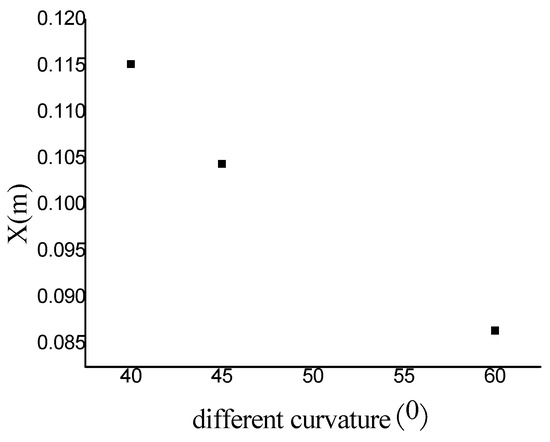
Figure 7.
The change of quenching position with bend curvature.
5.2. Internal and External Boundary Pressure Distribution
In order to own the evolution process of the detonation wave in tube, the pressure distribution in different curvature pipes is shown in Figure 8 from = 15° to = 60°. In the 6 pictures, = 15° and = 20° is in a similar situation, the same trend of the pressure is shown on the upper wall and lower wall. The pressure of the outer wall increases and then decreases, while the inner wall increases slowly, which explains why the small curvature bending has hardly any effect on the propagation of detonation. At the same time, the pressure of the inner and outer walls is not changed greatly. The pressure on the inner wall of diagram = 30° decreases gradually, and with the increase of curvature, the rarefaction effect on the inner wall is strengthened gradually. However, there is a critical detonation point different to = 15° and = 20° where the pressure of inner wall suddenly increased in the late stage of detonation propagation and then decreased. All = 40°, = 45° and = 60° are similar and have a big jump in the downstream of the inner wall where the pressure change increased more than 7.3 atm. Owing to the rarefaction of the inner wall, the detonation wave is extinguished, while the detonations are overdriven on the outer wall. A larger pressure gradient is generated between inner and outer walls and moves to the upper wall along with the propagation of detonation wave. Then a strong transverse wave is produced and compacts with the inner wall leading to a reflection which reinitiates the unburned gas rapidly.
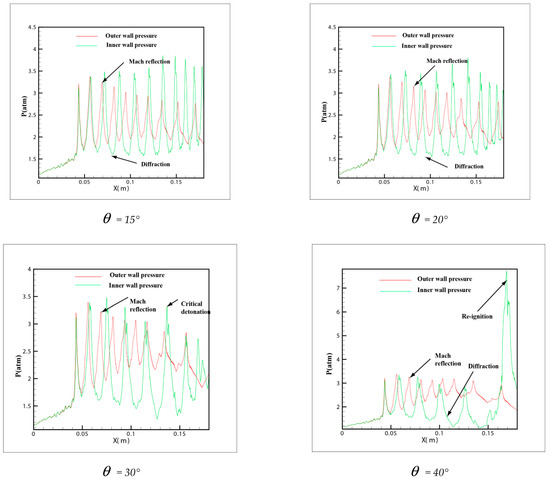
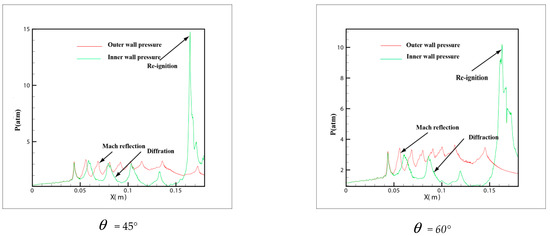
Figure 8.
The history pressure curves of inner and outer bend pipe.
From the pressure in Figure 8 = 40°, = 45° and = 60°, it can be found that a peak pressure on outer wall exists when the detonation wave begins entering the pipe, which indicates that the detonation has a Maher reflection increasing the pressure. As the detonation wave propagates through the downstream of the pipe, the pressure on the outer wall decreases gradually, while a peak pressure appears on the inner wall of the downstream pipe. This peak pressure is much higher than that in the upstream pipe. It shows the beginning of the detonation. At the same time, it is shown that when the detonation wave propagates in the bend with a certain curvature, the range of pressure increase appears both in the upstream and downstream of the bend, but the pressure on the inner wall of downstream is much larger than the outer wall. Therefore, considering the pressure of the material surface in the industrial design, these two positions of the bend pipe should be taken into account and the inner wall of downstream especially needs an extra reinforcement.
From the maximum pressure curve in Figure 9, it is obvious that the 30° curvature is critical value. This also verifies that reinitiation will appear when the degree of pipe is more than 30°, which is also shown in Figure 6. The peak of the pressure in the 45° bend pipe is the largest one and this fits to the result in Figure 8. The results show that the pressure reinitiation at this ratio is larger than that other curvature on the inner wall. Based on this conclusion, the curvature of bend surface considered in actual engineering damage should try to avoid 45°.
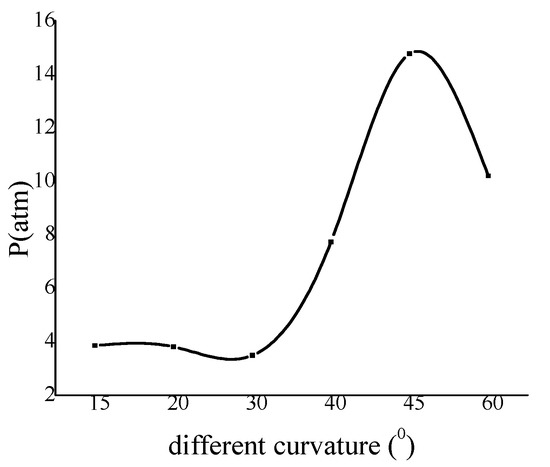
Figure 9.
The variation of wall maximum pressure with curvature.
5.3. Evolution Process of Detonation Wave in Bend
Figure 10 is the detonation wave propagation process in different curvature bending, in which high brightness white represents high pressure region. Comparison between = 15°, = 30° and = 60° with three kinds of curvature is performed and it is found the propagation processes are different. The small curvature bend has hardly any effect on the forward propagation of detonation wave and the detonation wave front is tidy. The position of the detonation wave front near the upper wall in = 30° is relatively large, and the wave front becomes a bit flat, while the influence of the upper and lower walls of the detonation wave in = 60° are relatively large, making the whole wave front distorted and generating a high pressure transverse wave near the upper wall of the bend downstream.
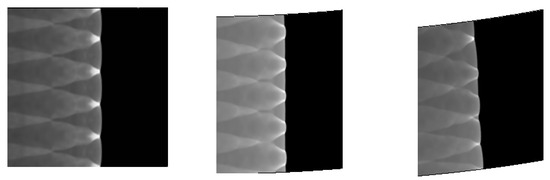
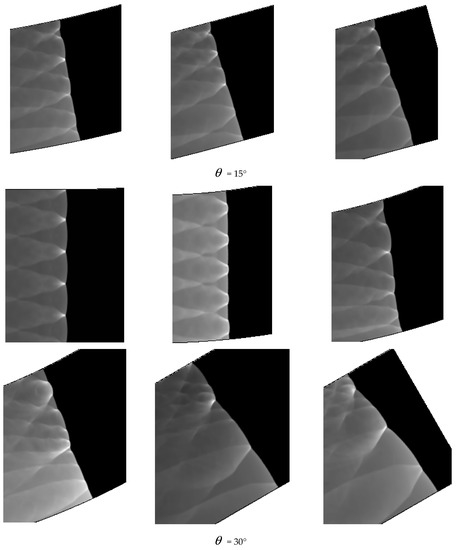
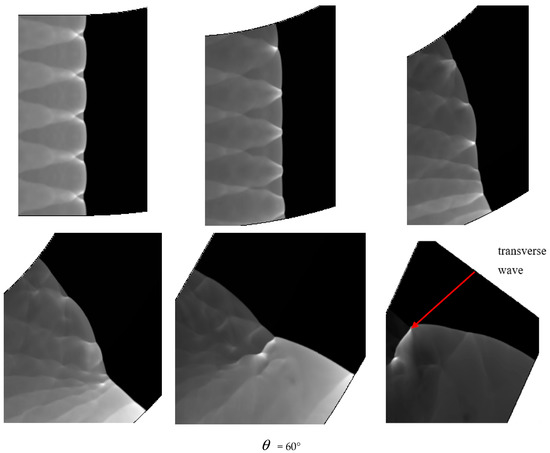
Figure 10.
Evolution process of detonation wave in curved pipe.
5.4. Chemical Reaction in Bend Pipe
5.4.1. Details of Chemical Reactions
The variation of the curvature of the bend has a huge influence on the evolution of detonation wave. The propagation mechanism is shown in different forms when propagating indifferent curvature bends. The performance of the chemical reaction in the process of detonation wave propagation in different time and different propagation mechanism is shown in Figure 11.
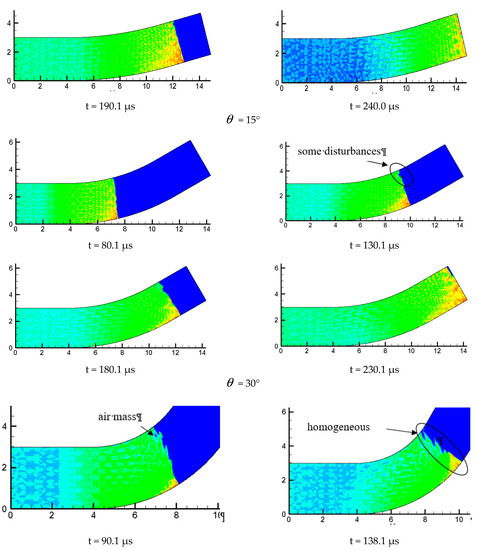
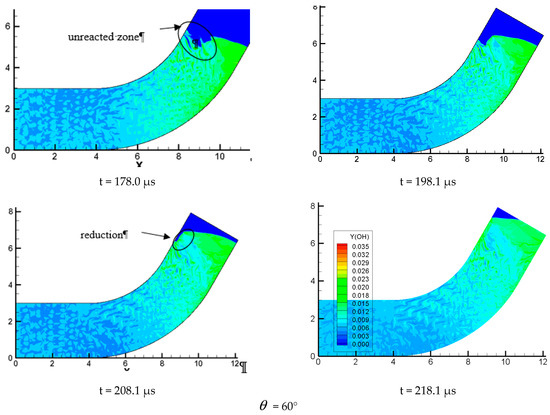
Figure 11.
Profiles of OH components with different propagation characteristics.
In Figure 11 = 15°, we can find that when detonation wave propagates in a small curvature pipe, the OH composition is mainly distributed in the wave front and the lower wall, indicating that this local chemical reaction is much more intense and the detonation wave continues to propagate forward without any distortion in the whole propagation process. This is in good agreement with the analyzed results of pressure profile. Figure = 15° is similar to Figure = 30°, except for some disturbances appearing to the surface wave front on the inner wall in the process of detonation wave propagation and making the wave front unsmooth. The detonation wave still propagates forward. Figure 11 = 60° is very different from = 15° and = 30°; it can be found the detonation is greatly affected when it is entering the bend. An air mass surrounded by detonation wave appears near the upper wall. As the detonation wave continues to move forward, the wave front becomes very in homogeneous after a large disturbance. Moreover, the air mass is increased and the wave front becomes more inhomogeneous. At the same time, the surface is gradually depressed, indicating that there is no chemical reaction and the detonation wave and chemical reaction is decoupled, which prompts the detonation quenching near the inner wall. By analyzing the OH content map, we find that the detonation wave moving toward the inner wall is gradually formed near the lower wall and ignites the unreacted gas on the inner surface. This drives the whole detonation wave front to move forward continuously. Some local high concentration points of OH group is found near the inner wall, indicating the formation of hot spots which evidently shows that the chemical reaction is more intense and the detonation wave is formed. The content of OH in the inner wall still stays at a high level in the later stage of the detonation, which shows that the chemical reaction on the surface of the inner wall is strongly affected by the shock and is consistent with the result of the pressure curve.
5.4.2. Profiles of Different Chemical Components
Figure 12 is the concentration of chemical reactions in the bend pipe. Hydrogen and oxygen in reactants (a), (c) and products (H) change fastest. (b), (d) and (E) represent the intermediate products of O, H and OH and indicate the chemical reaction. The concentration of these intermediate products has the maximum value at the reaction front and then gradually decreased. The pressure profile of (E) shows that a high pressure area is formed near the lower wall affected by the compression wave, while the unreacted gas near the upper wall is formed by rarefaction wave. The contents of (f) and (g) reach the maximum value at the reaction front and then decay very fast. Comparing (f), (g), (b), (d) and (E), it is found that H2O2 and HO2 in the chemical reaction flow field are compositions with the least content.
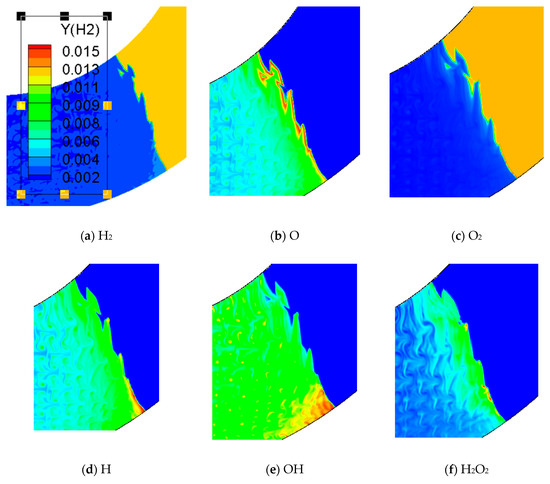
Figure 12.
Comparison of different chemical components in 60° bend.
6. Conclusions
In this paper, the influence of different curvature bends on the propagation characteristics of the cellular detonation wave is systematically studied. The cellular detonation wave propagated in the bends is interacted by both compression wave and the rarefaction wave in the inner and outer wall. The propagation mechanism is concluded in three parts: bend curvature with angle less than 30° has rarely effect on propagation of cellular detonation wave, which can spread themselves stably and has relatively smoothed detonation wave front and almost unchanged cell size. Curvature bend with angle more than 30° has a great influence on the propagation of the detonation wave which leads to decoupling, quenching and reinitiation. The whole propagation process reached the peak value after reinitiation. The 45° bending curvature has the largest pressure in all kinds of bends. The detonation wave cellular disappeared after quenching and became larger after the reinitiation. In the details of the chemical reaction, the difference of detonation wave propagation mechanism in different bending curvature was shown in composition figure of OH. Meanwhile, the way the detonation wave moved forward was indicated. It is obvious that the wave front in the quenching bends is largely different from that in the nonquenching bends.
Author Contributions
Conceptualization and writing—original draft preparation, H.Z. (Hui Zhao); professional guidance, H.L.; investigation, H.Z. (Haitao Zhao); validation, L.L.; methodology, J.L. All authors have read and agreed to the published version of the manuscript.
Funding
This research was supported by National Key R&D Program of China, grant number 2018YFB0204402, National Key R&D Program of China, grant number 2018YFB0204404.
Institutional Review Board Statement
Not applicable.
Informed Consent Statement
Not applicable.
Data Availability Statement
Not applicable.
Conflicts of Interest
All authors declare no conflict of interest.
References
- Liang, Z.; Bauwens, L. Cell structure and stability of detonations with a pressure dependent chain branching reaction rate model. Combust. Theory Model 2005, 9, 93–112. [Google Scholar] [CrossRef]
- Smirnov, N.N.; Nikitin, V.F. Modeling and simulation of hydrogen combustion in engines. Int. J. Hydrog. Energy 2014, 39, 1122–1136. [Google Scholar] [CrossRef]
- Smirnov, N.N.; Nikitin, V.F.; Stamov, L.I.; Altoukhov, D.I. Supercomputing simulations of detonation of hydrogen-air mixtures. Int. J. Hydrog. Energy 2015, 40, 11059–11074. [Google Scholar] [CrossRef]
- Anand, V.; St George, A.; Gutmark, E. Amplitude modulated instability in reactants plenum of a rotating detonation combustor. Int. J. Hydrog. Energy 2017, 42, 12629–12644. [Google Scholar] [CrossRef]
- Nakayama, H.; Moriya, T.; Kasahara, J.; Matsuo, A.; Sasamoto, Y.; Funaki, I. Stable detonation propagation in rectangular-crosssection curved channels. Combust Flame 2012, 159, 859–869. [Google Scholar] [CrossRef]
- Nikolaou, Z.M.; Chen, J.-Y.; Swaminathan, N. A 5-step reduced mechanism for combustion of CO/H2/H2O/CH4/CO2 mixtures with low hydrogen/methane and high H2O content. Combust. Flame 2013, 160, 56–75. [Google Scholar] [CrossRef]
- Ibrahim, S.S.; Masri, A.R. The effects of obstructions on overpressure resulting from premixed flame deflagration. J. Loss Prev. Process Ind. 2001, 14, 213–221. [Google Scholar] [CrossRef]
- Ciccarelli, G.; Dorofeev, S. Flame acceleration and transition to detonation in ducts. Prog. Energy Combust. Sci. 2008, 34, 499–550. [Google Scholar] [CrossRef]
- Emami, S.; Mazaheri, K.; Shamooni, A.; Mahmoudi, Y. LES of flame acceleration and DDT in hydrogen-air mixture using artificially thickened flame approach and detailed chemical kinetics. Int. J. Hydrog. Energy 2015, 40, 7395–7408. [Google Scholar] [CrossRef]
- Xuxu, S.; Quan, L.; Lu, S. The propagation mechanism of detonation wave in a round tube filled with larger blockage ratio orifice plates. Int. J. Hydrog. Energy 2019, 44, 7684–7691. [Google Scholar]
- Wang, C.J.; Guo, C.M. On the influence of low initial pressure and detonation stochastic nature on Mach reflection of gaseous detonation waves. Shock Waves 2014, 24, 467–477. [Google Scholar] [CrossRef]
- Zhang, Y.; Cheng, Y.F.; Su, J.; Wang, W.T.; Han, T.F.; Tan, Y.X.; Cao, W.G. Experimental investigation on the near detonation limits of propane/hydrogen/oxygen mixtures in a rectangular tube. Int. J. Hydrog. Energy 2020, 45, 1107–1113. [Google Scholar]
- Deng, B.; Hu, Z.; Teng, H.; Jiang, Z. Numerical investigation on detonation cell evolution in a channel with area- changing cross section. Sci. China Ser. G Phys. Mech. Astron. 2007, 50, 797–808. [Google Scholar] [CrossRef]
- Levin, V.A.; Manuilovich, I.S.; Markov, V.V. Excitation and quenching of detonation in gases. J. Eng. Phys. Thermophys. 2010, 83, 1244–1274. [Google Scholar] [CrossRef]
- Li, J.; Ren, H.; Ning, J. Numerical application of additive Runge-Kutta methods on detonation interaction with pipe bends. Int. J. Hydrog. Energy 2013, 38, 9016–9027. [Google Scholar] [CrossRef]
- Zhou, N.; Wang, W.-X.; Zhang, G.-W.; Zong, Y.-D.; Zhao, H.-J.; Yuan, X.-J. Numerical simulation study on the combustion rule of bending structure in pipes. Combust. Sci. Technol. 2018, 190, 1500–1514. [Google Scholar] [CrossRef]
- Yuan, X.; Zhou, J.; Lin, Z.; Cai, X. Adaptive simulations of detonation propagation in 90-degree bent tubes. Int. J. Hydrog. Energy 2016, 41, 18259–18272. [Google Scholar] [CrossRef]
- Li, L.; Li, L.J.; Teo, C.J.; Chang, P.H.; Khoo, B.C. Experimental study on incident wave speed and the mechanisms of deflagration-to- detonation transition in a bent geometry. Shock Waves 2017, 28, 205–216. [Google Scholar] [CrossRef]
- Edwards, D.H.; Fearnley, P.; Nettleton, M.A. Shock Diffraction in Channels with 90 Bends. Fluid Mech. 1983, 32, 257–270. [Google Scholar] [CrossRef]
- Frolov, S.; Aksenov, V.; Shamshin, I. Reactive shock and detonation propagation in U-bend tubes. J. Loss Prev. Process Ind. 2007, 20, 501–508. [Google Scholar] [CrossRef]
- Frolov, S.M.; Aksenov, V.S.; Shamshin, I.O. Shock wave and detonation propagation through U-bend tubes. Proc. Combust Inst. 2007, 31, 2421–2428. [Google Scholar] [CrossRef]
- Uchida, M.; Suda, T.; Fujimori, T. Pressure loading of detonation waves through 90-degree bend in high pressure H2-O2-N2 mixtures. Proc. Combust. Inst. 2011, 33, 2327–2333. [Google Scholar] [CrossRef]
- Kudo, Y.; Nagura, Y.; Kasahara, J.; Sasamoto, Y.; Matsuo, A. Oblique detonation waves stabilized in rectangular-cross-section bent tubes. Proc. Combust. Inst. 2011, 33, 2319–2326. [Google Scholar] [CrossRef]
- Wang, L.Q.; Ma, H.H.; Shen, Z.W.; Cheng, Y.F.; Chen, D.G. Detonation behaviors of syngas-oxygen in round and square tubes. Int. J. Hydrog. Energy 2018, 43, 14775–14786. [Google Scholar] [CrossRef]
- Sugiyama, Y.; Nakayama, Y.; Matsuo, A.; Nakayama, H.; Kasahara, J. Numerical Investigations on Detonation Propagation in a Two-Dimensional Curved Channel. Combust. Sci. Technol. 2014, 186, 1662–1679. [Google Scholar] [CrossRef]
- Shi, X.; Ryu, J.I.; Chen, J.Y.; Dibble, R.W. Modes of reaction front propagation and end-gas combustion of hydrogen/air mixtures in a closed chamber. Int. J. Hydrog. Energy 2017, 42, 10501–10512. [Google Scholar] [CrossRef]
- Gwak, M.; Yoh, J.J. Effect of multi-bend geometry on deflagration to detonation transition of a hydrocarbon-air mixture in tubes. Int. J. Hydrog. Energy 2014, 38, 11446–11457. [Google Scholar] [CrossRef]
- Zhenhua, P.; Jun, Q.; Pan, J.; Zhang, P.; Zhu, Y.; Gui, M. Fabrication of a helical detonation channel: Effect of initial pressure on the detonation propagation modes of ethylene/oxygen mixtures. Combust. Flame 2018, 192, 1–9. [Google Scholar]
- Otsuka, S.; Suzuki, M.; Yamamoto, M. Numerical Investigation on Detonation Wave through U-bend. J. Therm. Sci. 2010, 19, 540–544. [Google Scholar] [CrossRef]
- Liang, Z.; Curran, T.; Shepherd, J.E. Structural response to detonation loading in 90-degree. Shock Waves 2009, 1, 383–388. [Google Scholar]
- Gallier, S.; Palud, F.L.; Pintgen, F.; Mevel, R.; Shepherd, J.E. Detonation wave diffraction in H2–O2–Ar mixtures. Proc. Combust. Inst. 2017, 36, 2781–2789. [Google Scholar] [CrossRef]
- Goodwin, G.B.; Houim, R.W.; Oran, E.S. Shock transition to detonation in channels with obstacles. Proc. Combust. Inst. 2017, 36, 2717–2724. [Google Scholar] [CrossRef]
- Short, M.; Chiquete, C.; Quirk, J.J. Propagation of a stable gaseous detonation in a circular arc configuration. Proc. Combust. Inst. 2019, 37, 3593–3600. [Google Scholar] [CrossRef]
- Li, J.; Ren, H.; Ning, J. Additive Runge-Kutta methods for H2/O2/Ar detonation with a detailed elementary chemical reaction model. Chin. Sci. Bull. 2013, 58, 1216–1227. [Google Scholar] [CrossRef][Green Version]
- Niibo, T.; Morii, Y.; Ashahara, M.; Tsuboi, N.; Hayashi, A.K. Koichi Hayashi. Numerical Study on Direct Initiation of Cylindrical Detonation in H/O Mixtures: Effect of Higher-Order Schemes on Detonation Propagation. Combust. Sci. Technol. 2016, 188, 2044–2059. [Google Scholar] [CrossRef]
- Yuan, X.; Zhou, J.; Liu, S.; Lin, Z. Diffraction of cellular detonation wave over a cylindrical convex wall. Acta Astronaut. 2020, 169, 94–107. [Google Scholar] [CrossRef]
- Xia, Z.; Ma, H.; Zhuo, C.; Zhou, C. Propagation process of H2/air rotating detonation wave and influence factors in plane-radial structure. Int. J. Hydrog. Energy 2018, 43, 4609–4622. [Google Scholar] [CrossRef]
- Xia, Z.; Ma, H.; Zhuo, C.; Zhou, C. Propagation characteristics of rotating detonation wave in plane–radial ture with different pressure conditions, Proceedings of the Institution of Mechanical Engineers, Part G. J. Aerosp. Eng. 2018, 233, 1–15. [Google Scholar]
- Zbikowski, M.; Makarov, D.; Molkov, V. Numerical simulations of large-scale detonation tests in the RUT facility by the LES model. J. Hazard. Mater. 2010, 181, 949–956. [Google Scholar] [CrossRef]
- Zhou, S.; Ma, H.; Yang, Y.; Zhou, C. Investigation on propagation characteristics of rotating detonation wave in a radial-flow turbine engine combustor model. Acta Astronaut. 2019, 160, 15–24. [Google Scholar] [CrossRef]
- Nagura, Y.; Kasahara, J.; Matsuo, A. Multi-frame visualization for detonation wave diffraction. Shock Waves 2016, 26, 645–656. [Google Scholar] [CrossRef]
- Samtaney, R. Computational Methods for Self- similar Solutions of the Compressible Euler Equations. J. Comput. Phys. 1997, 132, 327–345. [Google Scholar] [CrossRef]
- Ning, J.; Zhao, H.; Li, J.; Ma, T.; Ren, H. Numerical simulation of H2-O2 gaseous detonation on the wedge. Int. J. Hydrog. Energy 2015, 40, 12897–12904. [Google Scholar] [CrossRef]
- Steger, J.L.; Warming, R.F. Flux vector splitting of the inviscid gasdynamics equations with application to finite-difference methods. J. Comput Phys. 1981, 40, 202–228. [Google Scholar] [CrossRef]
- Lee, J.H.S. Dynamic parameters of gaseous detonations. Ann. Rev. Fluid Mech. 1984, 16, 11–336. [Google Scholar] [CrossRef]
- Araújo, A.L.; Murua, A.; Sanz-Serna, J.M. Symplectic methods based on decompositions. SIAM J. Numer. Anal. 1997, 34, 1926–1947. [Google Scholar] [CrossRef]
- Kennedy, C.A.; Carpenter, M.H. Additive Runge-Kutta schemes for convection-diffusion-reaction equations. Appl. Numer. Math. 2003, 44, 139–181. [Google Scholar] [CrossRef]
- Higueras, I. Strong Stability for Additive Runge–Kutta Methods. SIAM J. Numer. Anal. 2006, 44, 1735–1758. [Google Scholar] [CrossRef]
- Westbrook, C.K. Chemical Kinetics of Hydrocarbon Oxidation in Gaseous Detonations. Combust. Flame 1982, 46, 191–210. [Google Scholar] [CrossRef]


Publisher’s Note: MDPI stays neutral with regard to jurisdictional claims in published maps and institutional affiliations. |
© 2021 by the authors. Licensee MDPI, Basel, Switzerland. This article is an open access article distributed under the terms and conditions of the Creative Commons Attribution (CC BY) license (https://creativecommons.org/licenses/by/4.0/).