Abstract
The global average air temperature is increasing as a manifestation of climate change and more intense and frequent heatwaves are expected to be associated with this rise worldwide, including northern Europe. Summertime indoor conditions in residential buildings and the health of occupants are influenced by climate change, particularly if no mechanical cooling is used. The energy use of buildings contributes to climate change through greenhouse gas emissions. It is, therefore, necessary to analyze the effects of climate change on the overheating risk and energy demand of residential buildings and to assess the efficiency of various measures to alleviate the overheating. In this study, simulations of dynamic energy and indoor conditions in a new and an old apartment building are performed using two climate scenarios for southern Finland, one for average and the other for extreme weather conditions in 2050. The evaluated measures against overheating included orientations, blinds, site shading, window properties, openable windows, the split cooling unit, and the ventilation cooling and ventilation boost. In both buildings, the overheating risk is high in the current and projected future average climate and, in particular, during exceptionally hot summers. The indoor conditions are occasionally even injurious for the health of occupants. The openable windows and ventilation cooling with ventilation boost were effective in improving the indoor conditions, during both current and future average and extreme weather conditions. However, the split cooling unit installed in the living room was the only studied solution able to completely prevent overheating in all the spaces with a fairly small amount of extra energy usage.
1. Introduction
The global mean temperature has increased by about 1 °C during the last 150 years [1]. Furthermore, in the future, heatwaves, “periods of extreme heat, which are differently defined in health, agriculture and climatology based studies” [2] will be more frequent, more serious, much longer [3], and associated with more environmental hazards than presently [4].
Heatwaves affect lung functions and blood flow in the human body, cause cardiovascular diseases and increase population mortality [5]. The mortality effects of heatwaves are higher in urban areas than the rural area. In Helsinki as a representative of urban areas in the Nordic countries, during four recent intensive heatwaves, the heat-related mortality risk was 2.5 times higher than in the ambient rural areas [6]. Buildings are at the forefront of the challenges of warming climate from two points of view. First, it is estimated that, for a developed nation, about 25%–40% of energy-related emissions of carbon dioxide which leads to climate change can be attributed to buildings. Thus, the energy efficiency of buildings is an important factor for mitigating climate change in the political and technical European agenda [7]. Second, due to the negative effects of climate change on human health, it is crucially essential to investigate the risk of overheating under climate change and see its effects on the thermal comfort and well-being of the occupants. Since using cooling systems is not common in residential buildings in Nordic countries [6], the risk of overheating is higher than in commercial or public buildings.
Previous studies about the energy efficiency and overheating risk of residential buildings under changing climate and the efficiency of different strategies for reducing the demand for energy or peak power can be categorized into two groups. The first group has considered average climatic conditions using test reference year (TRY) climatic data, while the latter has focused on heatwaves of the current climate. Both groups, reviewed below, include studies for a range of current and projected future climatic zones [8,9].
In the first group of studies in which average climatic data is used, in the hot and humid climate, research by Invidiata and Ghisi [10] in Brazil has used TRY climatic data of the 2020s, 2050s, and 2080s of three cities in Brazil to investigate the impact of climate change on heating and cooling energy demand in dwellings. The results showed that passive strategies can reduce up to 50% of the future annual cooling and heating energy demand. Future trends of cooling energy of residential buildings in Taiwan are investigated in the study by Huang and Hwang [11], using TRY climatic data of the 2020s, 2050s, and 2080s. It showed that the combination of several passive strategies can significantly reduce the increases in the cooling energy usage caused by the effect of climate change. In Hong Kong, Sheng Liu et al. [12] examined the passive design strategies for residential buildings under the different future climate change scenarios. The results showed that the combination of passive strategies can reduce annual and peak cooling load up to 56.7% and 64.5% under climate change, respectively. May Zune et al. [13] investigated the overheating risk in modern dwellings in Myanmar under changing climate. They found a high overheating risk in the dwellings by 2070.
In the desert climate of the United Arab Emirates, warming by 5.9 °C was estimated to result in an increase of 23.5% in the energy used for cooling buildings [14]. Karimpour et al. [15] in Australia, investigated the effects of different envelope designs on the energy efficiency of residential buildings in an area having a hot-summer Mediterranean climate. They concluded that with climate change, heating becomes significantly less important in modern better-insulated buildings. Thus, to cope with the impact of climate change, it is important to focus more on measures that reduce cooling load. Investigating indoor thermal conditions under changing climate, the adaptation of dwellings of Argentina to climate change has been examined in a study by Filippin et al. [16]. The results showed that in 2040, it is necessary to revise the dimensions of the glazed exterior façade areas and improve solar protection to deal with overheating.
In the temperate climate of central Europe, with mild winters and warm summers, Salthammer et al. [17] indicated that current thermal insulation standards do not protect indoor spaces from overheating in the future climate of Germany and, therefore, smart solutions for mechanical and natural ventilation should be introduced. A recent study in the UK by Elsharkawy et al. [18] about the effects of retrofit under three different scenarios of future climate showed that occupancy patterns have a significant impact on the predicted duration of overheating. Moreover, in the Italian Apennine Mountains, de Rubeis et al. [19] focused on heating energy consumption and estimated it to decrease by 44.8% by 2080.
Heatwaves of the current climate and their effects on indoor temperature conditions and energy demand of residential buildings have been investigated in the other group of studies. In the Mediterranean climate of southern Europe, Barbosa et al. [20] evaluated the vulnerability of existing dwellings of Lisbon to the heatwave of summer 2003 and the future projected climate. They found that both night ventilation in bedrooms and increased insulation can decrease indoor temperatures during heatwaves. Another study in Portugal showed that changes in average outdoor temperature do not affect electricity consumption significantly, but extreme temperatures during heatwaves have a stronger impact on the peak power demand [21]. In the temperate climate of Switzerland, Xiaohai Zhou et al. [22] analyzed the performance of two mitigation measures, hygroscopic materials and precooling, for the heatwave in the summer of 2018. A combination of these two mitigation measures was found to have a large potential of reducing the heat stress of people during heatwaves while minimizing the energy consumption of buildings. A study in the cold climate of Canada by Laouadi et al. [23] proposed a simulation method to define overheating and evaluate the risk of thermal discomfort and health problems during heatwaves. By using the method to an example building in the heatwave of 2010 it was discovered that highly insulated and airtight buildings are at a higher risk of overheating than older buildings, and opening windows can significantly reduce the overheating risk.
In Northern European countries, with cold winters and rather warm summers, a field study by Maivel et al. [24] examined the impact of ventilation, the orientation of the building, and window size on recorded overheating in 100 Estonian apartments. It was shown that without any passive solar protection solutions, modern buildings were regularly overheated already in the current climate of northern European countries. Three other simulation studies have focused on climate change and its effect on energy efficiency and thermal conditions of residential buildings in the cold climate of Nordic countries. In Sweden, Dodoo, and Gustavsson [25] simulated buildings of three different energy regulatory regimes. They used three different future climate scenarios. Overheating risk was analyzed by comparing the percentage of time with indoor temperatures over 28 °C and between 26 °C and 28 °C, respectively. Cooling and heating energy were also calculated. Based on the results, passive cooling measures, e.g., solar shading will become more important under future climate scenarios. Investigating the effects of climate change on the energy demand and primary energy use of a residential building in Sweden, Tettey et al. [26] indicated that with suitable strategies, e.g., window shading significant primary energy reductions are achievable under climate change. In Finland, Jylhä et al. [27] estimated that for a typical detached house, the cooling energy use in the summer will increase but the annual purchased energy for heating and cooling will decrease by 20–35% by 2100, depending on the magnitude of the climate change.
Despite the extensive studies on overheating and energy demand under changing climate, more work for buildings in cold climates is needed to quantify the risk of overheating under climate change and the associated heatwaves. This research gap is summarized for future consideration as follows:
- Most studies have focused on the actual data of previous heatwaves, while due to climate change, more severe and longer heatwaves are expected. Therefore, it is important to assess the performance of the residential buildings under those extreme weather conditions by using synthetic future weather data.
- Current overheating assessments are mostly done in warm and hot climates, while climate change is more rapid in Nordic countries, and most of the residential buildings in this area are not equipped with cooling systems, so the overheating risk would be higher in this area and should be taken seriously. In Nordic old and new apartments, a systematic analysis of the effect of different passive and mechanical cooling solutions on indoor climate and energy consumption is essential in future climates.
In this paper, we assessed overheating risk and the energy efficiency of a typical old and new apartment building in southern Finland under climate change using both average and extreme weather conditions of exceptionally hot summers. The work was based on a dynamic building energy simulation and climate change projections derived from a multi-member ensemble of global climate models. We addressed the following research questions: (a) What are the simulated current indoor temperature conditions and energy demand of Finnish residential buildings? (b) How much will the energy demand and overheating risk increase by 2050 due to climate change? (c) How much can passive measures affect the overheating risk in the current and future climates? (d) How do the buildings respond to heatwaves, and how serious are the past and future heatwaves in comparison to the current and future average weather conditions? (e) How much will the overheating risk and cooling demand increase during the future heatwaves associated with climate change?
The novelty of this study is the usage of future projected data set of summer heatwaves alongside the actual climate data set of summer heatwave 2018 for describing their impacts on indoor temperature conditions and energy demand. The results of the simulations were compared to the results of the current and future average climate conditions to understand how the severity of the event would be different in the thermal comfort and well-being of the occupants and how much the energy demand is influenced. Furthermore, a more systematic and detailed analysis of the impact of active and passive cooling measures was done, and their effects on overheating risk and energy demand of residential buildings were discussed.
2. Materials and Methods
2.1. Description of the Studied Buildings
The example buildings considered in this study are two similar five-story apartment buildings which locate in Helsinki, Finland. The geometry and orientation of the example buildings are identical (Figure 1). The facade with the largest windows fronts west. However, some simulation cases are defined with different orientations. The buildings have four living floors and a basement floor which is located underground, containing storage and technical spaces. The heated net floor area of the buildings is 1943.5 m2. It is assumed that the example buildings are located in a neighborhood, where they are surrounded by similar buildings (Figure 2).
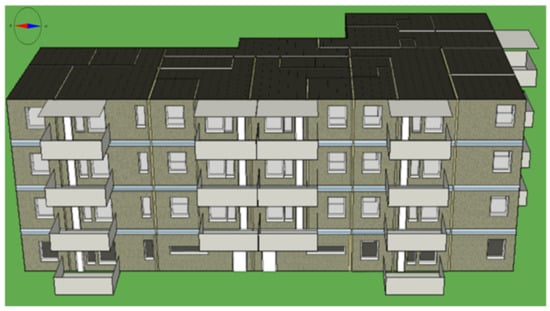
Figure 1.
The geometry of the building.
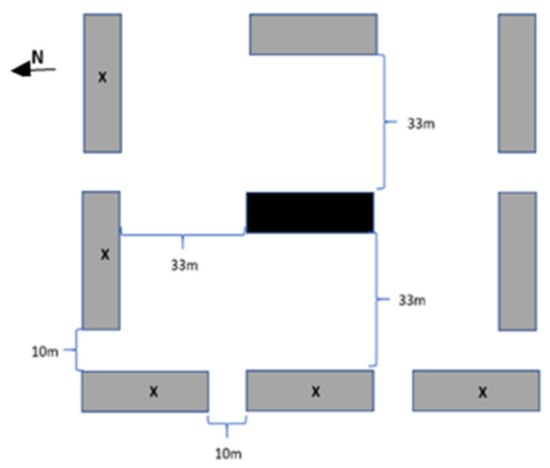
Figure 2.
The location of the simulated example building (black box) and the surrounding buildings (grey boxes).
The new building is assumed to be built after 2012 while the old building belongs to the 1960s. Thus, ventilation systems, envelope properties, window to wall ratio, and window properties are different according to the common practice of the construction year. The envelope properties of the old and new buildings, including the U-values and window properties, are reported in Table 1. The floor plan and room types of the buildings are shown in Figure 3.

Table 1.
Construction properties of the basic form of the old and new example apartment buildings.
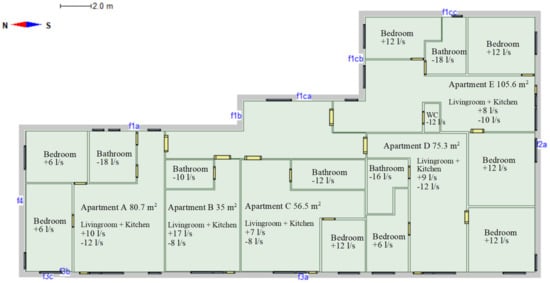
Figure 3.
Floor plan and room types in the old and new apartment building, the exhaust airflow rates of the old building, and the air flow rates of the new building.
To facilitate the comparison of the results, the properties of the buildings and the HVAC system are assumed to be the same in the simulations of current and future climate conditions even if the efficiencies of the cooling systems may improve in the future.
The ventilation system in the old apartment building is a constant air ventilation (CAV) mechanical exhaust system. The specific fan power (SFP) of the ventilation system is 0.7 kW/m3/s. The exhaust airflow rates (negative values) in different rooms of the old apartment building are shown in Figure 3. The air leakage rate of the building envelope q50 at 50 Pa pressure difference is 6 m3/hm2.
The ventilation system of the new apartment building is CAV mechanical supply and exhaust ventilation system. The setpoint temperature of supply air heating is 16 °C the whole year except June to August in which it is reduced to 14 °C. It is assumed that supply air temperature warms up by 1 °C due to fans and ducting. The air handling unit (AHU) is equipped with a district heated reheat coil, which is used for heating supply air. The SFP of the ventilation system is 1.8 kW/m3/s.
The total air exchange rate of the building is 0.52 ACH in both old and new buildings. The room types and the airflow rates in different rooms are shown in Figure 3 in which positive values are the supply airflow rates and the negative ones the exhaust airflow rates. The air leakage rate of building envelope q50 at 50 Pa pressure difference is 2 m3/hm2.
Table 2 shows the number of occupants in each apartment type. The average occupancy density is one occupant per 28 m2. The activity level of 1.2 MET and adjustable clothing level (0.85 ± 0.25 CLO) are used. It is assumed that there are no heat gains from occupants in the staircase and base floor. The presence of the occupants corresponds with the lifestyle of working families. Thus, the heat gains are spatial, and temporal based on their presence.
Table 2.
The total number of occupants in each apartment type.
Manually controlled blinds between the outer panes are used when someone is present in the room according to the occupancy profile and the intensity of solar radiation exceeds 100 W/m2 on the windowpane. There are no blinds in the windows of the staircase.
The heating system of both the old and new building is district heating (DH). The efficiency of the heat exchanger in the DH substation is 97%. Space heating is carried out by 70/40 °C water radiators and the heat distribution efficiency is 80%. The temperature setpoint of space heating is 21 °C in the apartments, except 22 °C in the bathrooms. On the staircase and basement floor, the setpoint of space heating is 17 °C. A mechanic cooling system is used in just some of the simulation cases that will be discussed in the following sections.
The annual net heating demand of domestic hot water (DHW) is 35 kWh/m2 [28] per heated net floor area of the building. It is assumed that DHW consumption is constant with time. Heat losses of the DHW circuit are 0.56 W/m2 and 50% of the heat losses were assumed to end up with internal heat gains in the zones.
The total annual electricity consumption of household equipment is 21.0 kWh/m2 [28] per heated net floor area. The electric power of the appliances (W/m2) is assumed to be evenly distributed by the floor area of all the simulated zones in the apartments, and the appliances are used every day between 7:00–23:00. There are no appliances on the staircase or base floor.
The total annual electricity consumption of indoor lighting is 7.9 kWh/m2 [28], per total heated net floor area of the building. The electric lighting power (W/m2) is assumed to be evenly distributed by the floor area of all the simulated zones in the apartments and by the floor area of the staircase. There are no heat gains from lighting on the base floor. The usage time of the lights are:
- May to August: between 21:00–23:00
- September to April: between 6:30–9:00 and 15:00–23:00
The internal door of the bathrooms or WCs is always closed, but the other internal doors inside the apartments are always open. The air airtightness of the closed doors is taken into account in the simulation and the equivalent leakage areas at 4 Pa pressure difference are 0.02, 0.1, and 0.08 m2 for the bathroom door, doors between the apartments, and the outdoor of the staircase, respectively.
2.2. Target Values for Indoor Conditions
The target values used in this paper are based on national Finnish building codes and legislations. The requirements suggested by the Ministry of the Environment and Ministry of Social Affairs and Health of Finland are used to define overheating in the living spaces of the buildings. In the design phase, the maximum allowed design indoor air temperature is 27 °C outside the heating season [29]. In the occupied apartments, the upper limit for the indoor air temperature of 32 °C, is used concerning the health and well-being of occupants in all the living spaces [28]. The annual hourly indoor air temperature profiles for the warmest bedroom of each building are simulated, and the annual degree hours above 27 °C and 32 °C benchmarks are calculated.
Based on the requirements of the Ministry of the Environment of Finland, only 150 Kh for the simulated indoor air temperatures above 27 °C is allowed during the summer months (June-August) in the design phase of the new buildings, when the simulations are carried out using the input data, e.g., weather data and standardized usage of the building specified in the building code [30]. The number of degree hours above 27 °C of the studied cases are compared to the value of 150 Kh even though the occupancy profile used in the present paper differs from the requirements of the building code. In the building code, the continuous internal heat gains should be used in all the rooms including the basement and stairs while in this study, the spatial and temporal variation in the heat gain is taken into account in a more realistic way. Moreover, the required weather data in the existing building code is TRY 2012 [31] while in this study different climate data sets are used.
2.3. Climate Data Description
The two most important weather variables affecting the heating and cooling energy demand of apartment buildings in Finland are the outdoor temperatures and in summer the solar irradiance [32]. Figure 4 shows the monthly mean outdoor temperature and global horizontal irradiance in the four climate datasets used in this paper as an input for building energy simulations.
2.3.1. Present and Future Average Climate (TRY2020 and TRY2050-RCP4.5)
The present-day reference-year dataset TRY2020 describes weather conditions that are as close as possible to the 30-year typical climatological conditions at the Helsinki-Vantaa weather station in southern Finland. The selection of TRY2020 was based on a standard method [33] with some modifications [32,34]. In TRY2020, the average monthly mean temperature ranges between −4.5 °C in February and 17.4 °C in July, and average monthly mean global horizontal irradiance between 6 W/m2 in December and 235 W/m2 in July.
By combining the weather observations selected for TRY2020 with multi-model mean climate change projections for our study region [35,36], a reference year weather dataset representing future climate in the middle of this century was constructed with the aid of a so-called delta-change method [34]. In the current study, we assume that the future evolution of greenhouse gas concentrations in the atmosphere will follow an intermediate pathway called Representative Concentration Pathway 4.5 (RCP4.5) [37]. Accordingly, the dataset describing average future climate is denoted by TRY2050. Under the RCP4.5 scenario, the projected increase in the monthly mean temperatures for 2050, relative to TRY2020, range from 1.5 to 2.3 degrees. Meanwhile, due to changes in cloudiness and aerosol particle concentrations, the monthly mean global horizontal irradiance is projected to slightly decrease during November–March and to increase during April–October (by 1–5%).
It is worth noting that TRY2020 and TRY2050 refer to typical climatic conditions, in terms of outdoor air temperature and global horizontal irradiance, humidity, and wind speed, during the 30-year periods of 1989–2018 (midpoint 2004) and 2035–2064 (midpoint 2050), respectively. Therefore, differences between TRY2050 and TRY2020 should be interpreted as projected changes in almost five decades rather than in three decades. Regarding the future evolution of greenhouse gas concentrations in the atmosphere, which is naturally unknown, by the mid-century, the selected RCP4.5 scenario does not considerably deviate from other available plausible alternatives [35,37]. Therefore, the impact of the choice of RCP4.5 on the results is relatively small. On the other hand, there are other sources of uncertainty in TRY2050, arising from internal climate variability and differences among the various climate models (for further discussion, see [35]).

Figure 4.
Monthly mean (a) temperature and (b) global horizontal irradiance at Helsinki-Vantaa in the test reference year (TRY2020), in test reference year projected for the year 2050 under the RCP4.5 scenario (TRY2050), during the year 2018 (HWS 2018), and year 2018 transformed to represent climate conditions around the year 2050 (HWS2050).

2.3.2. Heatwaves in the Summer of 2018 and Future Heatwave (HWS2018, HWS2050-RCP4.5)
HWS2018 represents a recent April-to-September period with severe heatwaves in summer. Here a heatwave is defined as a period of days with the daily maximum outdoor temperature above 25 °C [38]. In turn, if the nighttime (9 p.m. to 9 a.m.) minimum temperature exceeds 20 °C, the night is defined as a tropical one [39]. The year 2018 was in Finland, in terms of the national monthly mean temperature, a year with record warm May and July [40]. At Helsinki-Vantaa in 2018, the months from April to September were all unusually warm, with two heatwaves, one in May and the other in July-August. The first lasted for four days (from 13th to 16th), with the highest hourly temperature of 28.8 °C but no tropical nights. During the latter heat wave, from the 12th of July to the fifth of August, daily maximum temperature exceeded 25 °C on 24 days (out of 25), with the highest hourly temperature of 30.8 °C and five tropical nights. At Helsinki-Vantaa in 2018, the months from April to September were all unusually warm, and the monthly mean temperatures of May and July were respectively 4.6 °C and 3.8 °C higher than in TRY2020. Moreover, the 95th (99th) percentile of the daily mean temperature, having a value of 23.8 °C (25.4 °C) during Julys in 1989–2018 [34], was exceeded on 12 (2) days in July 2018. The monthly mean temperatures of May and July were respectively 4.6 °C and 3.8 °C higher than in TRY2020. Furthermore, due to unusually clear skies, the monthly mean global horizontal irradiance in May 2018 was about 24% higher than in the TRY2020. Both heatwaves were associated with anomalous high-pressure areas over Fennoscandia [41] and led to droughts, crop failures, forest fires [42], and about 380 additional deaths in Finland [43]. In Helsinki, the mortality attributable to the heatwave in 2018 was about 2.2 times higher than in its surroundings [6]. Noteworthy, due to unusually clear skies, the monthly mean global horizontal irradiance in May 2018 was about 24% higher than in the TRY2020.
An important aim of this study is to assess how the severity of a heatwave like that in 2018 would be different in the climate of the mid-century. Therefore, hourly weather observations during the year 2018 were modified to represent future heatwaves (HWS2050) with the aid of climate change projections. In the transformation, the delta-change method and the RCP4.5 scenario were again used, and it was assumed that the hot summer could have occurred in any year of the period 1989–2018, without taking into account any potential temporal trends in the magnitude or probability of the occurrence of heatwaves during that period. Besides changes in the mean temperature, the delta-change method applied for the outdoor air temperature took into account changes in the standard deviation of daily mean temperature. In the study area, the day-to-day temperature fluctuations are projected to slightly increase in June and July but attenuate in other seasons. The diurnal temperature range, i.e., the difference between the daily maximum and minimum temperatures, is projected to alter little in other seasons but winter [36].
For May and July, in this HWS2050 data set, the monthly mean temperature was projected to increase by 1.5 °C and the monthly mean global horizontal irradiance by 2% relative to the year 2018 (HWS2018) (Figure 4). Further, in this HWS2050 data set, the heatwave of May (July-August) lasted for 4 (25) days with the highest hourly temperature of 29.9 °C (32.0 °C), and the number of tropical nights was 0 (15).
2.4. Building Simulation Tool
The whole building hour-by-hour multi-zone simulations of the final energy balance and indoor conditions of the buildings were conducted by the IDA Indoor Climate and Energy (ICE) tool [44]. The software simulates the interactions between thermal envelope, HVAC systems, operational and occupancy schedules of the building as well as outdoor climate variables. IDA ICE has been validated in many studies, e.g., [45,46,47]. IDA ICE considers the airflow rates between the rooms as well as infiltration through the envelope and the airflow rates through openable windows by simulating the wind pressures on each façade and stack effect in each time step.
2.5. Simulation Cases
As stated in Section 2.1, in the simulations of the old and new apartment buildings there is no mechanical cooling system in 16 cases (Table 3 and Table 4). The effect of the architectural design is not studied and the basic layout of the building is fixed in all the simulation cases. The effects of some passive measures are studied to estimate the effects of solar heat gains on overheating risk. The passive measures in these simulation cases can be categorized into three main groups including orientations, shading, and window properties. In both old and new buildings, different orientations in a way that the façade with the largest windows fronts south, north, and east, are examined. Moreover, the effects of removing window blinds and site shadings of south and west are analyzed. In two cases, 10% of the window area of the largest window of each room opens based on an assumed human behavior as the outside air temperature is between 12 °C and 22 °C and the zone air temperature exceeds 23 °C in both old and new buildings.
Table 3.
Description of simulation cases in the old building.
Table 4.
Description of simulation cases in the new building.
In the new building, in Case New- Solar protection window, solar protection window with g-value of 0.19 and direct solar transmittance ST of 0.16 is used. In Case Old- New basic window in the old building, the new basic windows are similar to basic windows in the new apartment building with g-value of 0.36 and ST of 0.3, and U value of 1 W/m2K.
The mechanical cooling systems are examined in four of the cases. In both old and new buildings, the split cooling unit installed only in the living room of each apartment is used in the cases Old-base with cooling and New-base with cooling. The cooling capacity of the units is 45 W/m2 where the area used in the dimensioning is the total floor area of the apartment. To facilitate the comparison of current and future climate results, the SCOP of the cooling unit is 3 in both current and future climate. Moreover, in the new building, the effects of using the cooling of ventilation supply air and the combination of cooling of ventilation and an increase of 30% in airflow rates suggested by the Ministry of the Environment of Finland [30] are analyzed in two different cases. The definitions used in each case are highlighted in Table 3 for the old building and Table 4 for the new building. Except for the property modified, other characteristics of the buildings are those described in Table 1. In Table 3 and Table 4, integrated shading refers to all types of shading in the window plane, e.g., blinds between the outer panes. External shading refers to permanent shading objects, on the facade, near the window.
As input data, the simulations used the different present and future climatic datasets discussed in Section 2.3. TRY2020, describing typical weather conditions in the present climate, was utilized in all 20 cases (Table 3 and Table 4). Its counterpart corresponding to the future climate (TRY2050) was applied for 11 simulations to study the impacts of changes in the average climate on the overheating risk and energy demand during a typical summer. Observed weather data of heatwave summer 2018 (HWS2018) and the synthetic future weather data of heatwave summer 2050 (HWS2050) were used in four cases: with or without a split cooling unit installed in the living rooms of the new or old building.
3. Results
The results are presented in two main sections. In the first section, the annual energy consumption is reported for each simulated case. Total district heating and electricity consumption, as well as space and ventilation heating and cooling demand, are compared between the new and old buildings, first in the average current climate and then in the projected average future climate. Moreover, the influences of current and future extreme weather conditions on the cooling electricity needed are calculated and compared with the cooling electricity in the current and future average climate. The second section is an assessment of overheating risk in the warmest bedroom of the buildings. The objective is to find out the effects of the different measures on indoor temperature conditions in the current, future, and extreme weather conditions.
3.1. Energy Demand
3.1.1. New and Old Buildings in the Current Climate
Table 5 shows the annual total purchased energy consumption for different cases for TRY2020, in the current climate. The percentage of the difference in the district heating between each case and the base case (Ref-New and Ref-Old) and the percentage in electricity consumption difference between (Ref-Newcooling and Ref-Oldcooling) are calculated for both building types), separately.
Table 5.
Annual total purchased energy consumption (kWh/m2 a) in the current climate (TRY 2020,).
The annual district heating consumption is significantly higher in the old apartment building than in the new one; in the base cases with cooling, the heating demands are 138.6 and 34.2 kWh/m2, respectively. In contrast, the annual electricity consumption is lower in the old than in the new building. However, the share of space cooling electricity in the new building (2.6 kWh/m2) is lower than in the old apartment building (2.8 kWh/m2).
The impact of the orientation, removing the shading effect of adjacent buildings and blinds on annual district heating consumption is slightly higher in the old building than in the new building. South orientation decreases the district heating consumption in the old and new buildings by 2% and 0.8%, respectively. North orientation, correspondingly, causes an increase of 2% and 0.7%. Removing the neighbor buildings on the south and west side of the old building decreases the district heating consumption by 1.3%, while in the new building the amount of decrease is only 0.7%. Removing the blinds has quite a negligible impact on the district heating consumption in the old and new buildings with less than 0.5% decrease. These blinds are controlled based on occupancy profile in the base cases.
Openable windows do not affect the district heating consumption in the old building, but it causes a small increase of 1% in the new building. The new basic windows in the old building decrease the consumption by 7.1% because of the low U-value of the windows in comparison to the original poorly insulated windows. Conversely, the solar protection windows in the new building cause an increase of 1.3% in district heating consumption because of the reduction in solar gains in winter.
In the ventilation cooling and ventilation cooling combined with ventilation boost cases, the district heating consumption of the new building increases slightly by 1% and 2%, respectively. The electricity consumption is decreased by 3.2% in the future, while it increases by 2.7% in the latter one, this is due to the increase of fans electricity usage needed for ventilation boost.
3.1.2. Impacts of Future Climate Change in New and Old Buildings
Table 6 shows the annual total purchased energy consumption in the projected average future climate TRY2050. The percentage of the difference in the district heating and electricity consumption between each case and the base case (Ref-New cooling and Ref-Old cooling) is calculated for both building types. The district heating consumption decreased in the old building by about 12–14% and in the new building by 7–10% compared to the consumption in the current climate (TRY2020). Accordingly, the percentage of decrease is slightly larger in the old building. Space and ventilation heating consumption will decrease by 15–18% in the old building and by 15–22% in the new building.
Table 6.
Annual total purchased energy (kWh/m2 a), in the projected future climate under the RCP4.5 scenario (TRY 2050).
On the other hand, in the future climate, the electricity consumption of the base cases with the split cooling unit is increased by 2.2% and 3.6% in the new and old buildings, respectively. In the new building, using the ventilation cooling and ventilation boost cause the electricity consumption to increase by 4.9%. Although the absolute amount of space cooling electricity used by the split cooling units is small, it will increase by 42.9% and 30.8% in the old and new buildings, respectively.
Overall, under changing climate the amount of decrease in the district heating consumption in both building types is considerably larger than the increase in the electricity consumption.
3.1.3. Influences of Current and Future Extreme Weather Conditions
Table 7 shows the space cooling electricity consumption of the old and new building base cases with the split cooling unit in April-September of 2018 (HWS2018) and April-September of the mid-century (HWS2050); these represent extreme summer weather conditions in the current and future climate. The effects of the heatwaves on the electricity consumption for space cooling were calculated for each building type. Comparisons were made both between the current and future heatwaves and against the average climate, using the TRY2020 and TRY2050 weather data as baselines. According to the simulation, the heatwave in 2018 increased the cooling electricity consumption significantly more in the old than in the new building. Although small in absolute terms, the simulated space cooling electricity is even 37.5% (17.6%) higher for the heatwave summer 2018 than for the future average climate (TRY2050) in the old (new) building, respectively.
Table 7.
The space cooling electricity consumption (kWh/m2 a) of the cases with the split cooling unit in April–September 2018 (HWS2018) and its counterpart (HWS2050) in the projected climate around the year 2050.
In the heatwave summer 2018, the simulated space cooling electricity in the old and new buildings, respectively, was 96.4% and 53.8% higher than the results for the average climate TRY2020. It also exceeded the results for the average climate of 2050 (by 37.5% for the old and by 17.6% for the new building). In the heatwave summer 2050, the space cooling electricity will be 31% and 28% higher than the results with HWS2018. This shows that heatwaves cause a significant increment on the electric grid. Thus, in the future, there will be crucially important issues concerning the effects of heatwaves on the electric power supply.
3.2. Overheating Risk
The annual hourly indoor air temperature and the overheating risk are investigated in the warmest bedroom of each building type. The bedroom is located in apartment D and faces to the west (Figure 5).
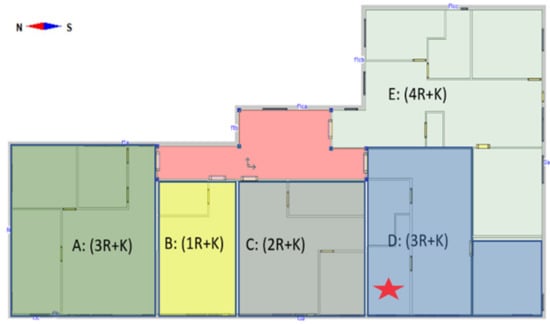
Figure 5.
The location of the warmest bedroom in the buildings (red asterisk).
3.2.1. Comparison of Overheating Risk under the Current and Future Average Climate
The annual hourly indoor air temperature profile in the warmest bedroom of the old and new building in the base cases with and without cooling under the current (TRY2020) and future (TRY 2050) average climate is shown in Figure 6.
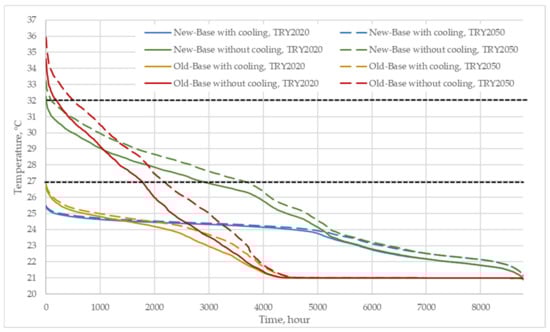
Figure 6.
The annual hourly indoor air temperature profile of the warmest bedroom, base cases, new and old building, current and future climate. (The requirements of 27 °C and 32 °C are shown as black dashed lines.).
Generally, the maximum indoor air temperature in the old building is higher than in the new building. The reason is the window g-value that reduces peak solar power in the room space and cuts the maximum cooling load. In the old building without a cooling system, the maximum temperature exceeds 34 °C and 36 °C in the current and future climate, respectively. In the new building, the corresponding maxima are 32 °C and 34 °C. However, according to the duration curve, indoor air temperature in the new building is higher than 21 °C most of the time. The new building is warmer than the old one in the majority time of the year, both in the current and future climates. This is due to the higher thermal insulation level of the new building. The usage of a split cooling unit (with 23 °C setpoints and 45 W/m2 (dimensioning power) installed in the living room reduces the maximum indoor air temperature of the warmest bedroom to around 25 °C, in both building types under the current and future climate.
The degree hours above 27 °C and 32 °C in the warmest bedroom of each building type without cooling in the current and future climate are shown in Table 8. As a consequence of climate warming, degree hours above 27 °C will increase by 56% and 57% in the old and new buildings, respectively. Since the maximum temperature in the old building is higher than in the new building, the number of degree hours above 32 °C is significantly larger in both the current and future climate. In the new building, it increases by 38 Kh (4244%). In the old building, it goes up from 142 Kh to 595 Kh (318%) under the changing climate.
Table 8.
The annual degree hours above 27 °C and 32 °C, base cases without cooling in the warmest bedroom, current and future climate.
3.2.2. Effects of Different Measures to Reduce Overheating in Current and Future Climate
The degree hours above 27 °C and 32 °C in the cases with different passive measures under the current climate in the old and the new apartment building without mechanical cooling are illustrated in Figure 7. In the old building north orientation, openable windows, and new basic well-insulated windows are the measures that reduce the degree hours above 32 °C to zero and the degree hours above 27 °C from 4684 Kh to 1501 Kh, 194 Kh, and 1875 Kh, respectively. Although the openable window is effective, it is not an adequate solution alone. South orientation, removing the blinds, and absence of the shading building on the west and south increase the degree hours above 27 °C and 32 °C from 4684 Kh to about 4700 Kh, 5181 Kh, and 5809 Kh, respectively. These three measures cause a noticeable increase in the degree hours above 27 °C and 32 °C in the new building as well. However, the degree hours above 32 °C in the new building is significantly lower compared to the old building.
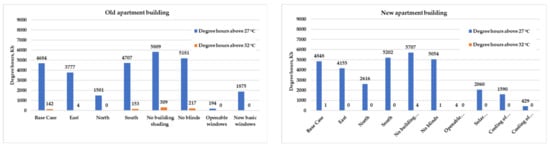
Figure 7.
The annual degree hours above 27 °C and 32 °C in different cases of the old and new building with TRY2020 current climate.
The most effective measures in the new building are openable windows, cooling of ventilation with ventilation boost, and cooling of ventilation with 4 Kh, 429 Kh, 1590 Kh above 27 °C. Openable windows are assumed to work according to the behavior of the occupants when the outdoor air temperature is between 12 °C and 22 °C and the indoor temperature exceeds 23 °C. Based on the simulation results of the new building, these conditions are common in the new building, thus opening the windows can reduce the overheating risk substantially.
Figure 8 shows the degree hours above 27 °C and 32 °C in the worst cases (south orientation and no shading buildings) and best ones (openable windows in the old building; openable windows, and cooling of ventilation and ventilation boost in the new building) under the future climate (TRY2050). The degree hours above 27 °C and 32 °C increase significantly in both building types in the future climate. Openable windows which are effective in the current climate cannot prevent the temperature from rising above 32 °C in the old building. However, openable windows and cooling of ventilation with ventilation boost can decrease degree hours above 32 °C to zero in the new building.
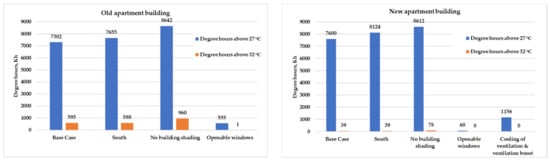
Figure 8.
The annual degree hours above 27 °C and 32 °C in different cases of the old and new building with TRY2050 future climate.
It is important to compare the effects of the usage of ventilation cooling combined with ventilation boost (+30%) and the split cooling unit on overheating risk and energy consumption of the old and new building. In the case with cooling ventilation, the cooled supply air comes directly to the bedroom but with the split cooling unit, it is installed in the living room. Figure 9 shows the annual hourly indoor temperature profile of the cases with the split cooling unit and the cases with ventilation cooling and ventilation boost in the new building under the current and future climate. In comparison to the base cases, the usage of the cooling of ventilation and ventilation boost reduces the maximum indoor air temperature to below 30 °C and 29 °C in the current and future climate, respectively. The split cooling in the living room installed decreases the maximum indoor air temperature of the warmest bedroom to around 25.5 °C in both current and future conditions. The simulations indicate that the rough rule-of-thumb design of cooling power of split units works well in both current and future climate.
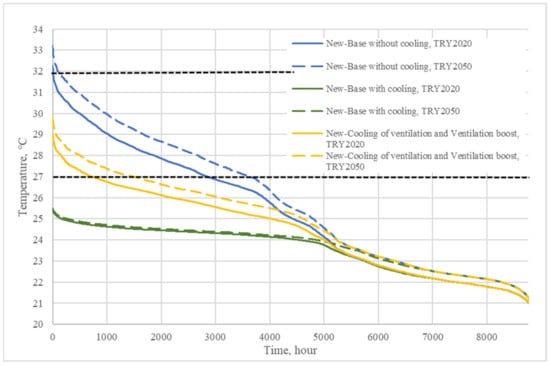
Figure 9.
The annual hourly indoor air temperature profile of the warmest bedroom, base cases, new and old building, current and future climate. (The temperature levels of 27 °C and 32 °C are shown as black dashed lines.
Table 9 shows the degree hours above 27 °C and 32 °C in the warmest bedroom of the new building for the cases with the split cooling unit installed in the living room and the cases with the ventilation cooling and ventilation boost in the new building under the current and future climate. The ventilation cooling and ventilation boost can reduce the degree hours above 32 °C to zero in both current and future climates. However, the degree hours above 27 °C is significantly high in both current and future climate.
Table 9.
The annual degree hours above 27 °C and 32 °C, Comparison of the cases with different cooling systems under the current and future climate.
On the other hand, the split cooling unit in the living room can reduce the degree hours of the warmest bedroom above 27 °C and 32 °C to zero in both climate conditions. According to Table 5 and Table 6, electricity consumption is slightly lower when using the split cooling unit than the cooling of ventilation with ventilation boost.
3.2.3. Comparison of Overheating Risk under Extreme Weather Conditions
For the severity of the overheating risk, the occurrence of high indoor air temperature during the heatwaves is crucially important for health. Figure 10 shows the April to September hourly indoor air temperature profiles in the old and new buildings under the heatwave summers of 2018 and 2050. As can been seen, the maximum indoor air temperature without the cooling system reaches 38 °C and 35 °C in the old and new buildings in 2018, respectively. In the heatwave summer of 2050, the absolute maxima are just under 40 °C and 36 °C.
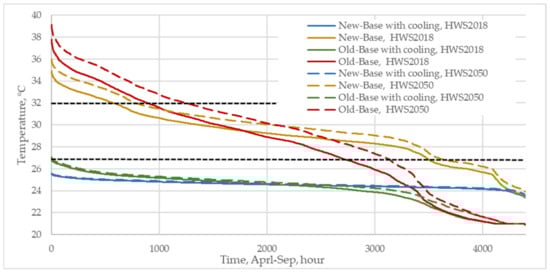
Figure 10.
The April to September hourly indoor air temperature profile of the warmest bedroom, base cases, new and old building, HWS2018 and HWS2050. (The temperature levels of 27 °C and 32 °C are shown by black dashed lines).
Table 10 reports the degree hours above 27 °C and 32 °C under the two heatwave summers. The usage of the split cooling unit in the living room decreases the degree hours above 27 °C and 32 °C in the warmest bedroom to zero in both hot summers. Otherwise, without the cooling system, the degree hours above 27 °C and 32 °C are significantly higher than in the average current and future climate. Although the indoor temperature conditions during the heatwaves in the current and projected future climate deviate considerably from the requirements, by using a split cooling unit in the living room with the setpoint of 23 °C, thermal comfort can be provided in all the spaces where the maximum air temperature is around 27 °C and 25 °C in the old and new buildings, respectively, in both current and future climates.
Table 10.
The April to September degree hours above 27 °C and 32 °C, under HWS2018 HWS2050.
4. Discussion
Several factors should be considered when interpreting the quantitative results. One of them is that there is uncertainty in the scenarios for climate change, and only one of the available alternative RCP greenhouse gas emission scenarios is used in this study. However, the impact of the choice of RCP4.5 on the results is relatively small. Moreover, there are other sources of uncertainty in TRY2050, arising from internal climate variability and climate modeling. In our study, the climate change scenarios for the future are derived from a large sample of climate models [35] which increases confidence in the scenarios in comparison to using just a single model. Furthermore, technical development, improvements in building practices, and socio-economic changes are hard to be considered for the future. Another factor in the building simulation model is occupancy profiles which affect the accuracy of the results. In this study, the presence of occupants has been assumed in a way that is as close as possible to the modern lifestyle of families. Using the fixed and continuous heat gains may cause different results. Regarding the overheating risk, Finnish regulations for the temperature limits are used in this paper, and in other Nordic countries, the temperature limits may differ. For example, in Denmark, the degree hours above 26 °C are recommended to be less than 100 Kh [48]. These limitations must be taken into account when the results are interpreted internationally.
Despite these limitations, the severity of the effects of climate change on the health and thermal comfort of residential buildings occupants are not questionable, especially in the Nordic countries where most of the residential buildings are not typically equipped with mechanical cooling systems. According to the present simulations, the degree hours above 27 °C will increase in the future climate by more than 50% in both the old and new buildings. During the current and future heatwaves, the degree hours above 27 °C increase up to 10,000 Kh and 14,000 Kh, respectively, in both old and new buildings. In almost all the cases without mechanical cooling in the new building under the current and future climate, the degree hours above 27 °C are significantly higher than the required number of 150 Kh in the Finnish building code [27]. This shows that except for the openable windows, other building measures are not able to guarantee to fulfill the building code requirement, and only with the usage of the split cooling unit, the new building may fulfill the 150 Kh requirement.
Although the national requirements do not apply to existing buildings, exemplified here by the old building, results for it are worth to be considered. The degree hours above 27 °C in the cases without mechanical cooling in the old building are significantly higher than 150 Kh in the current and future climate. Moreover, none of the building measures introduced a guarantee that the old building can fulfill the requirements. Thus, this indicates a high risk of overheating in the old building. In the future climate and during extreme weather conditions, the situation will be even worse in both old and new buildings. Thus, it seems to be important to revise the regulations of building stock renovation and design practice considering climate change and its effects on the health and comfort of occupants. Moreover, providing common requirements for residential buildings in Nordic countries or the whole of Europe would be worth considering while there are globally common standards and design practices for commercial buildings [49,50].
In most cases, the maximum indoor temperatures exceed 32 °C without mechanical cooling. The threshold value of 32 °C is the upper limit for the health of occupants in all the living spaces for both existing and new buildings in Finland [28]. For elderly people who are cared for in the residential living spaces, this maximum value is reduced to 30 °C [28]. The new building has the lowest degree hours above 32 °C with 1 Kh in the current climate and 39 Kh in the future climate. These degree hours will reach more than 1000 Kh in both building types during heatwave summers of 2018 and 2050. This overheating may cause serious health problems for the occupants. A study in Finland showed that the heatwaves in recent decades have caused about 200 to 400 excess deaths in Finland [6]. Thus, Solar protection windows, openable windows, split cooling units, and ventilation cooling and ventilation boost can effectively reduce the degree hours above 32 °C in both building types in the current and future climate. Hence, to avoid the health risks of overheating, the building stock needs to change in design and renovation phases to cope with the future extreme and average climate conditions.
Orientation, blinds, and site shadings are not significantly effective on overheating risk and energy demand. Other passive strategies like solar protection windows improve indoor temperature conditions but cannot alone fulfill the temperature requirements. Openable windows are the most effective studied passive strategy in the new building, being able to reduce the degree hours above 27 °C to the acceptable range in the current and future climate. However, they are not effective enough for the fulfillment of the temperature requirements in the old buildings.
It is also important to note that based on the regulations, openable windows are not allowed to be used for the fulfillment of indoor temperature requirements in the design phase of new buildings [29]. Although opening the windows can bring fresh air inside and reduce the overheating risk, it should be considered that by opening the window, indoor air quality and indoor acoustic conditions will be affected by the outdoor conditions. Moreover, there are security issues with opening the windows. Overall, building measures may improve the indoor temperature conditions under changing climate but they seem not to be sufficiently effective.
The maximum indoor air temperatures are significantly higher during the heatwave summer of 2018 than during the average present and future climates (TRY2020 and TRY2050). The increase in the indoor air temperature is even a more serious issue in the heatwave summer of 2050. The results show the high risk of overheating in the residential buildings in the current and future climate of Finland. To decrease the indoor temperature during the heatwaves, mechanical cooling systems should be implemented. Based on our simulations, the space cooling electricity consumption increased during the heatwave summer 2018 in a way that it was higher than the amount in the current and future average climate in both building types, and in the heatwave summer of 2050, the increase would be even higher.
Mechanical cooling systems, like split cooling units or cooling of ventilation supply air, are required to reduce the indoor air temperature effectively in the future climate. According to the present results, the energy consumption of split cooling units is below 3 kWh/m2 in the current climate and will reach 4 kWh/m2 in future climate. Typically, in Finland, the cost of a split unit is about 2000 euro for the equipment and installation. However, this cost level is reasonable for reaching the indoor temperature target values. Since the benefits of acceptable indoor temperature on the well-being and comfort of the occupants are not questionable.
Moreover, the energy needed for cooling can be partly provided by free cooling from outdoor air or ground-coupled systems. However, the efficiency loss of these free sources due to the high outdoor air temperature during the heatwaves should be considered. From the dimensioning point of view, the used dimensioning cooling power of space cooling (45 W/m2) seems to be enough in average and extreme climate conditions, and there is no need to increase the peak power of space cooling due to climate change.
In this study, average ground temperature and therefore domestic cold water temperature is assumed to be the same in the future regardless of global warming. The reason is to ease the analysis of the parameters affected more strongly by climate change. The system losses, efficiencies, and COP of the cooling systems are assumed to be the same now and in the future. This is done to facilitate the comparison and to show clearly the effect of climate change. The performance of HVAC systems may improve in the future, as according to studies performed during recent decades, COP of heat pumps increased by 2% annually [51]. Moreover, in the 2000s, COP of commercial air/water heat pumps increased almost linearly from 3.5 to 5.1 [52]. Any improvement in the energy efficiency of heating and cooling systems affects the purchased energy (district heating and electricity) consumption, and the amount of increase in cooling electricity and decrease in district heating may vary in the future. Thus, even if the cooling demand increase, the technical development of systems may partly compensate the increase.
Concerning the increase in the cooling electricity consumption in the future climate, a change from the common practice of split cooling units in apartment buildings to district cooling may be considered. In that case, fan coil units or radiant cooling (ceiling or floor) may be in use. Fan coil units are not limited by power and capacity. For the usage of radiant cooling systems, these limitations must be noted. However, different cooling systems should be considered to carry the increase of cooling demand in the future.
5. Conclusions
The impacts of climate change on overheating risk and energy consumption were assessed for old and new apartment buildings in Finland. Moreover, the effects of heatwaves on space cooling demand and overheating are analyzed. Test Reference Year (TRY) hourly weather data of 2020 and 2050 under the RCP4.5 scenario, weather data of heatwave summer 2018, and synthetic future weather data of heatwave summer 2050 under the RCP4.5 are used as the input of IDA ICE simulations.
The impacts of the changing climate on the indoor temperature conditions were assessed using different passive measures for reducing the risk of overheating, including orientations, blinds, site shading, window properties, openable windows in the old and new buildings. Furthermore, the effects of cooling coil in the air handling unit together with ventilation boost on overheating risk were analyzed in the new building.
Although the space cooling electricity consumption in the old building is higher than the new building, the annual electricity consumption is higher in the new building due to the HVAC aux electricity consumption.
According to the present simulations with the assumption that the efficiency of the systems is the same now and, in the future, the annual district heating demand will decrease by 8–12%, while the annual electricity demand will increase by 2–4%. However, the absolute value of the space cooling electricity is small compared to the annual space heating demand. Consequently, the amount of decrease in district heating consumption is much higher than the increase in electricity consumption in the future. In the heatwave summers, the space cooling electricity increases significantly.
Regarding the indoor temperature conditions even in the current climate, in the old building, the amount of degree hours above 32 °C is noticeable, and the risk of overheating is higher than in the new building. In the future climate, the maximum indoor temperature exceeds the health risk threshold value of 32 °C in both new and old buildings. During the heatwave summers of 2018 and 2050, the amount of degree hours above 27 °C is about 10,000 Kh and 14,000 Kh, and the degree hours above 32 °C about 1000 Kh and 3000 Kh, respectively. Thus, not only the overheating risk in both buildings is high in future climate and during heatwave summers, but also the indoor conditions would be harmful to the health of occupants and it would cause an increase in mortality rate.
Orientation, blinds, and site shadings are not significantly effective in alleviating the overheating risk. Solar protection windows improve indoor temperature conditions significantly. Although openable windows are the most effective studied passive strategy which can reduce the degree hours above 27 °C to the acceptable range and decrease the degree hours above 32 °C to zero in the new building, they cannot completely fulfill the regulation temperature requirements in the old building. Despite the effectiveness of the openable windows on reducing the overheating risk, issues like outdoor pollutants spreading and noise control should be considered when the windows are open.
Cooling coils of the air handling units together with ventilation boost can reduce the indoor air temperature effectively in current and future climate, and the cooling power is not high enough because the specified supply airflow rate is small. However, the split cooling unit installed only in the living room can prevent overheating in the current and future climate and also during the heatwaves in all the spaces by using a small amount of extra energy.
Author Contributions
Conceptualization: A.V.F., R.K. and J.J. data curation: A.V.F. formal analysis: A.V.F. methodology: A.V.F. investigation: A.V.F. resources—provision of study materials: K.J., K.R. and N.K. supervision: R.K. writing—original draft: A.V.F., N.K. writing—review and editing: R.K., J.J., K.J. and K.R. All authors have read and agreed to the published version of the manuscript.
Funding
This study is part of the following projects: HEATCLIM (Heat and health in the changing climate, Grant Numbers. 329306, 329307) funded by the Academy of Finland within the CLIHE (Climate change and health) program, FINEST Twins funded by the European Union (Horizon 2020 program, Grant No. 856602) and the Estonian government, SUREFIT (Sustainable solutions for affordable retrofit of domestic buildings) funded by European Union (Horizon 2020 program, Grant No. 894511); and ACCC (Atmosphere and Climate Competence Center) funded by the Academy of Finland (Flagship Grant No. 337552).
Institutional Review Board Statement
Not applicable.
Informed Consent Statement
Not applicable.
Acknowledgments
Authors would like to thank Jouko Niemelä and Mika Vuolle from EQUA Simulation Finland Ltd. for defining an apartment building model in Cost Optimal project. The CMIP5 global climate model data downloaded from the Earth System Grid Federation data archive (https://esgf-node.llnl.gov/search/cmip5/ accessed date 26 April 2021) were used to construct the future climate projections applied in this paper. Herman Böök, Anders Lindfors, and Pentti Pirinen are acknowledged for provision and post-processing of weather observational data archived by the Finnish Meteorological Institute.
Conflicts of Interest
The authors declare no conflict of interest.
References
- IPCC. 2018: Summary for Policymakers. In Global Warming of 1.5°C. An IPCC Special Report on the Impacts of Global Warming of 1.5°C Above Pre-Industrial Levels and Related Global Greenhouse Gas Emission Pathways, in the Context of Strengthening the Global Response to the Threat of Climate Change, Sustainable Development, and Efforts to Eradicate Poverty; Masson-Delmotte, V.P., Zhai, H.-O., Pörtner, D., Roberts, J., Skea, P.R., Shukla, A., Pirani, W., Moufouma-Okia, C., Péan, R., Pidcock, S., et al., Eds.; World Meteorological Organization: Geneva, Switzerland, 2018; pp. 32. [Google Scholar]
- Brown, S.J. Future changes in heatwave severity, duration and frequency due to climate change for the most populous cities. Weather Clim. Extrem. 2020, 30, 100278. [Google Scholar] [CrossRef]
- Stocker, T.F.D.; Qin, G.-K.; Plattner, M.; Tignor, S.K.; Allen, J.; Boschung, A.; Nauels, Y.; Xia, V.; Bex, P.M.M. Climate Change 2013: The Physical Science Basis, Contribution of Working Group I. Fifth Assess. Rep. Intergov. Panel Clim. Chang. 2013, 1535. Available online: www.cambridge.org/9781139899642 (accessed on 16 February 2021).
- Zinzi, M.; Agnoli, S.; Burattini, C.; Mattoni, B. On the thermal response of buildings under the synergic effect of heat waves and urban heat island. Sol. Energy 2020, 211, 1270–1282. [Google Scholar] [CrossRef]
- He, C.; Ma, L.; Zhou, L.; Kan, H.D.; Zhang, Y.; Ma, W.C.; Chen, B. Exploring the mechanisms of heat wave vulnerability at the urban scale based on the application of big data and artificial societies. Environ. Int. 2019, 127, 573–583. [Google Scholar] [CrossRef]
- Ruuhela, R.; Votsis, A.; Kukkonen, J.; Jylhä, K.; Kankaanpää, S.; Perrels, A. Temperature-related mortality in helsinki compared to its surrounding region over two decades, with special emphasis on intensive heatwaves. Atmosphere 2021, 12, 46. [Google Scholar] [CrossRef]
- European Commission Eurostat. Using Official Statistics to Calculate Greenhouse Gas Emissions: A Statistical Guide; European Commission Eurostat: Luxembourg, 2010; 25p. [Google Scholar]
- Jylhä, K.; Tuomenvirta, H.; Ruosteenoja, K.; Niemi-Hugaerts, H.; Keisu, K.; Karhu, J.A. Observed and projected future shifts of climatic zones in Europe and their use to visualize climate change information. Weather. Clim. Soc. 2010, 2, 148–167. [Google Scholar] [CrossRef]
- Beck, H.E.; Zimmermann, N.E.; McVicar, T.R.; Vergopolan, N.; Berg, A.; Wood, E.F. Present and future köppen-geiger climate classification maps at 1-km resolution. Sci. Data 2018, 5, 1–12. [Google Scholar] [CrossRef] [PubMed]
- Invidiata, A.; Ghisi, E. Impact of climate change on heating and cooling energy demand in houses in Brazil. Energy Build. 2016, 130, 20–32. [Google Scholar] [CrossRef]
- Huang, K.T.; Hwang, R.L. Future trends of residential building cooling energy and passive adaptation measures to counteract climate change: The case of Taiwan. Appl. Energy 2016, 184, 1230–1240. [Google Scholar] [CrossRef]
- Liu, S.; Kwok, Y.T.; Lau, K.K.L.; Ouyang, W.; Ng, E. Effectiveness of passive design strategies in responding to future climate change for residential buildings in hot and humid Hong Kong. Energy Build. 2020, 228, 110469. [Google Scholar] [CrossRef]
- Zune, M.; Rodrigues, L.; Gillott, M. The vulnerability of homes to overheating in Myanmar today and in the future: A heat index analysis of measured and simulated data. Energy Build. 2020, 223, 110201. [Google Scholar] [CrossRef]
- Radhi, H. Evaluating the potential impact of global warming on the UAE residential buildings—A contribution to reduce the CO2 emissions. Build. Environ. 2009, 44, 2451–2462. [Google Scholar] [CrossRef]
- Karimpour, M.; Belusko, M.; Xing, K.; Boland, J.; Bruno, F. Impact of climate change on the design of energy efficient residential building envelopes. Energy Build. 2015, 87, 142–154. [Google Scholar] [CrossRef]
- Filippín, C.; Ricard, F.; Flores Larsen, S.; Santamouris, M. Retrospective analysis of the energy consumption of single-family dwellings in central Argentina. Retrofitting and adaptation to the climate change. Renew. Energy 2017, 101, 1226–1241. [Google Scholar] [CrossRef]
- Salthammer, T.; Schieweck, A.; Gu, J.; Ameri, S.; Uhde, E. Future trends in ambient air pollution and climate in Germany—Implications for the indoor environment. Build. Environ. 2018, 143, 661–670. [Google Scholar] [CrossRef]
- Elsharkawy, H.; Zahiri, S. The significance of occupancy profiles in determining post retrofit indoor thermal comfort, overheating risk and building energy performance. Build. Environ. 2020, 172, 106676. [Google Scholar] [CrossRef]
- de Rubeis, T.; Falasca, S.; Curci, G.; Paoletti, D.; Ambrosini, D. Sensitivity of heating performance of an energy self-sufficient building to climate zone, climate change and HVAC system solutions. Sustain. Cities Soc. 2020, 61, 102300. [Google Scholar] [CrossRef]
- Barbosa, R.; Vicente, R.; Santos, R. Climate change and thermal comfort in Southern Europe housing: A case study from Lisbon. Build. Environ. 2015, 92, 440–451. [Google Scholar] [CrossRef]
- Silva, S.; Soares, I.; Pinho, C. Climate change impacts on electricity demand: The case of a Southern European country. Util. Policy 2020, 67, 101115. [Google Scholar] [CrossRef]
- Zhou, X.; Carmeliet, J.; Sulzer, M.; Derome, D. Energy-efficient mitigation measures for improving indoor thermal comfort during heat waves. Appl. Energy 2020, 278, 115620. [Google Scholar] [CrossRef]
- Laouadi, A.; Bartko, M.; Lacasse, M.A. A new methodology of evaluation of overheating in buildings. Energy Build. 2020, 226, 110360. [Google Scholar] [CrossRef]
- Maivel, M.; Kurnitski, J.; Kalamees, T. Field survey of overheating problems in Estonian apartment buildings. Archit. Sci. Rev. 2015, 58, 1–10. [Google Scholar] [CrossRef]
- Dodoo, A.; Gustavsson, L. Energy use and overheating risk of Swedish multi-storey residential buildings under different climate scenarios. Energy 2016, 97, 534–548. [Google Scholar] [CrossRef]
- Tettey, U.Y.A.; Dodoo, A.; Gustavsson, L. Energy use implications of different design strategies for multi-storey residential buildings under future climates. Energy 2017, 138, 846–860. [Google Scholar] [CrossRef]
- Jylhä, K.; Jokisalo, J.; Ruosteenoja, K.; Pilli-Sihvola, K.; Kalamees, T.; Seitola, T.; Mäkelä, H.M.; Hyvönen, R.; Laapas, M.; Drebs, A. Energy demand for the heating and cooling of residential houses in Finland in a changing climate. Energy Build. 2015, 99, 104–116. [Google Scholar] [CrossRef]
- Ministry of Social Affairs and Health Decree (525/2015) on Housing Health. Sosiaali-ja Terveysministeriön Asetus Asunnon ja Muun Oleskelutilan Terveydellisistä Olosuhteista sekä ulkopuolisten Asiantuntijoiden Pätevyysvaatimuksista; Ministry of Social Affairs and Health: Helsinki, Finland, 2015; pp. 2, 6.
- Ministry of the Environment. Ministry of the Environment. Ministry of the Environment Decree (1009/2017) on the indoor climate and ventilation of the new building. In Ympäristöministeriön Asetus Uuden Rakennuksen Sisäilmastosta ja Ilmanvaihdosta; Ministry of the Environment: Helsinki, Finland, 2017; pp. 3–4. [Google Scholar]
- Ministry of Environment Decree (1010/2017) on the Energy Performance of the New Building; Ministry of the Environment: Helsinki, Finland, 2018.
- Jylhä, K.; Kalamees, T.; Tietäväinen, H.; Ruosteenoja, K.; Jokisalo, J.; Hyvönen, R.; Ilomets, S.; Saku, S.; Hutila, A.; 2011: Rakennusten energialaskennan testivuosi 2012 ja arviot ilmastonmuutoksen vaikutuksista (Test Reference Year 2012 for Building Energy Demand and Impacts of Climate Change). Finnish Meteorological Institute, Reports, 2011:6. 2012. Available online: http://hdl.handle.net/10138/33069 (accessed on 16 February 2021).
- Kalamees, T.; Jylhä, K.; Tietäväinen, H.; Jokisalo, J.; Ilomets, S.; Hyvönen, R.; Saku, S. Development of weighting factors for climate variables for selecting the energy reference year according to the en ISO 15927-4 standard. Energy Build. 2012, 47, 53–60. [Google Scholar] [CrossRef]
- EN ISO 15927-4. Hygrothermal Performance of Buildings—Calculation and Presentation of Climatic Data—Part 4: Data for Assessing the Annual Energy for Heating and Cooling; European Committee for Standardization: Brussels, Belgium, 2005. [Google Scholar]
- Jylhä, K.; Ruosteenoja, K.; Böök, H.; Lindfors, A.; Pirinen, P.; Laapas, M.; Mäkelä, A. Weather data for building-physical studies and the building energy reference year 2020 in a changing climate. Finn. Meteorol. Inst. 2020, 20, 81, (In Finnish with abstract in English). [Google Scholar]
- Ruosteenoja, K.; Jylhä, K.; Kämäräinen, M. Climate projections for Finland under the RCP forcing scenarios. Geophysica 2016, 51, 17–50. [Google Scholar]
- Saranko, O.; Fortelius, C.; Jylhä, K.; Ruosteenoja, K.; Brattich, E.; Di Sabatino, S.; Nurmi, V. Impacts of town characteristics on the changing urban climate in Vantaa. Sci. Total Environ. 2020, 727, 138471. [Google Scholar] [CrossRef]
- Van Vuuren, D.P.; Edmonds, J.; Kainuma, M.; Riahi, K.; Thomson, A.; Hibbard, K.; Hurtt, G.C.; Kram, T.; Krey, V.; Lamarque, J.F.; et al. The representative concentration pathways: An overview. Clim. Chang. 2011, 109, 5–31. [Google Scholar] [CrossRef]
- Finnish Meteorological Institute (FMI). Heat Statistics (in Finnish). Available online: https://www.ilmatieteenlaitos.fi/helletilastot (accessed on 22 April 2021).
- Sillmann, J.; Roeckner, E. Indices for extreme events in projections of anthropogenic climate change. Clim. Chang. 2008, 86, 83–104. [Google Scholar] [CrossRef]
- Finnish Meteorological Institute (FMI). Warm Temperature Records Broken in July. FMI Press Release Archive. 2018. Available online: https://en.ilmatieteenlaitos.fi/press-release/610918514 (accessed on 17 February 2021).
- Sinclair, V.A.; Mikkola, J.; Rantanen, M.; Räisänen, J. The summer 2018 heatwave in Finland. Weather 2019, 74, 403–409. [Google Scholar] [CrossRef]
- World Meteorological Organization (WMO). July Sees Extreme Weather with High Impacts. 2018. Available online: https://public.wmo.int/en/media/news/july-sees-extreme-weather-high-impacts (accessed on 17 February 2021).
- Finnish Institute for Health and Welfare (THL). Last summer’s heat wave increased the mortality of older people – prepare for hot weather in time. 2019. Available online: https://thl.fi/en/web/thlfi-en/-/last-summer-s-heat-wave-increased-the-mortality-of-older-people-prepare-for-hot-weather-in-time (accessed on 16 February 2021).
- Sahlin, P. Modeling and Simulation Methods for Modular Continuous Systems in Buildings; Royal Institute of Technology: Stockholm, Sweden, 1996. [Google Scholar]
- Moinard, S.; Guyon, G. Empirical Validation of EDF ETNA and GENEC Test-Cell Models. Subtask A 1999, 3, 912. [Google Scholar]
- Travesi, J.; Maxwell, G.; Klaassen, C.; Holtz, M. Empirical Validation of Iowa Energy Resource Station Building Energy Analysis Simulation Models. 2001. Available online: http://task8.iea-shc.org/data/sites/1/publications/Iowa_Energy_Report.pdf (accessed on 16 February 2021).
- Loutzenhiser, P.; Manz, H. IEA Task 34—Testing of Building Energy Simulation Tools Project; International energy agency: Paris, France, 2014. [Google Scholar]
- Report, T.; Atanasiu, B.; Commission, E. Indoor Air Quality, Thermal Comfort and Daylight. Analysis of Residential Buildings Regulations in Eight EU Member States; The Buildings Performance Institute Europe: Brussels, Belgium, 2015; ISBN 9789491143106. [Google Scholar]
- American Society of Heating, Refrigerating, and Air-Conditioning Engineers. ASHRAE, ASHRAE/ANSI Standard 55-2010.Thermal Environmental Conditions for Human Occupancy 2010; American Society of Heating, Refrigerating, and Air-Conditioning Engineers: Atlanta, GA, USA, 2010. [Google Scholar]
- Finnish Standards Association. Indoor Environmental Input Parameters for Design and Assessment of Energy Performance of buildings Addressing Indoor Air Quality, Thermal Environment, Lighting and Acoustics, SFS-EN 15251. 7AD; Finnish Standards Association: Helsinki, Finland, 2007. [Google Scholar]
- Nowacki, J.-E. Heat Pumps in Energy Statistics–Suggestions; Swedish Energy Agency: Lidingö, Sweden, 2007. [Google Scholar]
- Tono, M. Country report Japan. In Proceedings of the 9th International IEA Heat Pump Conference, Zürich, Switzerland, 20–22 May 2008. [Google Scholar]


Publisher’s Note: MDPI stays neutral with regard to jurisdictional claims in published maps and institutional affiliations. |
© 2021 by the authors. Licensee MDPI, Basel, Switzerland. This article is an open access article distributed under the terms and conditions of the Creative Commons Attribution (CC BY) license (https://creativecommons.org/licenses/by/4.0/).