Article

Influence of Thermomechanical Treatments on Corrosion of Carbon Steel in Synthetic Geopolymer Fly Ash Pore Solution

National Center for Education and Research on Corrosion and Materials Performance, NCERCAMP-UA, Department Chemical, Biomolecular, and Corrosion Engineering, The University of Akron, 302 E Buchtel Ave, Akron, OH 44325-3906, USA
*
Author to whom correspondence should be addressed.
Appl. Sci. 2021, 11(9), 4054; https://doi.org/10.3390/app11094054
Submission received: 6 April 2021 / Revised: 22 April 2021 / Accepted: 27 April 2021 / Published: 29 April 2021
(This article belongs to the Special Issue Thermomechanical Properties of Steel)

Abstract

:
In this study the effect of thermomechanical treatments in chloride induced pitting corrosion is presented for carbon steel rebars exposed to synthetic fly ash (FA) pore solution. Due to the likely phase transformations that steel reinforcements in concrete experience during the event of a fire, the understanding of the corrosion behavior of such phases is key in predicting the stability of the structure. The motivation for this study arrives from the scarce literature regarding the corrosion behavior of thermomechanically treated steel reinforcements in FA environments and the need for further investigation to understand its mechanism. In order to better understand the effects on the corrosion behavior electrochemical measurements including cyclic potentiodynamic polarization curves (CPP) and electrochemical impedance spectroscopy (EIS) were used. It was found that quenched specimens showed enhanced corrosion kinetics as their icorr values were higher, being of 3.18 × 10⁻⁵ and 2.20 × 10⁻⁵ A/cm2 for water and oil quenched compared to 2.13 × 10⁻⁶ A/cm2 for the as-received. Furthermore, the effective capacitance of the double layer (Ceff,dl) showed the lower stability of the passive film for the quenched specimens, with values of 1.11 × 10⁻³ µF/cm2 for the as-receive sample that decreased to 8.12 × 10⁻⁴ µF/cm2 for the water quenched sample. The anodic charge transfer coefficient in the synthetic FA alkaline pore solution changes from 0.282 to 0.088, for the as-received and water quenched rebars specimens, respectively. These results indicate a lower energy barrier for the anodic dissolution reaction of quenched specimens, indicating that martensite and bainite microstructures promote corrosion process. Enhanced corrosion was found on quenched samples presenting martensite and bainite microstructure as showed by the increased pith depth, with values of 5 μm compared to 1 μm observed in the as-received samples.

1. Introduction

Due to the high greenhouse gas emissions of the construction industry, which account for 10% of the total CO2 emissions, new green cement alternatives are necessary [1,2]. Geopolymer binders offer a substantial reduction of greenhouse gas emissions up to 80% compared to traditional binders [3,4,5]. Fly ash (FA) presents a favorable future as cementitious material due to its nature as a byproduct from the coal-based energy generation industry, which reduces both emissions and costs (up to 39% lower costs) [6,7,8]. FA geopolymer concrete also presents similar mechanical properties compared to ordinary Portland cement (OPC), displaying a compressive strength of 89 MPa compared to 65 MPa for OPC [9,10,11]. It has been found that an increased mechanical behavior of FA as well as a decreased wettability can also be achieved by graphene nanoplatelets addition, due to the specific surface area and aspect ratio, thus providing a uniform stress distribution [12]. Novel ternary ecological concrete mixtures made out of sugar cane bagasse ash and silica fume partially replacing OPC have proven to impart corrosion protection, thus offering an effective alternative for building a more sustainable concrete industry [13]. These new binders present a different microstructure that influences porosity and tortuosity, and consequently the ingress and diffusion of corrosive species, in addition the precursor chemistry and the activation process also modify the nature of the interfaces as well as the alkaline reservoir, which regulate the corrosion behavior [14]. For that reason, further research is needed for disentangling the electrochemical mechanisms that govern corrosion of steel in eco-friendly cements and fly ash geopolymer concrete.
Reinforced concrete structures are required to meet the mechanical requirements of modern buildings. Therefore, the integrity of the structure would not only be limited by the stability of the concrete matrix, but also by the durability of the metallic reinforcement. Corrosion of steel embedded in concrete is caused by two processes: (1) carbonation occurs when the atmospheric CO2 reacts with the concrete matrix forming carbonates and reducing the pH of the concrete, leading to uniform corrosion, and (2) chloride-induced corrosion that comprises the ingress of chloride ions, through the matrix promoting local acidification and causing pitting corrosion [15,16].
Electrochemical monitoring in simulated concrete pore solution provides a reliable procedure to perform accelerated corrosion tests [17]. Differences between batches of concrete can lead to different electrochemical responses and result in variations in corrosion behavior [18,19,20]. In addition, there have been few studies regarding corrosion of steel in FA synthetic pore solution [21,22,23]. Lloyd et al. showed that the little content of Ca in the pore solution of alkali activated materials such as FA or slags makes the buffering role of Ca(OH)2 present in OPC impossible. Therefore, the alkalinity of the pore solution will be directly influenced by the alkali content, which is crucial to protect the reinforcing steel [17,24]. Mundra et al. simulated the pore solution of low calcium geopolymers, such as FA, showing a higher chloride concentration required to promote pitting corrosion on carbon steel rebars with [Cl]/[OH] that ranged from 0.9 up to 2.4 [25]. This increased protection was due to the relationship found between [Cl]/[OH] which demonstrated that the onset of pitting corrosion required a higher ratio than OPC [25].
In the event of a fire, the increased temperatures can promote changes in the microstructure of the reinforcement material present in the structure. This transformation can lead to a different electrochemical behavior that might affect the structure stability if not properly considered [26,27,28]. For instance, the different phases in steel can promote micro-galvanic couples that will promote enhanced corrosion kinetics [29,30]. Some researchers have worked on studies of structural steels after simulated-fire exposure, however, further research is still needed [31]. The existing studies only observe the post-fire mechanical behavior, no prior exposure behavior nor corrosion behavior was reported [27,31]. Very limited studies were found regarding corrosion performance of heat treated carbon steel reinforcements [28]. Recent studies have revealed that pearlite was the most susceptible phase to corrosion initiation in chloride contaminated pore solution [32]. Different heat treatments were applied to carbon steel rebars exposed to concrete pore solution to study the chloride threshold. Furthermore, normalizing treatment showed superior passivation performance in non-chloride contaminated electrolytes due to further absorption of hydroxide ions [32]. The chloride threshold values obtained were 0.8, 1.3, and 1.5 M [Cl] for the normalized, as-received and cyclic-heat treated rebars, respectively [32].
In a different study, Bautista et al. examined the influence of the microstructure of thermomechanically processed rebars on the corrosion behavior in concrete pore solution. Results showed higher icorr values for the samples containing martensite with similar Ecorr values [33]. Thermomechanical treatments on different alloys exposed to 3.5% NaCl showed the effect of the heat treatment on corrosion behavior, showing lower corrosion rates after the treatment [34]. Corrosion studies in different electrolytes, such as the one performed by Hao et al., found that cementite promotes corrosion of steel in solution [35]. In a more recent study, Hao et al. found that the presence of martensite also promotes higher dissolution kinetics due to galvanic couples [36]. In a study performed by Abdo et al., a thermal treatment promoted the formation of a dual-phase steel and the corrosion behavior in concrete pore solution was studied [37]. Results showed an enhanced pitting potential as well as lower pit density for the thermal processed specimen, exhibiting a pitting potential >200 mVSCE compared to ~100 mVSCE for the conventional rebar [37]. This showed how the presence of ferrite and martensite enhances the corrosion resistance in alkaline media. Similarly, Trejo et al. found that thermomechanically treated samples containing martensite and ferrite showed no corrosion products after 32 weeks of exposure compared to the active corrosion observed on the as-received reinforcement [38]. However, another study showed how martensite promotes pitting corrosion [39].
Due to the lack of agreement on the corrosion behavior of the different phases, further research is necessary to understand the corrosion mechanisms of thermomechanically processed steel reinforcements in alkaline media. This study aims to evaluate the chloride induced corrosion behavior of thermomecanically treated rebars in fly ash geopolymer. In this regard, prior microstructural analysis was performed. Afterwards, electrochemical testing, including cyclic potentiodynamic polarization curves (CPP) and electrochemical impedance spectroscopy (EIS), was used to characterize the electrochemical response of the rebar exposed to synthetic FA electrolyte solution. Finally, surface analysis was performed to evidence the enhanced corrosion rates observed in martensitic carbon steel in synthetic FA pore solution containing 0.6 M NaCl.

2. Materials and Methods

2.1. Materials

Commercially available cold rolled grade 75 carbon steel (CS) rebars were used as a reinforcement material and its composition provided by the manufacturer can be found in Table 1. The CS rebar samples had a diameter of 12.7 mm. Prior to the thermomechanical treatments, the samples were degreased with ethanol, cleaned with 50% HNO3 solution for 20 s, rinsed with deionized water and air dried. Six heat treatments were performed to the rebars in order to obtain the different microstructure combinations that carbon steel reinforcements can develop during the event of a fire. Samples were recrystallized at 950 °C for 3 h and then normalizing, annealing, water and oil quenching thermal treatments were performed. For the quenched samples, one set of each was heated up to 500 °C for 3 h and annealed to release internal stresses from the quenching process. The whole process schematic can be seen in Figure 1a. An as-received specimen was also prepared. The results were split according to its fast and moderate cooling rate for clarity reasons.
The synthetic FA pore solution used in the study was taken from previous works that showed the higher electrochemical influence of NaOH and KOH [24]. Its composition was 0.612 M NaOH and 2.7 mM KOH. For both chemicals, high purity pellets from Sigma Aldrich were used to prepare the electrolyte. The chloride induced pitting influence was studied by adding high purity NaCl pellets from Sigma Aldrich up to a concentration of 0.6 M NaCl.

2.2. Methods

To reveal the microstructure of the rebar, samples were mounted in epoxy and ground up to 1200 grit using SiC paper, and finally mirror polished with 1 μm alumina suspension. The polished coupons were then exposed to an etchant solution consisting of 3% Nital (3% HNO3 in ethanol) until the microstructure was revealed. The microstructural analysis was performed using an optical microscope (OM) from Nikon Eclipse MA 100. In order to study the chloride induced pitting effect, optical images were taken at ×5 magnifications followed by analyzing the topography of the CS reinforcements with an Alicona Infinite Focus G5 Microscope (IFM) using a ×5 magnification lens.
The mounted specimens were then ground again up to 1200 grit using SiC paper and then exposed to the electrolyte. Electrochemical tests were carried out in a Gamry Instrument Reference 600 Potentiostat according to the ASTM G3−14 standard with a three-electrode cell setup [40]. CS rebar samples were used as the working electrode (WE) with an exposed area of 1.08 cm2, a graphite rod as the counter electrode (CE), a saturated calomel electrode (SCE) acting as a reference electrode (RE) and the synthetic FA pore solution at room temperature (RT, 25 °C) as the electrolyte as can be seen in Figure 1b. The electrochemical testing sequence consisted of an open circuit potential (OCP) that was monitored for 3600 s to ensure a steady-state corrosion potential (Ecorr) was reached. Afterward, EIS measurements were conducted at the Ecorr, in a frequency range between 10−2 and 105 Hz, a 10 mV rms excitation signal and a step rate of 10 points per decade. Lastly, CPP curves were performed in a potential range of +650 to −400 mVOCP with a scan rate of 1.667 mV/s. All experiments were performed in triplicate.

3. Results and Discussion

The microstructural analysis revealed that each thermomechanical treatment produced a different microstructure according to the cooling rate. Figure 2 shows the heat-treated samples that did not show martensite. The as-received sample shows the pearlitic microstructure with large cementite areas (see Figure 2a). The effect of the cold rolling process at the edge of the rebar can be observed, displaying more refined grains and less cementite (see Figure 2b). The annealed sample shows a considerably larger grain size in both the center and the edge (see Figure 2c,d). After the normalizing treatment, it can be seen that the microstructure in the center of the rebar is similar to the as-received sample, showing more uniform and refined ferrite grains (see Figure 2e). However, the edge of the rebar shows much smaller grains as well as Widmanstätten ferrite (see Figure 2f) [41].
For the fast cooling rate, water quenching developed a full martensitic microstructure as the most aggressive cooling rate (see Figure 3a,b). The oil quenched experienced a similar microstructure with some visible ferrite (see Figure 3c,d). After the quenching process, some samples underwent subcritical annealing at 500 °C. After the subcritical annealing, the water quenched sample displayed low bainite in both regions, evidenced by the feather-like bainite in Figure 3e,f [42]. After the subcritical annealing, the oil quenched sample showed a mixture of bainite and martensite in both regions of the rebar (see Figure 3g,h).
The OPC plots were monitored for 1 h as shown in Figure 4, it can be observed that the OCP stabilized within ±25 mV range after 3000 s, indicating that the samples reached steady state. The recorded OCP values are in good agreement with the Ecorr values obtained during the CPP test (see Figure 5).
The CPP curves for the as-received and moderate cooling rate samples immersed in synthetic FA pore solution containing 0.6 M NaCl can be seen in Figure 5a. A more active behavior is observed in the annealed sample as the curves shift towards higher current densities (i) as well as towards lower potentials. This can be explained by the larger grain size. A Flade potential (Ef) associated with the passive layer formation at high pH is observed for the as-received sample around −0.45 VSCE [43]. All samples display a negative hysteresis loop as well as no evident sign of pitting corrosion. This is denoted by the absence of a pitting potential, or a sudden increase in the current density value [16]. The as-received and normalized samples show a similar corrosion behavior, of which the most active is the as-received sample due to the cold rolling process. This process generated a smaller grain size as well as martensite near the corrugated area. A decrease in the Ecorr values from −0.500 to −0.561 and −0.423 VSCE was observed, as well as an increase in the corrosion current density (icorr) values from 2.13 × 10⁻⁶ to 1.84 × 10⁻⁶ and 2.09 × 10⁻⁵ A/cm2 for as-received, normalized, and annealed sample, respectively; calculated from the intersection of the anodic (βa) and cathodic (βc) Tafel slopes. The higher dissolution kinetics shows the influence of the aggressiveness of the environment as well as the thermomechanical treatment [44,45]. Furthermore, the higher anodic dissolution kinetics observed for the annealed sample can be explained by the more coarse grains present [46]. However, at this alkaline pH (13.6), the depassivation induced by the chlorides is not severe as all three specimens show a negative hysteresis on the backward scan, indicating that the CS rebar samples remained in a passive state.
Regarding the faster cooling rate samples exposed to synthetic FA pore solution, the most active behavior is observed by the oil quenched sample as the curves shift toward higher current densities (i) as well as toward lower potentials, shown by Figure 5b. This can be explained by the mixed bainite and martensite microstructure. A Flade potential is observed for the quenched samples around −0.45 VSCE. All samples display a negative hysteresis loop as well as no clear sign of pitting corrosion. The samples that undergo subcritical annealing show lower corrosion rates and a similar corrosion behavior in between, being the most active the annealed water quenched sample due to presence of martensite and bainite in the microstructure [47]. Previous studies showed how a subcritical annealing enhanced the pitting corrosion resistance [48]. Table 2 shows the characteristic parameters that were obtained from the CPP for both scan directions and cooling rates. The quenched samples show an Ecorr value around −0.50 ± 0.01 VSCE, similar to the as-received sample but with icorr values one order of magnitude higher. Lower Ecorr values are observed for the subcritical annealing process after the quenching, with values of −0.60 ± 0.01 VSCE. An increase in the icorr values is observed for the oil quenched sample. icorr values ranged from 3.18 × 10⁻⁵ to 2.20 × 10⁻⁵ A/cm2 for the water and oil quenched samples, respectively. An order of magnitude higher after subcritical annealing is observed, with values of 2.18 × 10⁻⁶ and 2.77 × 10⁻⁶ A/cm2 for subcritical annealed water quenched, and subcritical annealed oil quenched, respectively. After the subcritical annealing, a more novel behavior is observed. Thus, indicating the influence on corrosion of the thermomechanical treatment. The samples were in a passive state as the negative hysteresis loop in the backward scan evidenced.
In order to further investigate the electrochemical dissolution kinetics of the system, the cathodic oxygen reduction reaction (ORR) was evaluated by means of the calculation of the exchange current density of the ORR (i0,ORR). It was obtained via intersecting the cathodic Tafel slope (βc) with the oxygen equilibrium line (O2 + 2H2O + 4e ⇆ 4OH). The oxygen equilibrium line potential is calculated according to Nernst equation at RT (see Equation (1)):
E O 2 / OH = E O 2 / OH 0.059 log OH p O 2 1 / 4
where E O 2 / OH is the reversible potential of the oxygen, E O 2 / OH is the standard reduction potential, 0.401 VSHE for alkaline media, log   OH is a function of the pH, and p O 2 is the partial pressure of O2 and equals 1 atm. For the synthetic FA pore solution, the oxygen equilibrium line is at 0.160 VSCE. It can be seen from Table 2 how the as-received and normalized samples have the largest ORR kinetics. In addition to the i0,ORR, the anodic and cathodic charge transfer coefficients can be obtained and discussed using Equations (2) and (3), respectively [49]:
α a = R T n F 1 β a
α c = R T n F 1 β c
where αa and αc are the anodic and cathodic charge transfer coefficients, respectively, R is the ideal gas constant (8.314 J mol−1 K−1), T is temperature in K, n is the number of electrons, F is the Faraday constant (96,485 C mol−1), and β a and β c are the anodic and cathodic Tafel slopes in V/dec. The αa varies among the different thermomechanical treatments, indicating an anodically controlled electrochemical corrosion process, thus showing the influence of the phases present in the microstructure on the dissolution kinetics. However, the αc does not vary with the applied thermomechanical treatment as all the values fall in the range of 0.100 ± 0.04, indicating that the process is not controlled by the ORR.
Before performing the EIS analysis, Kramers-Kronig (KK) transforms were produced to determine robustness of the data. The analysis consists of calculating the real impedance values using the imaginary experimental data and vice versa. In order to determine the robustness of the experimental data, both results, experimental and calculated data, must have a good correlation [50,51]. This can be seen in Figure 6, where the empty symbols represent the experimental values and the crosses represent the calculated values, the overlapping indicates a good fit, thus showing the robustness of the data obtained. The EIS Nyquist plots are presented in Figure 7 for the CS rebars in FA pore solution containing 0.6 M NaCl. The proposed electrical equivalent circuit (EEC) used to fit the EIS data is shown in Figure 8. This EEC is commonly used to model the electrical response of steel reinforcements in concrete as well as concrete pore solution, it presents two-time constants, the first one is associated with the passive film formed at high pH (at high frequencies), whereas the second one refers to the double layer (at low frequencies). This EEC proposal is supported by observing the Bode plots in Figure 9. The two changes found in the slope of the phase angle indicate the presence of two different relaxation processes [51,52]. The EEC presents a hierarchically distributed equivalent circuit consisting of: Rs, the resistance of the solution; this is attributed to the ohmic resistance between the WE and the RE, a constant phase element (CPEfilm) associated with the passive film (high frequencies), Rfilm, which is the resistance of the passive film, CPEdl which is the constant phase element related to the double layer (low frequencies) and Rct which is the charge transfer resistance (presenting an inverse proportionality with the corrosion rate). The two R//CPE time constants are seen in the two changes observed in the −θ phase angle slope from the Bode plots, indicating the existence of two different relaxation processes (see Figure 9) [53]. In both time constants, the passive film and double layer, the CPE elements representing a branched ladder RC network are presented instead of an ideal capacitor due to the non-ideal capacitance of an electrode in an active state [50]. The impedance of this CPE can be obtained by ZCPE = (Y)−1(jω)n, where Y is the admittance (S cm−2 sn), ω is the angular frequency (rad s−1), j is the imaginary number, j2 = (−1), and n is a dimensionless fraction exponent ranging from −1 to 1. The fitting parameters of the Nyquist plots using the proposed EEC are presented in Table 3. The goodness of fit (χ2) for all the alloys tested falls within 10−4, and the error percentage for each parameter is always below 10% for all the tests performed.
From the fitting values presented in Table 3, some trends can be extracted; Rs presents an average value of 14.3 Ω cm2. Rfilm shows a considerable change from 457.3 Ω cm2 down to 123.9 Ω cm2 for the as-received and oil quenched sample, respectively. This evidences the instability of the passive film formed after the thermomechanical treatments and exposure to chloride ions [25]. The Yfilm changes between the different treatments, reflecting the thinning of the film, in which the lowest is observed for the as-received and subcritically annealed samples and higher values are seen for the rest of the samples, but always in the same order of magnitude. The nfilm value is between 0.83 and 0.91 (close to an ideal capacitor, n = 1). The Rct slightly changes between samples, in the order of 103 Ω cm2, showing lower values for increased cooling rates. The Ydl remains near 10−3 S/cm2 sn,dl, for the whole set of samples. Accordingly, as seen with the nfilm, the ndl presents values ranging from 0.77 to 0.92, indicating that interface shows a non-ideal capacitor behavior, which is influenced by the applied polarization, the surface roughness and the presence of defects and impurities within the oxide layer.
In order to correct the value of the pseudo-capacitance of the double-layer (Ydl) and find the effective capacitance (Ceff,dl), the Rs and Rct are considered and used in combination with the Ydl and ndl. The equation proposed by Brug et al. was used to calculate Ceff,dl (see Equation (4)) [54,55,56]:
C eff , dl = Y dl 1 R s + 1 R ct n dl 1 1 n dl
Using Equation (4), the following Ceff,dl values are obtained and shown in Figure 10. In addition, the Rct values are also included in order to compare the evolution of both parameters with each thermomechanical treatment. From Figure 10, the quenched samples showed the lowest Ceff,dl and highest Rct values, indicating higher corrosion kinetics. It can be concluded that lower corrosion properties are to be expected for increased cooling rates. The higher the Rct, the lower the Ceff,dl, which corroborates the previous results as the higher the impedance and the lower the capacitance the more protection the film imparts [50,57,58]. The results from the CPP and EIS techniques are in good agreement and prove that the fast cooling rate severely affects the development of the passive film as can be seen in the values for Ceff,dl that were 3.06 × 10⁻³ µF/cm2 for the normalized specimen and decreased until 8.12 × 10⁻⁴ µF/cm2 for the water quenched and 1.61 × 10⁻³ µF/cm2 for the oil quenched with subcritical annealing.
Electrochemical results showed how the presence of chlorides compromised the stability of the passive film as the cooling rate increased. This is evidenced by electrochemical response and corrosion obtained for the different microstructures. Martensite promoted pitting corrosion of the CS rebars, which can be attributed to the high Gibbs free energy, which is higher than ferrite and pearlite; thus, Fe atoms are prone to anodic dissolution reaction with ions dissolved in the electrolyte, resulting in enhanced corrosion susceptibility [59]. The higher activity of martensite towards corrosion is in accordance with previous studies [36,39,47]. In addition, coarser grains and cementite promoted bigger pit depths as pitting corrosion causes the dissolution of the grain boundaries. It is found that wider pits correspond to large grain size [46]. Lower corrosion rates are observed in the samples that undergo subcritical annealing. This was due to the release of residual stresses and the presence of bainite, a more noble phase, compared to martensite [47].
After the exposure and polarization of the samples, OM revealed the corrosion products formed in the CS rebar and can be seen in Figure 11. The results showed how the quenched and the annealed samples displayed the most pitting corrosion. As the cooling rate increased, the pitting corrosion did as well.
Finally, IFM analysis in Figure 12 show that the chloride ions promote local acidification that led to pitting corrosion. The average pit depth varied from 1 μm for as received sample, 4 μm after annealing, 2 μm after normalizing, 5 μm after water quenching, 5 μm after oil quenching, 3 μm after subcritical annealing after water quenching, and 3 μm after subcritical annealing after oil quenching. Thus, showing the enhanced dissolution kinetics exhibited by only the quenched CS samples followed by the annealed CS samples.
Therefore, influence on thermomechanical treatments on corrosion of CS reinforcements in synthetic geopolymer FA pore solution have been confirmed by both electrochemical and microstructural analysis.

4. Conclusions

After studying the effect of the thermomechanical treatments on corrosion behavior of carbon steel rebars in chloride contaminated synthetic FA pore solution, the following conclusions are drawn:
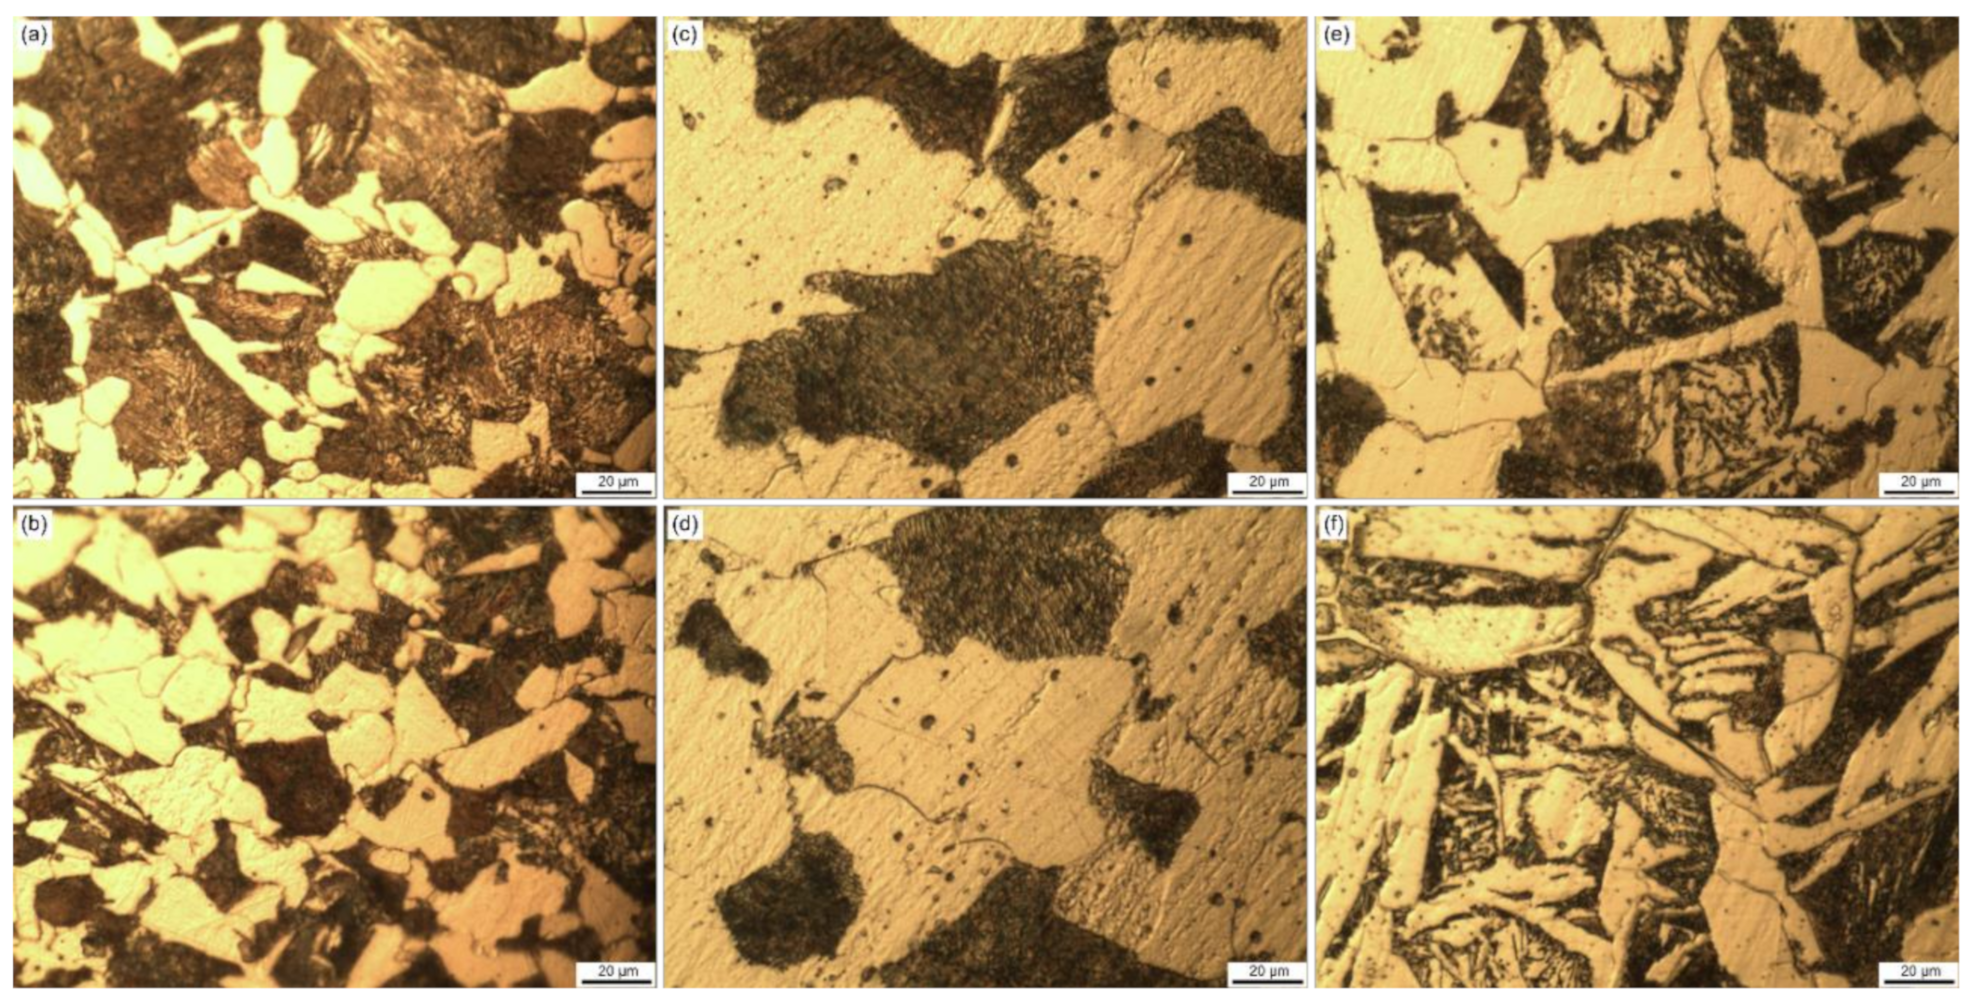
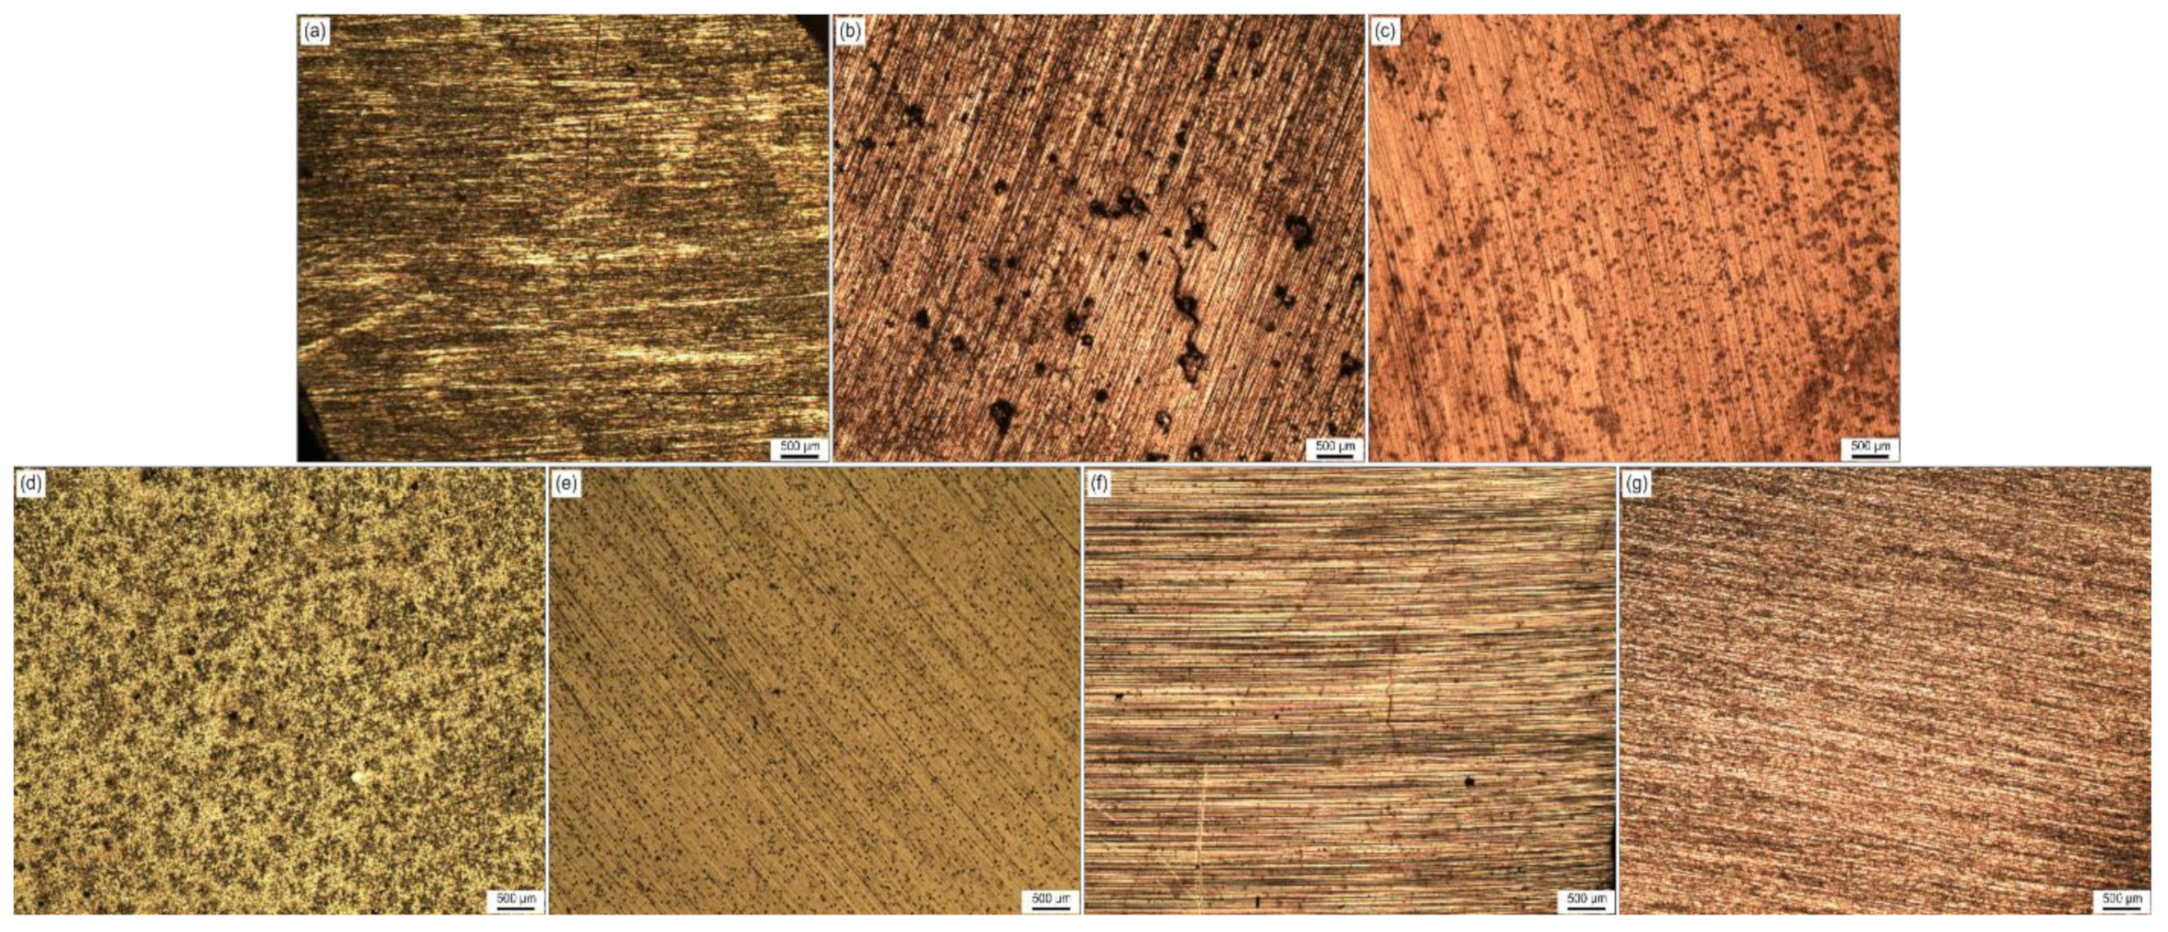
  • Martensite was observed on the as-received sample near the edge of the rebar, whereas pearlite and cementite were found on the annealed sample with larger grain size. Smaller grains as well as Widmanstätten ferrite was found on the normalized sample near the edge. A full martensitic microstructure was obtained after quenching, whereas a mix of bainite and martensite is revealed after a subcritical annealing process.
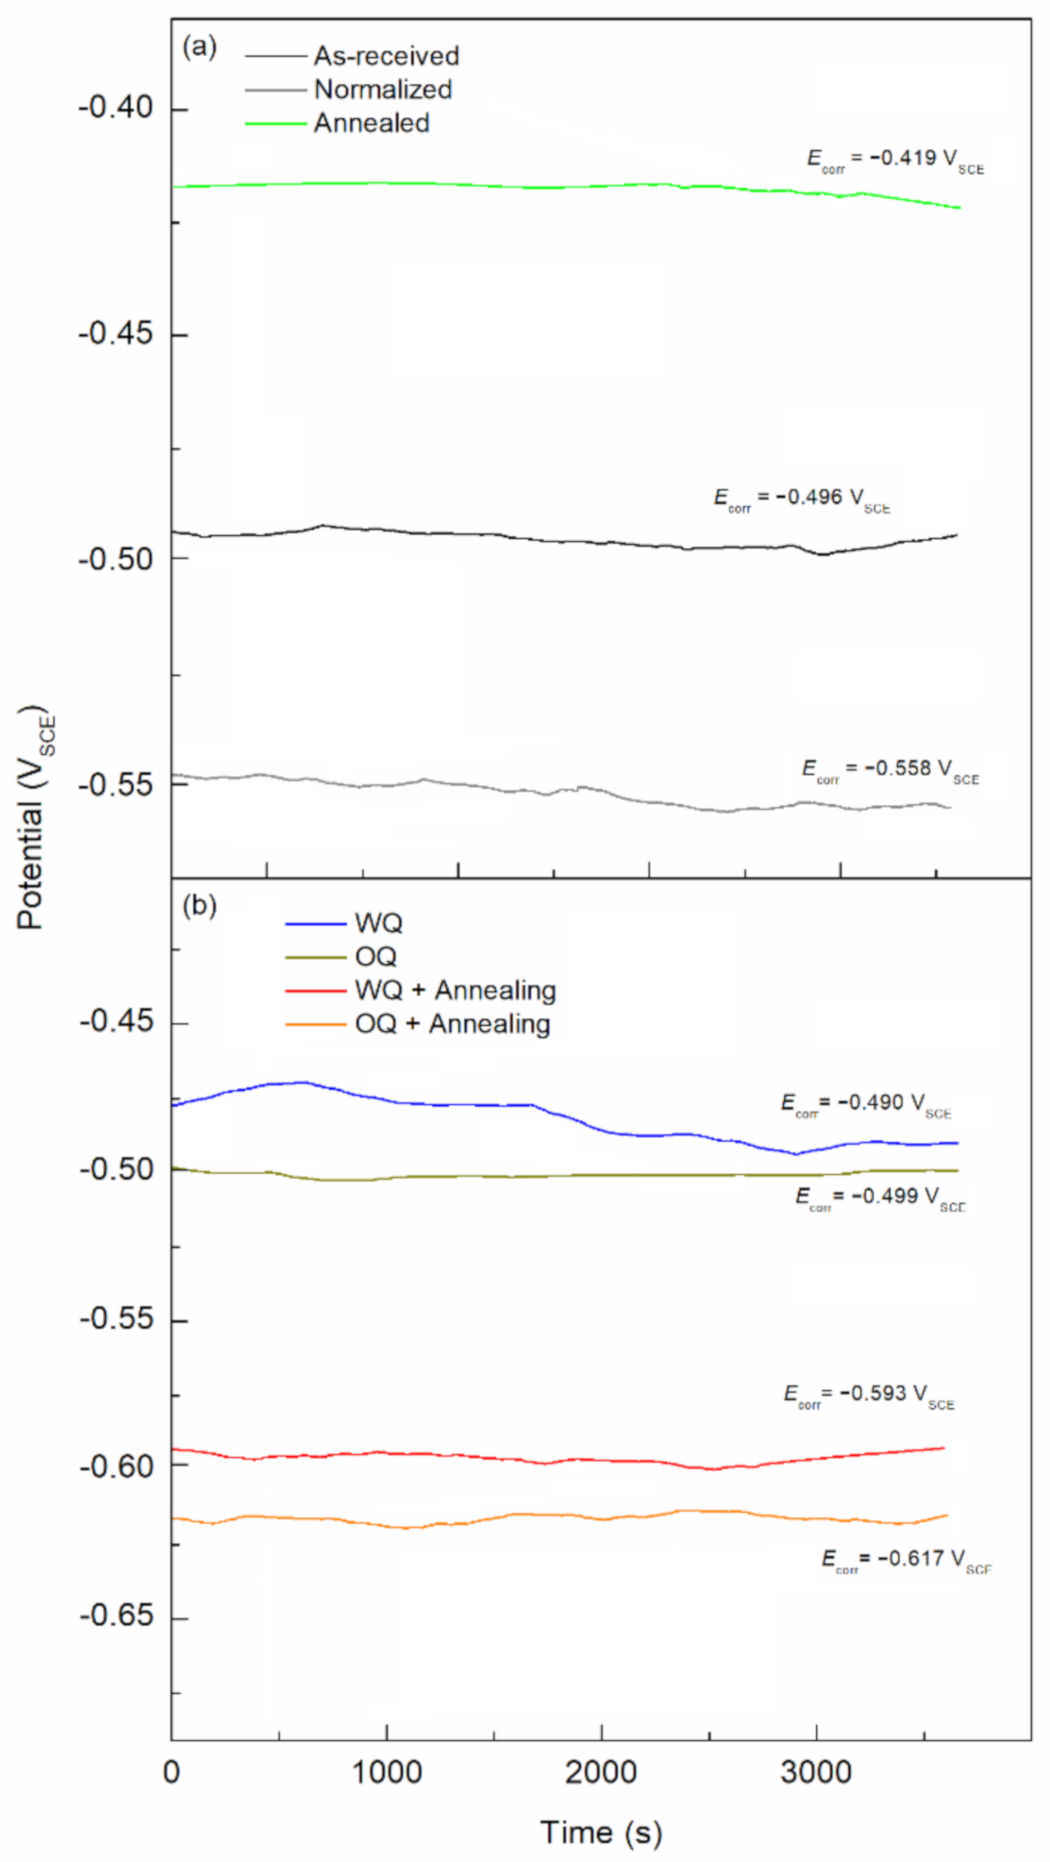
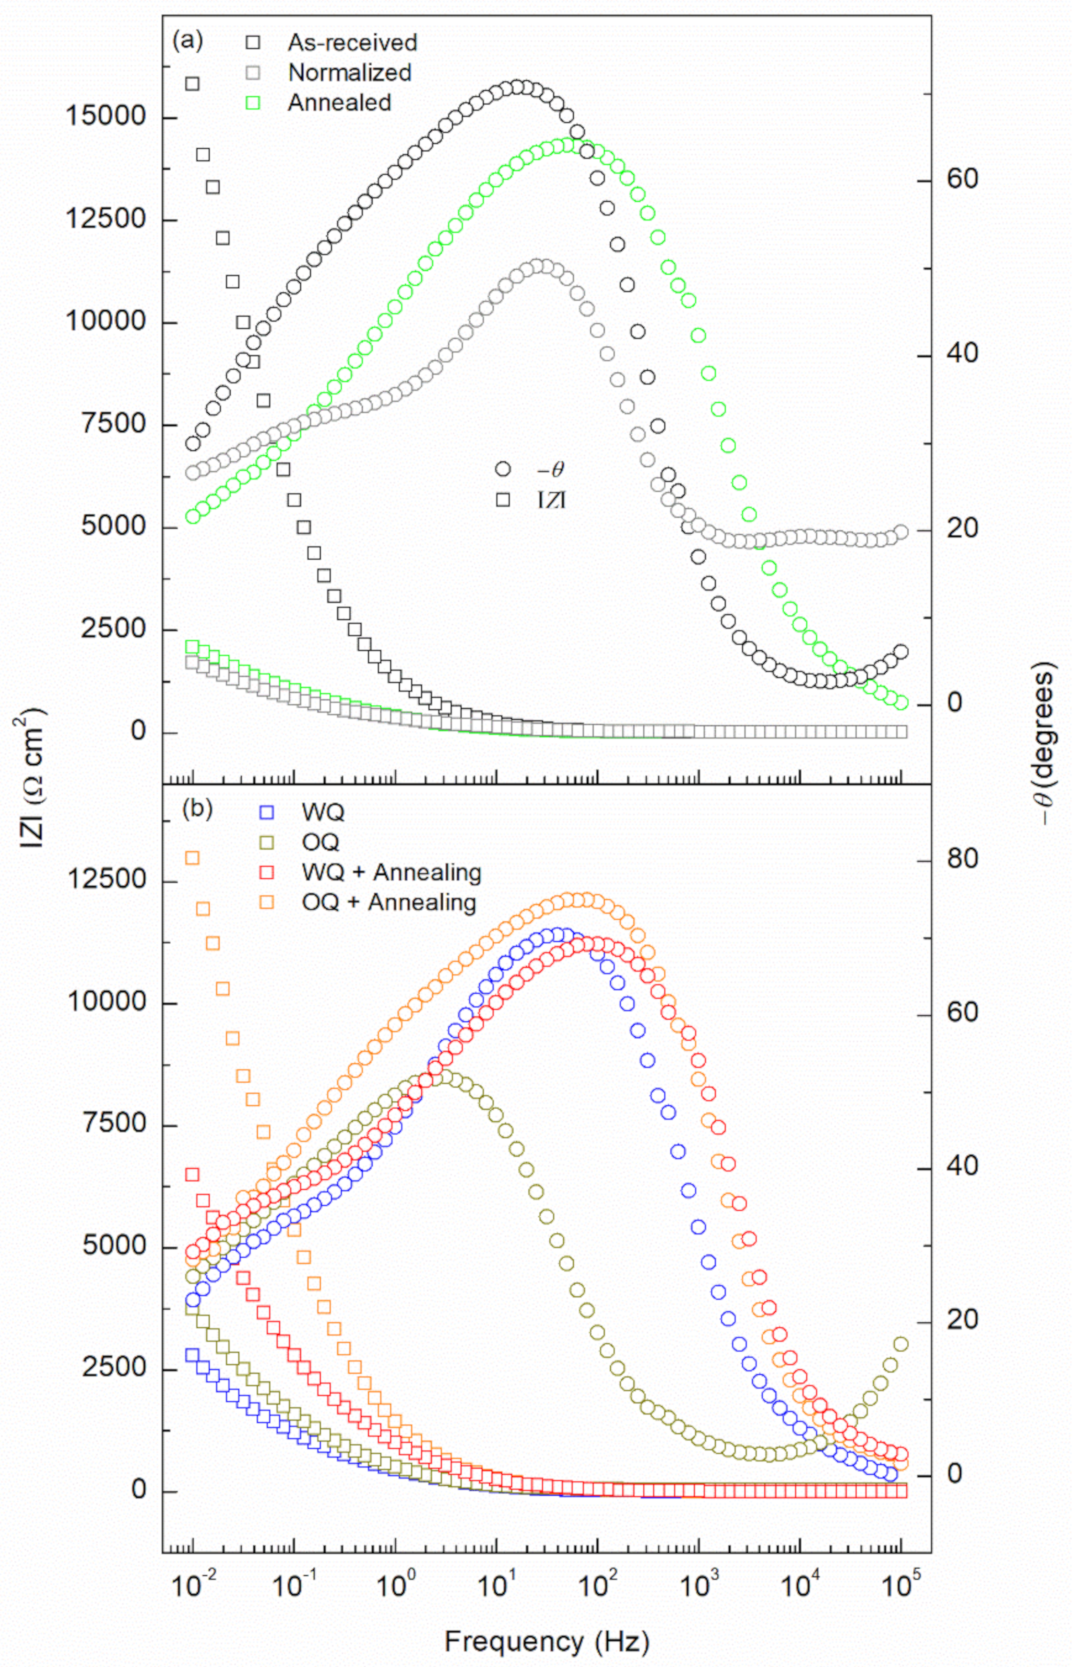
  • Steel exposed to FA pore solution showed no active corrosion for the as-received samples due to the formation of a passive layer that protected the material even with chloride concentrations of 0.6 M NaCl. Such behavior worsens as the cooling rate of the rebars is increased due to the more active microstructure. The highest corrosion susceptibility was found to be in the martensite structure, followed by coarse and bigger grain size, bainitic and pearlitic steel.
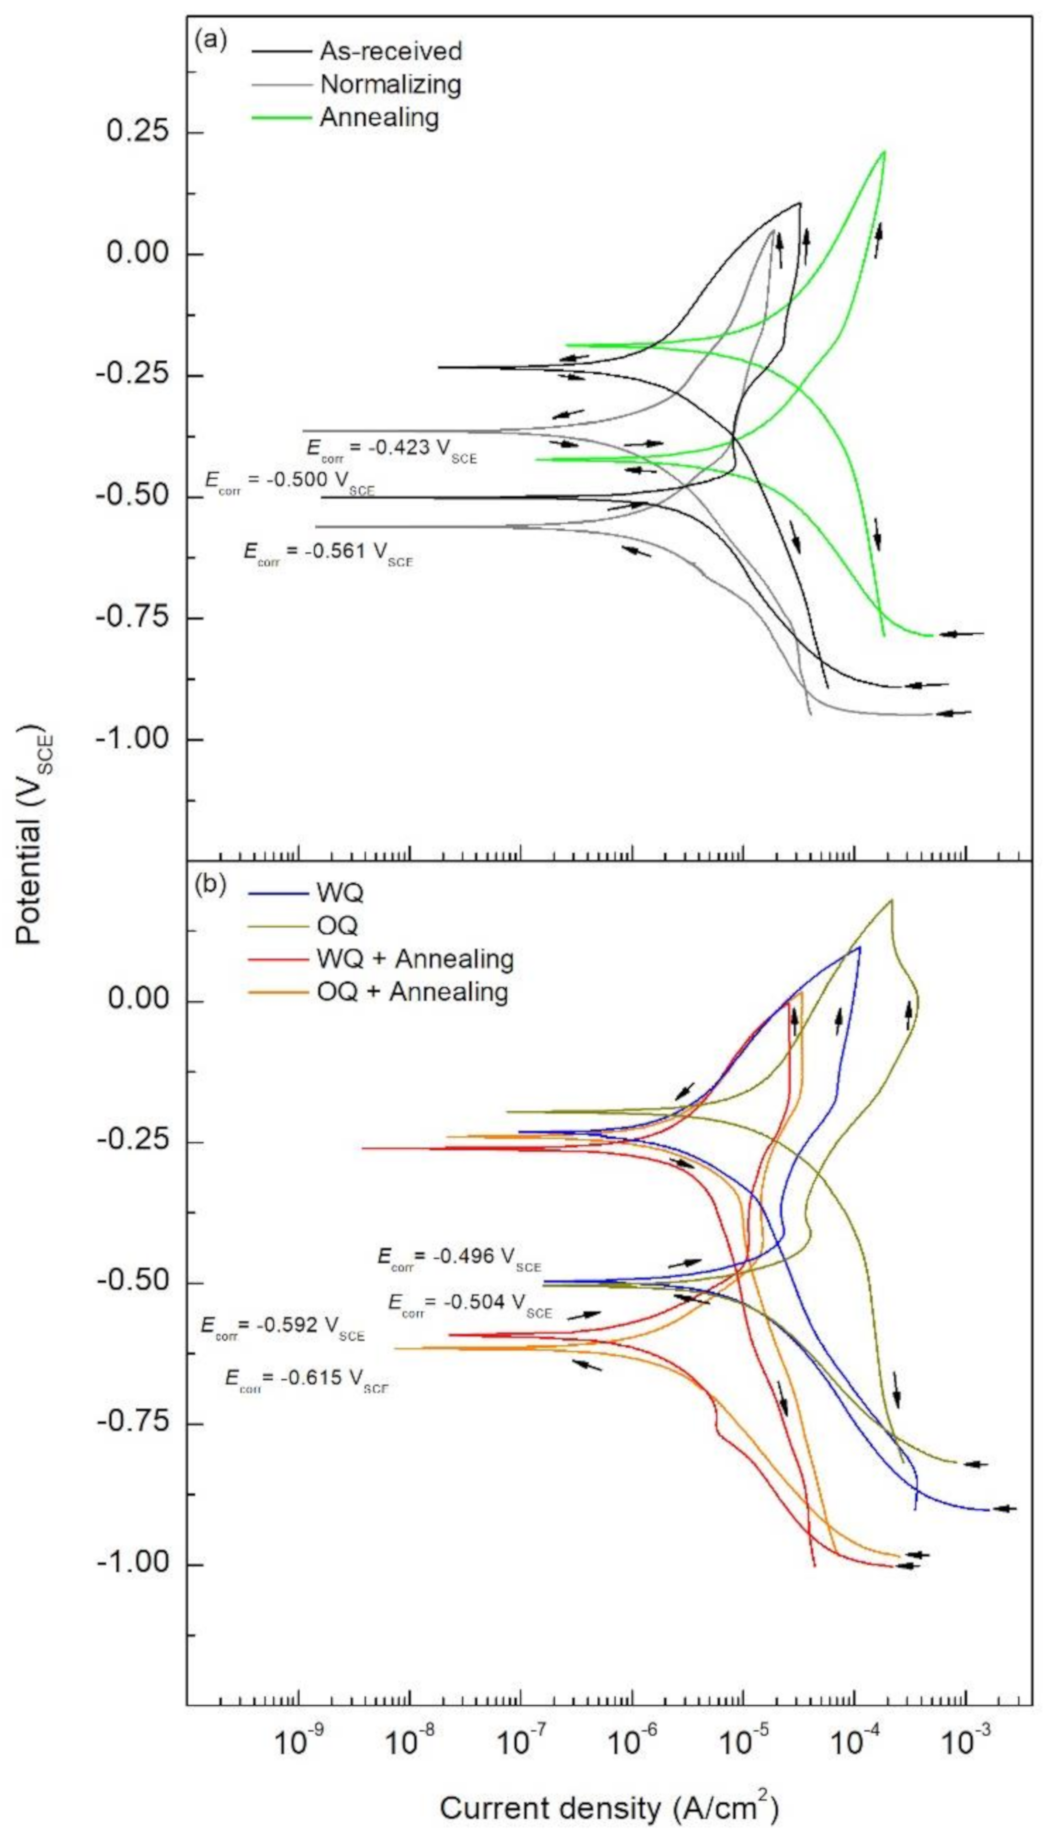
  • Higher icorr values were observed for the samples containing martensite, namely the quenched specimens. These icorr values were in the range of 3.18 × 10⁻⁵ and 2.20 × 10⁻⁵ A/cm2, whereas the as-received sample showed an icorr values of 2.13 × 10⁻⁶ A/cm2. Additionally, an increased icorr value of 2.09 × 10⁻⁵ A/cm2 was found on the annealed sample presenting coarse grain.
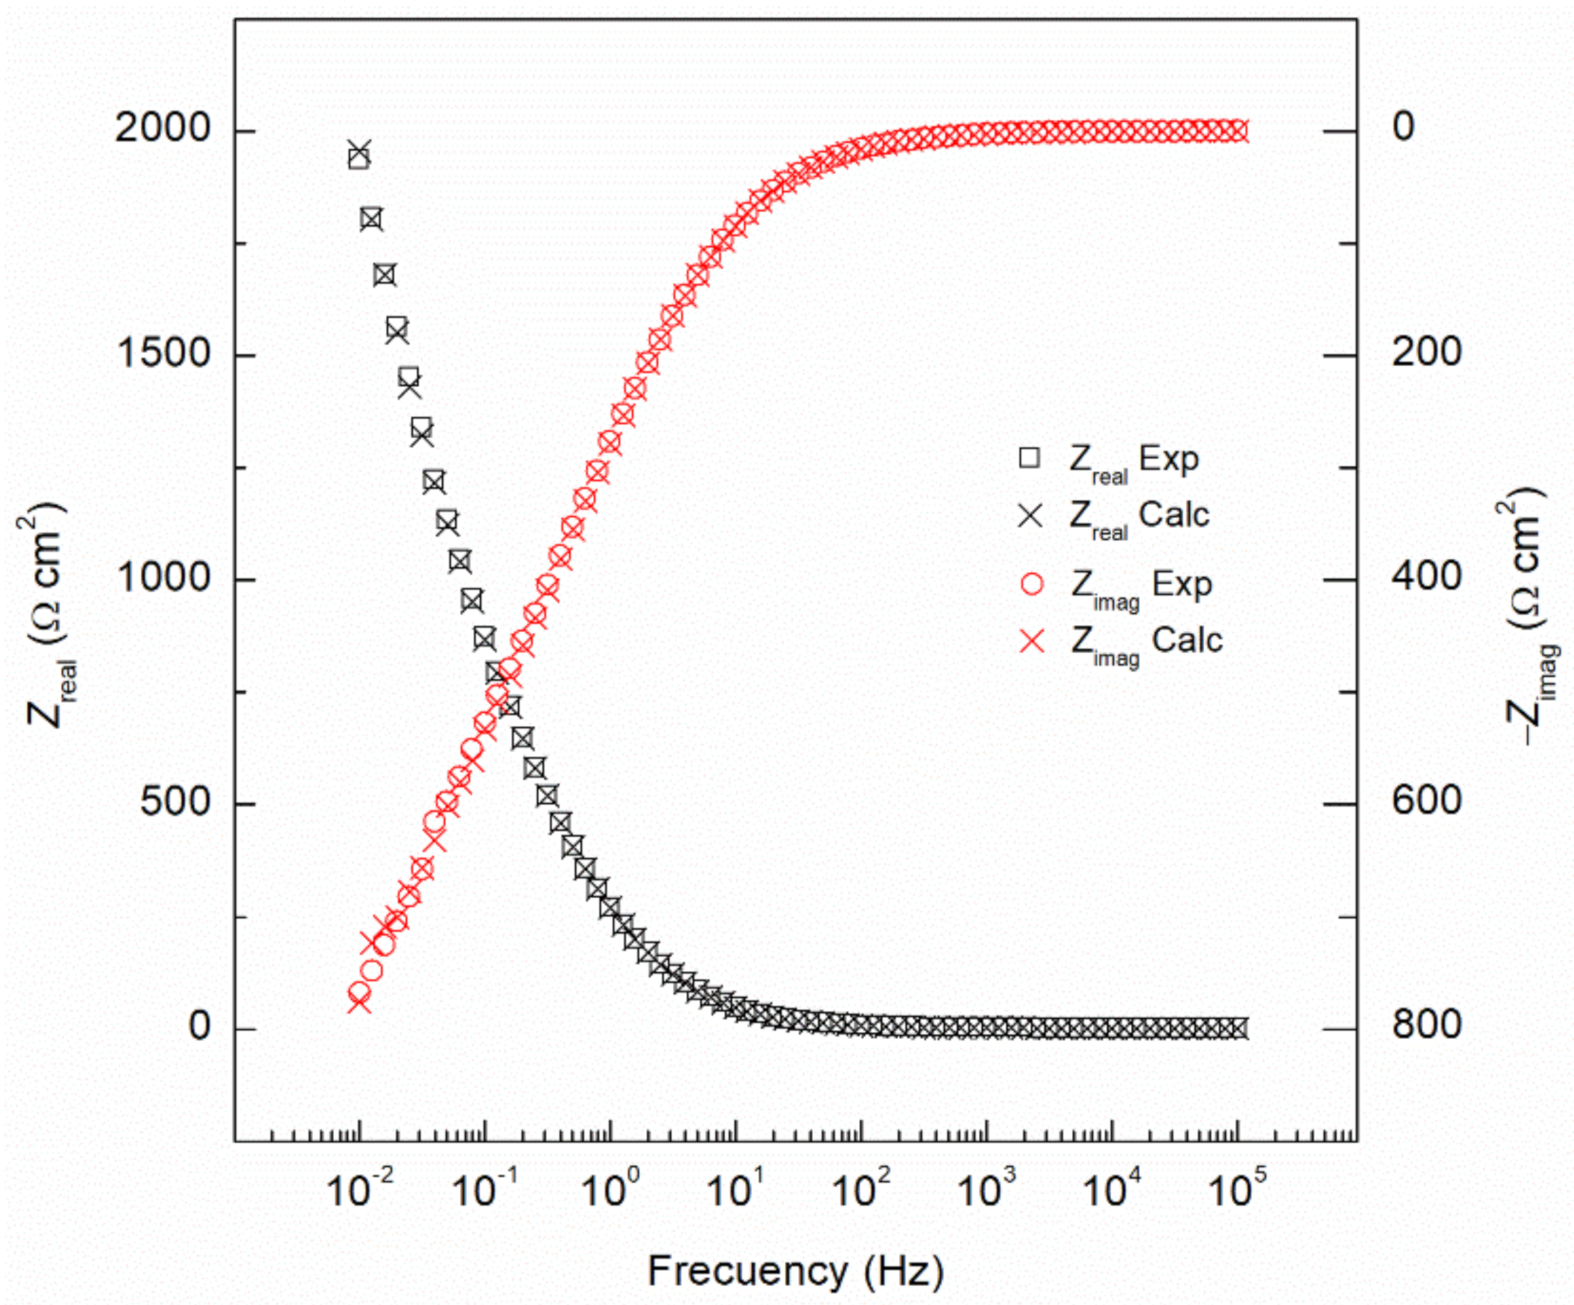
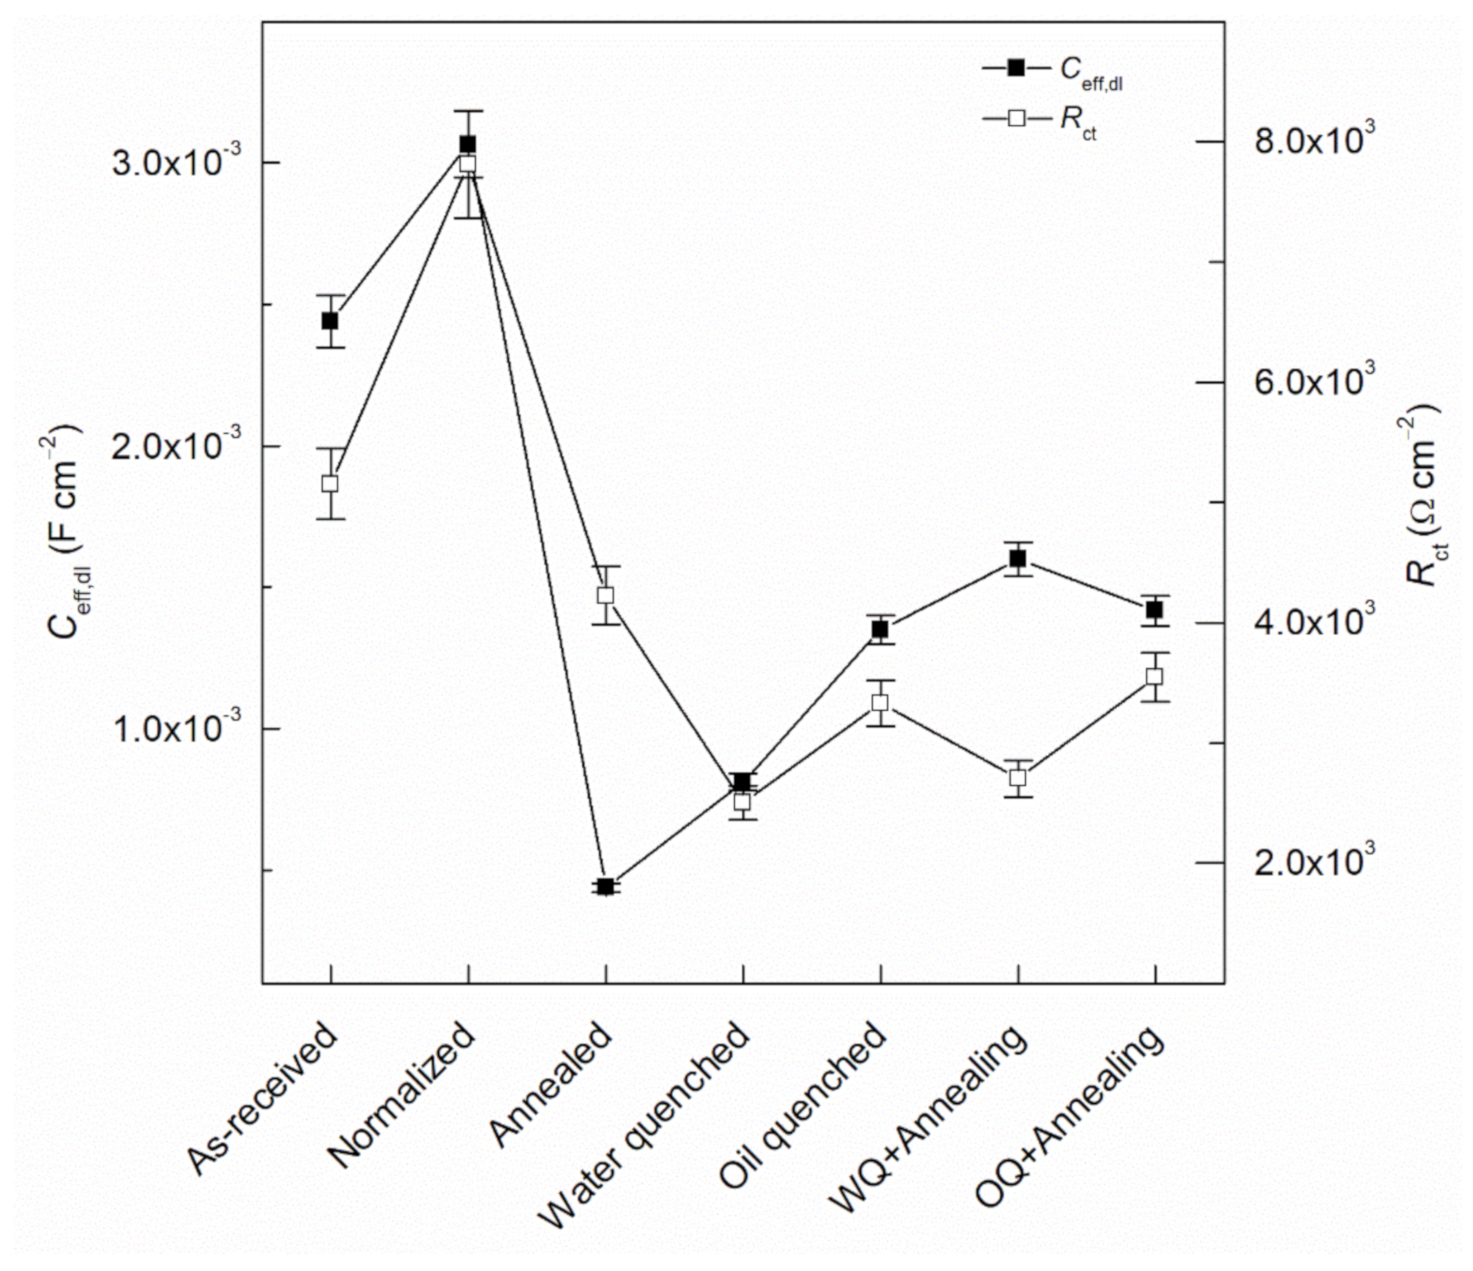
  • Ceff,dl shows the lower stability of the passive film as the cooling rate increased, from 1.11 × 10⁻³ to 8.12 × 10⁻⁴ µF/cm2 for as-received and water quenched samples, respectively.
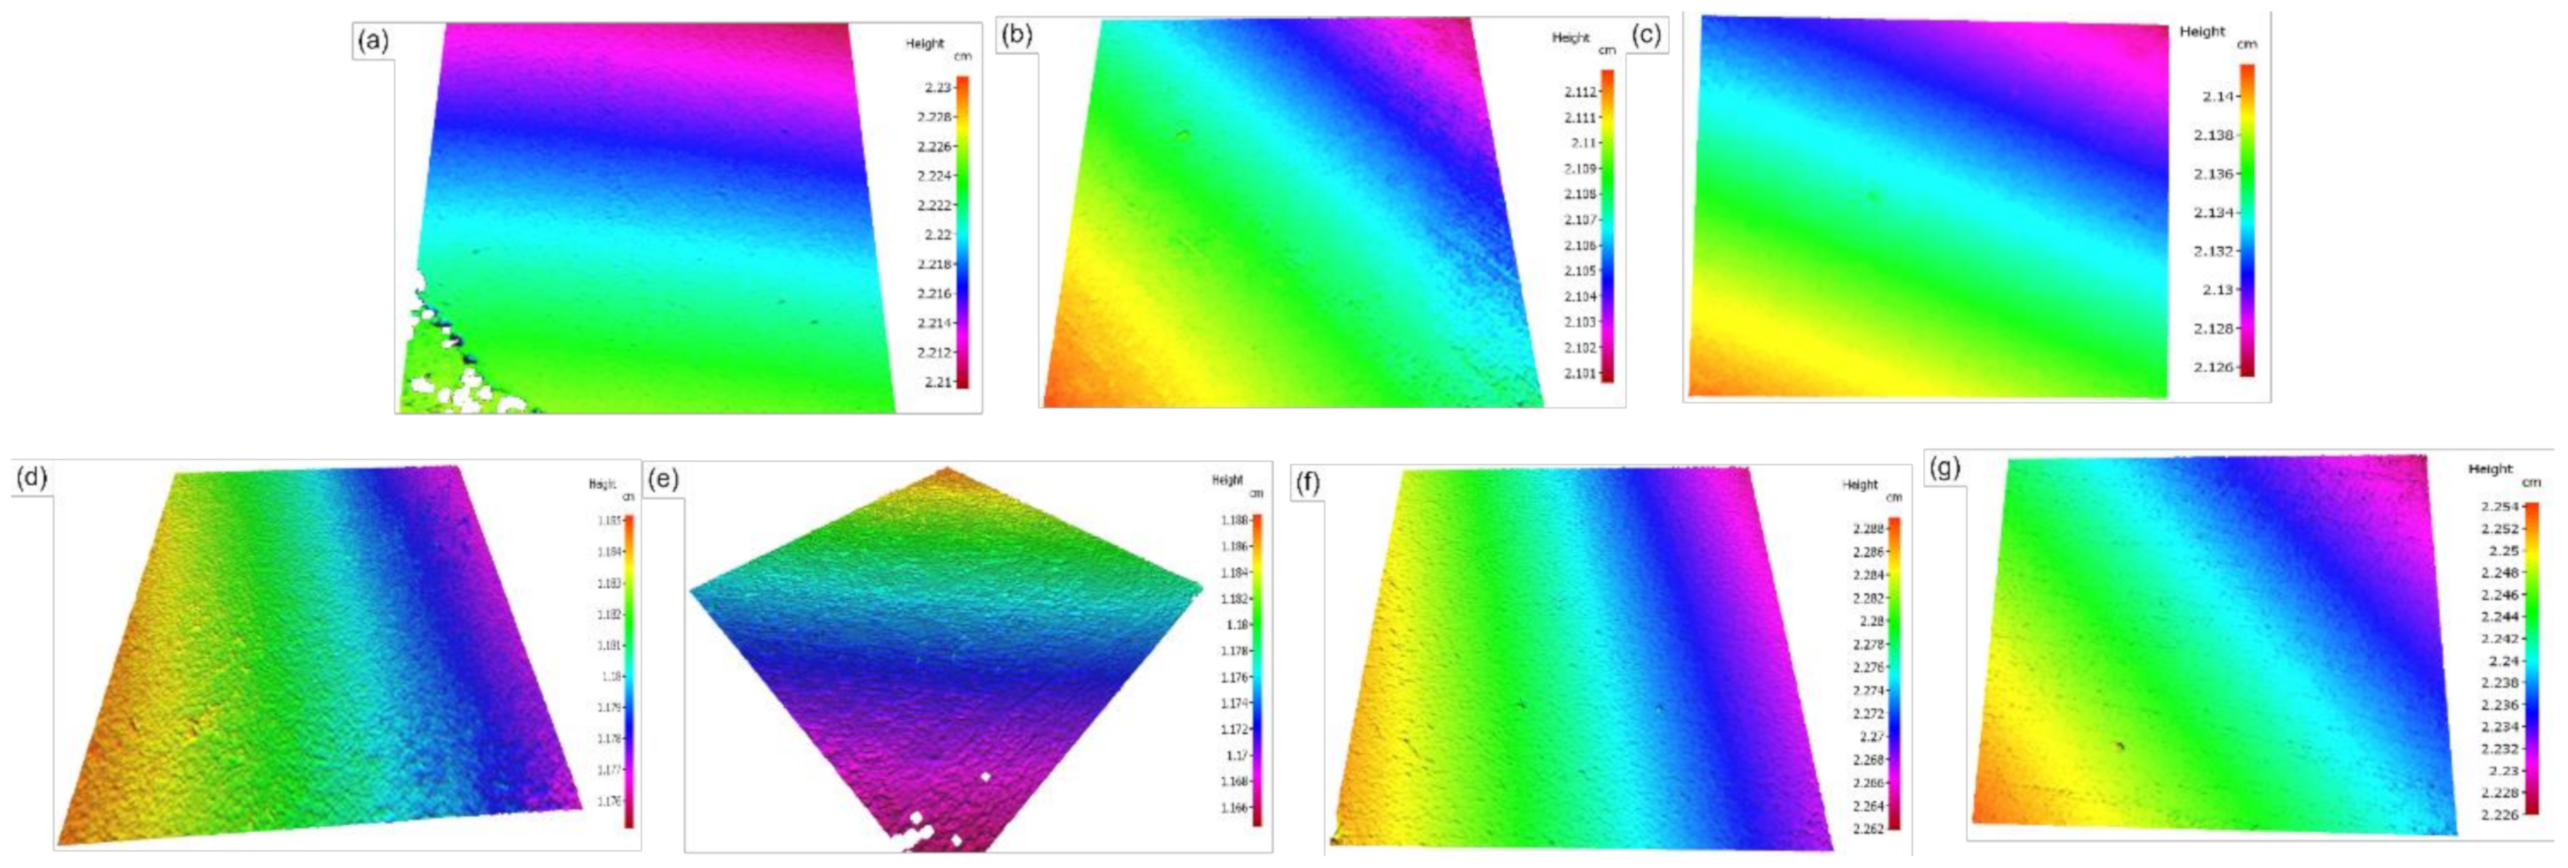
  • Higher pit depth was observed for the quenched samples, with an average pit depth of 5 μm. Similarly, the annealed sample showed four times the average pith depth compared to the as-received sample, 4 and 1 μm, respectively. These findings are in accordance with the EIS and CPP results.

Author Contributions

Conceptualization, D.M.B.; methodology, J.B., U.M., J.R., K.K. and D.M.B.; formal analysis, J.B., U.M., J.R. and D.M.B.; investigation, J.B., U.M., J.R., K.K. and D.M.B.; resources, D.M.B.; data curation, J.B., U.M., J.R., K.K. and D.M.B.; writing—original draft preparation, J.B., U.M., J.R. and D.M.B.; writing—review and editing, J.B., U.M., J.R. and D.M.B.; visualization, D.M.B.; supervision, D.M.B.; project administration, D.M.B.; funding acquisition, D.M.B. All authors have read and agreed to the published version of the manuscript.

Funding

This research was funded by Firestone Research Grant 639430, and The University of Akron.

Institutional Review Board Statement

Not applicable.

Informed Consent Statement

Not applicable.

Data Availability Statement

The data is not available due to an ongoing research project.

Acknowledgments

The authors acknowledge the technical support and facilities from The National Center for Education and Research on Corrosion and Materials Performance (NCERCAMP-UA), The College of Engineering and Polymer Science and The University of Akron.

Conflicts of Interest

The authors declare no conflict of interest.

Nomenclature

CECounter electrode
Ceff,dlEffective capacitance of the double layer
CPEConstant phase element
CPPCyclic potentiodynamic polarization
CSCarbon steel
EcorrCorrosion potential
EECElectrical equivalent circuit
EfFlade potential
EISElectrochemical impedance spectroscopy
FAFly ash
i0,ORRExchange current density of ORR
icorrCorrosion current density
IFMInfinite focus microscope
OMOptical microscope
OPCOrdinary Portland cement
ORROxygen reduction reaction
OQOil quenched
RCSReinforced concrete structures
RctCharge transfer resistance
REReference electrode
RpPolarization resistance
WEWorking electrode
WQWater quenched
YPseudo-capacitance
αCharge transfer coefficient
βTafel slope
χ2Chi-square goodness of fit

References

  1. Andrew, R.M. Global CO2 emissions from cement production. Earth Syst. Sci. Data 2018, 10, 195. [Google Scholar] [CrossRef] [Green Version]
  2. Peng, J.X.; Huang, L.; Zhao, Y.B.; Chen, P.; Zeng, L.; Zheng, W. Modeling of carbon dioxide measurement on cement plants. Adv. Mater. Res. 2012, 610–613, 2120–2128. [Google Scholar] [CrossRef]
  3. International Energy Agency (IEA). Energy Technology Perspectives 2010: Scenarios and Strategies to 2050; OECD Publishing: Paris, France, 2009. [Google Scholar] [CrossRef]
  4. Mahasenan, N.; Smith, S.; Humphreys, K. The cement industry and global climate change current and potential future cement industry CO2 emissions. In Proceedings of the Greenhouse Gas Control Technologies—6th International Conference, Kyoto, Japan, 1–4 October 2002; Pergamon: Oxford, UK, 2003; pp. 995–1000. [Google Scholar] [CrossRef]
  5. Turner, L.K.; Collins, F.G. Carbon dioxide equivalent (CO2-e) emissions: A comparison between geopolymer and OPC cement concrete. Constr. Build. Mater. 2013, 43, 125–130. [Google Scholar] [CrossRef]
  6. Zhuang, X.Y.; Chen, L.; Komarneni, S.; Zhou, C.H.; Tong, D.S.; Yang, H.M.; Yu, W.H.; Wang, H. Fly ash-based geopolymer: Clean production, properties and applications. J. Clean. Prod. 2016, 125, 253–267. [Google Scholar] [CrossRef]
  7. McLellan, B.C.; Williams, R.P.; Lay, J.; Van Riessen, A.; Corder, G.D. Costs and carbon emissions for geopolymer pastes in comparison to ordinary portland cement. J. Clean. Prod. 2011, 19, 1080–1090. [Google Scholar] [CrossRef] [Green Version]
  8. John, S.K.; Nadir, Y.; Girija, K. Effect of source materials, additives on the mechanical properties and durability of fly ash and fly ash-slag geopolymer mortar: A review. Constr. Build. Mater. 2021, 280, 122443. [Google Scholar] [CrossRef]
  9. Fu, X.; Li, Q.; Zhai, J.; Sheng, G.; Li, F. The physical–chemical characterization of mechanically-treated CFBC fly ash. Cem. Concr. Compos. 2008, 30, 220–226. [Google Scholar] [CrossRef]
  10. Hardjito, D.; Rangan, B.V. Development and Properties of Low-Calcium Fly Ash-Based Geopolymer Concrete; Research Report; Curtin University of Technology: Perth, Australia, 2005. [Google Scholar]
  11. Parande, A.K.; Babu, B.R.; Karthik, M.A.; Deepak, K.K.; Palaniswamy, N. Study on strength and corrosion performance for steel embedded in metakaolin blended concrete/mortar. Constr. Build. Mater. 2008, 22, 127–134. [Google Scholar] [CrossRef]
  12. Ranjbar, N.; Mehrali, M.; Mehrali, M.; Alengaram, U.J.; Jumaat, M.Z. Graphene nanoplatelet-fly ash based geopolymer composites. Cem. Concr. Res. 2015, 76, 222–231. [Google Scholar] [CrossRef]
  13. Ariza-Figueroa, H.A.; Bosch, J.; Baltazar-Zamora, M.A.; Croche, R.; Santiago-Hurtado, G.; Landa-Ruiz, L.; Mendoza-Rangel, J.M.; Bastidas, J.M.; Almeraya-Calderón, F.; Bastidas, D.M. Corrosion behavior of AISI 304 stainless steel reinforcements in SCBA-SF ternary ecological concrete exposed to MgSO4. Materials 2020, 13, 2412. [Google Scholar] [CrossRef]
  14. Masi, G. Steel corrosion behavior in light weight fly-ash based alkali activated mortars. Appl. Sci. 2021, 11, 1908. [Google Scholar] [CrossRef]
  15. Georget, F.; Soja, W.; Scrivener, K.L. Characteristic lengths of the carbonation front in naturally carbonated cement pastes: Implications for reactive transport models. Cem. Concr. Res. 2020, 134, 106080. [Google Scholar] [CrossRef]
  16. Ma, F.-Y. Corrosive effects of chlorides on metals. In Pitting Corrosion; InTech Europe: Rijeka, Croatia, 2012; Volume 294, pp. 139–178. [Google Scholar]
  17. Zuo, Y.; Nedeljković, M.; Ye, G. Pore solution composition of alkali-activated slag/fly ash pastes. Cem. Concr. Res. 2019, 115, 230–250. [Google Scholar] [CrossRef]
  18. Babaee, M.; Castel, A. Chloride diffusivity, chloride threshold, and corrosion initiation in reinforced alkali-activated mortars: Role of calcium, alkali, and silicate content. Cem. Concr. Res. 2018, 111, 56–71. [Google Scholar] [CrossRef]
  19. Wang, Y.; Shui, Z.; Gao, X.; Huang, Y.; Yu, R.; Xiao, X. Modification on the chloride binding capacity of cementitious materials by aluminum compound addition. Constr. Build. Mater. 2019, 222, 15–25. [Google Scholar] [CrossRef]
  20. Gunasekara, C.; Law, D.; Bhuiyan, S.; Setunge, S.; Ward, L. Chloride induced corrosion in different fly ash based geopolymer concretes. Constr. Build. Mater. 2019, 200, 502–513. [Google Scholar] [CrossRef]
  21. Nedeljković, M.; Ghiassi, B.; van der Laan, S.; Li, Z.; Ye, G. Effect of curing conditions on the pore solution and carbonation resistance of alkali-activated fly ash and slag pastes. Cem. Concr. Res. 2019, 116, 146–158. [Google Scholar] [CrossRef] [Green Version]
  22. Chen, R.; Hu, J.; Ma, Y.; Guo, W.; Huang, H.; Wei, J.; Yin, S.; Yu, Q. Characterization of the passive film formed on the reinforcement surface in alkali activated fly ash: Surface analysis and electrochemical evaluation. Corros. Sci. 2020, 165, 108393. [Google Scholar] [CrossRef]
  23. Mangat, P.S.; Ojedokun, O.O.; Lambert, P. Chloride-initiated corrosion in alkali activated reinforced concrete. Cem. Concr. Compos. 2021, 115, 103823. [Google Scholar] [CrossRef]
  24. Lloyd, R.R.; Provis, J.L.; Van Deventer, J.S.J. Pore solution composition and alkali diffusion in inorganic polymer cement. Cem. Concr. Res. 2010, 40, 1386–1392. [Google Scholar] [CrossRef]
  25. Mundra, S.; Criado, M.; Bernal, S.A.; Provis, J.L. Chloride-induced corrosion of steel rebars in simulated pore solutions of alkali-activated concretes. Cem. Concr. Res. 2017, 100, 385–397. [Google Scholar] [CrossRef]
  26. Lu, J.; Liu, H.; Chen, Z.; Liao, X. Experimental investigation into the post-fire mechanical properties of hot-rolled and cold-formed steels. J. Constr. Steel Res. 2016, 121, 291–310. [Google Scholar] [CrossRef]
  27. Gunalan, S.; Mahendran, M. Experimental investigation of post-fire mechanical properties of cold-formed steels. Thin-Walled Struct. 2014, 84, 241–254. [Google Scholar] [CrossRef] [Green Version]
  28. Li, X.; Lo, K.H.; Kwok, C.T.; Sun, Y.F.; Lai, K.K. Post-fire mechanical and corrosion properties of duplex stainless steel: Comparison with ordinary reinforcing-bar steel. Constr. Build. Mater. 2018, 174, 150–158. [Google Scholar] [CrossRef]
  29. Panda, B.; Balasubramaniam, R.; Dwivedi, G. On the corrosion behaviour of novel high carbon rail steels in simulated cyclic wet-dry salt fog conditions. Corros. Sci. 2008, 50, 1684–1692. [Google Scholar] [CrossRef]
  30. Katiyar, P.K.; Misra, S.; Mondal, K. Effect of different cooling rates on the corrosion behavior of high-carbon pearlitic steel. J. Mater. Eng. Perform. 2018, 27, 1753–1762. [Google Scholar] [CrossRef]
  31. Atienza, J.M.; Elices, M. Behavior of prestressing steels after a simulated fire: Fire-induced damages. Constr. Build. Mater. 2009, 23, 2932–2940. [Google Scholar] [CrossRef]
  32. Torbati-Sarraf, H.; Poursaee, A. The influence of phase distribution and microstructure of the carbon steel on its chloride threshold value in a simulated concrete pore solution. Constr. Build. Mater. 2020, 259, 119784. [Google Scholar] [CrossRef]
  33. Bautista, A.; Pomares, J.C.; González, M.N.; Velasco, F. Influence of the microstructure of TMT reinforcing bars on their corrosion behavior in concrete with chlorides. Constr. Build. Mater. 2019, 229, 116899. [Google Scholar] [CrossRef] [Green Version]
  34. Ray, A.; Mukerjee, D.; Sen, S.K.; Bhattacharya, A.; Dhua, S.K.; Prasad, M.S.; Banerjee, N.; Popli, A.M.; Sahu, A.K. Microstructure and properties of thermomechanically strengthened reinforcement bars: A comparative assessment of plain-carbon and low-alloy steel grades. J. Mater. Eng. Perform. 1997, 6, 335–343. [Google Scholar] [CrossRef]
  35. Hao, X.; Dong, J.; Etim, I.I.N.; Wei, J.; Ke, W. Sustained effect of remaining cementite on the corrosion behavior of ferrite-pearlite steel under the simulated bottom plate environment of cargo oil tank. Corros. Sci. 2016, 110, 296–304. [Google Scholar] [CrossRef]
  36. Hao, X.; Zhao, X.; Chen, H.; Huang, B.; Ma, J.; Wang, C.; Yang, Y. Comparative study on corrosion behaviors of ferrite-pearlite steel with dual-phase steel in the simulated bottom plate environment of cargo oil tanks. J. Mater. Res. Technol. 2021, 12, 399–411. [Google Scholar] [CrossRef]
  37. Abdo, H.S.; Seikh, A.H.; Mohammed, J.A.; Luqman, M.; Ragab, S.A.; Almotairy, S.M. Influence of chloride ions on electrochemical corrosion behavior of dual-phase steel over conventional rebar in pore solution. Appl. Sci. 2020, 10, 4568. [Google Scholar] [CrossRef]
  38. Trejo, D.; Monteiro, P.; Thomas, G.; Wang, X. Mechanical properties and corrosion susceptibility of dual-phase steel in concrete. Cem. Concr. Res. 1994, 24, 1245–1254. [Google Scholar] [CrossRef]
  39. Moser, R.D.; Singh, P.M.; Kahn, L.F.; Kurtis, K.E. Chloride-induced corrosion resistance of high-strength stainless steels in simulated alkaline and carbonated concrete pore solutions. Corros. Sci. 2012, 57, 241–253. [Google Scholar] [CrossRef]
  40. ASTM. G3-14 Standard Practice for Conventions Applicable to Electrochemical Measurements in Corrosion Testing; ASTM International: West Conshohocken, PA, USA, 2019. [Google Scholar] [CrossRef]
  41. Grewal, R.; Aranas, C.; Chadha, K.; Shahriari, D.; Jahazi, M.; Jonas, J.J. Formation of Widmanstätten ferrite at very high temperatures in the austenite phase field. Acta Mater. 2016, 109, 23–31. [Google Scholar] [CrossRef]
  42. Fu, Y.; Hu, J.; Shen, X.; Wang, Y.; Zhao, W. Surface hardening of 30CrMnSiA steel using continuous electron beam. Nucl. Instrum. Methods Phys. Res. B 2017, 410, 207–214. [Google Scholar] [CrossRef]
  43. Esmailzadeh, S.; Aliofkhazraei, M.; Sarlak, H. Interpretation of cyclic potentiodynamic polarization test results for study of corrosion behavior of metals: A review. Prot. Met. Phys. Chem. Surfaces 2018, 54, 976–989. [Google Scholar] [CrossRef]
  44. Freire, L.; Carmezim, M.J.; Ferreira, M.G.S.; Montemor, M.F. The electrochemical behaviour of stainless steel AISI 304 in alkaline solutions with different pH in the presence of chlorides. Electrochim. Acta 2011, 56, 5280–5289. [Google Scholar] [CrossRef]
  45. Zhang, W.; François, R.; Cai, Y.; Charron, J.P.; Yu, L. Influence of artificial cracks and interfacial defects on the corrosion behavior of steel in concrete during corrosion initiation under a chloride environment. Constr. Build. Mater. 2020, 253, 119165. [Google Scholar] [CrossRef]
  46. Ralston, K.D.; Birbilis, N. Effect of grain size on corrosion: A review. Corrosion 2010, 66, 75005–75013. [Google Scholar] [CrossRef]
  47. Katiyar, P.K.; Misra, S.; Mondal, K. Comparative corrosion behavior of five microstructures (pearlite, bainite, spheroidized, martensite, and tempered martensite) made from a high carbon steel. Metall. Mater. Trans. A 2019, 50, 1489–1501. [Google Scholar] [CrossRef]
  48. Zhou, C.; Hu, S.; Shi, Q.; Tao, H.; Song, Y.; Zheng, J.; Xu, P.; Zhang, L. Improvement of corrosion resistance of SS316L manufactured by selective laser melting through subcritical annealing. Corros. Sci. 2020, 164, 108353. [Google Scholar] [CrossRef]
  49. Guidelli, R.; Compton, R.G.; Feliu, J.M.; Gileadi, E.; Lipkowski, J.; Schmickler, W.; Trasatti, S. Defining the transfer coefficient in electrochemistry: An assessment. Pure Appl. Chem. 2014, 86, 245–258. [Google Scholar] [CrossRef] [Green Version]
  50. Bastidas, D.M. Interpretation of impedance data for porous electrodes and diffusion processes. Corrosion 2007, 63, 515–521. [Google Scholar] [CrossRef]
  51. Martin, U.; Ress, J.; Bosch, J.; Bastidas, D.M. Stress corrosion cracking mechanism of AISI 316LN stainless steel rebars in chloride contaminated concrete pore solution using the slow strain rate technique. Electrochim. Acta 2020, 335, 135565. [Google Scholar] [CrossRef]
  52. Ribeiro, D.V.; Abrantes, J.C. Application of electrochemical impedance spectroscopy (EIS) to monitor the corrosion of reinforced concrete: A new approach. Constr. Build. Mater. 2016, 111, 98–104. [Google Scholar] [CrossRef]
  53. Huang, J. Diffusion impedance of electroactive materials, electrolytic solutions and porous electrodes: Warburg impedance and beyond. Electrochim. Acta 2018, 281, 170–188. [Google Scholar] [CrossRef]
  54. Brug, G.J.; van den Eeden, A.L.G.; Sluyters-Rehbach, M.; Sluyters, J.H. The analysis of electrode impedances complicated by the presence of a constant phase element. J. Electroanal. Chem. Interfacial Electrochem. 1984, 176, 275–295. [Google Scholar] [CrossRef]
  55. Fajardo, S.; Llorente, I.; Jiménez, J.A.; Bastidas, J.M.; Bastidas, D.M. Effect of Mn additions on the corrosion behaviour of TWIP Fe-Mn-Al-Si austenitic steel in chloride solution. Corros. Sci. 2019, 154, 246–253. [Google Scholar] [CrossRef]
  56. Huang, V.M.-W.; Vivier, V.; Orazem, M.E.; Pébère, N.; Tribollet, B. The apparent constant-phase-element behavior of a disk electrode with faradaic reactions. J. Electrochem. Soc. 2007, 154, C99. [Google Scholar] [CrossRef] [Green Version]
  57. Hirschorn, B.; Orazem, M.E.; Tribollet, B.; Vivier, V.; Frateur, I.; Musiani, M. Determination of effective capacitance and film thickness from constant-phase-element parameters. Electrochim. Acta 2010, 55, 6218–6227. [Google Scholar] [CrossRef]
  58. Martin, U.; Ress, J.; Bosch, J.; Bastidas, D.M. Long-term stability and electronic properties of passive film of lean-duplex stainless steel reinforcements in chloride containing mortar. Constr. Build. Mater. 2021, 123319. [Google Scholar] [CrossRef]
  59. Handoko, W.; Pahlevani, F.; Sahajwalla, V. Enhancing corrosion resistance and hardness properties of carbon steel through modification of microstructure. Materials 2018, 11, 2404. [Google Scholar] [CrossRef] [Green Version]
Figure 1. Setup used for the study: (a) thermomechanical treatment schematic, and (b) electrochemical cell.
Applsci 11 04054 g001
Figure 2. Micrography of rebars after thermomechanical treatments (×100): As received ((a) center, (b) edge, Annealing ((c) center, (d) edge), and Normalizing ((e) center, (f) edge).
Applsci 11 04054 g002
Figure 3. Micrography of rebars after thermomechanical treatments (×100): Water quenched ((a) center, (b) edge), Oil quenched ((c) center, (d) edge), subcritical annealing after water quenching ((e) center, (f) edge), and subcritical annealing after oil quenching ((g) center, (h) edge).
Applsci 11 04054 g003
Figure 4. Open circuit potential obtained during 1 h for the sample exposed to FA pore solution containing 0.6 M NaCl with: (a) slow cooling rate, and (b) fast cooling rate.
Applsci 11 04054 g004
Figure 5. CPP of thermal treated CS specimens in FA pore solution containing 0.6 M NaCl: (a) slow cooling rate, and (b) fast cooling rate.
Applsci 11 04054 g005
Figure 6. Kramers-Kronig (KK) transforms of Annealed CS rebar exposed to FA pore solution containing 0.6 M NaCl.
Applsci 11 04054 g006
Figure 7. Nyquist plots of the thermomechanical treated CS rebars in FA pore solution containing 0.6 M NaCl: (a) slow cooling rate, and (b) fast cooling rate.
Applsci 11 04054 g007
Figure 8. Proposed electrical equivalent circuit (EEC) to fit the EIS data.
Applsci 11 04054 g008
Figure 9. Bode plots of the thermomechanical treated CS rebars in FA pore solution containing 0.6 M NaCl: (a) slow cooling rate, and (b) fast cooling rate.
Applsci 11 04054 g009
Figure 10. Evolution of Ceff,dl and Rct parameters for each thermomechanical treatment in FA pore solution containing 0.6 M NaCl.
Applsci 11 04054 g010
Figure 11. Optical microscopies of thermomechanically treated samples after testing in FA pore solution containing 0.6 M NaCl (×5): (a) As received, (b) Annealing, (c) Normalizing, (d) Water quenching, (e) Oil quenching, (f) subcritical annealing after water quenching, and (g) subcritical annealing after oil quenching.
Applsci 11 04054 g011
Figure 12. IFM microscopies of thermomechanically treated samples after testing in FA pore solution containing 0.6 M NaCl (×5): (a) As received, (b) Annealing, (c) Normalizing, (d) Water quenching, (e) Oil quenching, (f) subcritical annealing after water quenching, and (g) subcritical annealing after oil quenching.
Applsci 11 04054 g012
Table 1. CS elemental composition in wt.%.
CMnSCuPNiCrSiMoVFe
0.281.080.0430.370.0190.160.160.200.0500.0379Bal.
Table 2. Ecorr and icorr parameters obtained via CPP of CS samples in FA pore solution (pH 13.6).
Specimenicorr
(A/cm2)
Ecorr
(VSCE)
βa
(V/dec)
βc
(V/dec)
B
(mV)
αaαci0,ORR
(A/cm2)
As-received2.13 × 10−6−0.5000.0910.18126.330.2820.1425.91 × 10−8
Normalized1.84 × 10−6−0.4230.2650.20850.670.0970.1241.77 × 10−8
Annealed2.09 × 10−5−0.5610.2520.26956.570.1020.0961.18 × 10−9
Water quenched3.18 × 10−5−0.4960.2920.29563.800.0880.0874.86 × 10−9
Oil quenched2.20 × 10−5−0.5040.2840.27160.290.0910.0954.12 × 10−9
WQ + Sub. Annealing2.18 × 10−6−0.5920.1820.23144.260.1410.1113.48 × 10−9
OQ + Sub. Annealing2.77 × 10−6−0.6150.2320.24551.810.1110.1051.79 × 10−9
Table 3. EIS fitting parameters of CS samples in FA pore solution (pH 13.6).
SpecimenRs
Ω cm2
Rfilm
Ω cm2
Yfilm
µS/cm2 sn,film
nfilmRct
Ω cm2
Ydl
S/cm2 sn,dl
ndlCeff,dl
µF/cm2
χ2 (*)
As-received13.3457.382.20.9151542.44 × 10−30.811.11 × 10−35.51 × 10⁻⁴
Normalized16.2131.9162.50.8778145.23 × 10−30.823.06 × 10−32.18 × 10⁻⁴
Annealed16.6174.1170.00.8442251.37 × 10−30.774.38 × 10−44.19 × 10⁻⁴
Water quenched12.9241.5207.90.8825001.86 × 10−30.828.12 × 10−42.83 × 10⁻⁴
Oil quenched13.2123.9109.70.8333263.10 × 10−30.791.35 × 10−31.54 × 10⁻⁴
WQ+Sub. Annealing14.9151.779.60.8927022.41 × 10−30.891.61 × 10−31.11 × 10⁻⁴
OQ+Sub. Annealing13.1131.371.10.9035451.99 × 10−30.921.42 × 10−32.44 × 10⁻⁴
* Error < 10%.
Publisher’s Note: MDPI stays neutral with regard to jurisdictional claims in published maps and institutional affiliations.

