Article

Emotion Recognition: An Evaluation of ERP Features Acquired from Frontal EEG Electrodes

Department of Electrical and Instrumentation Engineering, Thapar Institute of Engineering and Technology, Patiala 147004, India
*
Author to whom correspondence should be addressed.
Appl. Sci. 2021, 11(9), 4131; https://doi.org/10.3390/app11094131
Submission received: 13 March 2021 / Revised: 11 April 2021 / Accepted: 26 April 2021 / Published: 30 April 2021
(This article belongs to the Section Applied Biosciences and Bioengineering)

Abstract

:
The challenge to develop an affective Brain Computer Interface requires the understanding of emotions psychologically, physiologically as well as analytically. To make the analysis and classification of emotions possible, emotions have been represented in a two-dimensional or three-dimensional space represented by arousal and valence domains or arousal, valence and dominance domains, respectively. This paper presents the classification of emotions into four classes in an arousal–valence plane using the orthogonal nature of emotions. The average Event Related Potential (ERP) attributes and differential of average ERPs acquired from the frontal region of 24 subjects have been used to classify emotions into four classes. The attributes acquired from the frontal electrodes, viz., Fp1, Fp2, F3, F4, F8 and Fz, have been used for developing a classifier. The four-class subject-independent emotion classification results in the range of 67–83% have been obtained. Using three classifiers, a mid-range accuracy of 85% has been obtained, which is considerably better than existing studies on ERPs.

1. Introduction

Emotion is a central pillar upholding the social-psychological phenomenon. Broadly speaking, emotion may be taken as a feeling other than physical sensation. To quantify emotions, it is necessary to define this psychological phenomenon in a descriptive as well as a prescriptive manner. To sharpen perspectives on emotion, Izard [1] surveyed prescriptive definitions of emotion, its activation and regulation as well as connections between emotion, cognition and action. Izard [1] suggested that emotion consists of neural circuits, response systems, and a feeling state which prompted action, and there was a rapid and automatic connection between cognition and emotion. While the study [1] focused more on the scientific concept of emotion, Widen and Russell [2] stressed the necessity of describing emotions in a descriptive manner. However, from a biomedical engineer’s point of view, a prescriptive definition is the better option, as it is a definition of the concept or construct of emotion that is used to pick out the set of events that a scientific theory of emotion purports to explain. Emotion is most commonly defined as a short and intense reaction of humans occurring on account of a stimulus. The stimulus acts as an input to the human brain, which makes a person experience different feelings such as joy, anger, love, hate, horror, etc. [3]. Recently, some studies have stressed the development of a motivational model of neural circuitry for studying emotions of mammalian species and extending the studies to animals or non-human species to understand the emotions in a better way [4,5,6]. In humans, the occurrence of emotion may bring a noticeable change in physiological parameters such as respiration rate, heart rate, Galvanic Skin Resistance (GSR), body temperature and ElectroEncephaloGram (EEG), etc. Changes in physical parameters such as the color of the skin, eye gaze, eye blink rate and the shape of the face are also perceived. Different theorists have defined the cause and effect of emotions differently. The social psychologists argue that perception, memory, problem solving, judgment, attitudinal changes and task performance, etc., are immensely influenced by emotion [7,8]. Clearly, it is really interesting to comprehend the emotional signaling through expressive behavior. The dependency of human life more on emotions than on physical comforts makes it necessary to study emotions. Further, several psychologists have propounded that emotions play a major role in establishing and nurturing social relationships such as friendships and marriages, and emotions influence decision-making [9,10,11,12]. Additionally, the subjective experiences of an emotion expressed as a state of pleasure or displeasure with some degree of arousal form the basis of emotional modeling and classification [13,14]. The use of EEG clinically for the diagnosis of various neurological disorders such as epilepsy, dementia and Alzheimer’s is well established through various studies [15,16]. In this study, the EEG signals acquired from frontal electrodes have been used for developing a subject-independent four class emotion classifier.

2. Recent Studies

The classification of emotions from the parameters acquired from bodily signals has become possible with the establishment of models describing the changes in physiological signals with the occurrence of an emotion [17,18,19]. Savran et al. [20] acquired brain activity using Functional Near-Infrared Spectroscopy (fNIRS), face video, and brain signals using EEG and peripheral signals such as respiration rate, cardiac rate, and GSR with the primary objective of creating a multimodal database. The data were acquired in an eNTERFACE workshop in 2006 and are available online. This database has been used by various researchers for analyzing emotions, wherein it was found that the emotion classification accuracy improved as the number of classes to be classified was reduced [21].
An important study which forms the basis of our work is the study performed by Frantzidis et al. [22]. The researchers classified neurophysiological data into four emotional classes, namely, high-valence high-arousal (HVHA), low-valence high-arousal (LVHA), high-valence low-arousal (HVLA) and low-valence low-arousal (LVLA), using average ERP and event-related oscillation features from the acquired EEG signals. For developing a subject-independent emotion classifier, the average ERP features were acquired from Fz, Cz and Pz electrodes only. The emotions were classified into four classes by first classifying emotions into low arousal and high arousal classes and then using two separate classifiers to classify low arousal and high arousal data along the valence axis. The researchers used three emotion classifiers to classify four classes of emotions. It is a common belief that the number of wrong indices incorrectly classified by each classifier must be specified when more than one classifier is used for classifying more than two classes. Additionally, since high accuracy results (81.3%) were reported in this study, the methodology of their data acquisition and analysis has been used in our study as well for the comparison and validation of results. However, when validating this classifier model, we found that the critical discussion of results is necessary before proposing this accuracy.
Petrantonakis and Hadjileontiadis [23] used images from the Pictures of Facial Affect database [24] to acquire EEG. The classification of emotions was performed in a one versus all approach using SVM polynomial classifiers and Higher Order Crossing (HOC) features. Therefore, analyzing the data of 16 subjects on a single electrode would mean lower samples for training and testing. Jenke et al. [25] validated that emotion classification results are better with HOC features, but the classification accuracies were not as high as reported in [23]. We have clearly described the total number of test samples for each class of emotion in our proposed study, which we found missing in [23]. Further, if we go by the emotional states chosen, happiness could be an emotion that may be a mixture of two or more emotions such as joy and bliss and may thus lie in the first or fourth quadrant in the arousal–valence plane. Thus, we feel an initial classification into the arousal–valence plane can form the basis of classification of emotions further in a particular quadrant.
The features determined from EEG signals by decomposing them into different frequency bands have been used by a number of researchers to classify emotions [26,27,28,29,30,31]. Jenke et al. [25], however, found no major difference among the attributes used in [28].
Koelstra et al. [32] in their seminal work not only analyzed the single trial EEG signals for the classification of emotions along the arousal and valence axis, but also generated the Database for Emotion Analysis using Physiological Signals (DEAP database) for the classification of emotions. While analyzing EEG signals, the authors found a high correlation between valence and brain signals. From the classification results, it was found that arousal was better classified with EEG features, valence with peripheral and like/dislike with video features. It was easier to classify valence as compared to arousal. Some recent studies conducted on DEAP data are by Soroush et al. [33], Liang et al. [34] and Kong et al. [35]. In [33], the DEAP EEG database was used to classify emotions into four classes (HVHA, HVLA, LVLA and LVHA). The study was also subject-dependent and high results on the data were reported only at the cost of computational complexity for acquiring attributes and time inefficient algorithms [34]. Kong et al. [35] used three types of emotion classifiers on the attributes acquired from the DEAP EEG database to classify emotions into two classes along arousal and valence domains.
Koelstra and Patras [36] performed the affective tagging of multimedia by using a multimodal approach. For emotion classification, the EEG signals and video data acquired in the MAHNOB HCI interface were used [37]. The authors added Fp1 and Fp2 electrodes in the described set of electrodes for the classification of arousal, valence and control and used the Recursive Feature Elimination (RFE) technique and Independent Component Analysis (ICA) technique for feature selection. However, some of the conclusions related to this study were countered in another study [38].
Jenke et al. [25] tested features collected as per the 33 previous studies on EEG-based emotion recognition and found that the features such as HOC [23], fractal dimension and Hjorth parameters and features obtained from frequency bands β and γ gave better emotion classification accuracies [29,39]. Considering that the ERP extraction requires the averaging of multiple numbers of EEG signals, the ERP feature was not considered in this subject-dependent study [25].
It was found that classifying emotions on the basis of attributes determined from facial expressions produced higher accuracy results as compared to the classification of emotions based on EEG attributes [38]. These results are in contrast to the study which showed better emotion classification results with EEG as compared to facial expressions [36]. Another important observation was that the facial expressions on account of the emotional stimulus affect the emotional sensitive features of EEG, and a strong correlation was found between the features obtained from facial expressions and the features from EEG used in the detection of valence [38]. Hwang et al. [40] used the SEED dataset for developing a subject-dependent emotion classifier. The classification of emotions was carried out into three classes, namely, neutral, positive and negative, using Convolutional Neural Networks (CNN). These studies are too computationally intensive and less depictive about subject-dependent emotion classification studies, making it very difficult to validate [33,34,40]. Singh and Singh [41] used average ERP attributes obtained from central electrodes Fz, Cz and Pz and followed the same preprocessing and feature extraction methods as in [22]. The subject-independent emotion classification accuracy lied between 75 and 76.8% using a Support Vector Machine (SVM) polynomial classifier on 14 male subjects. A review of some major studies performed recently is shown in Table 1.
The above review of studies clearly shows that the emotion classification results vary as the classification and/or feature selection technique changes. Soleymani et al. [38] found the lowest accuracy results with EEG as compared to Koelstra and Patras [36], where the valence classification was found to be more precise with EEG. Even the facial expression results obtained in a study by Soleymani et al. [37] and Soleymani et al. [38] are not similar. All three studies show how important it is to validate the results on emotion classification, and the results and predictions can vary with electrode selection, feature selection and pattern classification techniques.
Since higher emotion classification results have been reported by Frantzidis et al. [22] on central electrodes and studies by Koelstra et al. [36] and Soleymani et al. [38] reported different results on the same data, an effort has been made to analyze and validate emotion classification with ERPs acquired from the frontal region of the brain. The study added Fp1 and Fp2 electrodes in the already determined best suitable set of electrodes [36]. We determined the effect of including Fp1 and Fp2 in the set of selected electrodes when classifying emotions along arousal and valence domains.

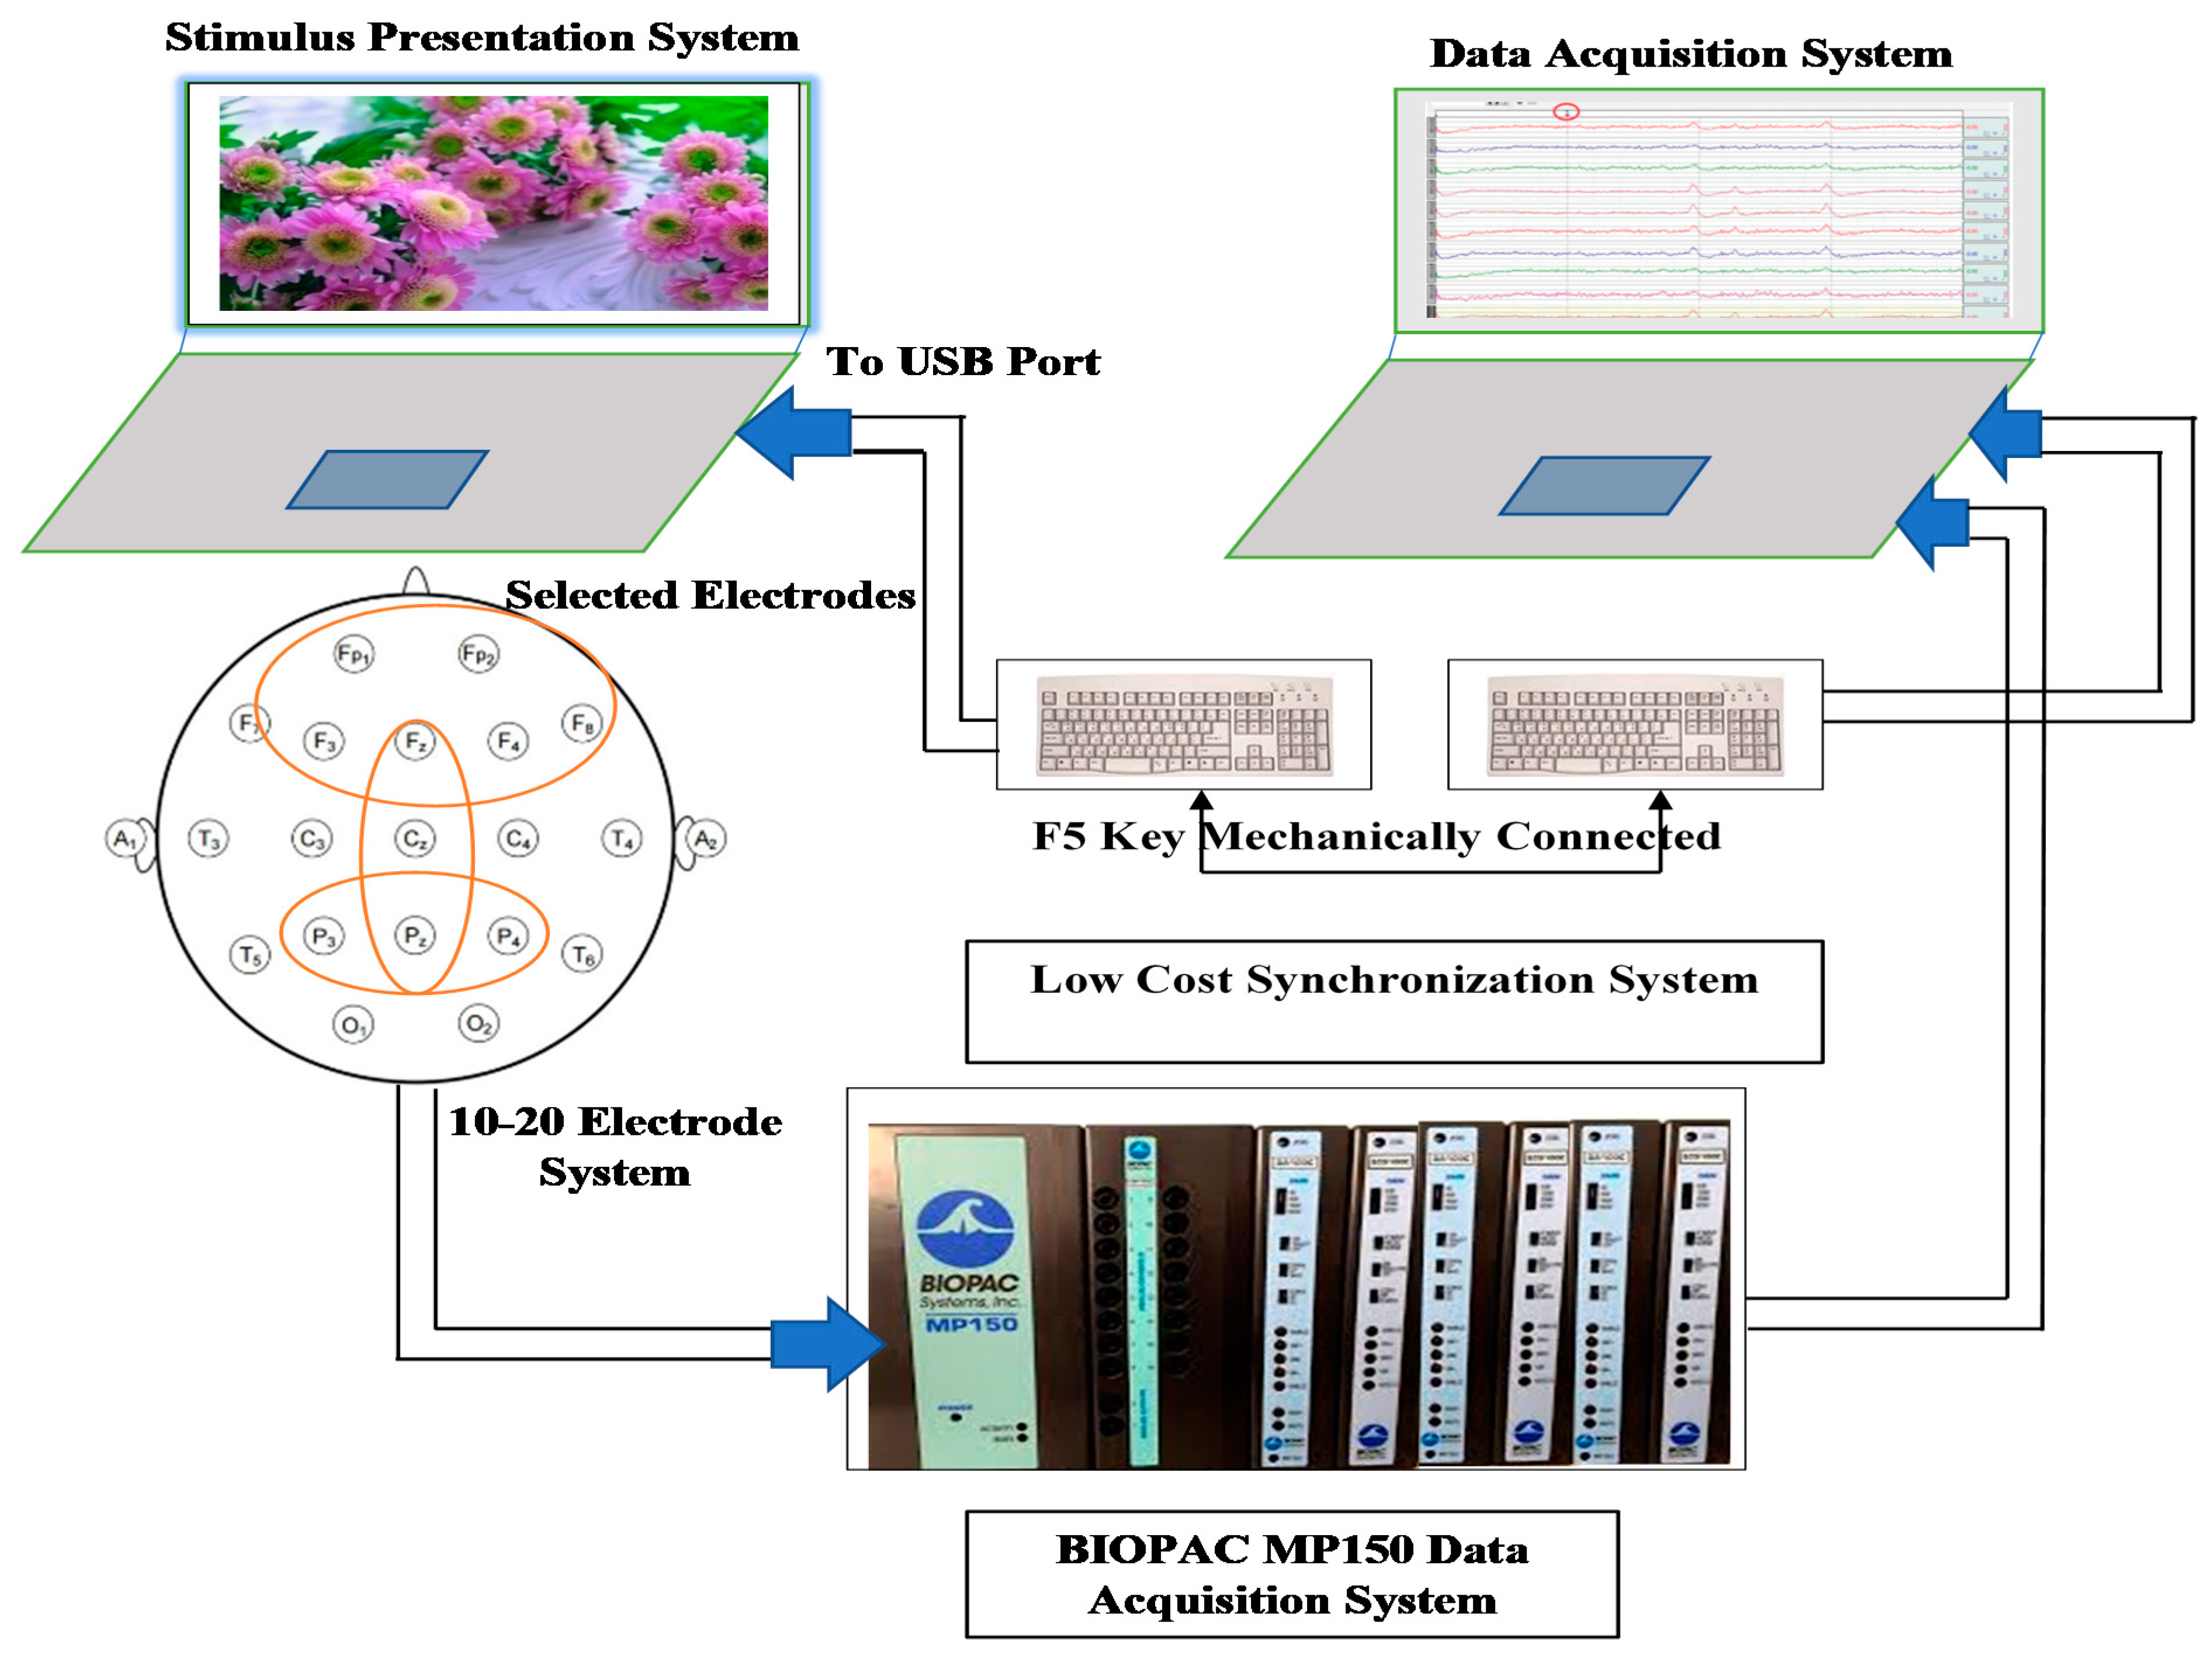
3. EEG Data Acquisition Methodology

The classification of emotions along any of the domains, viz., arousal, valence and dominance, is possible by utilizing the orthogonal nature of emotions. To evoke emotions, the visuals from the International Affective Picture System (IAPS) were used [51]. The acquisition of ERP features requires the projection of an emotion-evoking stimulus on one computer system while simultaneously putting a mark on the second computer system acquiring EEG. A low-cost synchronization technique using two keyboards with a galvanically connected key was used in our experiments to synchronize EEG signals with the emotion-evoking stimulus [52].
The experimentation performed is totally noninvasive and has approval from the University Ethics Committee. The EEG signals have been acquired using the MP150 data acquisition system provided by Biopac (please see https://www.biopac.com/product/mp150-data-acquisition-systems/ (accessed on 9 February 2021) for more details). The EEG cap EEG100C consists of 20 Ag/AgCl electrodes placed according to 10–20 International System. The EEG signals have been acquired from 10 electrodes, namely, Fz, Cz, Pz, Fp1, Fp2, F3, F4, P3, P4 and F8, in unipolar mode. The reference electrode has been fitted on the left mastoid. EEG signals time locked with the stimulus presented to subjects were acquired. To achieve this objective, we used two mechanical keyboards and mechanically connected the F5 function key of both the keyboards. We programmed and ran the Neurobs Presentation System in such a manner that pressing F5 starts the stimulus on one computer system while simultaneously inserting an event mark on data being acquired using Biopac provided Acq 4.2. Figure 1 shows the experimentation technique used for the acquisition of evoked EEG signals.
Students from Thapar University above the age of 18 years and below 24 years volunteered to be our subjects. All the subjects were right-handed males with normal to corrected vision and none had any history of psychological illness. The process of acquisition was started after apprising the subjects about the source of images, the type of images as we did not reject arousal (above 18 years) images in the HVHA category, the acquisition protocol and the type of emotions we aimed to evoke for classification. The subjects signed an undertaking in this regard that they understand the procedure of EEG data acquisition which, of course, is totally non-invasive and they are voluntarily appearing for data acquisition. They also understood that some of the images are in the above 18 years category. We also acknowledged that their names would not be disclosed after experimentation. The given experiment is non-invasive and is approved by the university ethics committee. The emotion classification results have been obtained by acquiring data from frontal EEG electrodes, viz., Fp1, Fp2, F3, F4, F8 and Fz.

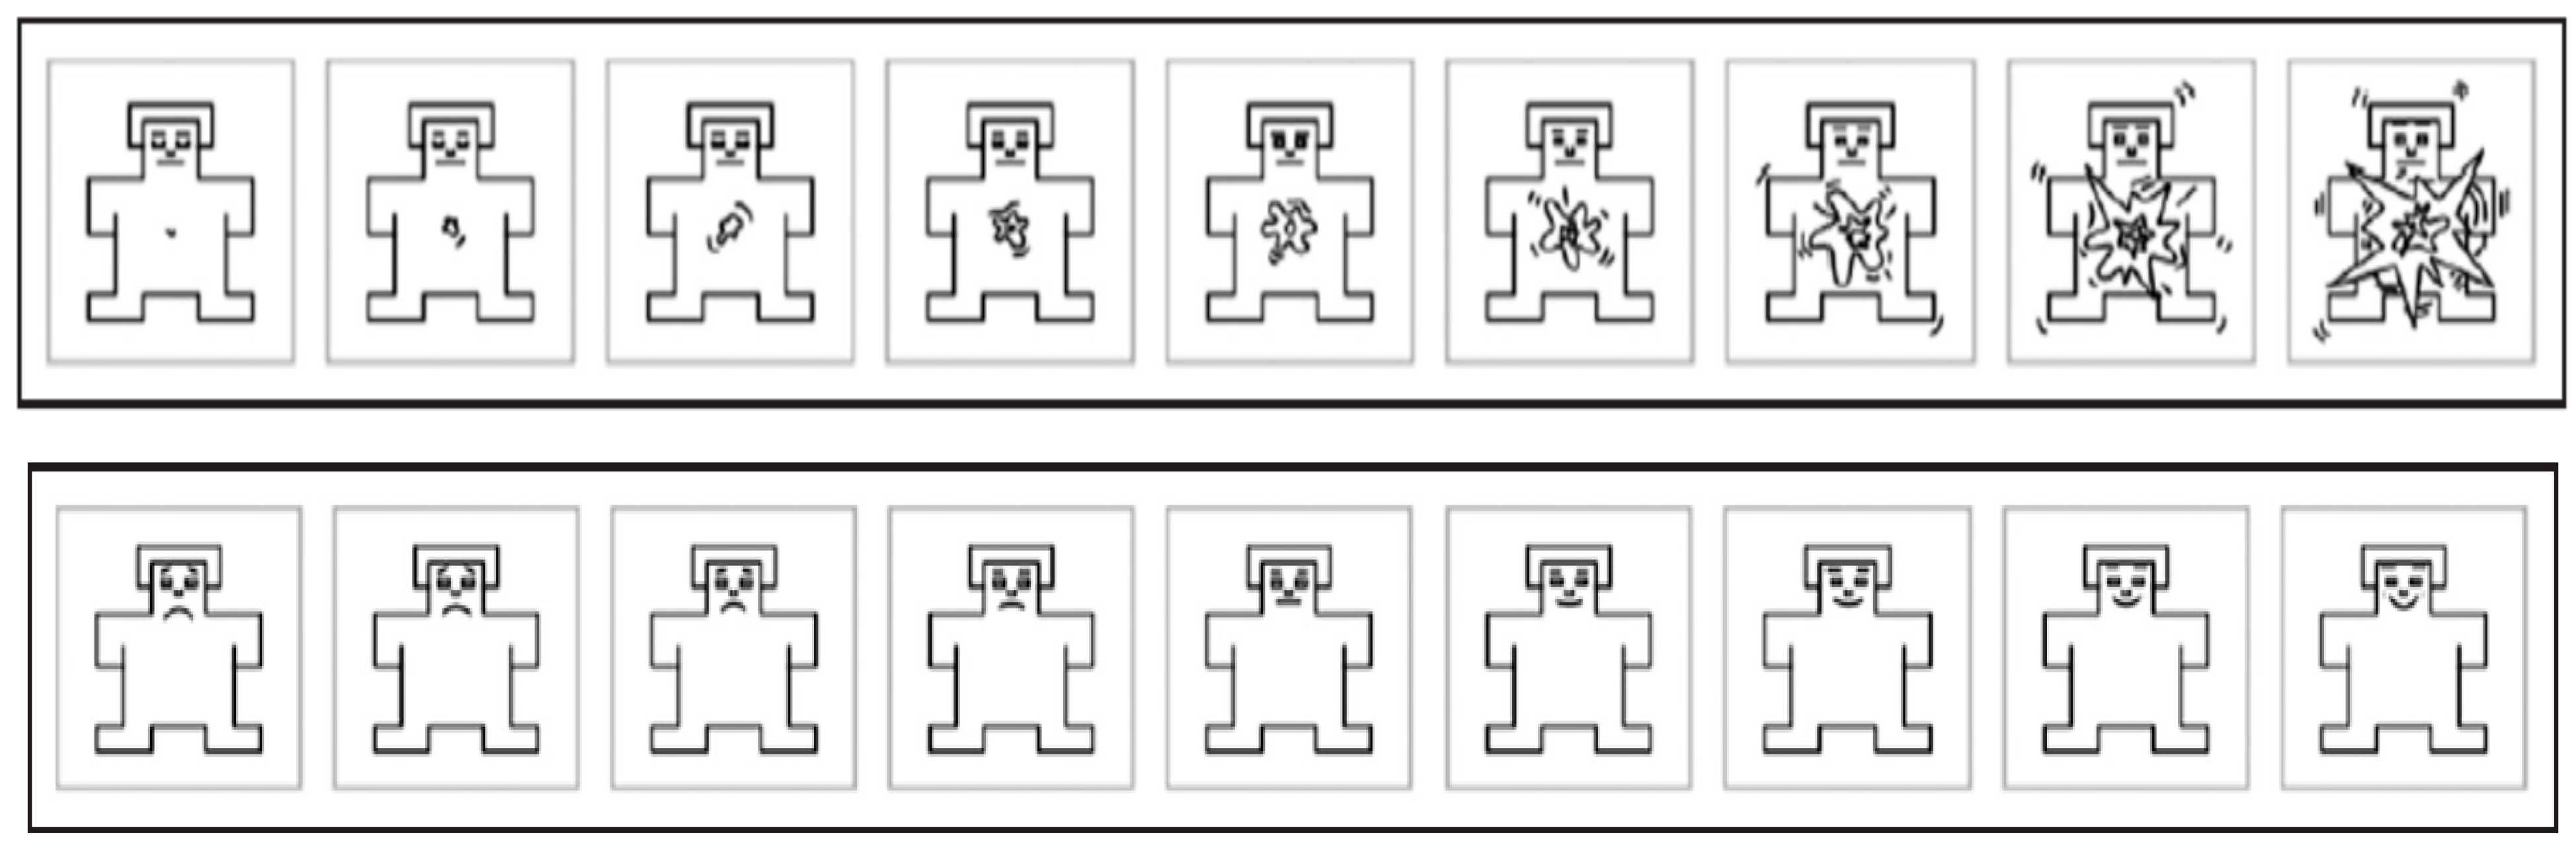
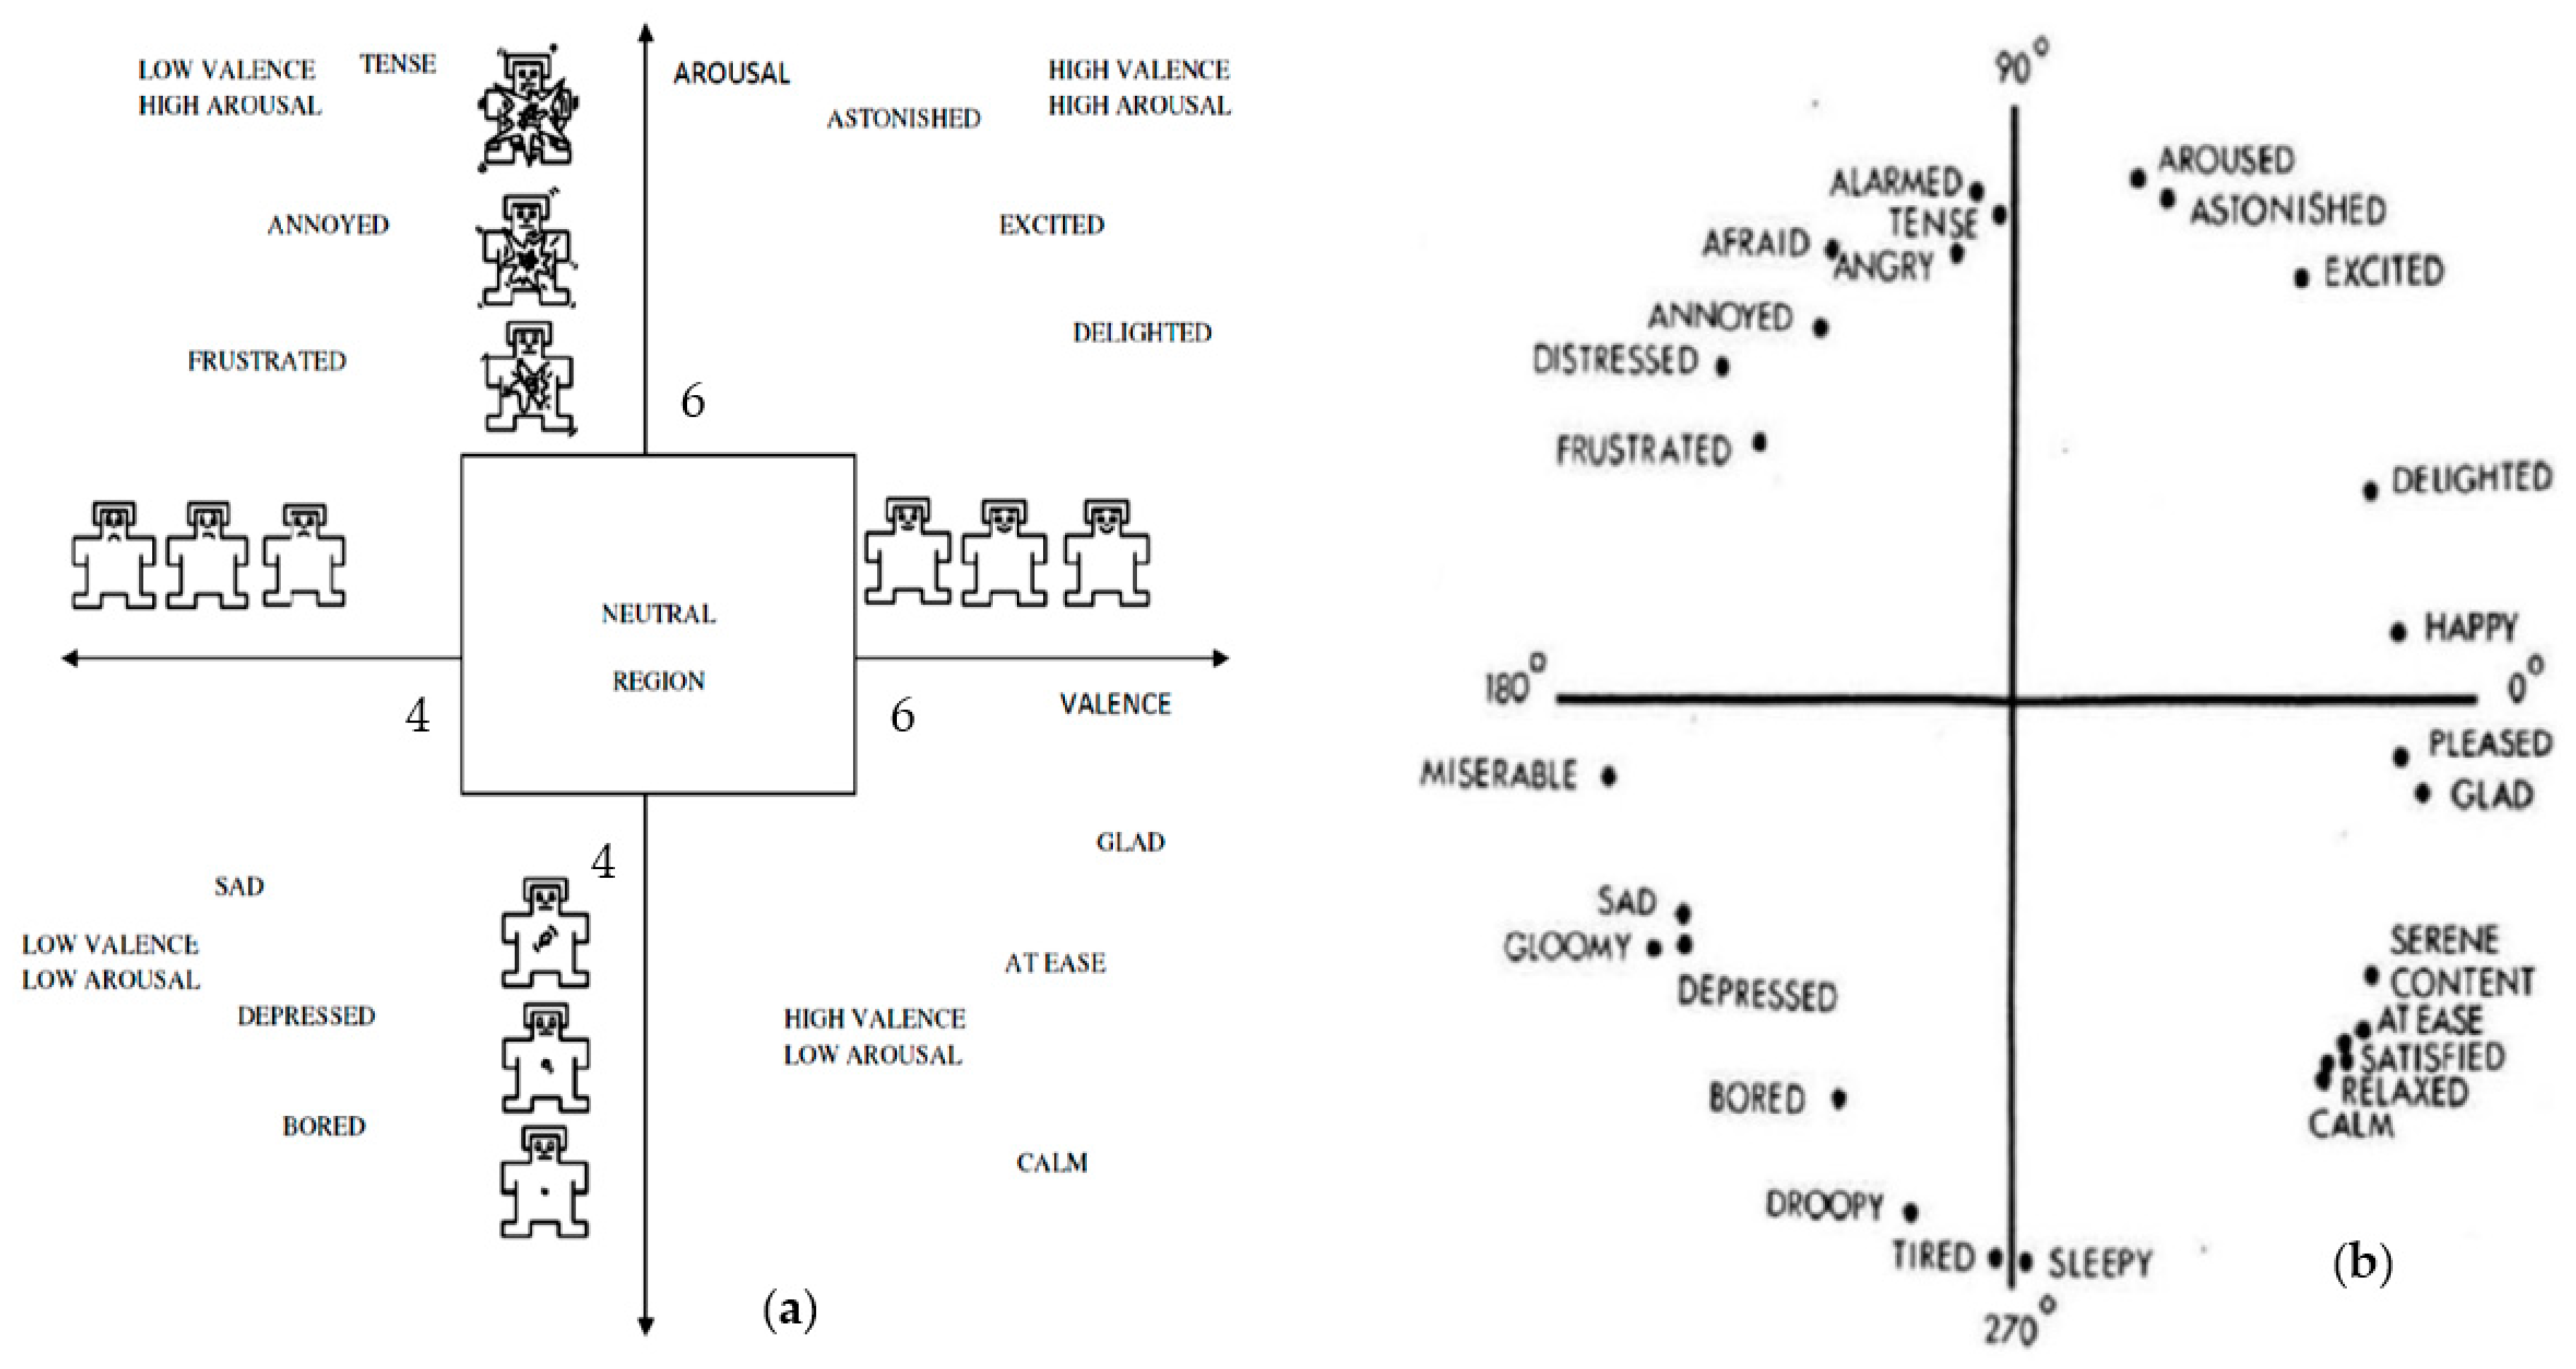
4. Selection of Emotion-Evoking Stimulus

Emotion has four basic classes, viz., LVHA, HVHA, HVLA, and LVLA. For each class of emotion, 40 images from the IAPS set were selected on the basis of their mean arousal and mean valence ratings. Thus, a total of 160 images were shown to a subject for evoking emotions in this experiment. For low arousal/valence, the images were below the mean rating of 4, whereas for high arousal/valence, images above the mean rating of 6 were selected. Some of the images, especially belonging to LVLA, had to be repeated.
For emotion evocation, an IAPS picture belonging to that class was shown to the subjects for 1 s followed by a black screen for a subsequent 1.5 s, thus totaling to 2.5 s for an epoch. Simultaneously, EEGs from all the electrodes, namely, Fp1, Fp2, F3, F4, F8, Fz, Cz, Pz, P3 and P4, were acquired through a proper marker indicating the start of an epoch. In this study, the data from frontal electrodes—Fp1, Fp2, F3, F4, F8, Fz—have been analyzed. IAPS pictures are pre classified as LVHA, HVHA, HVLA and LVLA images. A set of pictures taking one from each category was created and shown in 2.5 × 4 = 10 s. Forty such sets (one set is of four images) were shown in continuity, in 400 s. To rule out any exceptional case where the emotion evoked in the subject may not be in agreement with the pre classified IAPS picture, the self-assessment of the subjects was taken through self-assessment manikins (SAM) as shown in Figure 2 on a scale of 1 to 9 after the data acquisition. Prior to the data acquisition, the subjects were trained on how the emotions are classified. Figure 3 shows the methodology used for training the subjects on how emotions can be classified into four quadrants along the arousal–valence plane.

Subse

Some specific emotions from Russell’s model of circumplex were used for the better understanding of emotions [53]. This representation of emotions in a two-dimensional plane has also been modified by Stanley and Meyer [54]. This training technique helped in achieving a good correlation between the IAPS ratings and the ratings given by our subjects, as shown in Figure 4. The correlation value was well above 0.8 for both arousal and valence [55].
Apart from [54], various other studies have analyzed and modified the Circumplex model of affect [56,57]. Watson et al. [57] analyzed that the affect ratings tend to form an ellipse rather than a circle, which showed that valence affects mood more than arousal.

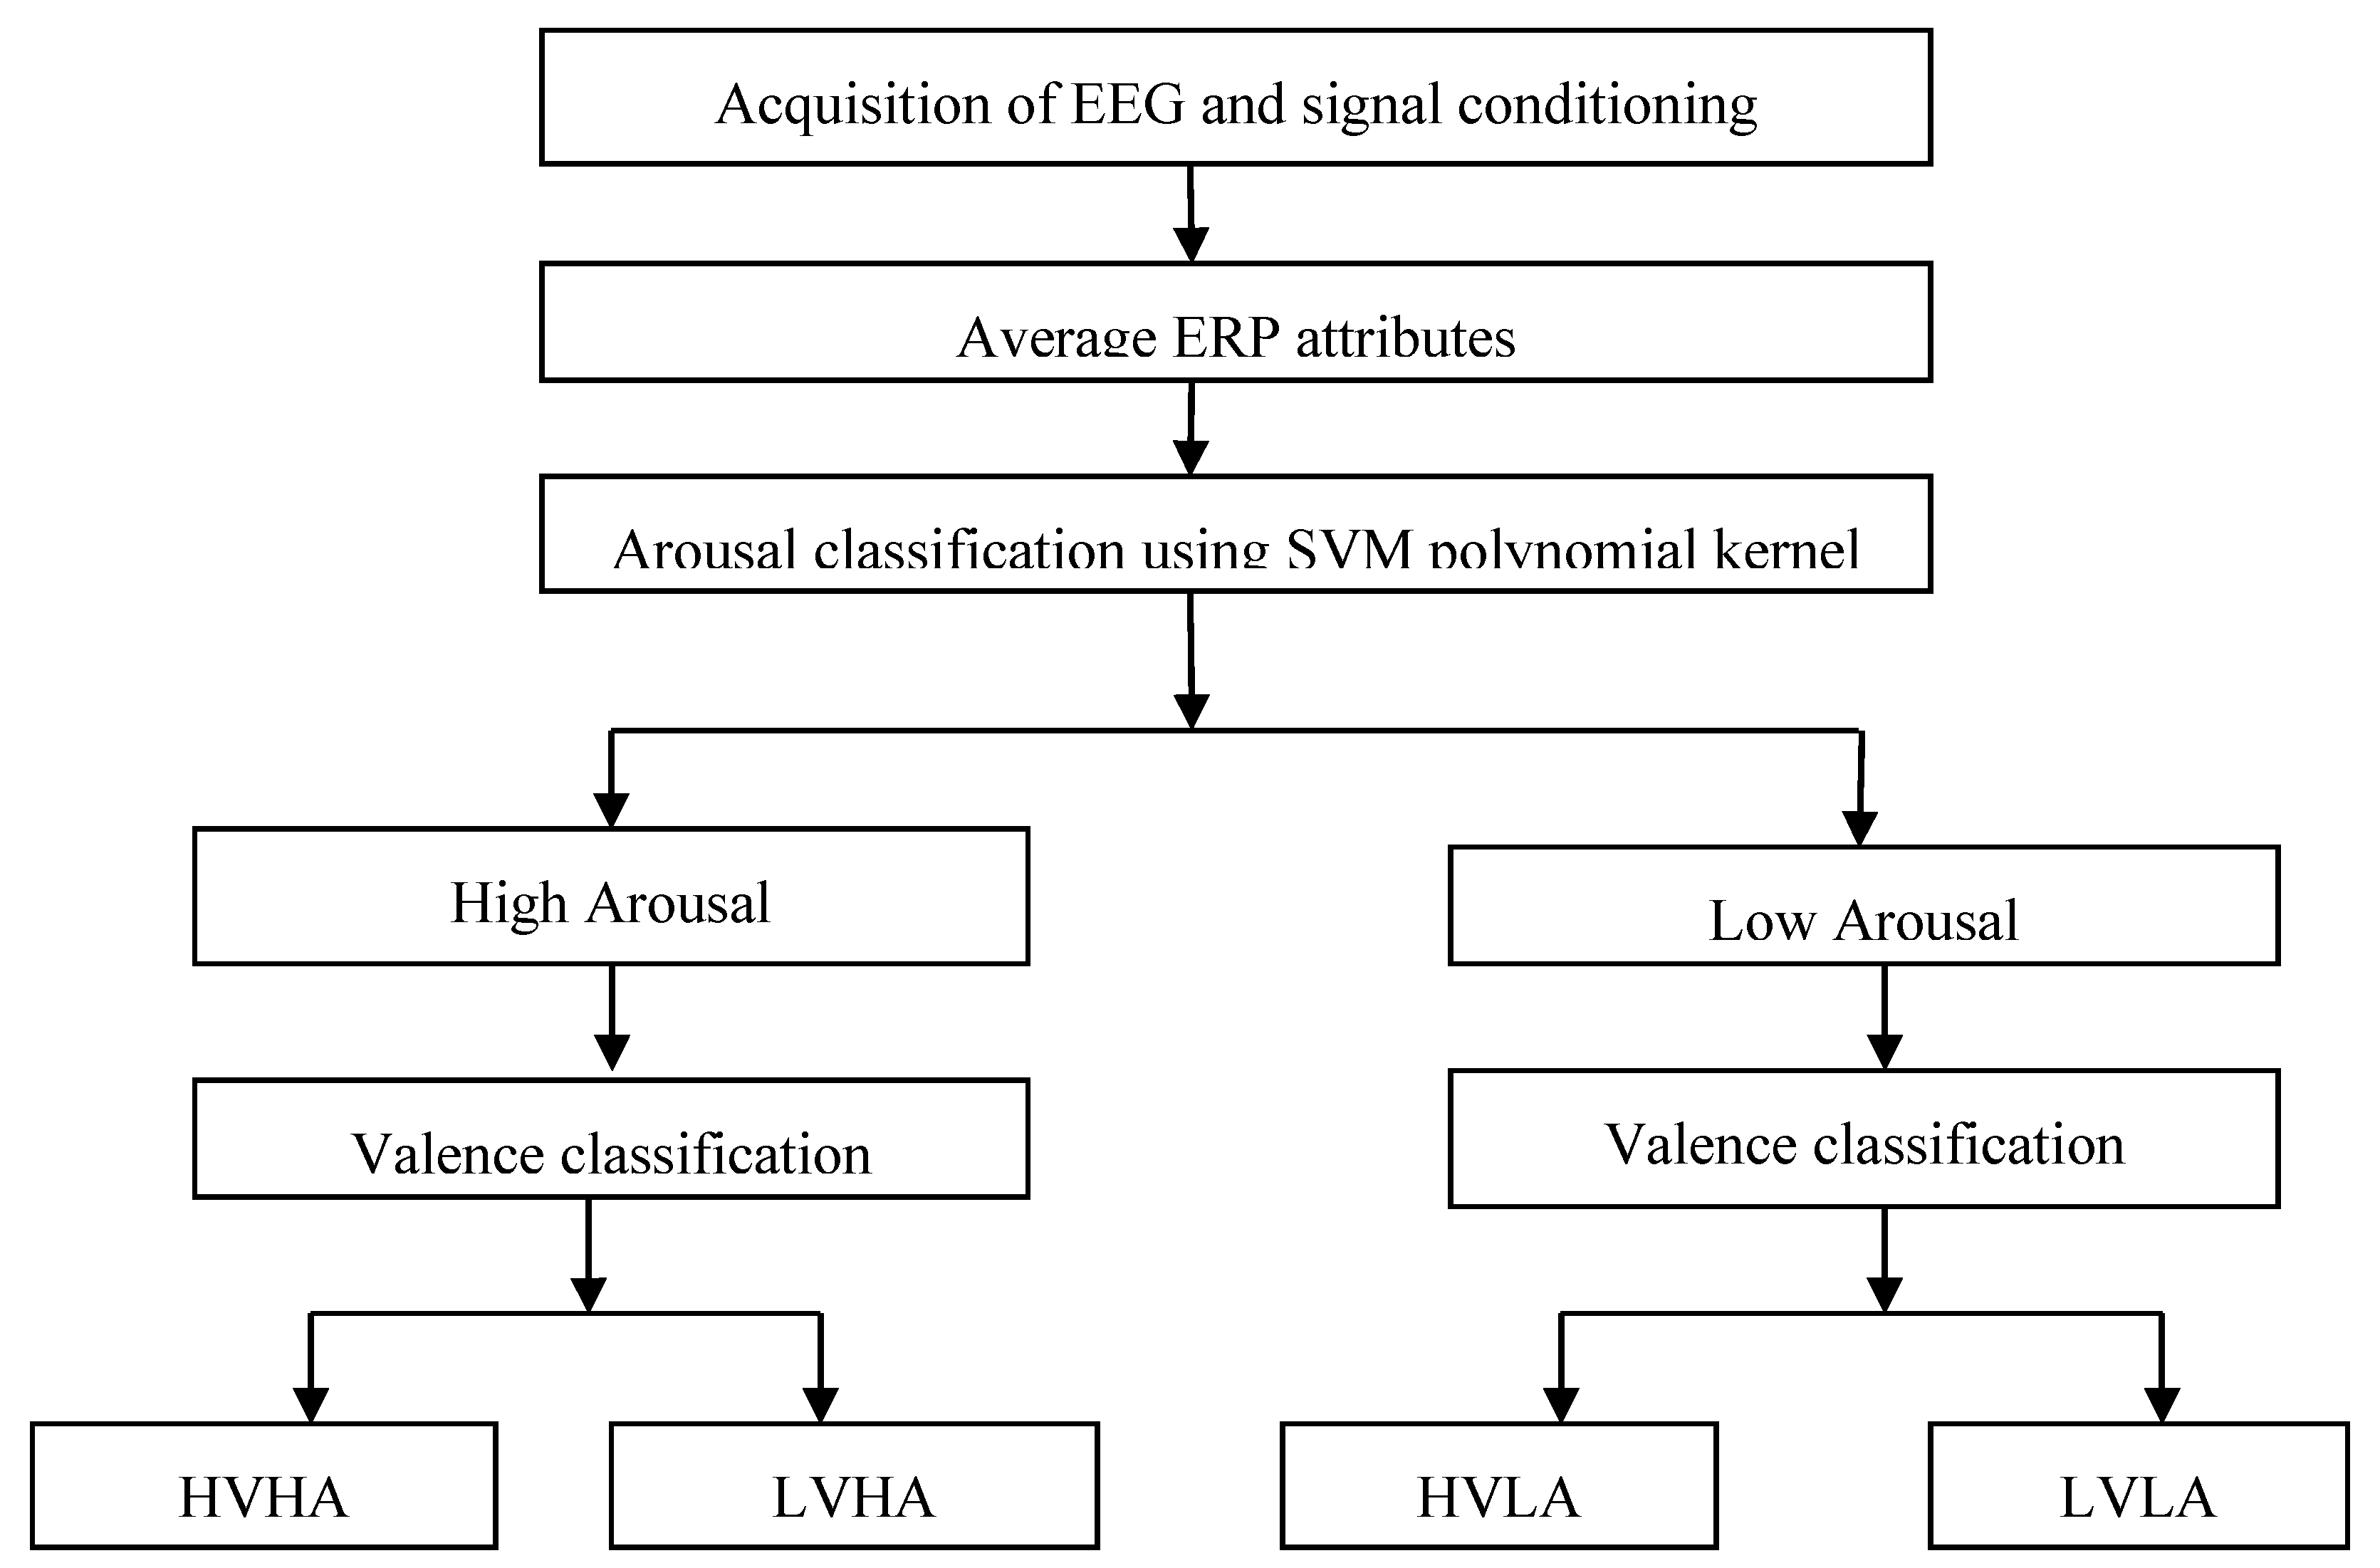
5. Preprocessing Operations on EEG and Feature Selection

The offline filtering operations have been performed on EEG signals. The filtering operations are also influenced by the study that showcased the highest results obtained when using ERPs as attributes [22]. To remove the interfering power noise, a notch filter has been used to remove power noise of 50 Hz. To obtain the EEG signals in a frequency range of 0.5 to 40 Hz, an IIR low pass filter with a cut off frequency of 40 Hz and an IIR high pass filter with a cut off frequency of 0.5 Hz have been used. The subjects were advised to not move or blink their eyes during the presentation of a stimulus. We, in fact, showed to them how the EEG varied due to the blinking of eyes. The subjects remained attentive during the stimulus presentation and moved or blinked their eyes in the span of 1.5 s during the presentation of a cross symbol. The filtering operations as well as feature extraction procedure have been performed using Acq4.2 software provided by Biopac.
The EEG signals belonging to a particular class of emotion were then collected as per the SAM ratings and averaging of the signals was done. In our case, the stimulus presentation was for 1 second, so the EEG signals of length 1 second corresponding to each stimulus (of a particular class other than rejected by a subject) were collected and averaged. In this manner, we obtained one EEG signal per electrode (for one subject) for a particular class of emotion. The 12 ERP attributes (six ERPs and six corresponding latencies), namely, P100, N100, PT100, NT100, P200, N200, PT200, NT200, P300, N300, PT300 and NT 300, as specified in Table 2 were then extracted from EEG. These ERP and latency attributes were acquired from each of the frontal electrodes—Fp1, Fp2, F3, F4, F8 and Fz.
The analysis has also been performed on the difference of ERPs and absolute latencies, as shown in Table 3.
The SVM polynomial classifier with 10 fold cross-validation has been used for the classification of emotions along arousal and valence domains considering the orthogonality of arousal and valence. The SVM polynomial kernel in Matlab has been used to classify emotions. The training and testing can be performed in Matlab by using the instructions:
Svmtrainarousal = svmtrain(z1(trainindex,:), trainoutputarousal(trainindex), ‘Autoscale, true, ‘Showplot’, false, ‘Kernel Function’, ‘polynomial’, ‘polyorder’, s, ‘Boxconstraint’,bestc, ‘QUADPROG_OPTS’,options); and testoutput = svmclassify(svmtrainarousal, w1, ‘showplot’, false);
The cross-validation is used in a machine learning model to obtain a less biased or less optimistic estimate of the model as compared to a direct train-test operation. The training data are split into k subsets (in this study k = 10) and a classifier model developed on k-1 subsets is tested on the kth subset. This process is repeated and average accuracy is obtained for a chosen value of ‘C’. If the average accuracy is greater than the best accuracy, that value of ‘C’ is retained as best ‘C’.
The best ‘C’ value thus determined is used for training on the full training set and then the classifier is tested on the test set. The results presented in this manuscript have been obtained after performing 10-fold cross-validation on the training data.
For the emotion classifier based on average ERP attributes, these 12 ERP attributes shown in Table 2 have been used. In the second analysis, i.e., the development of an emotion classifier based on the difference of ERP attributes, we used differential ERP attributes such as (P100-N100), (P200-N200), (P300-N300) and the latencies PT100, NT100, PT200, PT300 and NT300 as attributes.
The attribute selection is performed by testing different combinations of acquired features. All the initial features say the differences of ERPs and latencies (P100-N100, P200-N200, P300-N300, PT100, NT100, PT200, NT200, PT300, NT300) are initially selected for training a classifier. The accuracy of classification (arousal or valence) is determined on the test set. A new attribute set is selected by removing one of the attributes, say P100-N100. The classifier is again trained and tested. If the test accuracy using the new attribute set is more than the previous one, the new attribute set is retained and the previous one is ignored. A new attribute set is now generated by removing or retaining a new parameter and the accuracy using a new attribute set is now compared with the previous one. This process of selecting features is continued till the classification accuracy does not increase further. Similarly, the analysis has been performed by using all ERPs and latencies. Initially, all twelve attributes (P100-N100, P200-N200, P300-N300, PT100, NT100, PT200, NT200, PT300, NT300) are used for training a classifier. The feature reduction is then carried out in a manner similar to the one performed on the difference of average ERPs. The attribute set with a smaller number of features is selected in case two accuracies are equal. The separate combinations of bio-potentials (P100-N100, P200-N200, P300-N300) and latencies (PT100, NT100, PT200, NT200, PT300, NT300) have also been tried separately.

6. Results and Discussion

The analysis has been performed on two types of attributes, i.e., average ERPs with latencies and the difference of average ERPs and latencies, as shown in Table 2 and Table 3.
In order to make a comparison and for the validation of results, the methodology as used in an existing study for emotion evocation and classification of low arousal and high arousal data into low valence and high valence classes has been used [22]. The flowchart of the three-classifier methodology is shown in Figure 5.
When using average ERP attributes, the emotions along the arousal domain could be classified with an accuracy of 88% at SVM polynomial order 6. After classifying arousal, two valence classifiers, one classifying low arousal emotional data into low valence low arousal (LVLA) and high valence low arousal (HVLA) classes and the second classifying high arousal emotional data into low valence high arousal (LVHA) and high valence high arousal (HVHA) classes, have been used. In both cases, a classification accuracy of 94% has been obtained at SVM polynomial order 4 and SVM polynomial order 5, respectively. The confusion matrix showing four class classification results is shown in Table 4, whereas the error analysis is shown in Table 5.
The results, of course, are better than an existing study [22]. It is noteworthy to mention over here that we did not use ICA and artifact removal techniques in accordance with the conclusion of Jenke et al. [25], as these operations did not reportedly impact the classification results considerably but added to offline processing time. However, it must be known that the classification accuracy depends upon the index of trials wrongly classified along arousal and valence domains. If different test samples have been wrongly classified along arousal and valence, the four-class classification may decrease even though the arousal and valence classification may be higher. Thus, if arousal classification is 88% and valence is 94%, then the correctly classified instances (CCI) would lie in the range of 82–88. This means that the four-class classification lies in the range of 82–88% with a mid-range accuracy of 85%, which is better than 75% obtained in an existing study [22]. Further, if arousal and valence classification is conducted considering the orthogonal relationship between arousal and valence domains, then separate classifiers should be used to classify arousal and valence. Therefore, either classification should be performed using two separate arousal and valence classifiers or all four classes should be classified simultaneously. It is important to mention here that when classifying low arousal and high arousal data along the valence domain, the same attribute set as was used when classifying emotions using two classifiers suited the best, though at different orders. In other words, the attribute set that gives the best accuracy for the classification of low arousal data into valence obviously gives the best classification accuracy for the classification of high arousal data along the valence axis. The comparison of results obtained on frontal electrodes with an existing study on central electrodes using average ERP attributes is shown in Figure 6.
We determined the effect of including Fp1 and Fp2 in the set of selected electrodes when classifying emotions along arousal and valence domains. Analysis was performed without including ERP data from Fp1 and Fp2 electrodes. It can be clearly seen from Table 6 and Table 7 that the four-class emotion classification accuracy reduced. A four-class classification accuracy of 75% has been obtained, which is considerably lower than 83% obtained with Fp1 and Fp2 data included in the classification. The classification results are shown in Table 6 and error analysis in Table 7. Here, two classifiers have been used in the emotion classification, as shown in Figure 7.
Though definitely higher classification results have been obtained using three emotion classifiers, it is not recommended to use the methodology of [22], as it disobeys the orthogonality principle. Additionally, to find a different order for the SVM polynomial classifier for classifying low arousal/high arousal data along the valence domain is not correct as the attributes used for the classification of valence would remain the same for the data whether belonging to low arousal or high arousal. That is why the four-class emotion classification has also been performed using two emotion classifiers independently along arousal and valence. The SVM polynomial order has been fixed at 3. The emotion classification methodology as shown in Figure 7 has been performed separately on average as well as the difference of average ERP attributes acquired from frontal electrodes of EEG. With average ERP attributes and the SVM polynomial order fixed at 3, the emotion classification along the arousal axis is 79% and along the valence axis is 81%. A four-class classification accuracy thus comes out to be 67%. The results are shown in Table 8 and error analysis in Table 9.
With the SVM polynomial order fixed at 3 for classifying emotions along the arousal axis and valence domain, a four-class classification accuracy of 74% has been obtained with an arousal classification of 86% and a valence classification of 85%. The results are shown in Table 10 and Table 11.
It becomes pertinent to mention here that higher classification results have been obtained on frontal electrodes even when SVM polynomial order is fixed at default value 3. The comparison of results is shown in Table 12.

7. Conclusions

The emotion classification results presented using average ERP attributes clearly show that a four-class classification accuracy of 83% obtained on frontal EEG electrodes is considerably better than the accuracy reported by an existing study on ERPs [22]. The attribute selected for classifying emotions along the valence domain would fairly classify the emotional data irrespective of them belonging to low arousal or high arousal domains. The results are lower than the emotion classification results proposed in [23], but in this study, as the one versus all classification technique has been used, the same data will have to go through six classifiers and the output of each classifier would ultimately define the classification of a test trial. Critically, the clarity on test samples used for claimed accuracy is missing in [23]. With the SVM polynomial order fixed at 3, the results obtained using the difference of average ERP attributes are considerably better than those obtained using average ERP attributes. The mid-range accuracy is still better than an existing study. We found that the use of Fp1 and Fp2 electrodes in emotion classification affects the emotion classification results, even though they are considered to be not carrying any neurophysiologic information. The proposed classifier can be used for validating the transition of emotions as in [58] in the future. Koelstra et al. [36] used Fp1 and Fp2 electrodes in addition to other selected electrodes (even though for eyebrow action) and produced better emotion classification results on EEG as compared to Soleymani et al. [38] on the same set of MAHNOB HCI data. However, unlike the above two studies [36,38], and [59], the fusion of EEG with facial expressions and classification along other domains apart from arousal and valence is missing in the proposed study.

Author Contributions

Conceptualization, M.I.S. and M.S.; Data curation, M.I.S.; Formal analysis, M.I.S.; Investigation, M.I.S.; Methodology, M.I.S. and M.S.; Project administration, M.I.S. and M.S.; Resources, M.I.S. and M.S.; Software, M.I.S.; Supervision, M.S. All authors have read and agreed to the published version of the manuscript.

Funding

This research received no external funding.

Institutional Review Board Statement

The study was conducted according to the guidelines of the Declaration of Helsinki, and approved by the Ethics Committee of Thapar Institute of Engineering and Technology, Patiala. (Date of approval: 30 October 2014).

Informed Consent Statement

Informed consent was obtained from all subjects involved in the study.

Conflicts of Interest

The authors declare no conflict of interest.

References

  1. Izard, C.E. The Many Meanings/Aspects of Emotion: Definitions, Functions, Activation, and Regulation. Emot. Rev. 2010, 2, 363–370. [Google Scholar] [CrossRef] [Green Version]
  2. Widen, S.C.; Russell, J.A. Descriptive and Prescriptive Definitions of Emotion. Emot. Rev. 2010, 2, 377–378. [Google Scholar] [CrossRef]
  3. Moors, A. Theories of Emotion Causation: A Review. Cogn. Emot. 2009, 23, 625–662. [Google Scholar] [CrossRef] [Green Version]
  4. Lang, P.J. Emotion and Motivation: Toward Consensus Definitions and a Common Research Purpose. Emot. Rev. 2010, 2, 229–233. [Google Scholar] [CrossRef]
  5. LeDoux, J.; Phelps, L.; Alberini, C. What We Talk about When We Talk about Emotions. Cell 2016, 167, 1443–1445. [Google Scholar]
  6. Panksepp, J. Toward a General Psychobiological Theory of Emotions. Behav. Brain Sci. 1982, 5, 407–422. [Google Scholar] [CrossRef]
  7. Scherer, K.R. Emotion. In Introduction to Social Psychology. A European Perspective, 3rd ed.; Hewstone, M., Stroebe, W., Jonas, K., Eds.; Blackwell: Oxford, UK, 2001; pp. 151–191. [Google Scholar]
  8. Breckler, S.; Wiggins, E. Emotional responses and the affective component of attitude. J. Soc. Behav. Personal. 1993, 8, 282. [Google Scholar]
  9. Berscheid, E. The emotion-in-relationships model: Reflections and. In Memories, Thoughts, Emotions Essays Honor George Mandler; Lawrence Erlbaum Associates, Inc.: Hillsdale, NJ, USA, 1991; pp. 323–335. [Google Scholar]
  10. Gottman, J.M. What Predicts Divorce? The Relationship between Marital Processes and Marital Outcomes; Psychology Press: East Sussex, UK, 2014. [Google Scholar]
  11. Brody, L. Gender, Emotion, and the Family; Harvard University Press: Cambridge, MA, USA, 2009. [Google Scholar]
  12. Rolls, E.T. Emotion and Decision-Making Explained; OUP Oxford: Oxford, UK, 2013. [Google Scholar]
  13. Russell, J.A. Core Affect and the Psychological Construction of Emotion. Psychol. Rev. 2003, 110, 145. [Google Scholar] [CrossRef]
  14. Barrett, L.F.; Mesquita, B.; Ochsner, K.N.; Gross, J.J. The Experience of Emotion. Annu. Rev. Psychol. 2007, 58, 373–403. [Google Scholar] [CrossRef] [Green Version]
  15. Usman, S.M.; Khalid, S.; Bashir, Z. Epileptic Seizure Prediction Using Scalp Electroencephalogram Signals. Biocybern. Biomed. Eng. 2021, 41, 211–220. [Google Scholar] [CrossRef]
  16. Tzimourta, K.D.; Christou, V.; Tzallas, A.T.; Giannakeas, N.; Astrakas, L.G.; Angelidis, P.; Tsalikakis, D.; Tsipouras, M.G. Machine Learning Algorithms and Statistical Approaches for Alzheimer’s Disease Analysis Based on Resting-State EEG Recordings: A Systematic Review. Int. J. Neural Syst. 2021, 31, 2130002. [Google Scholar] [CrossRef] [PubMed]
  17. Cacioppo, J.T.; Tassinary, L.G. Inferring Psychological Significance from Physiological Signals. Am. Psychol. 1990, 45, 16–28. [Google Scholar] [CrossRef]
  18. Lang, P.J.; Greenwald, M.K.; Bradley, M.M.; Hamm, A.O. Looking at Pictures: Affective, Facial, Visceral, and Behavioral Reactions. Psychophysiology 1993, 30, 261–273. [Google Scholar] [CrossRef] [PubMed]
  19. Chanel, G.; Ansari-Asl, K.; Pun, T. Valence-arousal evaluation using physiological signals in an emotion recall paradigm. In Proceedings of the 2007 IEEE International Conference on Systems, Man and Cybernetics, Montréal, QC, Canada, 7–10 October 2007; IEEE: New York, NY, USA, 2007; pp. 2662–2667. [Google Scholar]
  20. Savran, A.; Ciftci, K.; Chanel, G.; Mota, J.; Hong Viet, L.; Sankur, B.; Akarun, L.; Caplier, A.; Rombaut, M. Emotion detection in the loop from brain signals and facial images. In Proceedings of the eNTERFACE 2006 Workshop, Dubrovnik, Croatia, 17 July–11 August 2006. [Google Scholar]
  21. Horlings, R.; Datcu, D.; Rothkrantz, L.J.M. Emotion recognition using brain activity. In Proceedings of the 9th International conference on Computer Systems and Technologies and Workshop for PhD Students in Computing, Gabrovo, Bulgaria, 12–13 June 2008; p. II-1. [Google Scholar] [CrossRef]
  22. Frantzidis, C.A.; Bratsas, C.; Papadelis, C.L.; Konstantinidis, E.; Pappas, C.; Bamidis, P.D. Toward Emotion Aware Computing: An Integrated Approach Using Multichannel Neurophysiological Recordings and Affective Visual Stimuli. IEEE Trans. Inf. Technol. Biomed. 2010, 14, 589–597. [Google Scholar] [CrossRef] [PubMed]
  23. Petrantonakis, P.C.; Hadjileontiadis, L.J. Emotion Recognition from Brain Signals Using Hybrid Adaptive Filtering and Higher Order Crossings Analysis. IEEE Trans. Affect. Comput. 2010, 1, 81–97. [Google Scholar] [CrossRef]
  24. Paul, E.; Friesen, W.V. Facial Action Coding System: A Technique for the Measurement of Facial Movement; Consulting Psychologists Press: Palo Alto, CA, USA, 1978. [Google Scholar]
  25. Jenke, R.; Peer, A.; Buss, M. Feature Extraction and Selection for Emotion Recognition from EEG. IEEE Trans. Affect. Comput. 2014, 5, 327–339. [Google Scholar] [CrossRef]
  26. Li, M.; Lu, B.-L. Emotion classification based on gamma-band EEG. In Proceedings of the 2009 Annual International Conference of the IEEE Engineering in Medicine and Biology Society, Minneapolis/St. Paul, MN, USA, 2–6 September 2009; IEEE: New York, NY, USA, 2009; pp. 1223–1226. [Google Scholar]
  27. Lin, Y.-P.; Wang, C.-H.; Jung, T.-P.; Wu, T.-L.; Jeng, S.-K.; Duann, J.-R.; Chen, J.-H. EEG-Based Emotion Recognition in Music Listening. IEEE Trans. Biomed. Eng. 2010, 57, 1798–1806. [Google Scholar] [PubMed]
  28. Murugappan, M.; Nagarajan, R.; Yaacob, S. Discrete Wavelet Transform Based Selection of Salient EEG Frequency Band for Assessing Human Emotions. Discret. Wavelet Transform. Appl. IntechOpen Ser. Malays. Kangar Malays. 2011, 33–52. [Google Scholar] [CrossRef] [Green Version]
  29. Liu, Y.; Sourina, O. Real-time fractal-based valence level recognition from EEG. In Transactions on Computational Science XVIII; Springer: Berlin, Germany, 2013; pp. 101–120. [Google Scholar]
  30. Mühl, C.; Allison, B.; Nijholt, A.; Chanel, G. A Survey of Affective Brain Computer Interfaces: Principles, State-of-the-Art, and Challenges. Brain Comput. Interfaces 2014, 1, 66–84. [Google Scholar] [CrossRef] [Green Version]
  31. Zheng, W.-L.; Zhu, J.-Y.; Lu, B.-L. Identifying Stable Patterns over Time for Emotion Recognition from EEG. IEEE Trans. Affect. Comput. 2017, 10, 417–429. [Google Scholar] [CrossRef] [Green Version]
  32. Koelstra, S.; Muhl, C.; Soleymani, M.; Lee, J.-S.; Yazdani, A.; Ebrahimi, T.; Pun, T.; Nijholt, A.; Patras, I. Deap: A Database for Emotion Analysis; Using Physiological Signals. IEEE Trans. Affect. Comput. 2012, 3, 18–31. [Google Scholar] [CrossRef] [Green Version]
  33. Soroush, M.Z.; Maghooli, K.; Setarehdan, S.K.; Nasrabadi, A.M. Emotion Recognition through EEG Phase Space Dynamics and Dempster-Shafer Theory. Med. Hypotheses 2019, 127, 34–45. [Google Scholar] [CrossRef]
  34. Liang, Z.; Oba, S.; Ishii, S. An Unsupervised EEG Decoding System for Human Emotion Recognition. Neural Netw. 2019, 116, 257–268. [Google Scholar] [CrossRef]
  35. Kong, T.; Shao, J.; Hu, J.; Yang, X.; Yang, S.; Malekian, R. EEG-Based Emotion Recognition Using an Improved Weighted Horizontal Visibility Graph. Sensors 2021, 21, 1870. [Google Scholar] [CrossRef] [PubMed]
  36. Koelstra, S.; Patras, I. Fusion of Facial Expressions and EEG for Implicit Affective Tagging. Image Vis. Comput. 2013, 31, 164–174. [Google Scholar] [CrossRef]
  37. Soleymani, M.; Lichtenauer, J.; Pun, T.; Pantic, M. A Multimodal Database for Affect Recognition and Implicit Tagging. IEEE Trans. Affect. Comput. 2011, 3, 42–55. [Google Scholar] [CrossRef] [Green Version]
  38. Soleymani, M.; Asghari-Esfeden, S.; Fu, Y.; Pantic, M. Analysis of EEG Signals and Facial Expressions for Continuous Emotion Detection. IEEE Trans. Affect. Comput. 2015, 7, 17–28. [Google Scholar] [CrossRef]
  39. Sourina, O.; Liu, Y. A Fractal-Based Algorithm of Emotion Recognition from EEG Using Arousal-Valence Model. In International Conference on Bio-Inspired Systems and Signal Processing; Scitepress: Rome, Italy, 2011; Volume 2, pp. 209–214. [Google Scholar]
  40. Hwang, S.; Hong, K.; Son, G.; Byun, H. Learning CNN Features from DE Features for EEG-Based Emotion Recognition. Pattern Anal. Appl. 2020, 3, 1323–1335. [Google Scholar] [CrossRef]
  41. Singh, M.I.; Singh, M. Development of Emotion Classifier Based on Absolute and Differential Attributes of Averaged Signals of Visually Stimulated Event Related Potentials. Trans. Inst. Meas. Control 2020, 42, 2057–2067. [Google Scholar] [CrossRef]
  42. Chanel, G.; Kronegg, J.; Grandjean, D.; Pun, T. Emotion assessment: Arousal evaluation using EEG’s and peripheral physiological signals. In International Workshop on Multimedia Content Representation, Classification and Security; Springer: Berlin, Germany, 2006; pp. 530–537. [Google Scholar]
  43. Frantzidis, C.A.; Lithari, C.D.; Vivas, A.B.; Papadelis, C.L.; Pappas, C.; Bamidis, P.D. Towards emotion aware computing: A study of arousal modulation with multichannel event-related potentials, delta oscillatory activity and skin conductivity responses. In Proceedings of the 2008 8th IEEE International Conference on BioInformatics and BioEngineering, Athens, Greece, 8–10 October 2008; IEEE: New York, NY, USA, 2008; pp. 1–6. [Google Scholar]
  44. Khalili, Z.; Moradi, M.H. Emotion recognition system using brain and peripheral signals: Using correlation dimension to improve the results of EEG. In Proceedings of the 2009 International Joint Conference on Neural Networks, Atlanta, GA, USA, 14–19 June 2009; IEEE: New York, NY, USA, 2009; pp. 1571–1575. [Google Scholar]
  45. Jatupaiboon, N.; Pan-Ngum, S.; Israsena, P. Real-Time EEG-Based Happiness Detection System. Sci. World J. 2013, 2013, 618649. [Google Scholar] [CrossRef]
  46. Hidalgo-Muñoz, A.R.; López, M.M.; Santos, I.M.; Pereira, A.T.; Vázquez-Marrufo, M.; Galvao-Carmona, A.; Tomé, A.M. Application of SVM-RFE on EEG Signals for Detecting the Most Relevant Scalp Regions Linked to Affective Valence Processing. Expert Syst. Appl. 2013, 40, 2102–2108. [Google Scholar] [CrossRef]
  47. Liu, Y.-H.; Wu, C.-T.; Cheng, W.-T.; Hsiao, Y.-T.; Chen, P.-M.; Teng, J.-T. Emotion Recognition from Single-Trial EEG Based on Kernel Fisher’s Emotion Pattern and Imbalanced Quasiconformal Kernel Support Vector Machine. Sensors 2014, 14, 13361–13388. [Google Scholar] [CrossRef] [Green Version]
  48. Lin, Y.-P.; Jung, T.-P. Improving EEG-Based Emotion Classification Using Conditional Transfer Learning. Front. Hum. Neurosci. 2017, 11, 334. [Google Scholar] [CrossRef] [PubMed]
  49. Menezes, M.L.R.; Samara, A.; Galway, L.; Sant’Anna, A.; Verikas, A.; Alonso-Fernandez, F.; Wang, H.; Bond, R. Towards Emotion Recognition for Virtual Environments: An Evaluation of EEG Features on Benchmark Dataset. Pers. Ubiquitous Comput. 2017, 21, 1003–1013. [Google Scholar] [CrossRef] [Green Version]
  50. Song, T.; Zheng, W.; Song, P.; Cui, Z. EEG Emotion Recognition Using Dynamical Graph Convolutional Neural Networks. IEEE Trans. Affect. Comput. 2018, 11, 532–541. [Google Scholar] [CrossRef] [Green Version]
  51. Lang, P.J.; Bradley, M.M.; Cuthbert, B.N. International Affective Picture System (IAPS): Affective Ratings of Pictures and Instruction Manual; University of Florida: Gainesville, FL, USA, 2008; Tech Rep A-8. [Google Scholar]
  52. Singh, M.I.; Singh, M. Development of Low-Cost Event Marker for EEG-Based Emotion Recognition. Trans. Inst. Meas. Control. 2015, 39, 642–652. [Google Scholar] [CrossRef]
  53. Russell, J.A. A Circumplex Model of Affect. J. Pers. Soc. Psychol. 1980, 39, 1161. [Google Scholar] [CrossRef]
  54. Stanley, D.J.; Meyer, J.P. Two-Dimensional Affective Space: A New Approach to Orienting the Axes. Emotion 2009, 9, 214–237. [Google Scholar] [CrossRef] [PubMed]
  55. Singh, M.I.; Singh, M. Development of a Real Time Emotion Classifier Based on Evoked EEG. Biocybern. Biomed. Eng. 2017, 37, 498–509. [Google Scholar] [CrossRef]
  56. Russell, J.A.; Barrett, L.F. Core Affect, Prototypical Emotional Episodes, and Other Things Called Emotion: Dissecting the Elephant. J. Pers. Soc. Psychol. 1999, 76, 805. [Google Scholar] [CrossRef]
  57. Watson, D.; Wiese, D.; Vaidya, J.; Tellegen, A. The Two General Activation Systems of Affect: Structural Findings, Evolutionary Considerations, and Psychobiological Evidence. J. Pers. Soc. Psychol. 1999, 76, 820–838. [Google Scholar] [CrossRef]
  58. Li, Y.; Zheng, W. Emotion Recognition and Regulation Based on Stacked Sparse Auto-Encoder Network and Personalized Reconfigurable Music. Mathematics 2021, 9, 593. [Google Scholar] [CrossRef]
  59. Anderson, D.J.; Adolphs, R. A Framework for Studying Emotions across Species. Cell 2014, 157, 187–200. [Google Scholar] [CrossRef] [PubMed] [Green Version]
Figure 1. Data acquisition methodology used for acquiring EEG signals.
Applsci 11 04131 g001
Figure 2. Manikins used for self-assessment.
Applsci 11 04131 g002
Figure 3. (a) The representation of four classes of emotions along arousal–valence plane and (b) Russell’s model of Circumplex.
Applsci 11 04131 g003
Figure 4. IAPS and assessed mean ratings on arousal and valence scale.
Applsci 11 04131 g004
Figure 5. A flowchart of the three-classifier methodology used for classification of emotions.
Applsci 11 04131 g005
Figure 6. Comparison of existing results (a) [22], and (b) results obtained on frontal electrodes.
Applsci 11 04131 g006
Figure 7. A two-classifier methodology used.
Applsci 11 04131 g007
Table 1. A review of studies on emotion classification.
S.NoReference Number,
Stimulus, Number of Subjects
Number of
Classes
Physiological SignalsClassifierFeaturesResults
1[42], IAPS,
4
2
(Calm and Exciting)
EEGFDAPower and statistical features55%
Physiological signals such as GSR,
Plethysmograph, Respiration and Temperature
53%
Fusion of signals54%
2 (Calm and Exciting)EEG, Physiological signals and fusion of the twoNB50–54%
2[21], IAPS,
eNTERFACE 2006 data and 10 other subjects
5 along valence and arousal axisEEGSVMERD/ERS, cross correlation, peak frequency and Hjorth parametersValence—31%, Arousal—32%
ANNValence—31%, Arousal—28%
NBValence—29%, Arousal—35%
3SVMValence—37%, Arousal—49%
2Valence—72%, Arousal—68%
3[43], IAPS, 264 (Joy, Fear, Happiness and Melancholy)EEG and GSRANNERP features
and the GSR duration
80%, 100%,
80%, 70%
4[44],
IAPS,
eNTERFACE 2006 data
3 (Calm, Negatively Excited and Positively Excited)EEGQDCStatistical features and power in 10 frequency bands ranging from 0.25 Hz to 2.75 Hz63.33–66.66%
Peripheral signals such as GSR, Temperature, B.P. and Respiration55–51.66%
EEG+Peripheral (without correlation dimension)61.8–62.2%
EEG (combination with correlation dimension)66.66–76.66%
5[22],
IAPS, 28
4 (HVHA, LVHA, HVLA, LVLA)EEGMDERP and Event related oscillation79.46%
SVM81.25%
6[23], PFA database6
(Happy, Sad, Anger, Fear, Disgust and Surprise)
EEGSVM polynomial
QDA, k-NN, MD
HOC85.17% using SVM on attributes of all 3 channels.
(Best average accuracy)
7[28],
Visual and
Audio stimuli
5 (Happy, Fear, Neutral, Surprise and Disgust)EEGKNNEntropy and Power Ratios70–93%
LDA68–92%
8[32], Music Videos,
32
2 along Arousal (Low Arousal/High Arousal), 2 along Valence (Low Valence/High Valence), (Low Liking/High Liking)EEGGNBSpectral Power features from EEGArousal—62%
Valence—57.6%
Liking—55.4%
Peripheral Signals such as EMG, GSR, Temperature, BVP and Respiration, EOG and ECGStatistical features such as average, average of derivative, band energy ratio and standard deviation, etc.Arousal—57%
Valence—62.7%
Liking—59.1%
MCAMFCC, pitch,
and zero crossing rate
Arousal—65.1%
Valence—61.8%
Liking—67.7%
FusionFusion of all threeArousal—61.6%, Valence 64.7% and Liking 61.8%
9[37], Hollywood Videos,
27
3 along Arousal (Calm, Medium Arousal and Excited/Activated),
3 along Valence (Unpleasant, Neutral Valence and Pleasant)
EEGSVM RBF KernelSpectral features from different frequency bandsArousal—52.4%, Valence—57%
Peripheral Signals such as ECG, GSR, respiration amplitude,
and skin temperature
HRV, standard deviation of beat interval change per respiratory cycle, average skin resistance, band energy ratio, mean of derivative, range, spectral power in bands, etc.Arousal—46.2%
Valence—45.5%
Eye GazeFeatures from pupil diameter, gaze distance, eye blinking and gaze coordinates such as average, standard deviation, spectral power in different bands, skewness, blink depth approach time ratio, etc.Arousal—63.5%,
Valence—68.8%
FusionFusion EEG and GazeArousal—67.7%,
Valence—76.1%
10[45], GAPED pictures and classical music, 102 (Happy and Unhappy)EEG PSDSubject independent—63.67%,
Subject dependent—70.55%
(average accuracies)
11[46], IAPS, 262 (LVHA and HVHA)EEGSVMPower96.15%–100% (Best with RFE)
12[36], MAHNOB HCI database, 242 along Arousal (Low Arousal/High Arousal), 2 along Valence (Low Valence/High Valence), (Low Control/High Control)EEGGNBPower spectrum density featuresWith ICA: rousal—66%, Valence—71.5%, Control—67.5%
With RFE: Arousal–67.5%, Valence—70%, Control—63.5%
Facial Expression FeaturesAction units activationsWith ICA: Arousal—65%, Valence—64.5%, Control—64.5%
With RFE: Arousal—67.5%, Valence—64%, Control—62%
Fusion of modalities and fusion at decision levelFusionArousal—72.5%
Valence—74%
Control—73% (Best Results)
13[25], IAPS, 165 (Happy, Curious, Angry, Sad and Quiet)EEGQDA with diagonal covariance
estimates
Time domain features such as power, mean, S.D., HOC, Hjorth Features, NSI, FD. Frequency domain features such as Band
power, Entropy and Power ratios, etc.
32–43%,
(Average of 5 feature selection techniques)
14[47], IAPS,
images, 10
2 (Low Arousal/High Arousal and Low Valence/High Valence)EEG(IQK-SVM),
ISVM,
kNN,
SVM
PSD with feature reduction techniques PCA, LDA, KFDA(KFEP)
Kernel PCA
Arousal—84.8%,
Valence—82.7%
(Best average accuracies using IQK-SVM)
15[38],
MAHNOB HCI database,
28
ValenceEEGLSTM-RNN, MLR, SVR and CCRFPower spectrum density featuresBest APCC-0.45 on LSTM-RNN with decision level fusion
Facial Expression FeaturesDistance of eyebrows, lips and nose
Fusion of modalities and fusion at decision levelFusion
16[48], music videos,
26
2 (Low Arousal/High Arousal and Low Valence/High Valence)EEGGNBDLAT (Spectral power)Without TL Arousal—35.1% to 78.7%,
Valence—21.8 to 85.4%
With TL
Arousal—64%, Valence—64%
(Average results)
17[49],
DEAP database
2 (Low Arousal/High Arousal and Low Valence/High Valence)EEGRF, SVMStatistical parameters, Spectral band power and
HOC
3 classes using RF Arousal—63.1%, Valence—58.8%,
2 classes using RF Arousal—74%, Valence—88.4%
3 classes using SVM Arousal-59.7%, Valence—55.1%,
2 classes using SVM Arousal—57.2%, Valence—83.2%
18[50], SEED,
DREAMER
2 with Dreamer
Along Arousal, Valence and Dominance
EEGDGCNN, DBN, SVM, GCNNDE, PSD, DASM,
RASM, DCAU
Subject independent (SEED data)—79.95% best on DE
Subject
dependent best average
accuracy on dreamer dataset Arousal—84.54%, Valence—86.23%, Dominance—85.02%; Subject dependent best average accuracy on SEED dataset—90.40%
19[34], DEAP database2 (Low Arousal/High Arousal, Low Valence/High Valence, Low Dominance/High Dominance, and Low Liking/High Liking)EEGHypergraph partitioning in unsupervised mannerFrequency domain,
Time domain and wavelet domain
Arousal—62.34%
Valence—56.25%
Dominance—64.22%
Liking—66.09%
20[33], (2019), DEAP database4 (HVHA, HVLA, LVLA and LVHA)EEGMLP, Bayes, Fusion in conjunction with DSTAngle space construction from EEG phase thereafter statistical attributes such as correlation dimension, fractal dimension, Largest Lyaponouv Exponent, Entropy, etc., from angle variability as well as length variabilityAccuracy greater than 80% for Bayes, MLP and DST
Best Accuracy—82% with DST
21[40], (2020), SEED data set3 (Neutral, Positive and Negative)EEGCNN, SVM polynomial
SVM RBF
DE, PSDBest average subject dependent accuracy—91.68%,
SVM polynomial—78.37
SVM RBF—81.16%
22[41], IAPS, 144 (LVHA, HVHA, HVLA, LVLA)EEGSVM polynomial Average ERP and Difference of Average ERP75% and 76.8%
23[35], DEAP database2 (Arousal, Valence)EEGSVM, OF-KNN and DTFWHVG, BWHVG
and time domain features fusion
97.53% and
97.75%;
98.12% and
98.06%
(Fusion)(Best
Results)
IAPS, International Affective Picture System; FDA, Fisher Discriminant Analysis; NB, Naïve Bayes classifier; QDC, Quadratic Discriminant Classifier, GNB, Gaussian Naïve Bayes Classifier, GSR, galvanic skin resistance; BVP, blood volume pressure; EMG, electromyogram; BP, blood pressure; SVM, support vector machine; ANN, artificial neural network; MD, Mahalanobis Distance; KNN, k-nearest neighbors; ERD, event-related desynchronization; ERS, event-related synchronization; LDA, linear discriminant analysis; LSTM-RNN, Long Short Term Memory Recurrent Neural Network; MLR, Multi Linear Regression; SVR, Support Vector Regression; CCRF, Continuous Conditional Random Field Models; APCC, Average Pearson Correlation Coefficient APCC; ICA, Independent Component Analysis; RFE, Recursive Feature Extraction; IQK-SVM, Imbalanced quasiconformal kernel SVM; PFA, Pictures of Facial Affect database; HOC, Higher order crossing; NSI, Non-Stationary Index; FD, Fractal Dimension; DGCNN, Dynamical Graph Convolutional Neural Networks; GCNN, Graph Convolutional Neural Networks; DBN, Deep Belief Networks; PSD, Power Spectral Density; DLAT, Differential Laterality; DASM, Differential Asymmetry; RASM, Rational Asymmetry; DCAU, Differential Caudality Feature; RF, Random Forest; MFCC, Mel-Frequency Cepstral Coefficients; MCA, Multimedia Content Analysis; DE, Differential Entropy; CNN, Convolutional Neural Networks; OF-KNN, Optimized fitted k-nearest neighbors; DT, Decision Tree; FWHVG, Forward weighted horizontal visibility graphs; BWHVG, Backward weighted horizontal visibility graphs.
Table 2. The ERP features acquired from EEG signals and their nomenclature.
Time BracketERP AcquiredLatency at Which ERP Has Been Acquired
Nomenclature for MaximaNomenclature for MinimaNomenclature of Latency Value at Which Maxima Has Been ObtainedNomenclature of Latency Value at Which Minima Has Been Obtained
80–120 msP100N100PT100NT100
180–220 msP200N200PT200NT200
280–320 msP300N300PT300NT300
Table 3. The difference of ERP features obtained from average ERPs and corresponding latencies.
Time BracketDifference of ERP UsedLatency at Which ERP Has Been Acquired
Nomenclature UsedNomenclature of Latency Value at Which Maxima Has Been ObtainedNomenclature of Latency Value at Which Minima Has Been Obtained
80–120 msP100-N100PT100NT100
180–220 msP200-N200PT200NT200
280–320 msP300-N300PT300NT300
Table 4. The confusion matrix using average ERPs with one arousal and two valence classifiers.
Confusion Matrix on Frontal Predicted Classes
LVHAHVHAHVLALVLA
Actual ClassesLVHA22201
HVHA12310
HVLA13210
LVLA60217
Table 5. The error analysis for results obtained using three classifiers.
Error AnalysisSensitivity (%)Specificity
(%)
Precision
(%)
Negative Predictive Value (%)F1 Score
(%)
LVHA88.089.373.395.780.0
HVHA92.093.382.197.286.8
HVLA84.096.087.594.785.7
LVLA68.098.794.490.279.1
Table 6. The confusion matrix on frontal electrodes except Fp1 and Fp2 using average ERPs.
Confusion MatrixPredicted Classes
LVHAHVHAHVLALVLA
Actual ClassesLVHA15302
HVHA11720
HVLA13142
LVLA04214
Table 7. The error analysis of results on frontal electrodes except Fp1 and Fp2.
Error AnalysisSensitivity (%)Specificity
(%)
Precision
(%)
Negative Predictive Value (%)F1 Score
(%)
LVHA75.096.788.292.181.1
HVHA85.083.363.094.372.3
HVLA70.093.377.890.373.7
LVLA70.093.377.890.373.7
Table 8. Confusion matrix with average ERPs on frontal electrodes with polynomial order fixed at 3.
Confusion Matrix Predicted Classes
LVHAHVHAHVLALVLA
Actual ClassesLVHA20212
HVHA51640
HVLA34153
LVLA43216
Table 9. The error analysis of results on frontal electrodes with polynomial order fixed at 3.
Error AnalysisSensitivity (%)Specificity
(%)
Precision
(%)
Negative Predictive Value (%)F1 Score
(%)
LVHA80.084.062.592.670.2
HVHA64.088.064.088.064.0
HVLA60.090.768.287.263.8
LVLA64.093.376.288.669.6
Table 10. The confusion matrix with differential average ERPs.
Confusion Matrix on Frontal ElectrodesPredicted Classes
LVHAHVHAHVLALVLA
Actual ClassesLVHA21022
HVHA21850
HVLA03184
LVLA11617
Table 11. The error analysis on frontal electrodes for results on differential average ERPs.
Error AnalysisSensitivity (%)Specificity
(%)
Precision
(%)
Negative
Predictive Value (%)
F1 Score
(%)
LVHA84.096.087.594.785.7
HVHA72.094.781.891.076.6
HVLA72.082.758.189.964.3
LVLA68.092.073.989.670.8
Table 12. Comparative analysis of results with already existing study on ERP.
Comparative AnalysisFeatures Used,
Number of Selected
Attributes (NoA)
Possibility of Testing on Single EEG ElectrodeType of Classifier UsedNumber of Classifiers Used,
Polynomial Order Used
% Accuracy along Arousal, ValenceMid-Range
Accuracy
Accuracy/
Total Test Instances
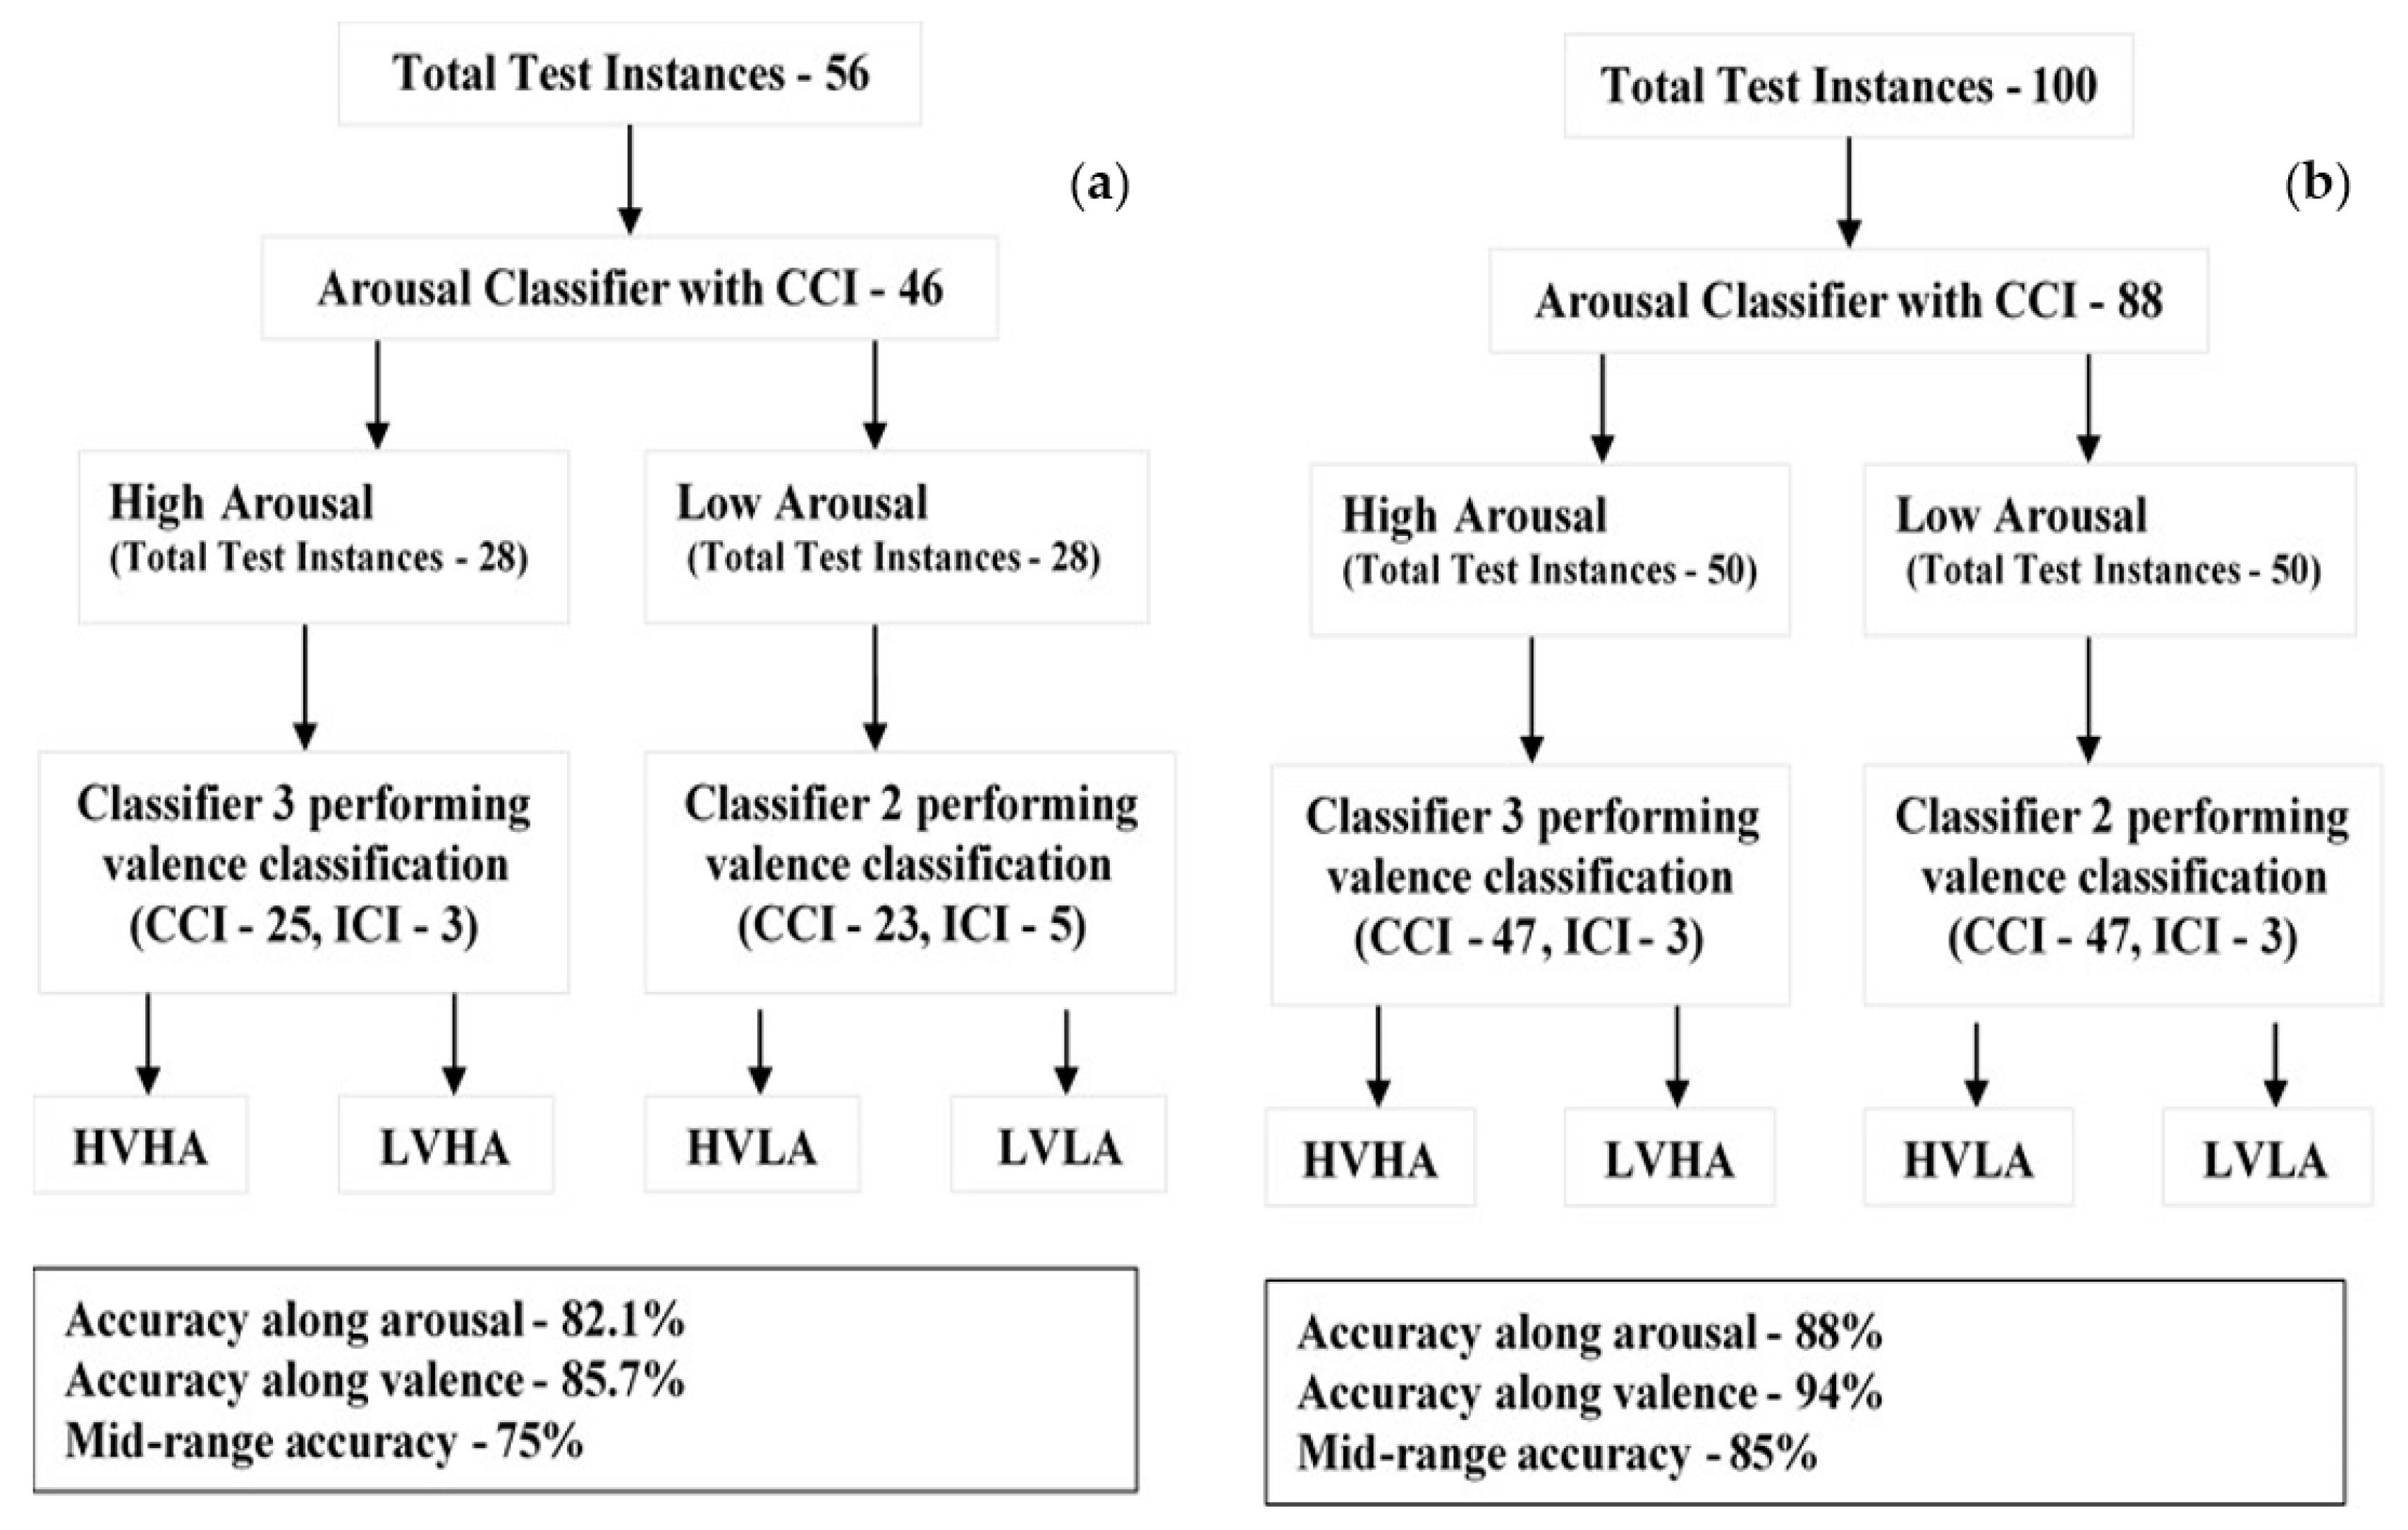
Classifier proposed in existing
methodology
[22]
ERP and Event Related Oscillation,
NoA between
16 and 22
Not PossibleSVM linear,
SVM polynomial
SVM radial basis function
3 (1 for Arousal, 2 for Valence), Arousal—3
Valence—3 and 2
Arousal—82.1%
Valence—85.7%
75%81.3%/56
Classifier 1 based on the three-classifier
methodology as proposed
in existing study
ERP, NoA less than or equal to 12PossibleSVM Polynomial3 (1 for Arousal, 2 for Valence), Arousal—6
Valence—4 and 6
Arousal—88%
Valence—94%
85%83%/
100
Classifier 2 without Fp1 and Fp2ERP, NoA less than or equal to 12PossibleSVM Polynomial2 (1 for Arousal, 1 for Valence)Arousal—85%
Valence—83.75%
76.2575%/
80
Classifier 3 on average ERP with polynomial order 3ERP, NoA less than or equal to 12PossibleSVM Polynomial2 (1 for Arousal,
1 for Valence)
Arousal—79%
Valence—81%
69.5%67%/
100
Classifier 4 on difference of average ERP with polynomial order 3Difference of ERP, NoA less than or equal to 12PossibleSVM
Polynomial
2 (1 for Arousal, 1 for Valence)Arousal—86%
Valence—85%
78%74%/
100
Publisher’s Note: MDPI stays neutral with regard to jurisdictional claims in published maps and institutional affiliations.

