Article

Implementation of Robust Satellite Techniques for Volcanoes on ASTER Data under the Google Earth Engine Platform

1
Scuola di Ingegneria, Università degli Studi della Basilicata, 85100 Potenza, Italy
2
Istituto di Metodologie per l’Analisi Ambientale (IMAA), Consiglio Nazionale delle Ricerche (CNR), 85050 Tito Scalo, Italy
3
Istituto Nazionale di Geofisica e Vulcanologia, Osservatorio Etneo, 95125 Catania, Italy
*
Author to whom correspondence should be addressed.
Appl. Sci. 2021, 11(9), 4201; https://doi.org/10.3390/app11094201
Submission received: 2 April 2021 / Revised: 27 April 2021 / Accepted: 1 May 2021 / Published: 5 May 2021
(This article belongs to the Special Issue Data Processing and Modeling on Volcanic and Seismic Areas)

Abstract

:

Featured Application

Volcano activity mapping and monitoring.

Abstract

The RST (Robust Satellite Techniques) approach is a multi-temporal scheme of satellite data analysis widely used to investigate and monitor thermal volcanic activity from space through high temporal resolution data from sensors such as the Moderate Resolution Imaging Spectroradiometer (MODIS), and the Spinning Enhanced Visible and Infrared Imager (SEVIRI). In this work, we present the results of the preliminary RST algorithm implementation to thermal infrared (TIR) data, at 90 m spatial resolution, from the Advanced Spaceborne Thermal Emission and Reflection Radiometer (ASTER). Results achieved under the Google Earth Engine (GEE) environment, by analyzing 20 years of satellite observations over three active volcanoes (i.e., Etna, Shishaldin and Shinmoedake) located in different geographic areas, show that the RST-based system, hereafter named RASTer, detected a higher (around 25% more) number of thermal anomalies than the well-established ASTER Volcano Archive (AVA). Despite the availability of a less populated dataset than other sensors, the RST implementation on ASTER data guarantees an efficient identification and mapping of volcanic thermal features even of a low intensity level. To improve the temporal continuity of the active volcanoes monitoring, the possibility of exploiting RASTer is here addressed, in the perspective of an operational multi-satellite observing system. The latter could include mid-high spatial resolution satellite data (e.g., Sentinel-2/MSI, Landsat-8/OLI), as well as those at higher-temporal (lower-spatial) resolution (e.g., EOS/MODIS, Suomi-NPP/VIIRS, Sentinel-3/SLSTR), for which RASTer could provide useful algorithm’s validation and training dataset.

1. Introduction

Several studies have shown the relevant contribution of satellite systems for investigating and monitoring active volcanoes, also in areas where ground-based devices are fully operational (e.g., [1,2,3,4]). Those systems are capable of providing information about changes of thermal volcanic activity leading to eruptions and of estimating the radiant flux and the mass eruption rate (e.g., [5,6]). Moreover, they enable the identification of thermal anomalies associated with hot degassing. This aspect is particularly relevant, considering that short-term variations of non-eruptive thermal fluxes are essential for volcano monitoring (e.g., [7]).
Among the systems developed to monitor active volcanoes from space, MODVOLC exploits MODIS (Moderate Resolution Imaging Spectroradiometer), MIR (Medium Infrared) and TIR (Thermal Infrared) data, at 1 km spatial resolution, to detect and quantify high-temperature features such as lava flows. MODVOLC provides information about thermal anomalies in terms of hotspot pixel number, total MIR radiance and radiant flux, in both nighttime and daytime conditions [8,9].
MIROVA [3] is another well-established MODIS-based system, performing over more than 300 active volcanoes [10]. This system shows a good efficiency in also detecting subtle hotspots (e.g., [3]). On the other hand, the lack of sensitivity of MODVOLC to low-level thermal anomalies, ascribable to the use of a fixed threshold test used globally, was demonstrated in several previous studies, also through comparison with MODLEN [11] and RST (Robust Satellite Techniques) (e.g., [12,13]). The latter is a multi-temporal scheme of satellite data analysis, which was used with success to study and monitor several active volcanoes located in different geographic areas, using high temporal resolution satellite data, from sensors such as AVHRR (Advanced Very High Resolution Radiometer), MODIS and SEVIRI (Spinning Enhanced Visible and Infrared Imager) (e.g., [14,15]), offering an extended dataset of multi-year satellite observations. The algorithm has also shown a high potential in detecting subtle thermal activities, which may precede volcanic eruptions (e.g., [2,4,16]).
In this work, we assess the RST potential in detecting and mapping volcanic thermal anomalies by satellite through ASTER (Advanced Spaceborne Thermal Emission and Reflection Radiometer) TIR data, at 90 m spatial resolution. ASTER was largely used in volcanology, despite the nominal revisit time of 16 days, thanks to its features in terms of spectral and spatial resolution (e.g., [17,18] and reference herein). Here, we show the results of the preliminary RST implementation on ASTER data, performed under the Google Earth Engine (GEE) environment. GEE is a cloud-based platform providing access to thousands of satellite images (e.g., European Space Agency-Sentinel, United States Geological Survey-Landsat), and enabling their handling and analysis at planetary scale (see [19] for more details). The high computational resources of GEE were previously exploited to develop an freely accessible tool devoted to map volcanic thermal anomalies at global scale (https://sites.google.com/view/nhi-tool), using MSI (Multispectral Instrument) and OLI (Operational Land Imager) SWIR (shortwave infrared) data at 20/30 m spatial resolution [20,21]. Here, we evaluate the contribution of an RST-based system analyzing ASTER TIR data, named RASTer (Robust ASTER Thermal anomaly system), in supporting the operational monitoring of active volcanoes from space, particularly for subtle hotspots identification. Mt. Etna (Italy), Shishaldin (AK, USA) and Shinmoedake (Japan) thermal activities are analyzed in this study by comparing RASTer detections to those from the largely accepted AVA (Aster Volcano Archive) database.

2. Materials and Methods

2.1. Advanced Spaceborne Thermal Emission and Reflection Radiometer (ASTER)

ASTER is one of five instruments (i.e., CERES, MISR, MODIS and MOPITT) aboard the Terra platform, launched in December 1999. Until April 2008, ASTER has collected images in 14 spectral bands (an additional backward-looking band is used for stereographic observations) in the VNIR (visible and near infrared), SWIR and TIR regions (Table 1). Since April 2008, ASTER has provided data only in the VNIR and TIR bands, owing to the failure of SWIR instrument. Each ASTER scene covers an area of 60 × 60 km; the spatial resolution ranges from 15 m (VNIR) to 90 m (TIR). Due to several constraints (see [22]), ASTER data acquisition is not everywhere guaranteed every 16 days, as its acquisitions follow a pre-defined and/or an “on-demand” scheduling.
Since November 2016, all ASTER Level 1 Precision Terrain Corrected Registered At-Sensor Radiance Product (AST_L1T) have been made freely available in Google Earth Engine. Data stored in AST_L1T imagery are calibrated at-sensor radiance, and they have been geometrically corrected and rotated to a north-up in UTM projection (see [23] for more details).

2.2. Robust Satellite Techniques (RST)

The RST technique is an advanced change detection scheme (whose detailed description can be found in [24]), which considers each anomaly in space-time domain as a deviation from a “normal” state, which may be determined by analyzing multi-annual time series of homogeneous (e.g., same calendar month and overpass time) cloud-free satellite records. A statistically based index, named ALICE (Absolutely Llocal—double “l” is used to strengthen the concept that the index is local in space as well as in time [25]—Index of Change of the Environment [25]), taking into account the signal variability due to natural (e.g., different land covers, solar exposition) and observational (e.g., sun zenith angle, satellite view angles) conditions, enables the identification of anomalous events in the space-time domain, guaranteeing a high trade-off between reliability and sensitivity. The ALICE index, in its general formulation, is computed as follows:
V ( x , y , t ) = V ( x , y , t ) μ V ( x , y ) σ V ( x , y )  
where V ( x , y , t ) is the signal measured at the time t and location ( x , y ) , μ V ( x , y ) ,   and σ V ( x , y ) are corresponding expected value (generally the temporal mean) and standard deviation computed using a homogeneous dataset (see above).
The RST detection scheme was used in several previous studies to identify hotspots associated with volcanic activity (e.g., [2,4,12]), forest fires (e.g., [26]), gas flaring (e.g., [27]) and other events (e.g., [28]) analyzing MIR and/or TIR signal. Here, it is implemented, for the first time, on ASTER TIR data by assessing its performance in mapping thermal anomalies associated with volcanic activity.

2.3. Robust ASTER Thermal Anomaly System (RASTer)

In this paper, we implemented the RST algorithm under GEE by analyzing the signal measured in the ASTER channel 13, which is centered at 10.6 µm (see Table 1). The index in Equation (1) is then calculated pixel by pixel, according to the general RST prescriptions:
T I R ( x , y , t ) = B T 10.6 ( x , y , t ) μ B T 10.6 ( x , y ) σ B T 10.6 ( x , y )
In Equation (2), the role of the variable V(x,y,t) is played by the brightness temperature B T 10.6 ( x , y , t ) measured at the Top of Atmosphere (TOA) at around 10.6 µm (band 13), μ B T 10.6 ( x , y ) , and σ B T 10.6 ( x , y ) are the temporal mean and standard deviation computed for each location (x,y) over 20 years (i.e., 2000–2020) of ASTER observations (e.g., a total of 635 ASTER images were analyzed to generate the spectral reference fields at Shinmoedake). The T I R ( x , y , t )   index is a standardized variable having a Gaussian behavior. Hence, pixels having values of T I R ( x , y , t ) > 3   have a probability around 99.85% of being anomalous (e.g., [13]). As discussed in previous studies, the ALICE index is intrinsically protected against site effects (e.g., natural warming of volcanic rocks [2]). On the other hand, in this work, due to a dataset much less populated than other sensors (in average 25–35 ASTER daytime/nighttime images per month, spanning over twenty years of observations, are available), we used a normalized index in combination with that in Equation (1) to also detect subtle hotspots with a high confidence level of detection:
N D B 12 B 13 ( x , y , t ) = B T 9.1 ( x , y , t ) B T 10.6 ( x , y , t )   B T 9.1 ( x , y , t ) + B T 10.6 ( x , y , t )    
In Equation (3), B T 9.1 ( x , y , t ) and B T 10.6 ( x , y , t ) are the brightness temperatures measured at ~9.1 µm (i.e., band 12) and ~10.6 µm (i.e., band 13). TOA (Top of Atmosphere) BT values were calculated from the radiance at sensor. High-temperature targets, emitting strongly at shorter rather than longer TIR wavelengths, should lead to positive values of the NDB12-B13 index. Hence, RASTer identifies thermal anomaly if at least one of the following conditions is satisfied:
{ T I R ( x , y , t ) 4   ( h i g h   i n t e n s i t y   h o t   s p o t s ) O R T I R ( x , y , t ) 3   A N D   N D B 12 B 13 ( x , y , t ) > 0   ( m i d l o w   i n t e n s i t y   h o t   s p o t s )
The first test enables the identification of high-temperature features such as lava flows, while the second one should favor the identification of less intense hotspots (e.g., those associated with a mid-low Strombolian activity), increasing the confidence level of detection by combining the two above defined indices (i.e., T I R ( x , y , t ) and NDB12-B13).

2.4. The AVA Database

The ASTER Volcano Archive (AVA) is an archive of over more than 1500 active volcanoes dedicated to their global monitoring, providing access to thousands of daytime and nighttime ASTER imagery at full resolution. Moreover, the AVA database also includes information about spectral signatures of volcanic emissions (e.g., eruption columns and plumes), surficial deposits (e.g., lava flows) and eruption precursor phenomena (e.g., [29]). Since 2000, the AVA database has included products (e.g., thermal anomalies maps) generated from ASTER L1B granules. The AVA database, whose data and products are disseminated in a common format (e.g., HDF, TIFF, KML) through the website http://ava.jpl.nasa.gov was continuously updated until late 2017 ([18]). Information from this ASTER-based system was also used to assess thermal anomalies flagged by algorithms running on high temporal resolution satellite data (e.g., [30]). In this paper, we compare RASTer to AVA detections by quantifying differences in detecting and mapping thermal anomalies through ASTER TIR data over three different volcanic areas (see next section).

3. Results

3.1. Etna Volcano

Mt. Etna (37.748° N–14.999° E) is a stratovolcano located in Sicily (Italy) and represents one of the most active volcanoes in Europe. Gas/ash emissions, Strombolian activities, lava fountains and lava flows generally characterize its eruptive activity [31,32]. Mt. Etna eruptions generally occur from summit craters (i.e., Voragine, Bocca Nuova, North East Crater, Southeast Crater and New Southeast Crater; [33], e.g., during 2011–2015, [34,35,36], as well as at the time of writing, intense paroxysms occurred; [37]), although some voluminous flank eruptions were also recorded in recent years (e.g., July–August 2001; October 2002–January 2003; September 2004–March 2005; May 2008–July 2009; [38,39]).
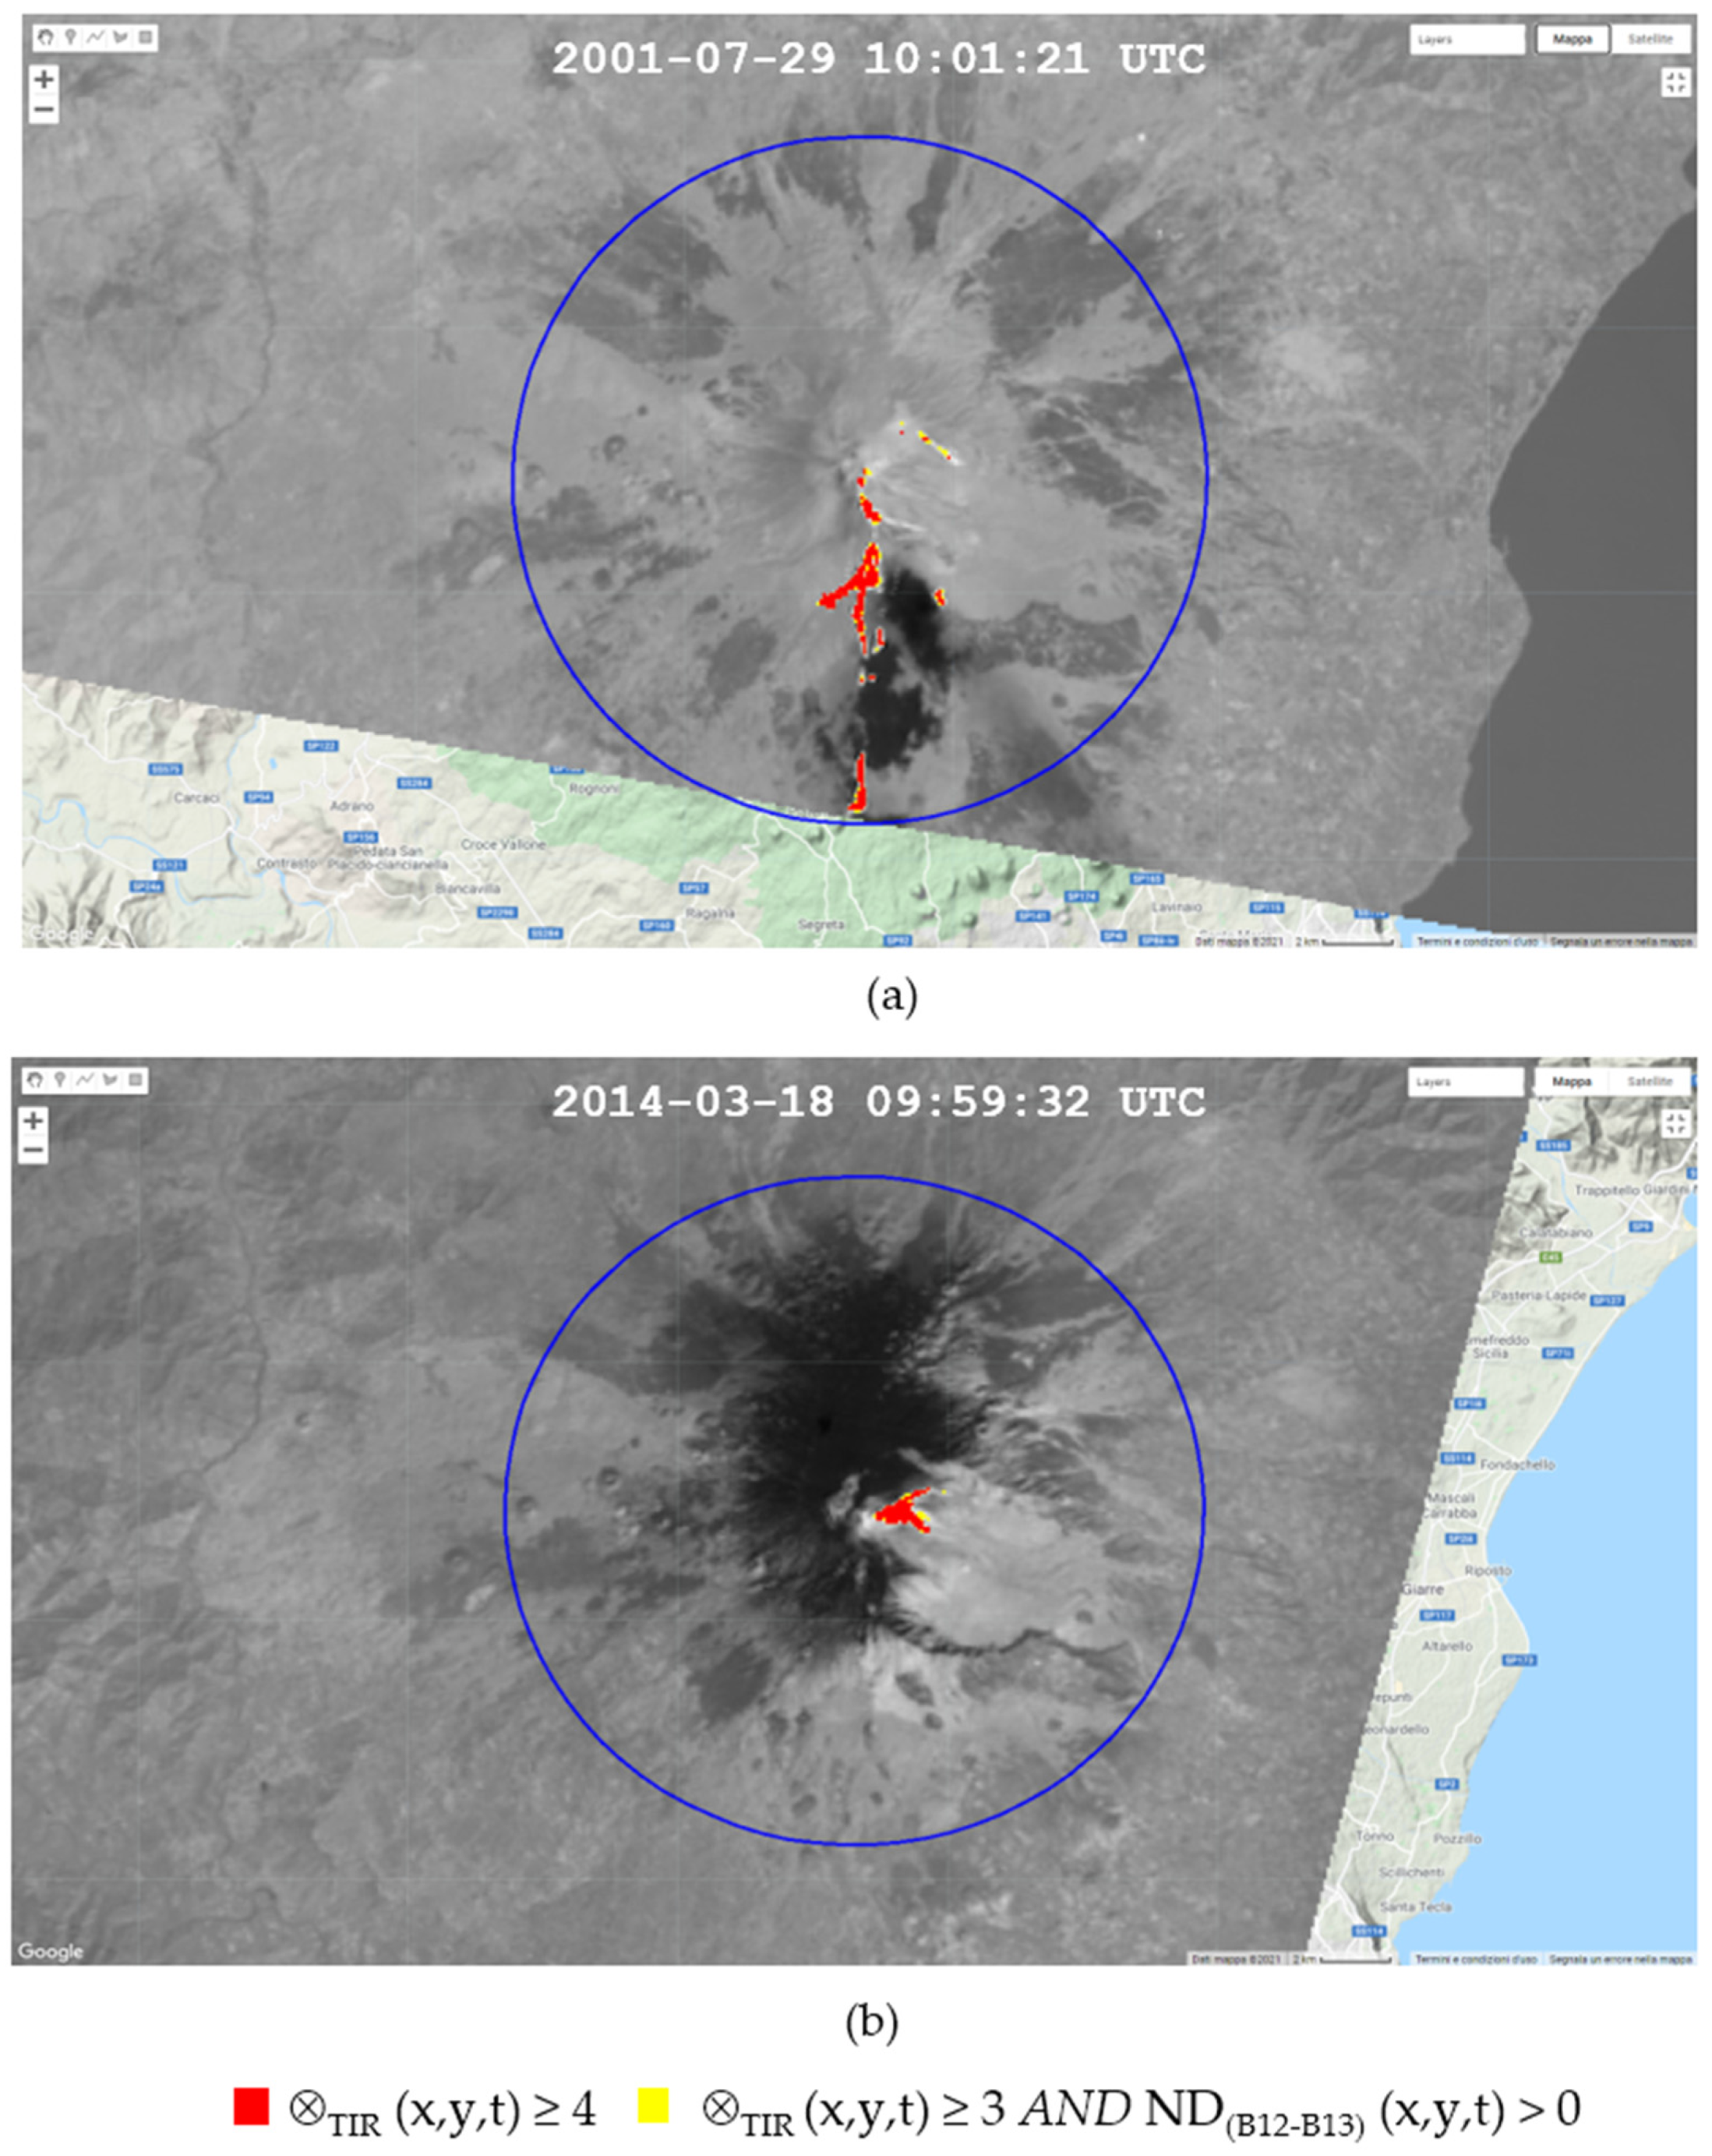
Figure 1 displays the temporal trend of hot pixels flagged by RASTer (red triangles) and AVA (green triangles) at Mt. Etna over the period 2000–2017 by analyzing an area of 10 km of radius centered around the summit crater. The plot shows that both RASTer and AVA considered the eruptive events of July 2001 as the most intense (see hot pixels number). In general, all the flank eruptions (see boxes in Figure 1) occurring during the investigated period were well detected by both systems. Figure 2 displays, for instance, the thermal anomaly maps generated by RASTer during some Mt. Etna flank eruptions. In particular, the daytime ASTER scene of 29 July 2001 (Figure 2a) shows how RASTer mapped the areas inundated by lava (see red and yellow pixels), indicating that the lava flow, moving in the south direction, extended up to about 1120 m elevation. Figure 2b displays the RASTer detection of 18 March 2014, showing a lava overflow from summit craters.
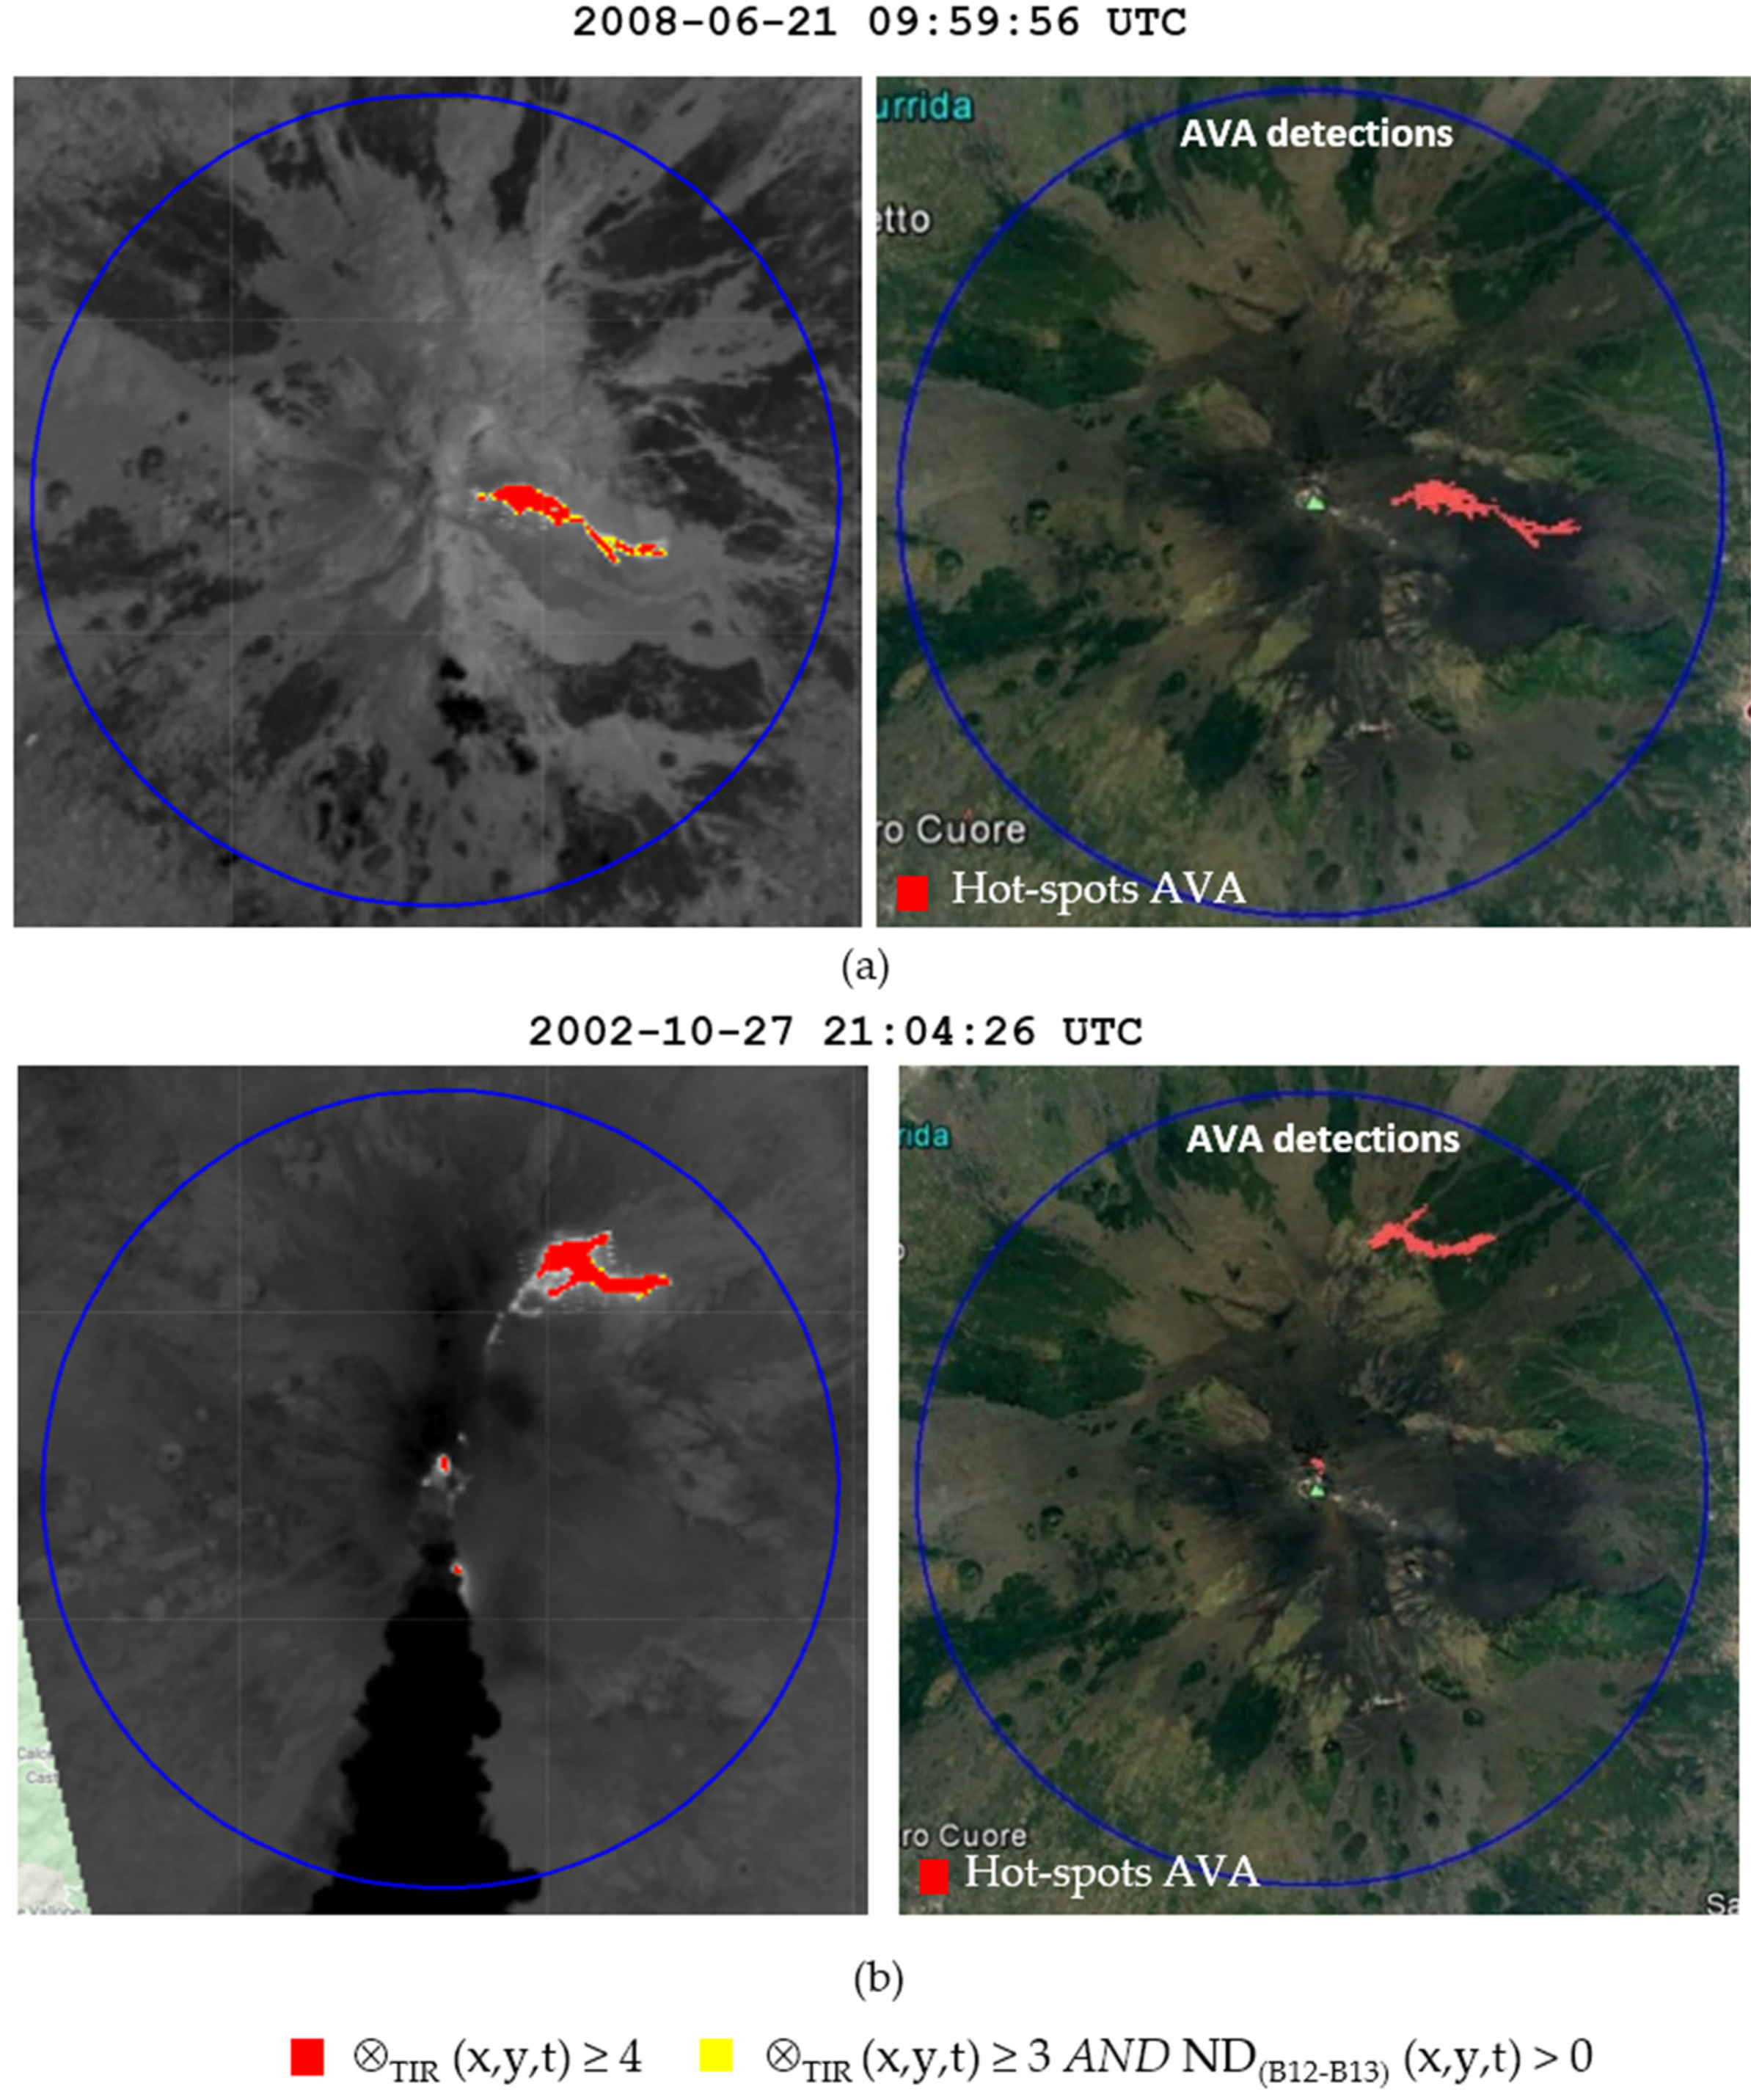
In comparison with AVA, RASTer was capable of better mapping also less extended thermal anomalies (e.g., those associated with moderate Strombolian activities). Two examples are shown in Figure 3, displaying AVA and RASTer detections in reference to the Mt. Etna flank eruptions of 21 June 2008 and 27 October 2002. It is worth noting as RASTer was capable of mapping extensively and continuously (in the space domain) the main lava flows. Moreover, it correctly identified (on 27 October 2002, Figure 3b) some thermal anomalies that were not flagged at all by AVA (see crater area).
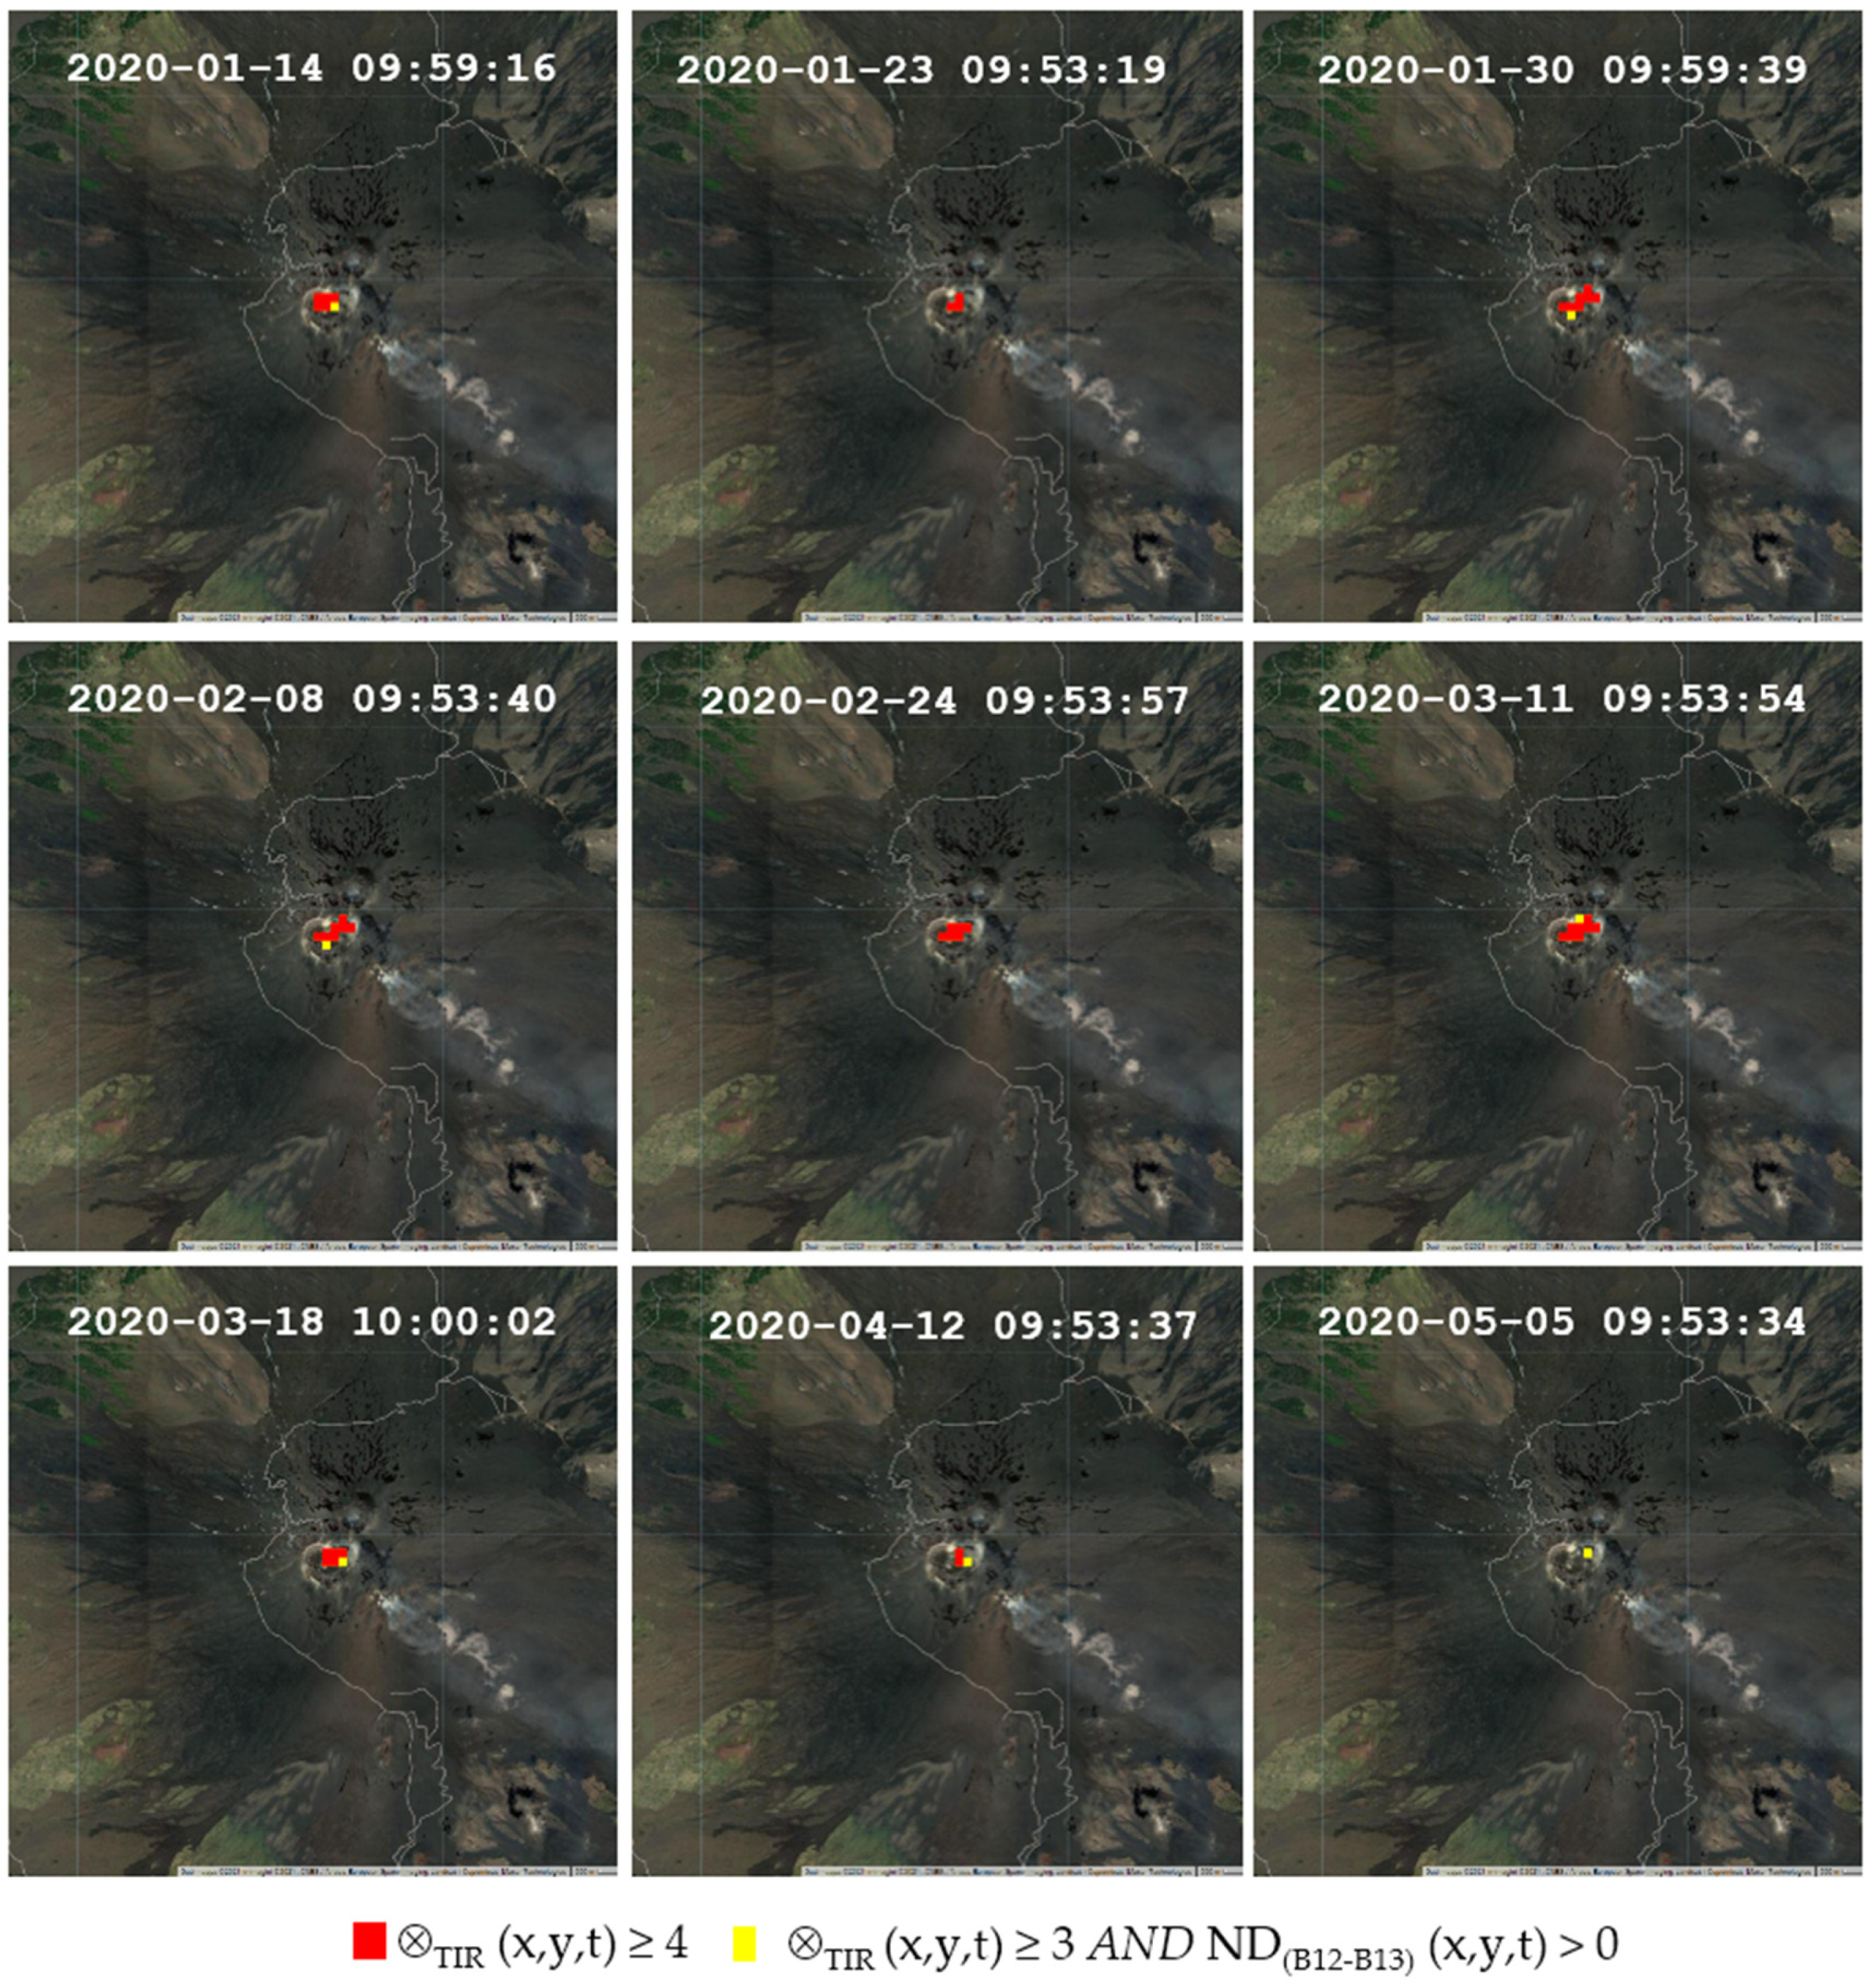
The potential of RASTer in detecting subtle hotspots is emphasized in Figure 4, in reference to Strombolian activity of January–May 2020. The figure shows the identification of a thermal anomaly at the summit craters, where a Strombolian activity, gas-and-steam and ash emissions occurred since October 2019 (https://www.ct.ingv.it/, multidisciplinary bulletins), becoming spatially more extended during February–early March 2020. Afterward, the number of hot pixels decreased, marking the reduction of thermal volcanic activity at the Voragine-Bocca Nuova (VOR-BN) complex (the former Central Crater of Mt. Etna). The comparison with information from field observations demonstrates the capacity of the RASTer system in monitoring the whole dynamic of Mt. Etna thermal activity, up to its lowest levels of intensity.

3.2. Shishaldin Volcano

Shishaldin volcano is one of over 40 active volcanoes of Alaska (USA). This stratovolcano, which is located in the Unimak Island (54.7554° N–163.9711° W), has a nearly symmetrical cone (~16 km of diameter at the base) and reaches 2857 m above sea level (the highest altitude in the Aleutian Islands). About 40 historical eruptions have occurred at Shishaldin volcano (a summary of those events can be found in [40]). After 2000, a number of eruptive episodes occurred; the main eruption occurring during 2000–2017 was that recorded on 17 January 2014. It was characterized by the lava emission within the crater, low-level steam plumes, sporadic dustings of ash and ballistics on volcano flanks [41]. Starting from 30 January 2014, satellite observations revealed an increase of the surface temperature [42]. The presence of lava inside the crater was then reported on 25 March, 13 May, 1 October and in late January 2015 [40,42]. Afterwards, Shishaldin showed a low-level activity, continuing throughout 2015 and until the first months of 2016. A new lava emission inside the crater occurred on 23 October 2019. In the following weeks, lava flowed down the N and NE flanks; lava flows were revealed by independent satellite observations during November–December 2019 [43]. In January 2020, a new lava effusion occurred; lava affected the northeast (traveling down for 2 km) and north flanks, producing meltwater lahars [43].
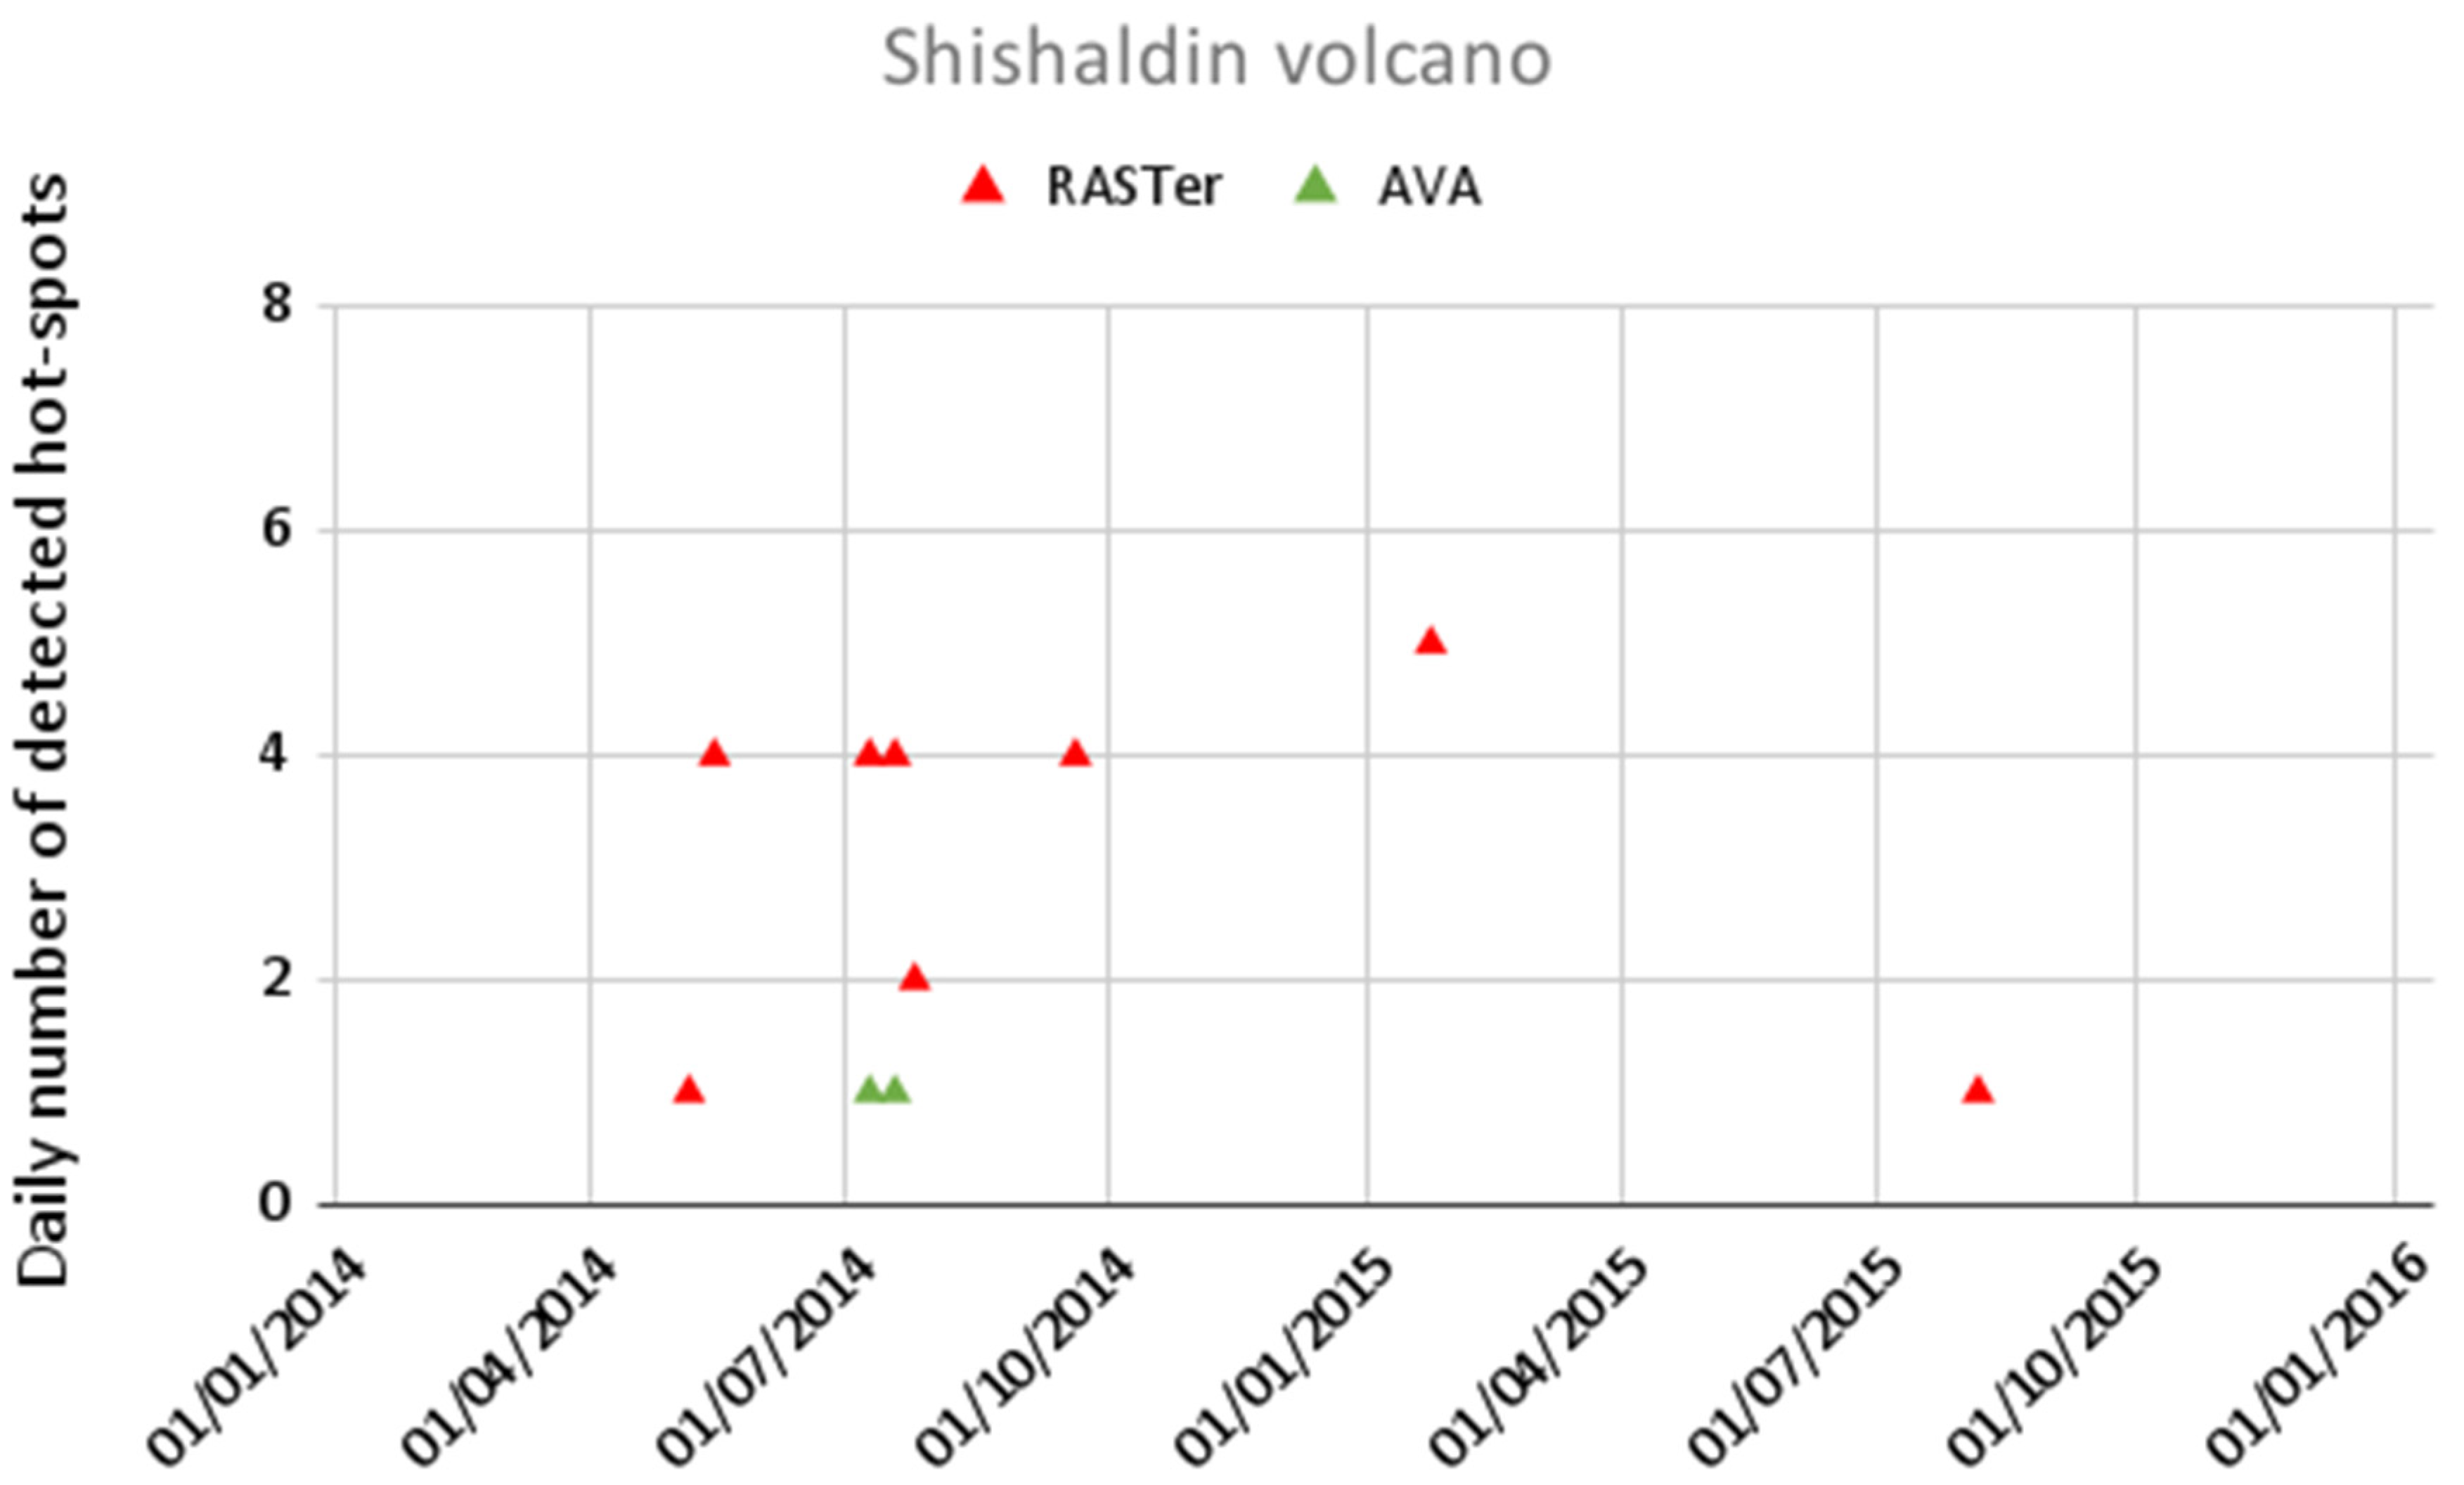
Figure 5 displays the time series of RASTer and AVA detections at Shishaldin for the period January 2014–2016, when both systems were operational. We considered an area of 8000 m of radius around the summit crater to perform the comparison. The plot shows that RASTer detected a higher number of thermal anomalies than AVA and better emphasized a number of eruptive episodes of the investigated volcano (in terms of daily number of hotspots), indicating that the most intense Shishaldin activity occurred on 24 January 2015, in presence of lava inside the crater.
Additionally, to assess the RASTer capacity in providing information about thermal anomalies at Shishaldin in recent years, Figure 6a shows an example of thermal anomalies detected on ASTER TIR data on 20 October 2019, in correspondence with a minor thermal activity that occurred at the summit crater. Figure 6b displays the lava flow on 8 January 2020, separating in two branches moving in the NW and NE direction, respectively. Those maps confirm the RASTer efficiency in mapping lava flows (providing unique information in periods when AVA products were not available), preserving a high sensitivity level even in areas located at the high latitudes, characterized by a cold background, where traditional fixed thresholds methods generally do not perform well (e.g., [44]).

3.3. Shinmoedake Volcano

Shinmoedake (31.931° N–130.864° E) is an andesitic stratovolcano (1421 m above sea level) located in Kyushu (Japan). The major Shinmoedake eruption occurred during 1716–1717. Other intense eruptive events were those of 1822, 1959, 1991 and 2008 (e.g., [45]). In recent years, a new eruption occurred on 19 January 2011 ([46]). On 28 January, a lava dome of about 200 m in diameter appeared on the crater floor. In the following three days, the dome grew up to 600 m in diameter, as indicated by independent satellite observations and overflights (e.g., [45,47]). The dome stopped growing in early February and only a number of explosive episodes occurred in the following months.
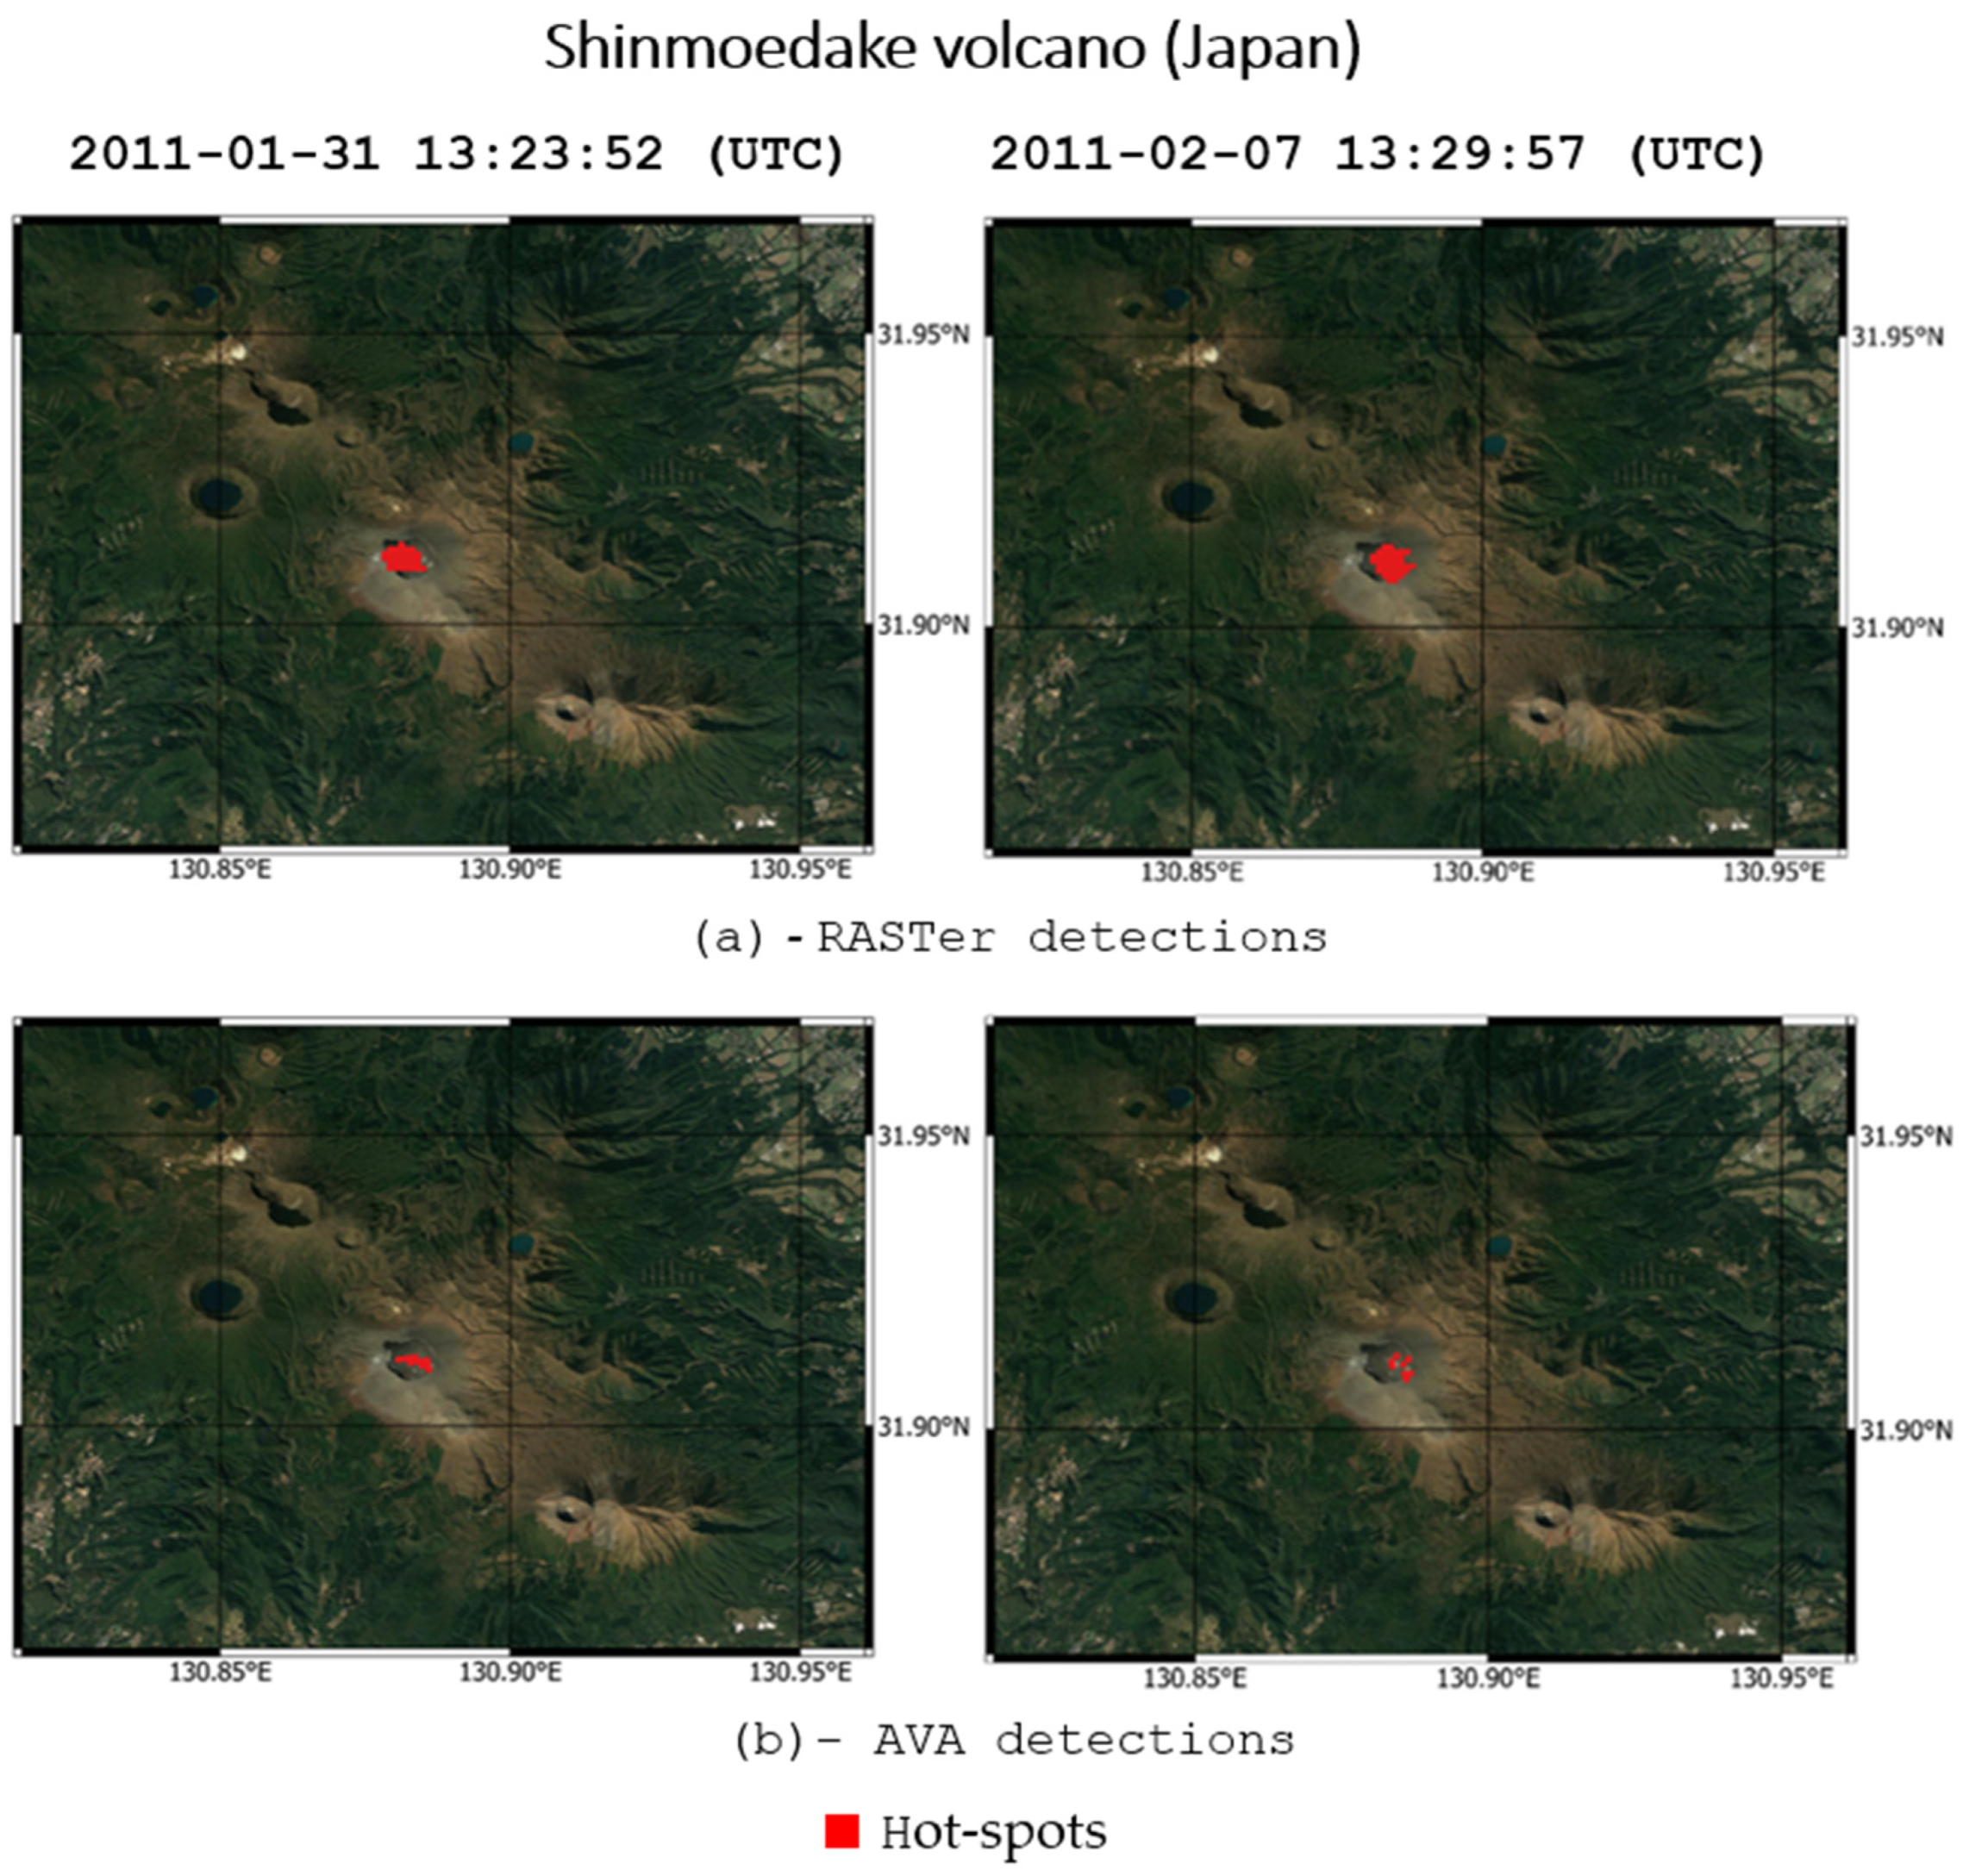
The comparison of RASTer and AVA detections at Shinmoedake revealed the occurrence of only two thermal anomalies over 17 years of ASTER observations. They were associated with the January–February 2011 eruption. Figure 7 shows these features, revealing that RASTer detected a higher number of hot pixels than AVA. In detail, Figure 7a shows the thermal anomalies associated with a lava dome inside the crater (on ASTER scenes of 31 January and 7 February 2011), which were underestimated by the AVA system (see Figure 7b).
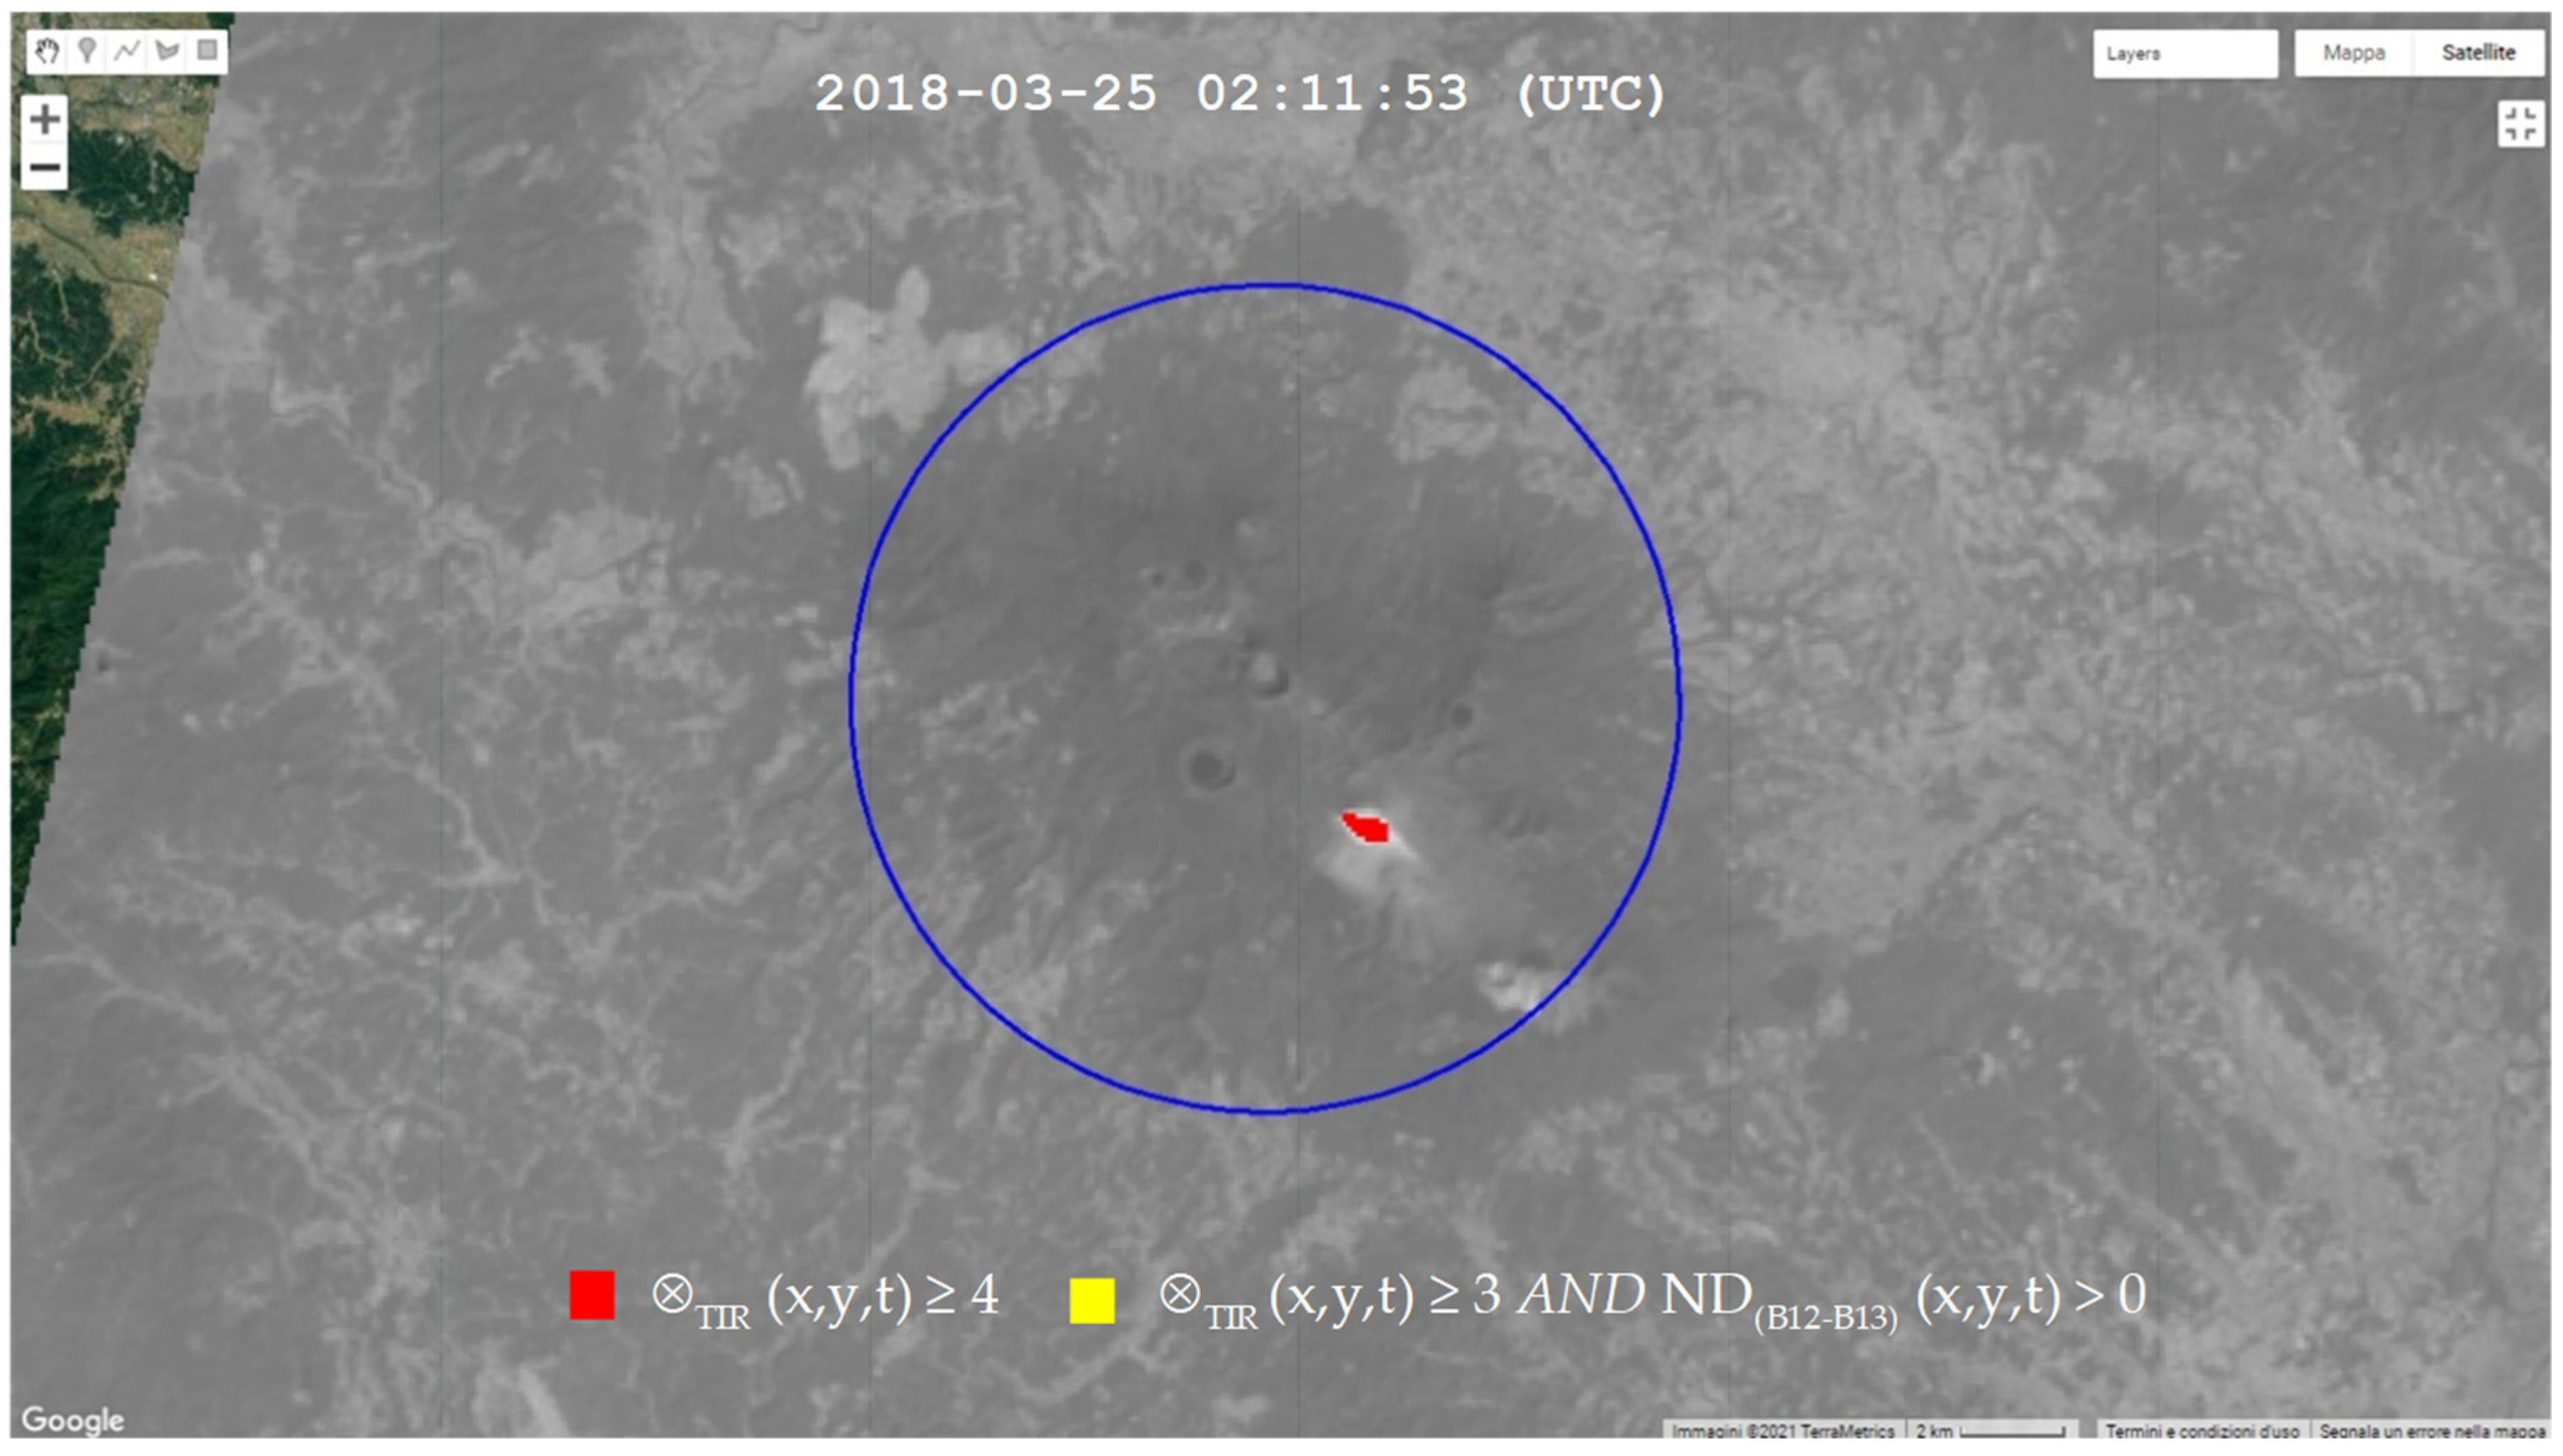
After the eruptive episodes of 2011, a new eruption was recorded on 6 March 2018. A lava overflow to the NW rim of the summit crater was then observed three days later ([48]). Lava effusion stopped at the end of April 2018. Even in this case, it was not possible to compare RASTer with AVA detections. Figure 8 shows the thermal anomaly detected by RASTer from ASTER TIR data on 25 March 2018, confirming with a high accuracy level the capacity of the proposed system in mapping lava flows.

4. Discussion

We compared the RASTer and AVA detections in both nighttime and daytime conditions over three different active volcanic areas. Table 2 summarizes the results of this comparison, performed over the period May 2000–August 2017. The first column shows that at Mt. Etna and Shinmoedake, RASTer and AVA flagged the presence of thermal anomalies on the same number of ASTER scenes, although the number of hot pixels was significantly different (see second column). Common thermal anomaly detections characterized up to 86 ASTER scenes over Mt. Etna (see third column) where, however, higher was the number of hot pixels flagged by RASTer. On the other hand, the number of unique detections (fourth column) shows a possible complementarity of the two systems, which could increase the continuity of information. In general, the higher number of hotspots flagged by RASTer reveals a higher sensitivity to mid-low intensity thermal anomalies than AVA. This is also confirmed by results achieved at Shishaldin volcano, where only two thermal anomalies were flagged by AVA (see also results section).
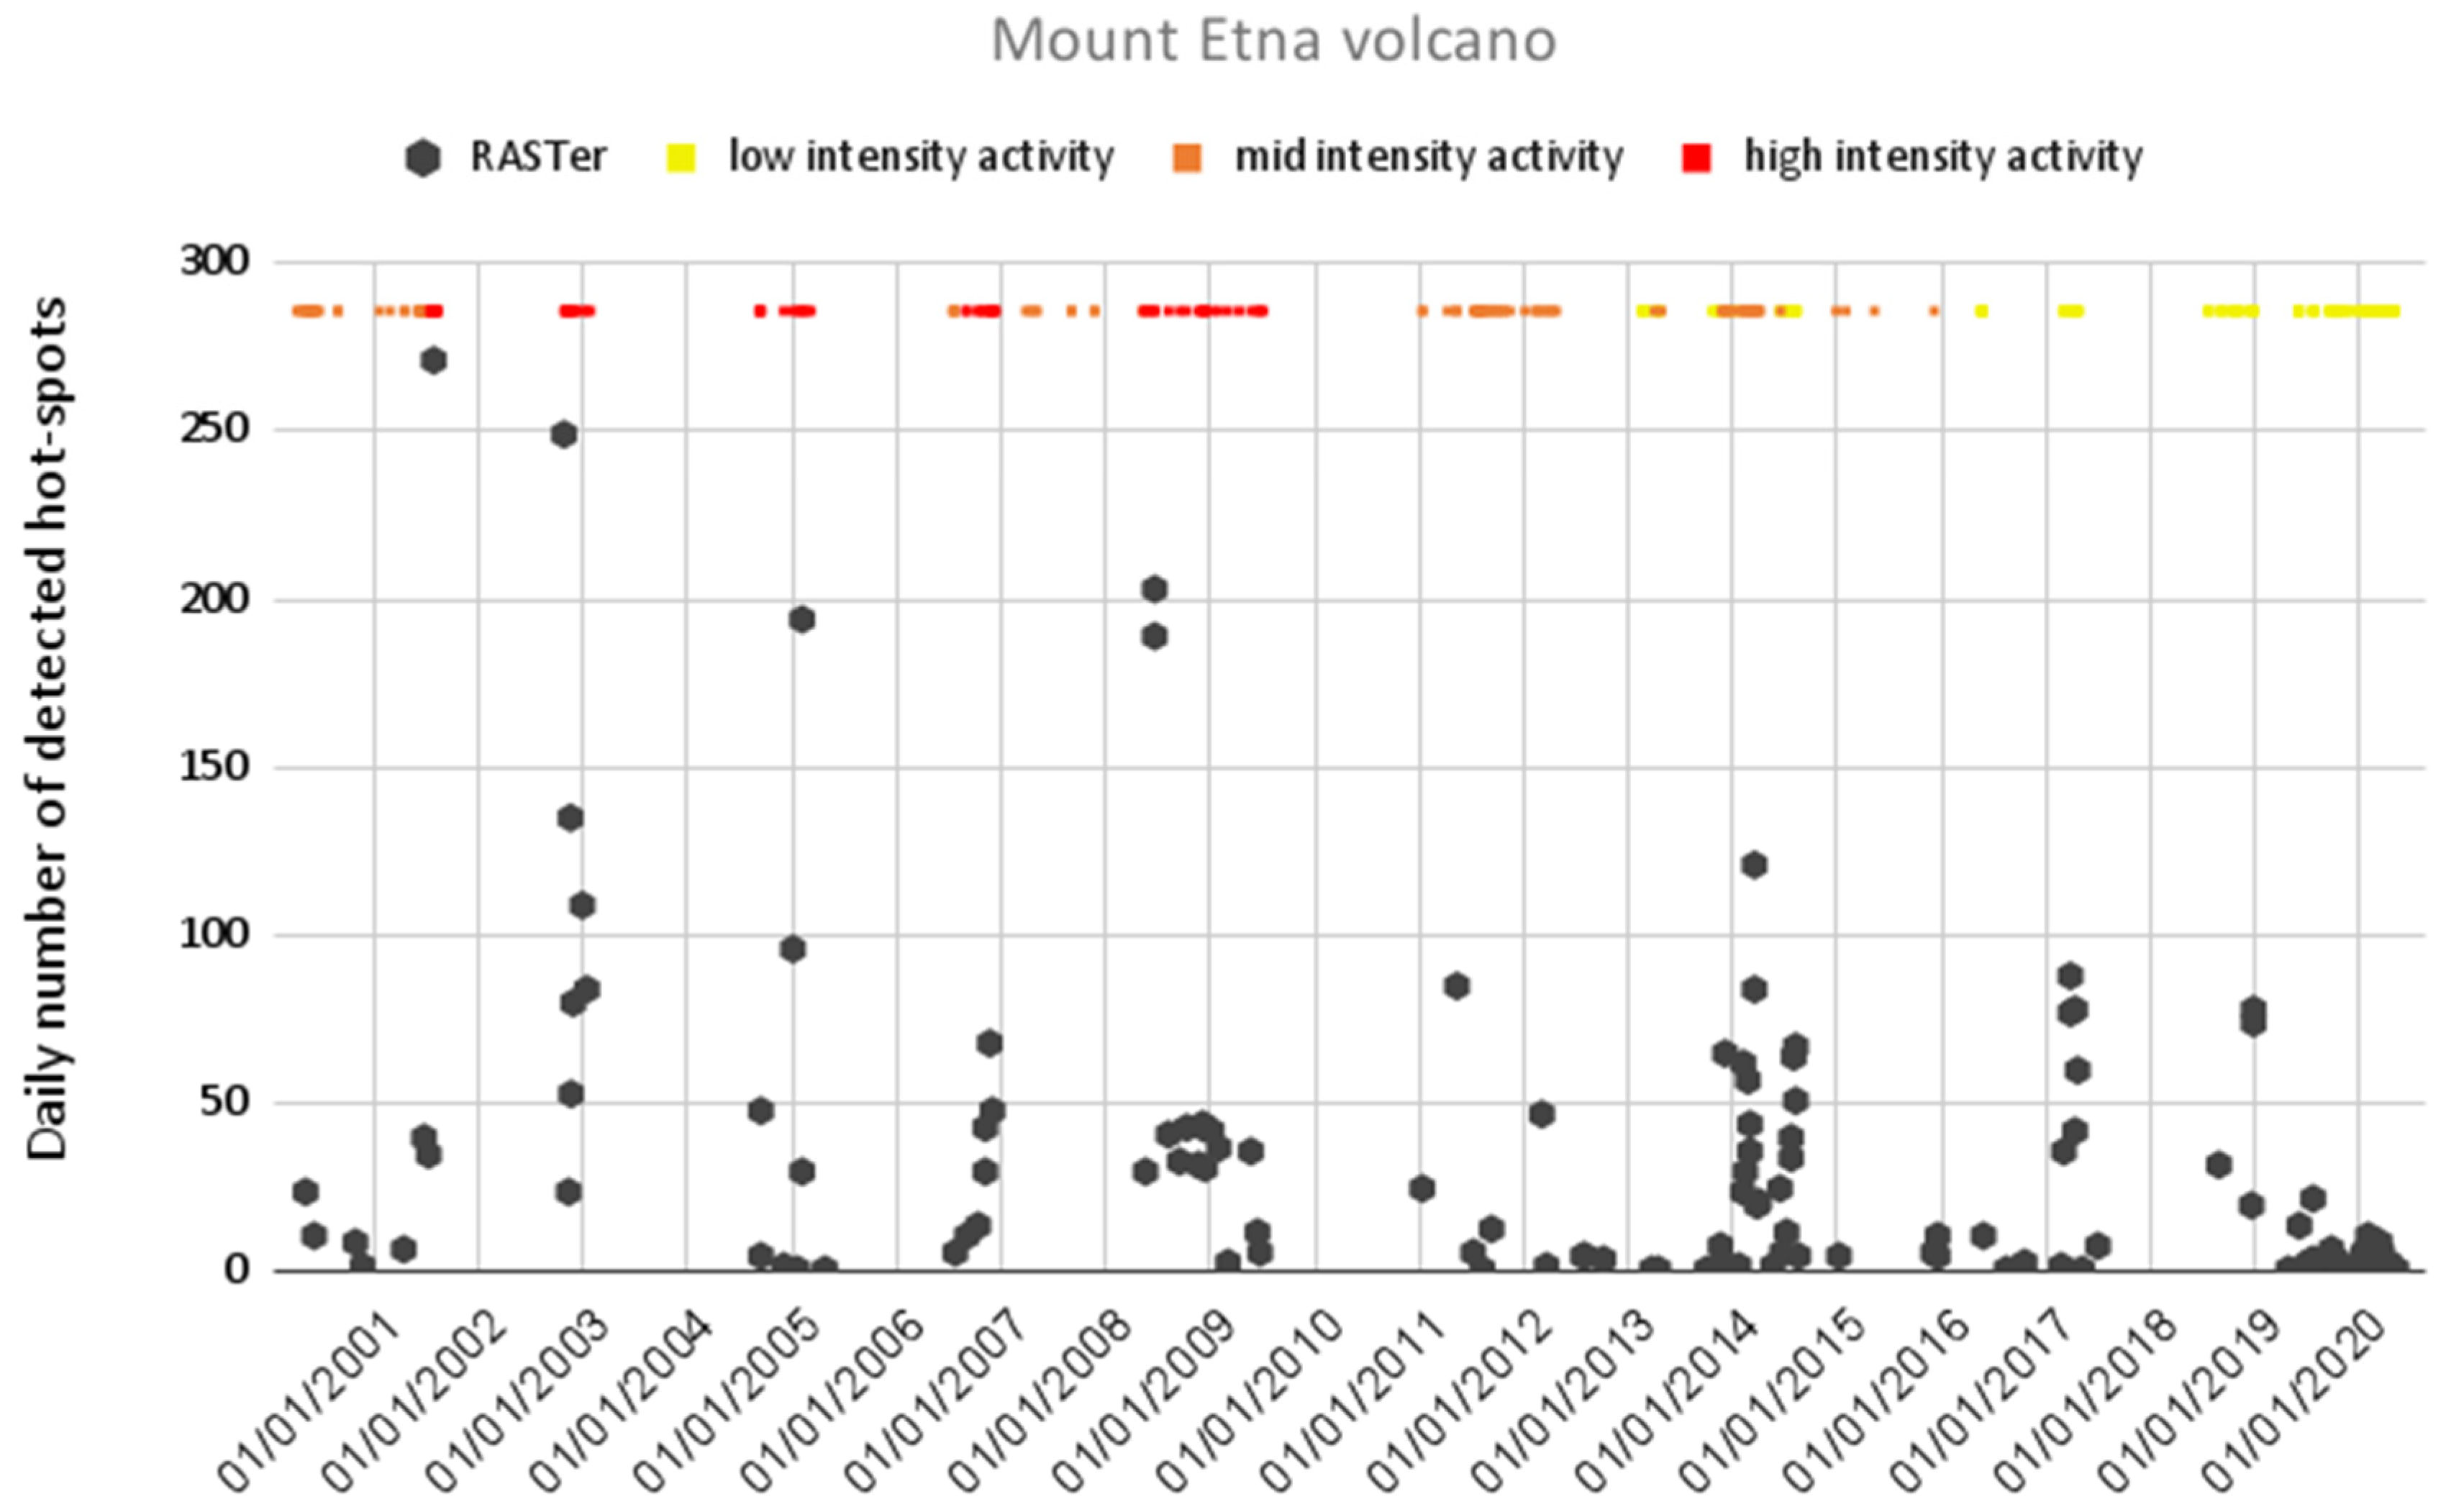
Thermal anomalies flagged by RASTer, including those undetected by AVA, were in good agreement with information from volcanological reports, as shown for instance in Figure 9 in reference to the Mt. Etna activity. The figure displays the thermal anomalies detected by RASTer on ASTER data of 2000–2020 and three different levels of thermal activity derived from field reports, independent observations and scientific papers [33,34,35,36,37,38,39,49,50]. It should be pointed out that RASTer detections were mostly associated with documented periods of Mt. Etna activity. An analysis is currently in progress to better assess hotspots flagged in periods of undocumented thermal volcanic activity (e.g., 27 July and 4 August 2012). Those features were probably associated with minor thermal activities (e.g., [12]) unreported by field reports, also confirming the relevance of satellite observations in providing information about subtle phases of unrest in well-monitored volcanic areas (e.g., [4]). Regarding the Shishaldin volcano—where, as for Shinmoedake, a long-quiescence period occurred, about 88.8% of detected thermal anomalies were ascribable to intra-crater thermal activities (e.g., May 2014–January 2015), and to lava effusions from volcano flanks (e.g., January 2020) reported by the Global Volcanism Program (GVP). Thermal anomaly detected by RASTer, ASTER scene of 12 August 2009, which was not confirmed by field reports, is consistent with MODIS observations of July–August 2009 [51].
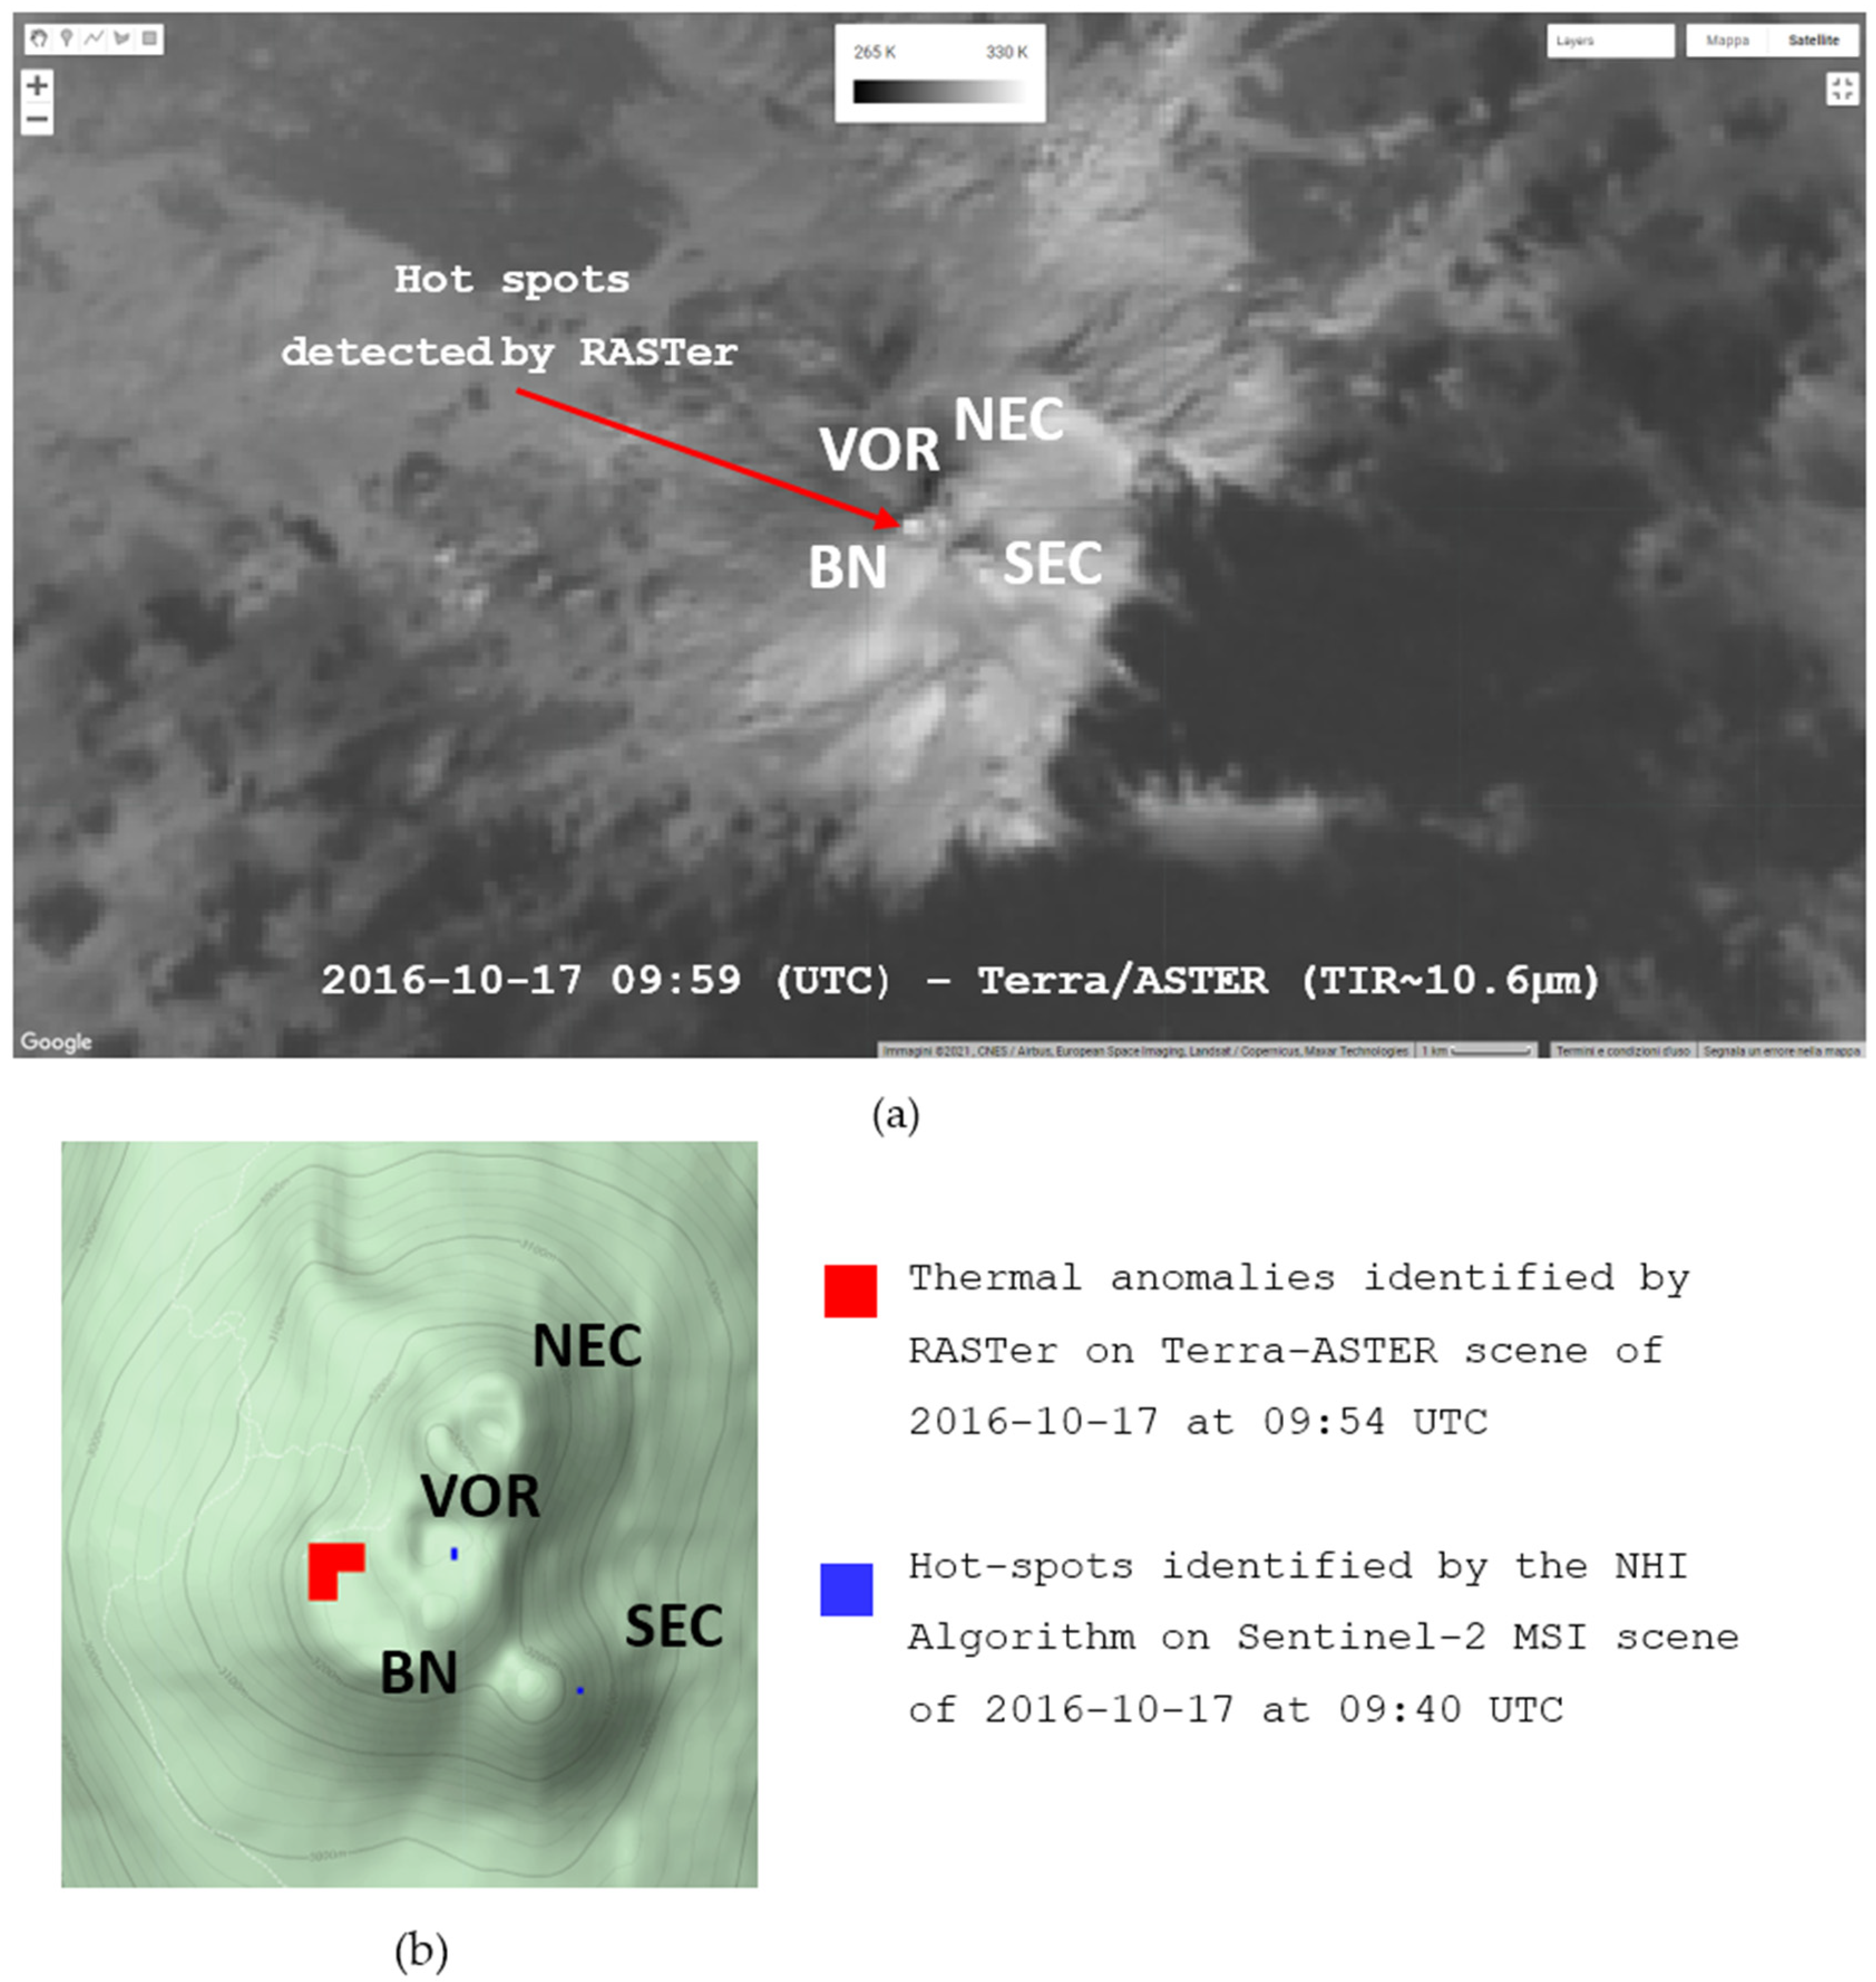
Those results show that RASTer provided reliable information about volcanic thermal features of a different intensity level. This aspect is particularly relevant, considering that the RST technique for volcanological applications (e.g., RSTVOLC algorithm) was previously implemented on high temporal (low spatial) resolution satellite data, for which statistical analyses can be based on a highly populated dataset. Hence, this work demonstrates that RST is also capable of providing reliable results using mid-high spatial resolution satellite data and in the presence of a less populated dataset (as for ASTER). It should be stressed that, in this case, we did not implement the iterative pre-process used by RST to remove signal outliers (e.g., extremely hot/cold pixels) [24] within GEE. Nonetheless, RASTer was capable of performing an accurate mapping of thermal anomalies, as shown in Figure 10 in reference to the ASTER scene of 17 October 2016 at 09:59 UTC. In detail, Figure 10a shows the identification of some anomalous pixels at BN-VOR over the Mt. Etna crater area. This thermal anomaly detection integrated information retrieved from the Sentinel-2 MSI scene of the same day at 09:40 UTC, provided by the NHI (Normalized Hotspot Indices) algorithm through the GEE-based tool [20]. The latter, indeed, flagged some hot pixels over SEC (Southeast Crater-New Southeast Crater complex), (see blue pixels in Figure 10b), but did not provide information about the BN-VOR thermal activity detected by RASTer (red pixels). This thermal activity is probably associated with the presence of incandescent material under the fresh lava, which was independently observed on the ground a few days before the ASTER overpass (e.g., [52]). Differences in thermal anomaly identification are ascribable to the known limitations (e.g., missed detections in presence of degassing plumes [24]) and advantages (mainly associated with the use of satellite data at higher spatial resolution) of the NHI algorithm, which exploits NIR-SWIR Sentinel-2/MSI observations, when compared with the RST-based approach applied here to ASTER TIR data.
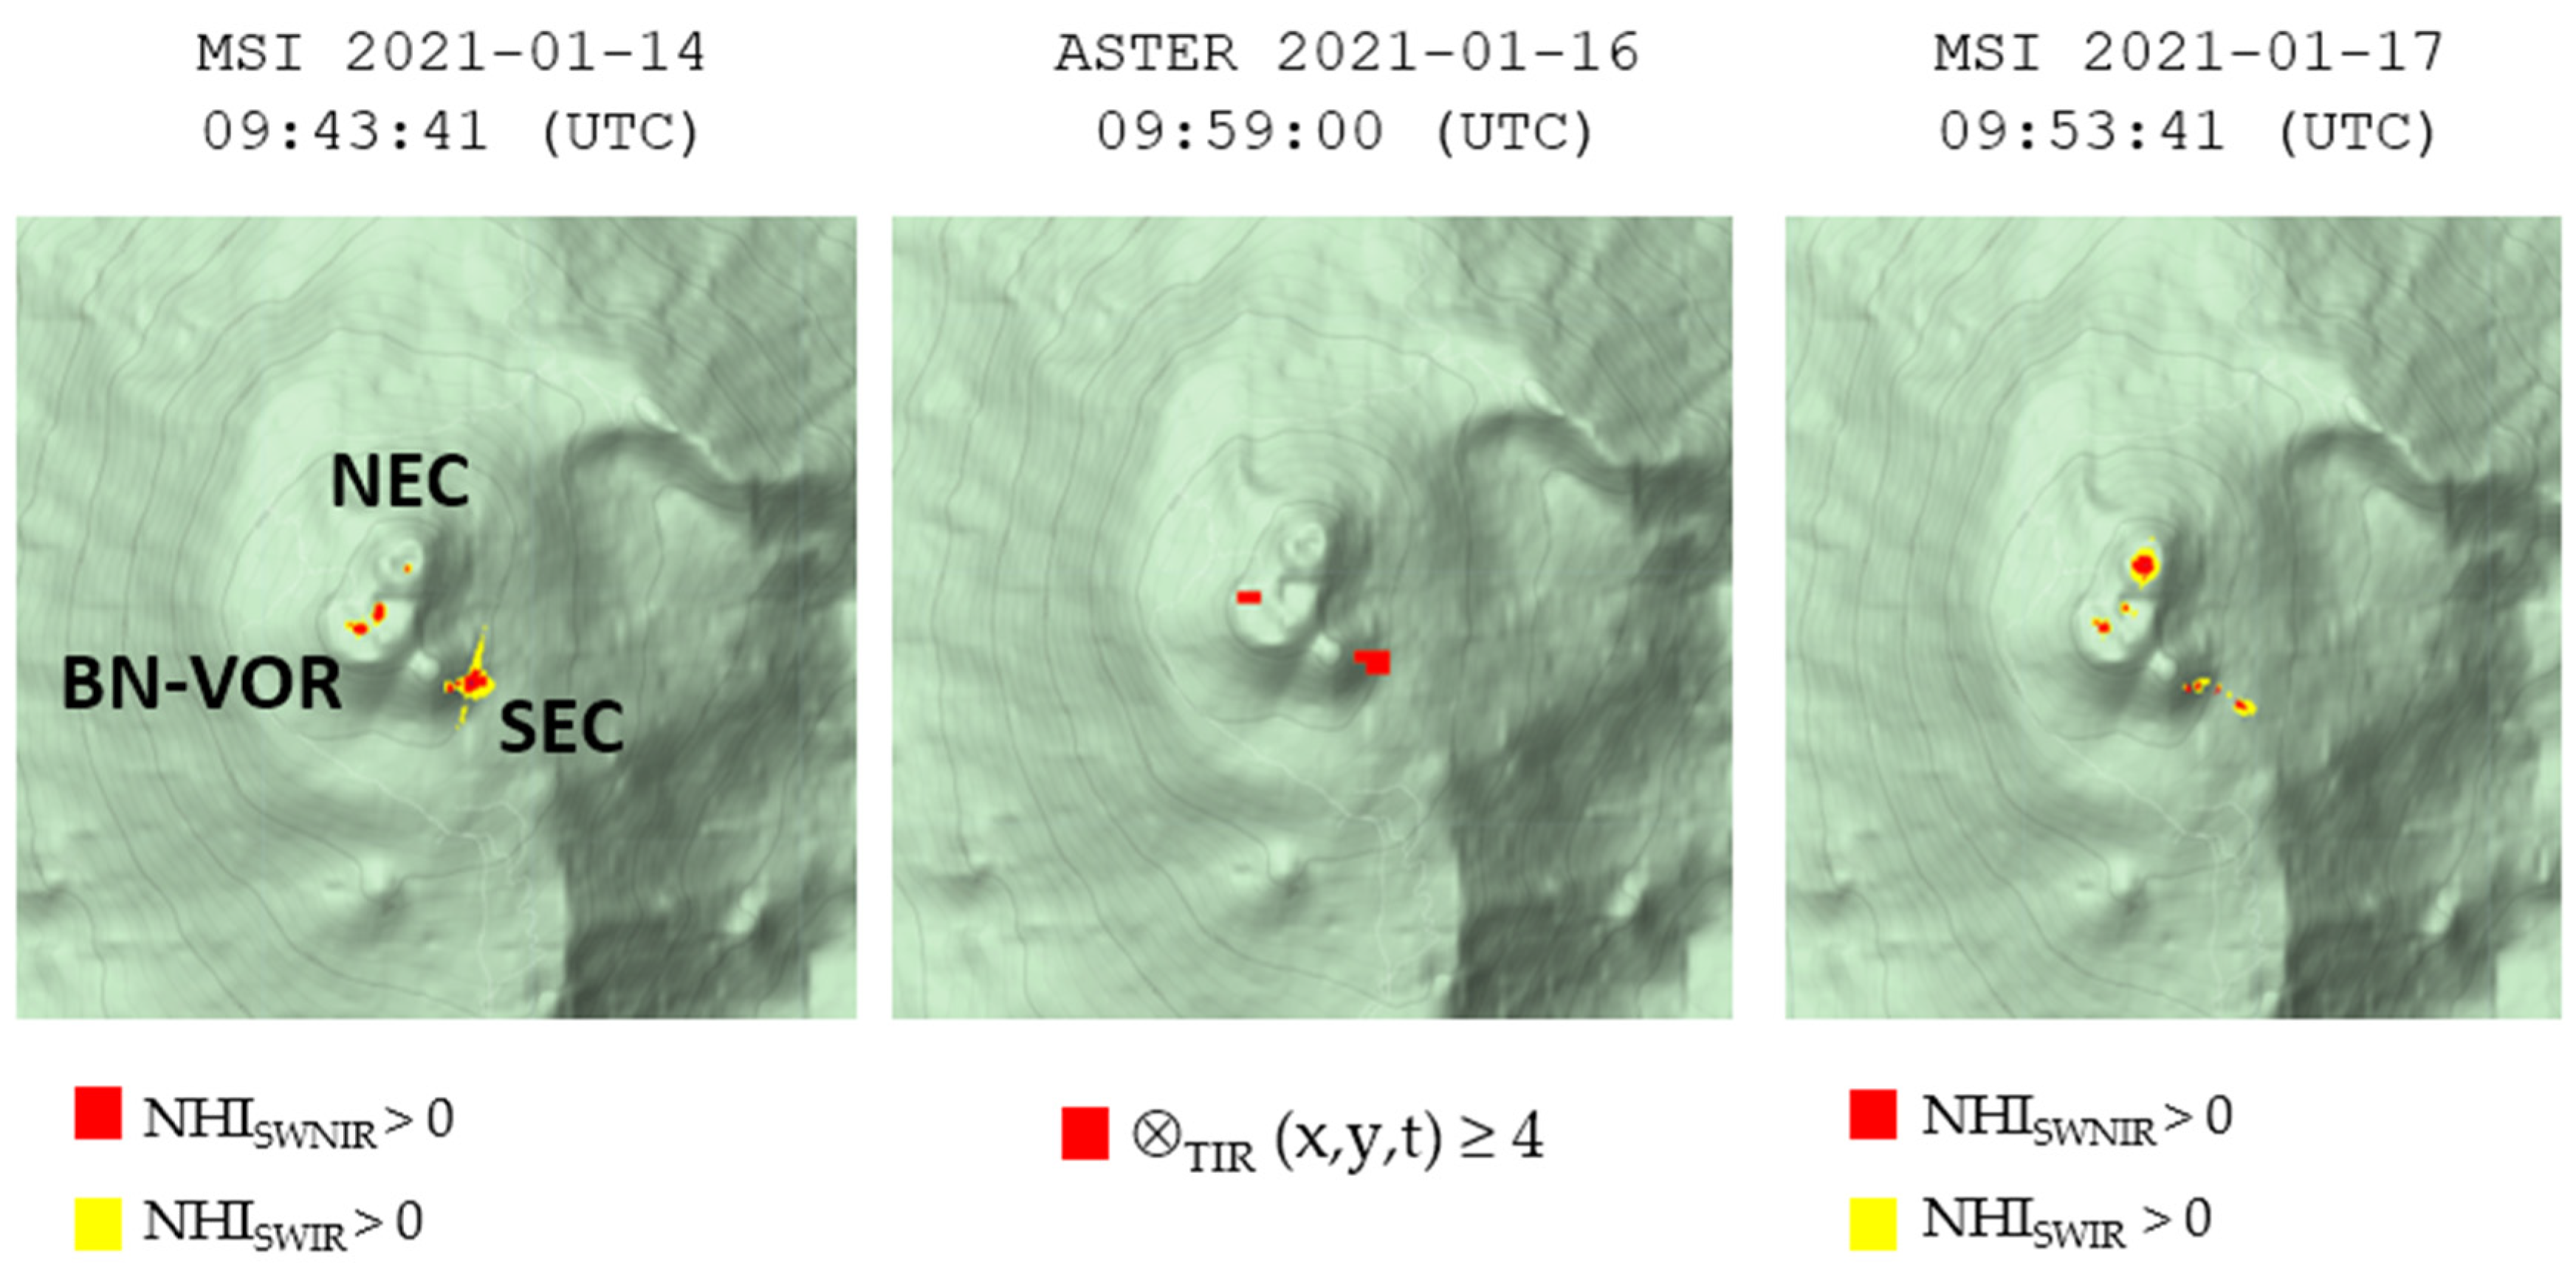
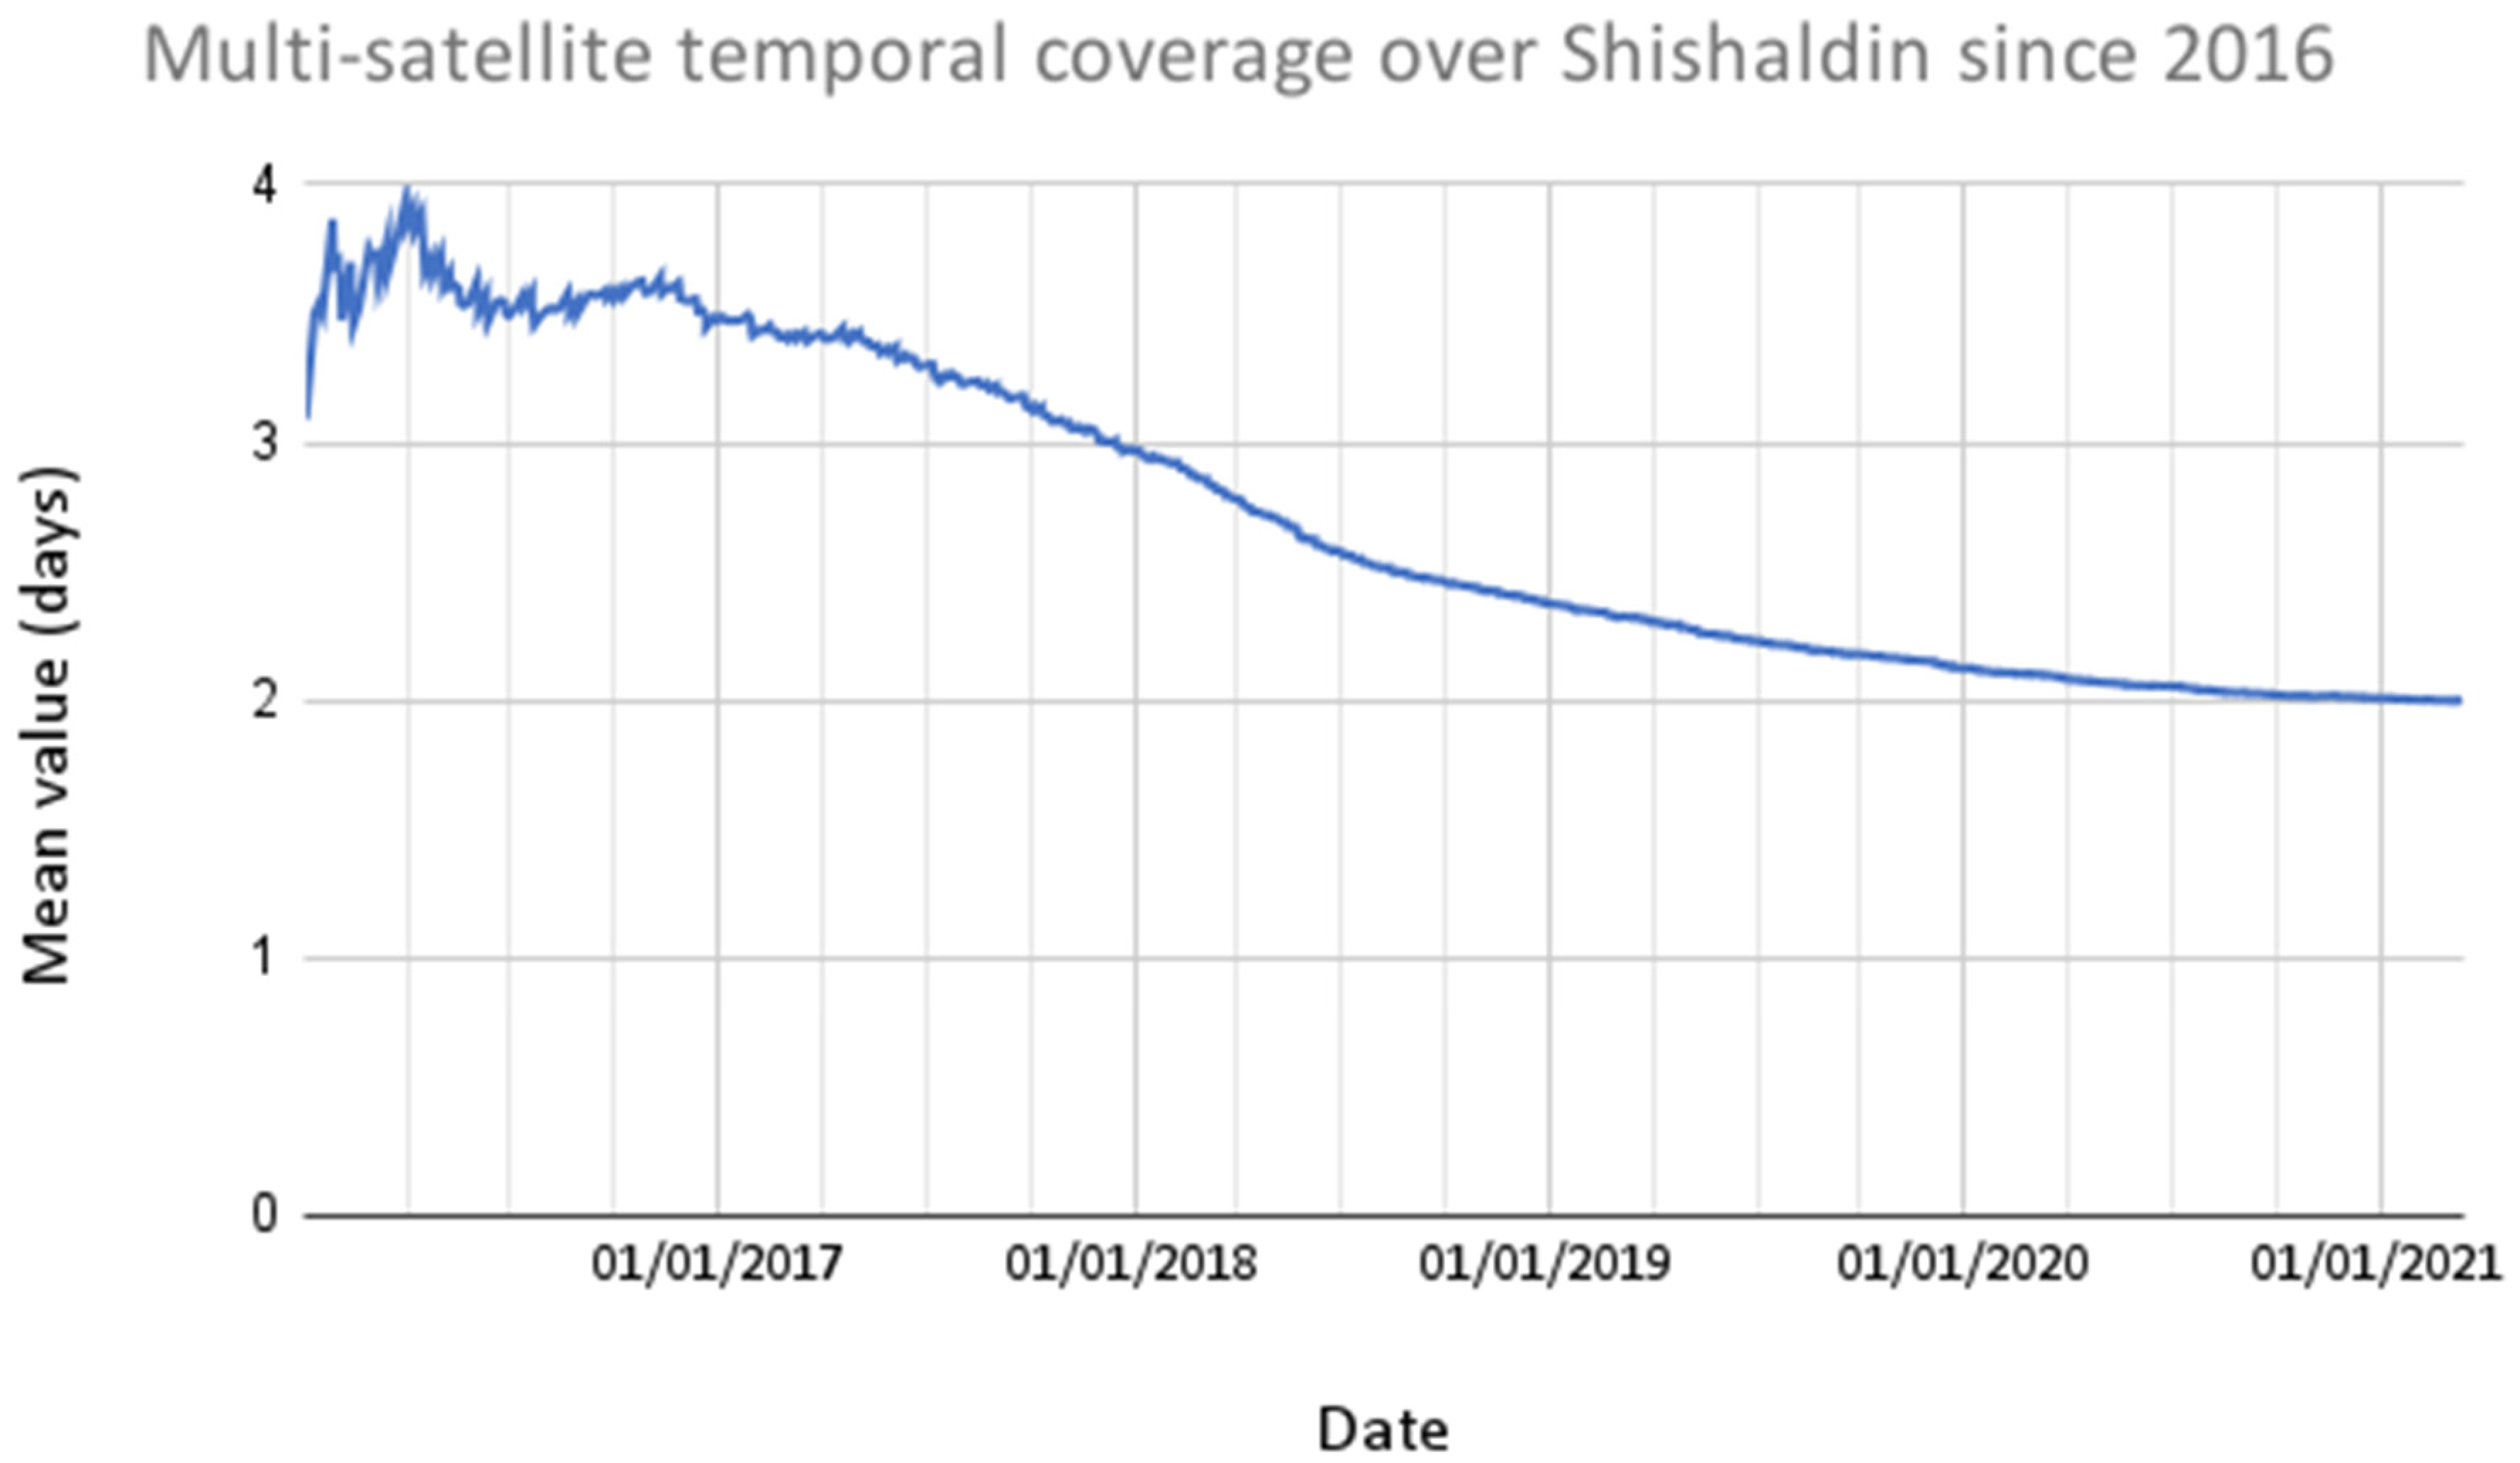
The possible complementarity between RASTer and NHI systems is further enhanced in the temporal domain, as shown in Figure 11 in reference to the Mt. Etna Strombolian activity of 14–17 January 2021 where the integration of ASTER and Sentinel-2 observations allowed for a more continuous monitoring of thermal volcanic activity. This integration can also be usefully extended to other sensors (e.g., NHI runs on Landsat-8/OLI data [20,21]), further increasing the temporal continuity of active volcanoes monitoring that, for the high-latitude regions, can today reach a mean temporal coverage up to 2 days (Figure 12).
In addition, RASTer could be profitably used to assess information from systems monitoring volcanoes in near real time (using satellite data at lower spatial resolution), apart from areas (e.g., equatorial zones) where the scarcity and the bad quality of ASTER images do not enable the full RASTer implementation. Among those systems, the ones sharing the same RST-based approach, applied to data from polar (e.g., [2,14,30]) and geostationary (e.g., [53]) meteorological satellite sensors, will benefit from a RASTer-based validation and training. The RASTer contribution to detect and map lava flows and other thermal features related to volcanic activity is particularly relevant, considering that AVA products are no longer available (since 2017), the NHI usage on ASTER data is limited to 2000-2008 [54] and that other recent systems such as the ASTER Volcanic Thermal Output Database (AVTOD; [55]) operate over specific regions of interest and not globally. Indeed, ASTER also continues to play an important role in supporting volcanic activity monitoring from space at the time of writing. This is demonstrated by Figure 13, where lava flow (moving in E and SE direction toward Valle del Bove), associated with the powerful Mt. Etna paroxysm of 16 February 2021 and the thermal activity at summit craters were correctly identified and mapped by RASTer.

5. Conclusions

In this work, we presented and tested an RST-based algorithm to identify and map volcanic thermal features through ASTER TIR data, processed under the GEE platform. By analyzing results retrieved in three active volcanic areas (i.e., Etna, Shishadin and Shinmodake), through comparison with the AVA database, we found that RASTer was capable of successfully identifying thermal anomalies (as indicated by the relevant number of unique detections), also providing accurate information about these features in terms of shape and spatial extent. These outcomes demonstrate that RASTer may support the monitoring of thermal volcanic activity from space, despite some limitations. Main factors that could affect the RASTer detections are in fact bush fires, when occurring along the volcano flanks, and clouds that may obscure the underlying thermal anomalies. The computation of the normalized index defined in Equation (3) according to the general RST detection scheme, along with the implementation of an iterative procedure devoted to filter out signal outliers under the GEE environment, should further increase the RASTer performance and will be the aim of future investigations.
This study also encourages the RST implementation on data from previous Landsat missions and relative TIR sensors (Thematic Mapper and Enhanced Thematic Mapper plus). Those data should favor the investigation of thermal volcanic activities occurring in the past. Finally, this work opens new scenarios regarding the possible RST implementation on Landsat-8/TIRS (Thermal Infrared Sensor) data at 100 m spatial resolution, especially in view of the launch of the next Landsat-9 satellite, which will improve the temporal resolution of Landsat observations from 16 to 8 days.

Author Contributions

Conceptualization, N.G. and F.M.; software, N.G.; methodology, V.T., N.P. and N.G., validation and formal analysis, N.G., F.M. and M.N.; writing—original draft preparation, N.G. and F.M.; writing—review and editing, N.P., M.N. and V.T. All authors have read and agreed to the published version of the manuscript.

Funding

This research received no external funding.

Institutional Review Board Statement

Not applicable.

Informed Consent Statement

Not applicable.

Data Availability Statement

The data presented in this study are available under the Google Earth Engine platform.

Conflicts of Interest

The authors declare no conflict of interest.

References

  1. Dehn, J.; Dean, K.; Engle, K. Thermal monitoring of North Pacific volcanoes from space. Geology 2000, 28, 755–758. [Google Scholar] [CrossRef]
  2. Pergola, N.; Marchese, F.; Tramutoli, V. Automated detection of thermal features of active volcanoes by means of infrared AVHRR records. Remote Sens. Environ. 2004, 93, 311–327. [Google Scholar] [CrossRef]
  3. Coppola, D.; Laiolo, M.; Cigolini, C. Fifteen years of thermal activity at Vanuatu’s volcanoes (2000–2015) revealed by MIROVA. J. Volcanol. Geotherm. Res. 2016, 322, 6–19. [Google Scholar] [CrossRef]
  4. Marchese, F.; Neri, M.; Falconieri, A.; Lacava, T.; Mazzeo, G.; Pergola, N.; Tramutoli, V. The Contribution of Multi-Sensor Infrared Satellite Observations to Monitor Mt. Etna (Italy) Activity during May to August 2016. Remote Sens. 2018, 10, 1948. [Google Scholar] [CrossRef] [Green Version]
  5. Wright, R.; Pilger, E. Radiant flux from Earth’s subaerially erupting volcanoes. Int. J. Remote Sens. 2008, 29, 6443–6466. [Google Scholar] [CrossRef]
  6. Mastin, L.G. Testing the accuracy of a 1-D volcanic plume model in estimating mass eruption rate. J. Geophys. Res. Atmos. 2014, 119, 2474–2495. [Google Scholar] [CrossRef]
  7. Connor, C.B.; Clement, B.M.; Song, X.; Lane, S.B.; West-Thomas, J. Continuous monitoring of high-temperature fumaroles on an active lava dome, Volcán Colima, Mexico: Evidence of mass flow variation in response to atmospheric forcing. J. Geophys. Res. Space Phys. 1993, 98, 19713–19722. [Google Scholar] [CrossRef] [Green Version]
  8. Wright, R.; Flynn, L.; Garbeil, H.; Harris, A.; Pilger, E. Automated volcanic eruption detection using MODIS. Remote Sens. Environ. 2002, 82, 135–155. [Google Scholar] [CrossRef] [Green Version]
  9. Wright, R.; Flynn, L.P.; Garbeil, H.; Harris, A.J.; Pilger, E. MODVOLC: Near-real-time thermal monitoring of global volcanism. J. Volcanol. Geotherm. Res. 2004, 135, 29–49. [Google Scholar] [CrossRef]
  10. Coppola, D.; Laiolo, M.; Cigolini, C.; Massimetti, F.; Donne, D.D.; Ripepe, M.; Arias, H.; Barsotti, S.; Parra, C.B.; Centeno, R.G.; et al. Thermal Remote Sensing for Global Volcano Monitoring: Experiences from the MIROVA System. Front. Earth Sci. 2020, 7. [Google Scholar] [CrossRef] [Green Version]
  11. Kervyn, M.; Ernst, G.G.J.; Harris, A.J.L.; Belton, F.; Mbede, E.; Jacobs, P. Thermal remote sensing of the low-intensity carbonatite volcanism of Oldoinyo Lengai, Tanzania. Int. J. Remot. Sens. 2008, 29, 6467–6499. [Google Scholar] [CrossRef]
  12. Marchese, F.; Filizzola, C.; Genzano, N.; Mazzeo, G.; Pergola, N.; Tramutoli, V. Assessment and improvement of a robust satellite technique (RST) for thermal monitoring of volcanoes. Remote Sens. Environ. 2011, 115, 1556–1563. [Google Scholar] [CrossRef]
  13. Lacava, T.; Marchese, F.; Pergola, N.; Tramutoli, V.; Coviello, I.; Faruolo, M.; Paciello, R.; Mazzeo, G. RSTVOLC implementa-tion on MODIS data for monitoring of thermal volcanic activity. Ann. Geophys. 2011, 54, 536–542. [Google Scholar] [CrossRef]
  14. Pergola, N.; Coviello, I.; Filizzola, C.; Lacava, T.; Marchese, F.; Paciello, R.; Tramutoli, V. A review of RSTVOLC, an original algorithm for automatic detection and near-real-time monitoring of volcanic hotspots from space. Geol. Soc. Lond. Spec. Publ. 2015, 426, 55–72. [Google Scholar] [CrossRef]
  15. Plank, S.; Marchese, F.; Filizzola, C.; Pergola, N.; Neri, M.; Nolde, M.; Martinis, S. The July/August 2019 Lava Flows at the Sciara del Fuoco, Stromboli–Analysis from Multi-Sensor Infrared Satellite Imagery. Remote Sens. 2019, 11, 2879. [Google Scholar] [CrossRef] [Green Version]
  16. Marchese, F.; Lacava, T.; Pergola, N.; Hattori, K.; Miraglia, E.; Tramutoli, V. Inferring phases of thermal unrest at Mt. Asama (Japan) from infrared satellite observations. J. Volcanol. Geotherm. Res. 2012, 237–238, 10–18. [Google Scholar] [CrossRef]
  17. Ramsey, M.S. Synergistic use of satellite thermal detection and science: A decadal perspective using ASTER. Geol. Soc. Lond. Spec. Publ. 2015, 426, 115–136. [Google Scholar] [CrossRef] [Green Version]
  18. Ramsey, M.; Flynn, I. The Spatial and Spectral Resolution of ASTER Infrared Image Data: A Paradigm Shift in Volcanological Remote Sensing. Remote Sens. 2020, 12, 738. [Google Scholar] [CrossRef] [Green Version]
  19. Gorelick, N.; Hancher, M.; Dixon, M.; Ilyushchenko, S.; Thau, D.; Moore, R. Google Earth Engine: Planetary-scale geospatial analysis for everyone. Remote Sens. Environ. 2017, 202, 18–27. [Google Scholar] [CrossRef]
  20. Marchese, F.; Genzano, N.; Neri, M.; Falconieri, A.; Mazzeo, G.; Pergola, N. A Multi-Channel Algorithm for Mapping Volcanic Thermal Anomalies by Means of Sentinel-2 MSI and Landsat-8 OLI Data. Remote Sens. 2019, 11, 2876. [Google Scholar] [CrossRef] [Green Version]
  21. Genzano, N.; Pergola, N.; Marchese, F. A Google Earth Engine Tool to Investigate, Map and Monitor Volcanic Thermal Anomalies at Global Scale by Means of Mid-High Spatial Resolution Satellite Data. Remote Sens. 2020, 12, 3232. [Google Scholar] [CrossRef]
  22. Abrams, M.; Tsu, H.; Hulley, G.; Iwao, K.; Pieri, D.; Cudahy, T.; Kargel, J. The Advanced Spaceborne Thermal Emission and Reflection Radiometer (ASTER) after fifteen years: Review of global products. Int. J. Appl. Earth Obs. Geoinf. 2015, 38, 292–301. [Google Scholar] [CrossRef]
  23. LP DAAC Team. Advanced Spaceborne Thermal Emission and Reflection Radiometer (ASTER) Level 1 Precision Terrain Corrected Registered At-Sensor Radiance Product (AST_L1T). Available online: https://lpdaac.usgs.gov/documents/300/ASTER_L1T_Product_Specification.pdf (accessed on 2 April 2021).
  24. Tramutoli, V. Robust Satellite Techniques (RST) for Natural and Environmental Hazards Monitoring and Mitigation: Theory and Applications. In Proceedings of the IEEE Fourth International Workshop on the Analysis of Multitemporal Remote Sensing Images, Leuven, Belgium, 18–20 July 2007; pp. 1–6. [Google Scholar] [CrossRef]
  25. Tramutoli, V. Robust AVHRR Techniques (RAT) for Environmental Monitoring: Theory and applications. In Earth Surface Remote Sensing II; Cecchi, G., Zilioli, E., Eds.; SPIE: Barcelona, Spain, 1998; Volume 349, pp. 101–113. [Google Scholar] [CrossRef]
  26. Filizzola, C.; Corrado, R.; Marchese, F.; Mazzeo, G.; Paciello, R.; Pergola, N.; Tramutoli, V. RST-FIRES, an exportable algorithm for early-fire detection and monitoring: Description, implementation, and field validation in the case of the MSG-SEVIRI sensor. Remote Sens. Environ. 2017, 192, e2–e25. [Google Scholar] [CrossRef]
  27. Faruolo, M.; Lacava, T.; Pergola, N.; Tramutoli, V. On the Potential of the RST-FLARE Algorithm for Gas Flaring Characterization from Space. Sensors 2018, 18, 2466. [Google Scholar] [CrossRef] [Green Version]
  28. Filizzola, C.; Cerra, D.; Corrado, R.; De La Cruz, A.; Pergola, N.; Tramutoli, V. Robust Satellite Techniques (RST) for Pipeline Network Monitoring. In Proceedings of the IEEE Fourth International Workshop on the Analysis of Multitemporal Remote Sensing Images, Leuven, Belgium, 18–20 July 2007; pp. 1–5. [Google Scholar] [CrossRef]
  29. Pieri, D.; Abrams, M. ASTER watches the world’s volcanoes: A new paradigm for volcanological observations from orbit. J. Volcanol. Geotherm. Res. 2004, 135, 13–28. [Google Scholar] [CrossRef]
  30. Lacava, T.; Kervyn, M.; Liuzzi, M.; Marchese, F.; Pergola, N.; Tramutoli, V. Assessing performance of the RSTVOLC multi-temporal algorithm in detecting subtle hot spots at Oldoinyo Lengai (Tanzania, Africa) for comparison with MODLEN. Remote Sens. 2018, 10, 1177. [Google Scholar] [CrossRef] [Green Version]
  31. Branca, S.; Del Carlo, P. Types of eruptions of Etna volcano AD 1670–2003: Implications for short-term eruptive behaviour. Bull. Volcanol. 2005, 67, 732–742. [Google Scholar] [CrossRef]
  32. Behncke, B.; Neri, M. Cycles and trends in the recent eruptive behaviour of Mount Etna (Italy). Can. J. Earth Sci. 2003, 40, 1405–1411. [Google Scholar] [CrossRef]
  33. Acocella, V.; Neri, M.; Behncke, B.; Bonforte, A.; Del Negro, C.; Ganci, G. Why Does a Mature Volcano Need New Vents? The Case of the New Southeast Crater at Etna. Front. Earth Sci. 2016, 4, 67. [Google Scholar] [CrossRef] [Green Version]
  34. Behncke, B.; Branca, S.; Corsaro, R.A.; De Beni, E.; Miraglia, L.; Proietti, C. The 2011–2012 summit activity of Mount Etna: Birth, growth and products of the new SE crater. J. Volcanol. Geotherm. Res. 2014, 270, 10–21. [Google Scholar] [CrossRef]
  35. De Beni, E.; Behncke, B.; Branca, S.; Nicolosi, I.; Carluccio, R.; Caracciolo, F.D.; Chiappini, M. The continuing story of Etna’s New Southeast Crater (2012–2014): Evolution and volume calculations based on field surveys and aerophotogrammetry. J. Volcanol. Geotherm. Res. 2015, 303, 175–186. [Google Scholar] [CrossRef]
  36. Ganci, G.; Cappello, A.; Bilotta, G.; Hérault, A.; Zago, V.; Del Negro, C. Mapping Volcanic Deposits of the 2011–2015 Etna Eruptive Events Using Satellite Remote Sensing. Front. Earth Sci. 2018, 6. [Google Scholar] [CrossRef]
  37. Zuccarello, F.; Schiavi, F.; Viccaro, M. Magma dehydration controls the energy of recent eruptions at Mt. Etna volcano. Terra Nova 2021. [Google Scholar] [CrossRef]
  38. Neri, M.; Casu, F.; Acocella, V.; Solaro, G.; Pepe, S.; Berardino, P.; Sansosti, E.; Caltabiano, T.; Lundgren, P.; Lanari, R. Deformation and eruptions at Mt. Etna (Italy): A lesson from 15 years of observations. Geophys. Res. Lett. 2009, 36. [Google Scholar] [CrossRef]
  39. Neri, M.; Acocella, V.; Behncke, B.; Giammanco, S.; Mazzarini, F.; Rust, D. Structural analysis of the eruptive fissures at Mount Etna (Italy). Ann. Geophys. 2011, 54, 464–479. [Google Scholar] [CrossRef]
  40. Nye, C.; Keith, T.; Eichelberger, J.; Miller, T.; McNutt, S.; Moran, S.; Schneider, D.J.; Dehn, J.; Schaefer, J.R. The 1999 eruption of Shishaldin Volcano, Alaska: Monitoring a distant eruption. Bull. Volcanol. 2002, 64, 507–519. [Google Scholar] [CrossRef]
  41. Cameron, C.E.; Dixon, J.P.; Neal, C.A.; Waythomas, C.F.; Schaefer, J.R.; McGimsey, R.G. 2014 Volcanic Activity in Alaska—Summary of Events and Response of the Alaska Volcano Observatory; U.S. Geological Survey Scientific Investigations Report 2017–5077; U.S. Geological Survey: Anchorage, AK, USA, 2017; 81p. [CrossRef] [Green Version]
  42. Alaska Volcano Observatory. Shishaldin Reported Activity, Event Name: Shishaldin 2014/1. Available online: https://avo.alaska.edu/volcanoes/activity.php?volcname=Shishaldin&page=basic&eruptionid=771 (accessed on 2 April 2021).
  43. Global Volcanism Program. Bulletin of the Global Volcanism Network 45:2; Report on Shishaldin (United, States); Krippner, J.B., Venzke, E., Eds.; Smithsonian Institution: Washington, DC, USA, 2020. [Google Scholar]
  44. Lacava, T.; Marchese, F.; Arcomano, G.; Coviello, I.; Falconieri, A.; Faruolo, M.; Pergola, N.; Tramutoli, V. Thermal Monitoring of Eyjafjöll Volcano Eruptions by Means of Infrared MODIS Data. IEEE J. Sel. Top. Appl. Earth Obs. Remote Sens. 2014, 7, 3393–3401. [Google Scholar] [CrossRef]
  45. Kato, K.; Yamasato, H. The 2011 eruptive activity of Shinmoedake volcano, Kirishimayama, Kyushu, Japan—Overview of activity and Volcanic Alert Level of the Japan Meteorological Agency. Earth Planets Space 2013, 65, 489–504. [Google Scholar] [CrossRef] [Green Version]
  46. Global Volcanism Program. Bulletin of the Global Volcanism Network 35:12; Report on Kirishimayama (Japan); Wunderman, R., Ed.; Smithsonian Institution: Washington, DC, USA, 2010. [Google Scholar]
  47. Ozawa, T.; Kozono, T. Temporal variation of the Shinmoe-dake crater in the 2011 eruption revealed by spaceborne SAR ob-servations. Earth Planets Space 2013, 65, 527–537. [Google Scholar] [CrossRef] [Green Version]
  48. Global Volcanism Program. Bulletin of the Global Volcanism Network 43:6; Report on Kirishimayama, (Japan); Crafford, A.E., Venzke, E., Eds.; Smithsonian Institution: Washington, DC, USA, 2018. [Google Scholar] [CrossRef]
  49. Neri, M.; De Maio, M.; Crepaldi, S.; Suozzi, E.; Lavy, M.; Marchionatti, F.; Calvari, S.; Buongiorno, M.F. Topographic Maps of Mount Etna’s Summit Craters, updated to December 2015. J. Maps 2017, 13, 674–683. [Google Scholar] [CrossRef] [Green Version]
  50. De Beni, E.; Cantarero, M.; Neri, M.; Messina, A. Lava flows of Mt Etna, Italy: The 2019 eruption within the context of the last two decades (1999–2019). J. Maps 2020, 1–12. [Google Scholar] [CrossRef]
  51. Global Volcanism Program. Bulletin of the Global Volcanism Network 40:1; Report on Shishaldin (United States); Wunderman, R., Ed.; Smithsonian Institution: Washington, DC, USA, 2015. [Google Scholar] [CrossRef]
  52. Global Volcanism Program. Bulletin of the Global Volcanism Network 42:9; Report on Etna, (Italy); Crafford, A.E., Venzke, E., Eds.; Smithsonian Institution: Washington, DC, USA, 2017. [Google Scholar] [CrossRef]
  53. Marchese, F.; Falconieri, A.; Pergola, N.; Tramutoli, V. A retrospective analysis of the Shinmoedake (Japan) eruption of 26–27 January 2011 by means of Japanese geostationary satellite data. J. Volcanol. Geotherm. Res. 2014, 269, 1–13. [Google Scholar] [CrossRef]
  54. Mazzeo, G.; Ramsey, M.S.; Marchese, F.; Genzano, N.; Pergola, N. Implementation of the NHI (Normalized Hot Spot Indices). Algorithm on Infrared ASTER Data: Results and Future Perspectives. Sensors 2021, 21, 1538. [Google Scholar] [CrossRef] [PubMed]
  55. Reath, K.; Pritchard, M.E.; Moruzzi, S.; Alcott, A.; Coppola, D.; Pieri, D. The AVTOD (ASTER Volcanic Thermal Output Da-tabase) Latin America archive. J. Volcanol. Geotherm. Res. 2019, 376, 62–74. [Google Scholar] [CrossRef] [Green Version]
Figure 1. Time series (2000–2017) of the daily number of hot pixels flagged by RASTer and AVA at Mt. Etna. Dotted black rectangles indicate the periods of Mt. Etna flank eruptions; these eruptive events show the highest daily number of hotspots. The intense explosive and effusive activity at the Southeast Crater is also highlighted in the period September–December 2006. Similarly, the birth and growth of the New Southeast Crater in 2011–2015 is shown on the right side of the diagram. Finally, a significant number of hotspots characterized Strombolian activity in 2017, mainly at the Voragine (VOR) and Bocca Nuova (BN) craters.
Applsci 11 04201 g001
Figure 2. Thermal anomalies detected by RASTer on ASTER scenes during the Mt. Etna flank eruptions of (a) 29 July 2001; (b) 18 March 2014. More intense TIR anomalies referring to pixels with T I R ( x , y , t ) 4 are reported in red. The less intense ones, with T I R ( x , y , t ) 3   A N D   N D B 12 B 13 ( x , y , t ) > 0 (see text) are yellow colored. In the background, the ASTER band 3 TIR image.
Applsci 11 04201 g002
Figure 3. Thermal anomalies detected on ASTER scenes during the Mt. Etna flank eruptions of (a) 21 June 2008 and (b) 27 October 2002 by RASTer (left side) and AVA (right side). Hotspots detected by RASTer are depicted as in Figure 2. The hotspots detected by AVA are depicted in red.
Applsci 11 04201 g003
Figure 4. Thermal anomalies detected by RASTer at Mt. Etna during the period January–May 2020, associated with the Strombolian activity recorded at the Voragine-Bocca Nuova complex.
Applsci 11 04201 g004
Figure 5. Time series of daily number of hotspots flagged by RASTer and AVA (January 2014–2016) at Shishaldin volcano.
Applsci 11 04201 g005
Figure 6. Thermal anomalies detected by RASTer at Shishaldin volcano on ASTER scenes of 20 October 2019 (a) and 8 January 2020 (b).
Applsci 11 04201 g006
Figure 7. Thermal anomalies (red pixels) detected at Shinmoedake volcano on January–February 2011 (a) from RASTer; (b) from AVA.
Applsci 11 04201 g007
Figure 8. Thermal anomalies detected by RASTer at Shinmoedake volcano on 25 March 2018.
Applsci 11 04201 g008
Figure 9. Time series of hot pixels flagged by RASTer at Mt. Etna in the period May 2000–2020 and different intensity levels of Mt. Etna thermal activity (colors from yellow to red).
Applsci 11 04201 g009
Figure 10. (a) ASTER TIR image 17 October 2016 at 09:54 UTC covering Mt. Etna area; (b) thermal anomalies detected by RASTer (red pixels) and NHISWIR ([20]) on Sentinel-2/MSI data of 09:40 UTC (blue pixels) overlapped to the topographic map of Mt. Etna.
Applsci 11 04201 g010
Figure 11. Mt. Etna activity detected by NHI through the indices NHISWNIR and NHISWIR (the latter is used to detect mid-low intensity hotspots [20]) on Sentinel-2/MSI data of 14 and 17 January 2021 (left and right panels) and by RASTer on ASTER scene of 16 January 2021 (middle panel).
Applsci 11 04201 g011
Figure 12. Evolution (2016–2021) of the temporal coverage achievable using a multi-satellite monitoring system integrating L8-OLI, S2-MSI and Terra-ASTER observations. The plot shows for the Shishaldin volcano location the average temporal gap among observations. Note as the launch of Sentinel-2B at the end of 2017 dramatically reduced the temporal gap from 4 on average (maximum 9) to 2 (maximum 3) days.
Applsci 11 04201 g012
Figure 13. Thermal anomaly (red/yellow pixels) over Mt. Etna area detected by RASTer on 17 February 2021.
Applsci 11 04201 g013
Table 1. Spatial and spectral resolutions of the ASTER bands.
NameResolutionWavelength
B0115 m0.520–0.600 µm
B0215 m0.630–0.690 µm
B3N15 m0.780–0.860 µm
B04 *30 m1.600–1.700 µm
B05 *30 m2.145–2.185 µm
B06 *30 m2.185–2.225 µm
B07 *30 m2.235–2.285 µm
B08 *30 m2.295–2.365 µm
B09 *30 m2.360–2.430 µm
B1090 m8.125–8.475 µm
B1190 m8.475–8.825 µm
B1290 m8.925–9.275 µm
B1390 m10.250–10.950 µm
B1490 m10.950–11.650 µm
* Operational until April 2008.
Table 2. Summary of RASTer and AVA comparison performed by analyzing ASTER TIR data of 2000–2017 over Etna (Italy), Shinmoedake (Japan) and Shishaldin (AK, USA).
VolcanoNumber of ASTER Images with Detected Thermal Anomalies (Until August 2017) Number of Pixels Flagged as Thermal AnomaliesCommon DetectionsUnique Detections
Number of ScenesNumber of Hot Pixels Number of Scenes
RASTer (R)AVA (A)RA RARA
Etna1001004070303686394730171414
Shinmoedake2260192601900
Shishaldin9226228270
Publisher’s Note: MDPI stays neutral with regard to jurisdictional claims in published maps and institutional affiliations.