Article

Evaluation of Design Provisions for Horizontal Shear Strength in Composite Precast Concrete Beams with Different Interface Conditions

1
Department of Medical Space Design & Management, Konyang University, Daejeon 35365, Korea
2
Department of Architectural Engineering, Hannam University, Daejeon 34430, Korea
*
Author to whom correspondence should be addressed.
Appl. Sci. 2021, 11(9), 4246; https://doi.org/10.3390/app11094246
Submission received: 31 March 2021 / Revised: 28 April 2021 / Accepted: 6 May 2021 / Published: 7 May 2021

Abstract

:
In a precast concrete (PC) composite beam, the horizontal interface between the PC beam and the cast-in-place (CIP) slab is located either on the compression side or on the tensile side of the cross-section. If the CIP slab is on the compression side, it becomes C-type interface, and if it is on the tensile side, it becomes T-type interface. Tensile cracks in the CIP slab may cause the horizontal shear strength of composite beams to decrease because of the reduced anchorage performance of shear reinforcements as well as the sliding on the interface. Such a tendency can be found from previous test results of specimens having T-type interface. In this study, the results of the push-off test and the beam flexure test were collected and analyzed to evaluate effects on the horizontal shear strength depending on the interface conditions, such as the interface location, surface roughness, concrete compressive strength, and clamping stress by shear connectors. The horizontal shear strength equations of ACI, PCI, AASHTO LRFD, and MC 2010 were evaluated with a database composed of 84 push-off tests and 95 beam tests from previous studies. According to the evaluation, evaluation results show that the design codes predict the horizontal shear strength conservatively for conditions other than the interface location. The horizontal shear strength deviated largely depending on the interface locations. The design codes conservatively estimate the horizontal shear strength for C-type interface, but the horizontal shear strength of T-type interface is overestimated. Based on current studies, it is recommended to use a friction coefficient of 0.7 as MC 2010 when calculating the horizontal shear strength of a composite beam with roughened T-type interface.

1. Introduction

Precast concrete (PC) technology has been widely used in construction of parking lots, discount stores, logistics warehouses, etc. to achieve rapid completion [1,2,3]. In recent years, PC construction has been adopting composite PC technology to achieve a similar structural performance for connections to monolithic construction. Such composite construction can provide an economic solution by combining precast and cast-in-place (CIP) concretes with the efficiency and integrity of monolithic concrete structure. However, previous studies [4,5,6,7] have found that the interface shear transfer capacity was essential to achieve monolithic action, because horizontal shear behavior between PC beam and CIP slab can affect the development of flexural strength, diagonal shear strength, and deformation capacities for a composite beam. Therefore, composite PC beams should be designed to have a horizontal shear strength greater than the horizontal shear force that may cause interface shear failure under bending deformation. Otherwise, the composite action of beams decreases, causing a significant reduction of stiffness and flexural capacity after interface shear failure. Several factors have been found to influence the horizontal shear behavior of a composite PC beam, including the interface condition, the ratio of shear connectors across the interface, the yield strength of the shear connector, the compressive strength of the concrete, the density of the concrete, and the presence of an externally applied force.
The roughness and surface conditions of interface are closely related to the horizontal interface strength without shear connectors. Horizontal shear strength increases with surface roughness up to a 6 mm amplitude from the test results [4,8]. Furthermore, the use of shear keys extending transversely across the interface is not more effective in resisting the horizontal shear than a fully roughened surface [4]. The concrete compressive strength of the weaker between substrate and overlay restricts the horizontal shear transfer capacity of the interface. Test results revealed that an increase in weaker concrete strength improved the horizontal shear capacity [4,6,7,8]. Loov and Patnaik [5] investigated the effect of concrete strength and clamping stress based on the test results of 16 composite concrete beams with roughened surface. The clamping stress caused by the shear connector across the interface is effective after a slip of 0.5 mm. Meanwhile, horizontal shear strength has been mostly studied using push-off tests with normal-weight concrete (NWC) [9,10,11,12,13,14,15,16,17,18] and push-off tests with lightweight concrete (LWC) [19,20,21,22,23]. The difference in concrete density is clearly distinguished in the failure mode. NWC was destroyed along the surface between aggregate and binder, while LWC had a fracture surface penetrating the aggregate. Therefore, the interface surface using NWC forms a surface by protrusion of the aggregate, so it has a shear transfer mechanism by aggregate interlocking.
On the other hand, the horizontal interface between the PC beam and the CIP slab is located either on the compression side or on the tensile side of the cross-section depending on the direction of moment. In the case of positive moment, it is classified as C-type interface due to the compressive stress on the CIP slab. In the case of negative moment, it is classified as T-type interface due to the tensile stress on the CIP slab.
In previous studies [24,25,26], the horizontal shear performance of the composite beams was evaluated through three phases of studies. In the phase 1 study, three beam-column joint specimens were tested to investigate the flexural behavior of continuous PC composite beams. However, their strengths were limited by the sliding failure of interface despite the use of sufficient shear reinforcements for the composite action. In the phase 2 study, to confirm the cause of the interface slippage failure that appeared in the phase 1 study, six rectangular cross-section beam specimens with T-type interface were tested to investigate the effect of clamping stress level, interface roughness, and surface clean condition of shear connectors. In both phase studies, seven specimens failed in that sliding shear had a maximum strength lower than the nominal horizontal shear strength calculated by the shear friction design method of ACI 318 [27] and PCI [28]. Since those results were considered to be related to the location of the horizontal interfaces, the third stage of the study was planned with eight composite beam specimens having variables of the interface location and the clamping stress levels.
The experimental results showed that the interface location can be closely related the horizontal shear strength and structural performance. The results of these previous studies can provide the cause of the reduced horizontal shear performance for T-type interface. If flexural cracks occurred on T-type interface, a reduced horizontal shear performance was expected due to decreased anchorage performance and increased slip deformation on the interface.
Therefore, it was necessary to investigate clearly the effect of the interface condition on horizontal shear performance. For this purpose, a database was created comprising 84 push-off specimens and 95 beam specimens which were made of only NWC excluding LWC in previous studies [4,5,6,7,12,13,14,15,16,17,19,20,24,25,26], and the applicability of current design code was examined to qualify the effect of the interface conditions through the statistical analysis of the database.

2. Research Significance

To date, horizontal shear strength equations have been proposed based on various experimental studies, which may be classified into two groups. The first group is formed as a linear equation as proposed by Mattock [10], Kahn and Mitchell [13], ACI 318 [27], AASHTO LRFD [29], etc.; the other is indicated as a parabolic equation by Walraven et al. [30], and Loov and Patnaik [5]. Meanwhile, the interface shear design equation explicitly includes a shear transfer mechanism, such as cohesion, friction, and dowel action [31,32,33,34,35,36,37,38,39].
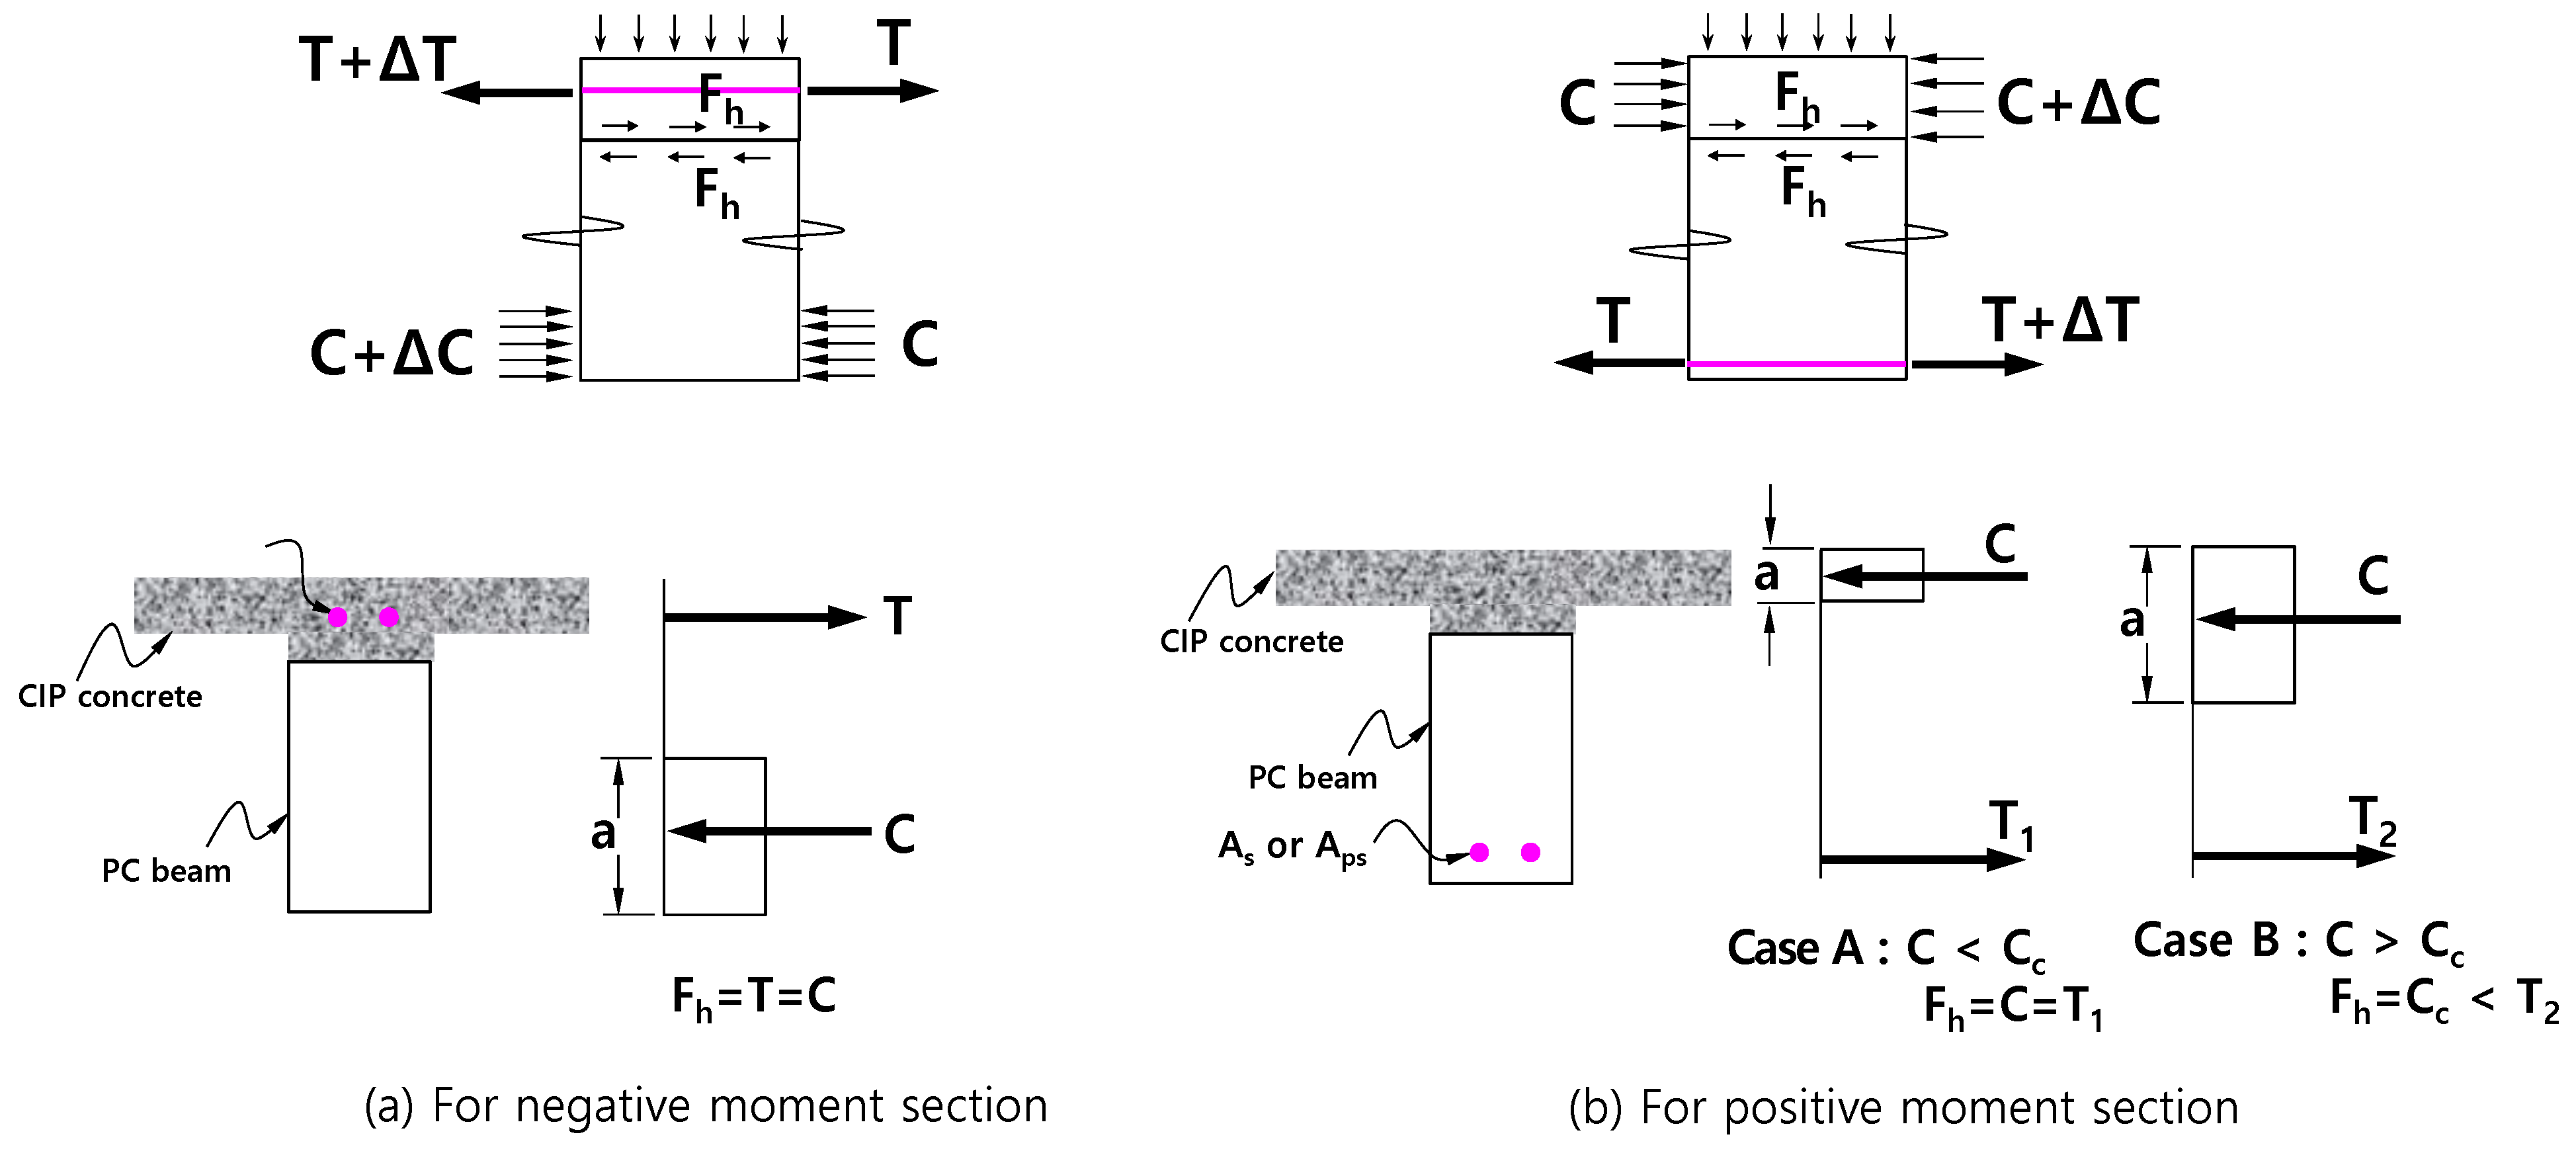
The push-off experiment has the advantage of allowing one to check the effects of various structural parameters by making a number of specimens because of the small size configuration for the direct shear test. On the other hand, little research has been conducted on the continuous composite PC beams whose interfaces are placed in the compression region or the tension region of the cross section depending on the moment direction. Although many studies have reported that the horizontal shear strength of specimens with C-type interface can have similar results to the push-off tests through beam flexural tests, research on the composite beam specimen with T-type interface is insufficient. It is expected in a composite beam with T-type interface, as shown in Figure 1, that tensile cracks in the direction perpendicular to the interface may decrease the anchorage performance of the shear connector and consequently decline the horizontal shear strength. In this study, a database was created from the experimental results tested by push-off and beam flexure; then, the effect of various interface conditions on the horizontal shear performance was evaluated.

3. Design Code Provisions and Previous Test Results

The horizontal shear stress acting on the interface may be computed as the shear flow due to the moment difference along the horizontal shear length (lvh) as defined in Figure 2. It can also be calculated as Equation (1) from the actual change in compression force or tension force as shown in Figure 3.
v u = F h A c r = F h b v l v h M m a x / ( 0.9 d ) b v l v h ,
where F h = min . { C   o r   T } , as shown in Figure 3, A c r = interface area, l v h = length between maximum moment and inflection point, and b v = interface width.
The equation for calculating the horizontal shear strength is divided into two categories, “horizontal shear transfer in composite members” (hereafter Case 1) and “shear friction” (hereafter Case 2), which is specified in ACI 318 [27] and PCI [28] provisions.
  • Case 1: horizontal shear transfer in composite members (ACI 16.4 and PCI 5.3.5)
If a minimum amount of shear reinforcement is provided and contact surfaces are intentionally roughened to a full amplitude of approximately 6 mm, the horizontal shear strength can be computed as follows:
v n = ( 1.8 + 0.6 ρ v f y ) λ   ( MPa ) ,
where ρ v is the shear reinforcement ratio ( = A v b v   s ), and λ is the factor to account the unit weight for the concrete.
  • Case 2: shear friction (ACI 22.9 and PCI 5.3.4)
ACI further states that the shear friction design can be used for horizontal shear stresses greater than 3.5 MPa.
v n = μ ρ v f y   ( MPa ) ,
where the friction factor ( μ ) is used for the shear friction design of ACI, and the effective friction factor μ e = 6.9   λ 2   μ v n = ϕ 6.9   λ 2   b v   l v h   μ F h μ e ( m a x ) is used for the shear friction design of PCI instead of the friction factor ( μ ).
In previous studies [24,25,26], tests of composite concrete beams were performed to investigate the horizontal shear performance through three phases as shown in Table 1. All specimens were designed to have a vertical shear strength greater than the flexural strength, so that the yield strength was governed by the flexural yield prior to shear failure. Therefore, when the composite PC beam reaches the flexural yielding, the tensile force caused by the tensile reinforcement acts as a horizontal shear force that induces sliding shear in the horizontal interface. Therefore, the magnitude of the horizontal shear stress on the interface is determined by the amount of change in the tensile force formed in the horizontal shear transfer length. The horizontal interface of the specimens is sprayed with a retarder at the time the surface hardening is in progress on the PC beam in which concrete is placed, and a high-pressure spray is used to remove fine aggregates and laitance from the surface for the roughened condition. Meanwhile, medium roughness of interface was achieved with a rake of approximately 4 mm amplitude.
The beam flexure tests were conducted for 17 composite beam specimens, whose variables were interface locations, surface roughness, and clamping stress levels. In the phase 1 study, three PC composite beam-column connections were tested to evaluate the shear friction strength of the interface and the flexural behavior of the composite section. In the phase 2 study, the clamping stress level, the surface roughness, and the covering of shear connector were selected as variables for six composite beam specimens with T-type interface. In the phase 3 study, the structural performance was evaluated for eight composite beam specimens with respect to the interface location of T-type or C-type, and clamping stress levels.
The cross-sectional shape of the beam comprised rectangular and T-beams, and the area of the flange was designed to be larger so that the compressive force was not smaller than the tensile force by the tensile reinforcement due to the horizontal shear force of the interface. Detailed information is available in the references [24,25,26].
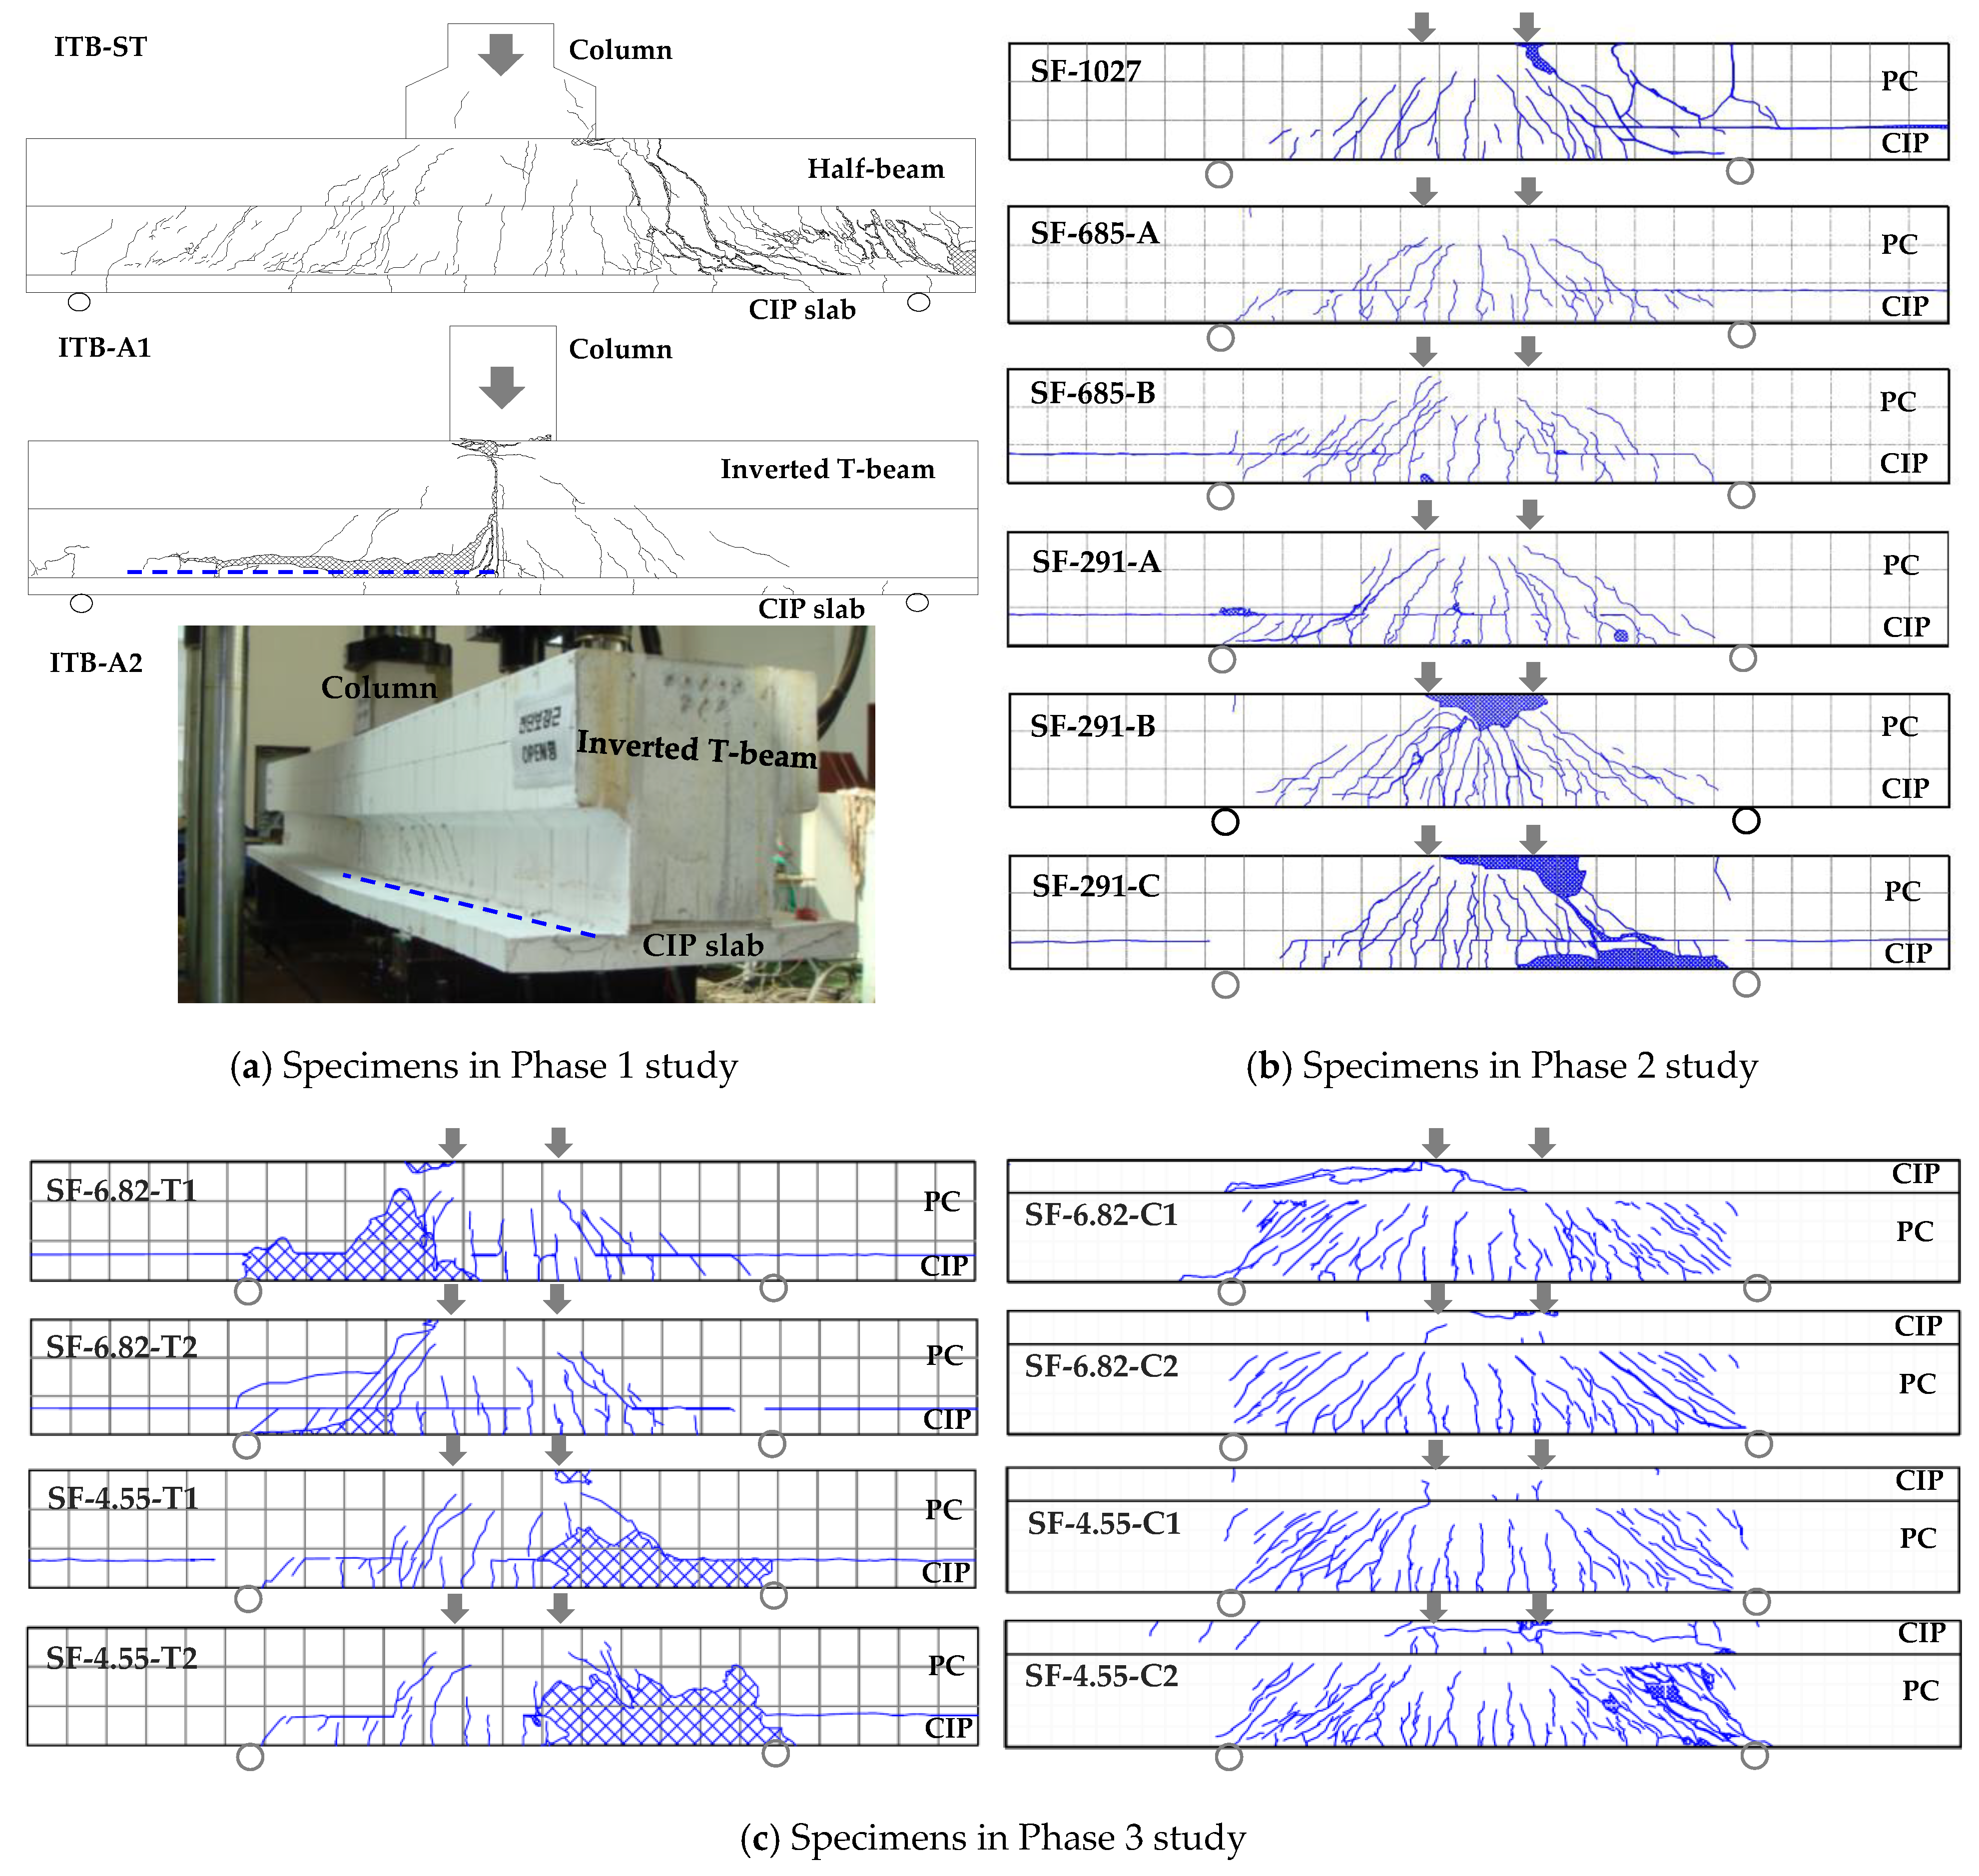
The total of 17 specimens comprised 13 specimens with T-type interface and 4 specimens with C-type interface, while 11 specimens with T-type interface showed sliding shear failure along the horizontal interface. Only six specimens (ITB-ST, SF-291-B, SF-6.82-C1, SF-6.82-C2, SF-4.55-C1, SF-4.55-C2) exhibited flexural compression failure after yielding of longitudinal reinforcements and developing the nominal flexural strength for the composite section. The crack patterns and failure modes are presented in Figure 4 which shows the sliding shear failure of the interface and flexural compression failure of the composite T-shaped beam. The flexural cracks first occurred at the bottom of the loading point for all specimens. After more flexural cracks developed, horizontal shear cracks on the interface appeared for specimens with T-type interface. Finally, web diagonal cracks were observed for all specimens both with T-type interface and with C-type interface. No horizontal crack along the interface appeared in six specimens until the flexural compression failure.
Figure 5 shows the load vesus deflection relationships for specimens in the Phase 1 to Phase 3 studies. In Figure 5, applied loads were normalized as divided by the nominal flexural strength (2Mn/a in Table 1), and the vertical displacements were also divided by the span length of each specimen due to comparison under the same conditions. Load ratios greater than 1.0 are observed in the specimens leading to flexural compression failure without horizontal shear crack along the interface. Most of the specimens with T-type interface that failed in horizontal shear of the interface showed a maximum load of 0.6 to 0.75 times the nominal flexural strength. These results indicate that the composite concrete beam with T-type interface did not show flexural behavior for the given composite section. From these results, it can be suggested that the composite beam having an T-type interface did not develop the horizontal shear strength specified by the design provisions.
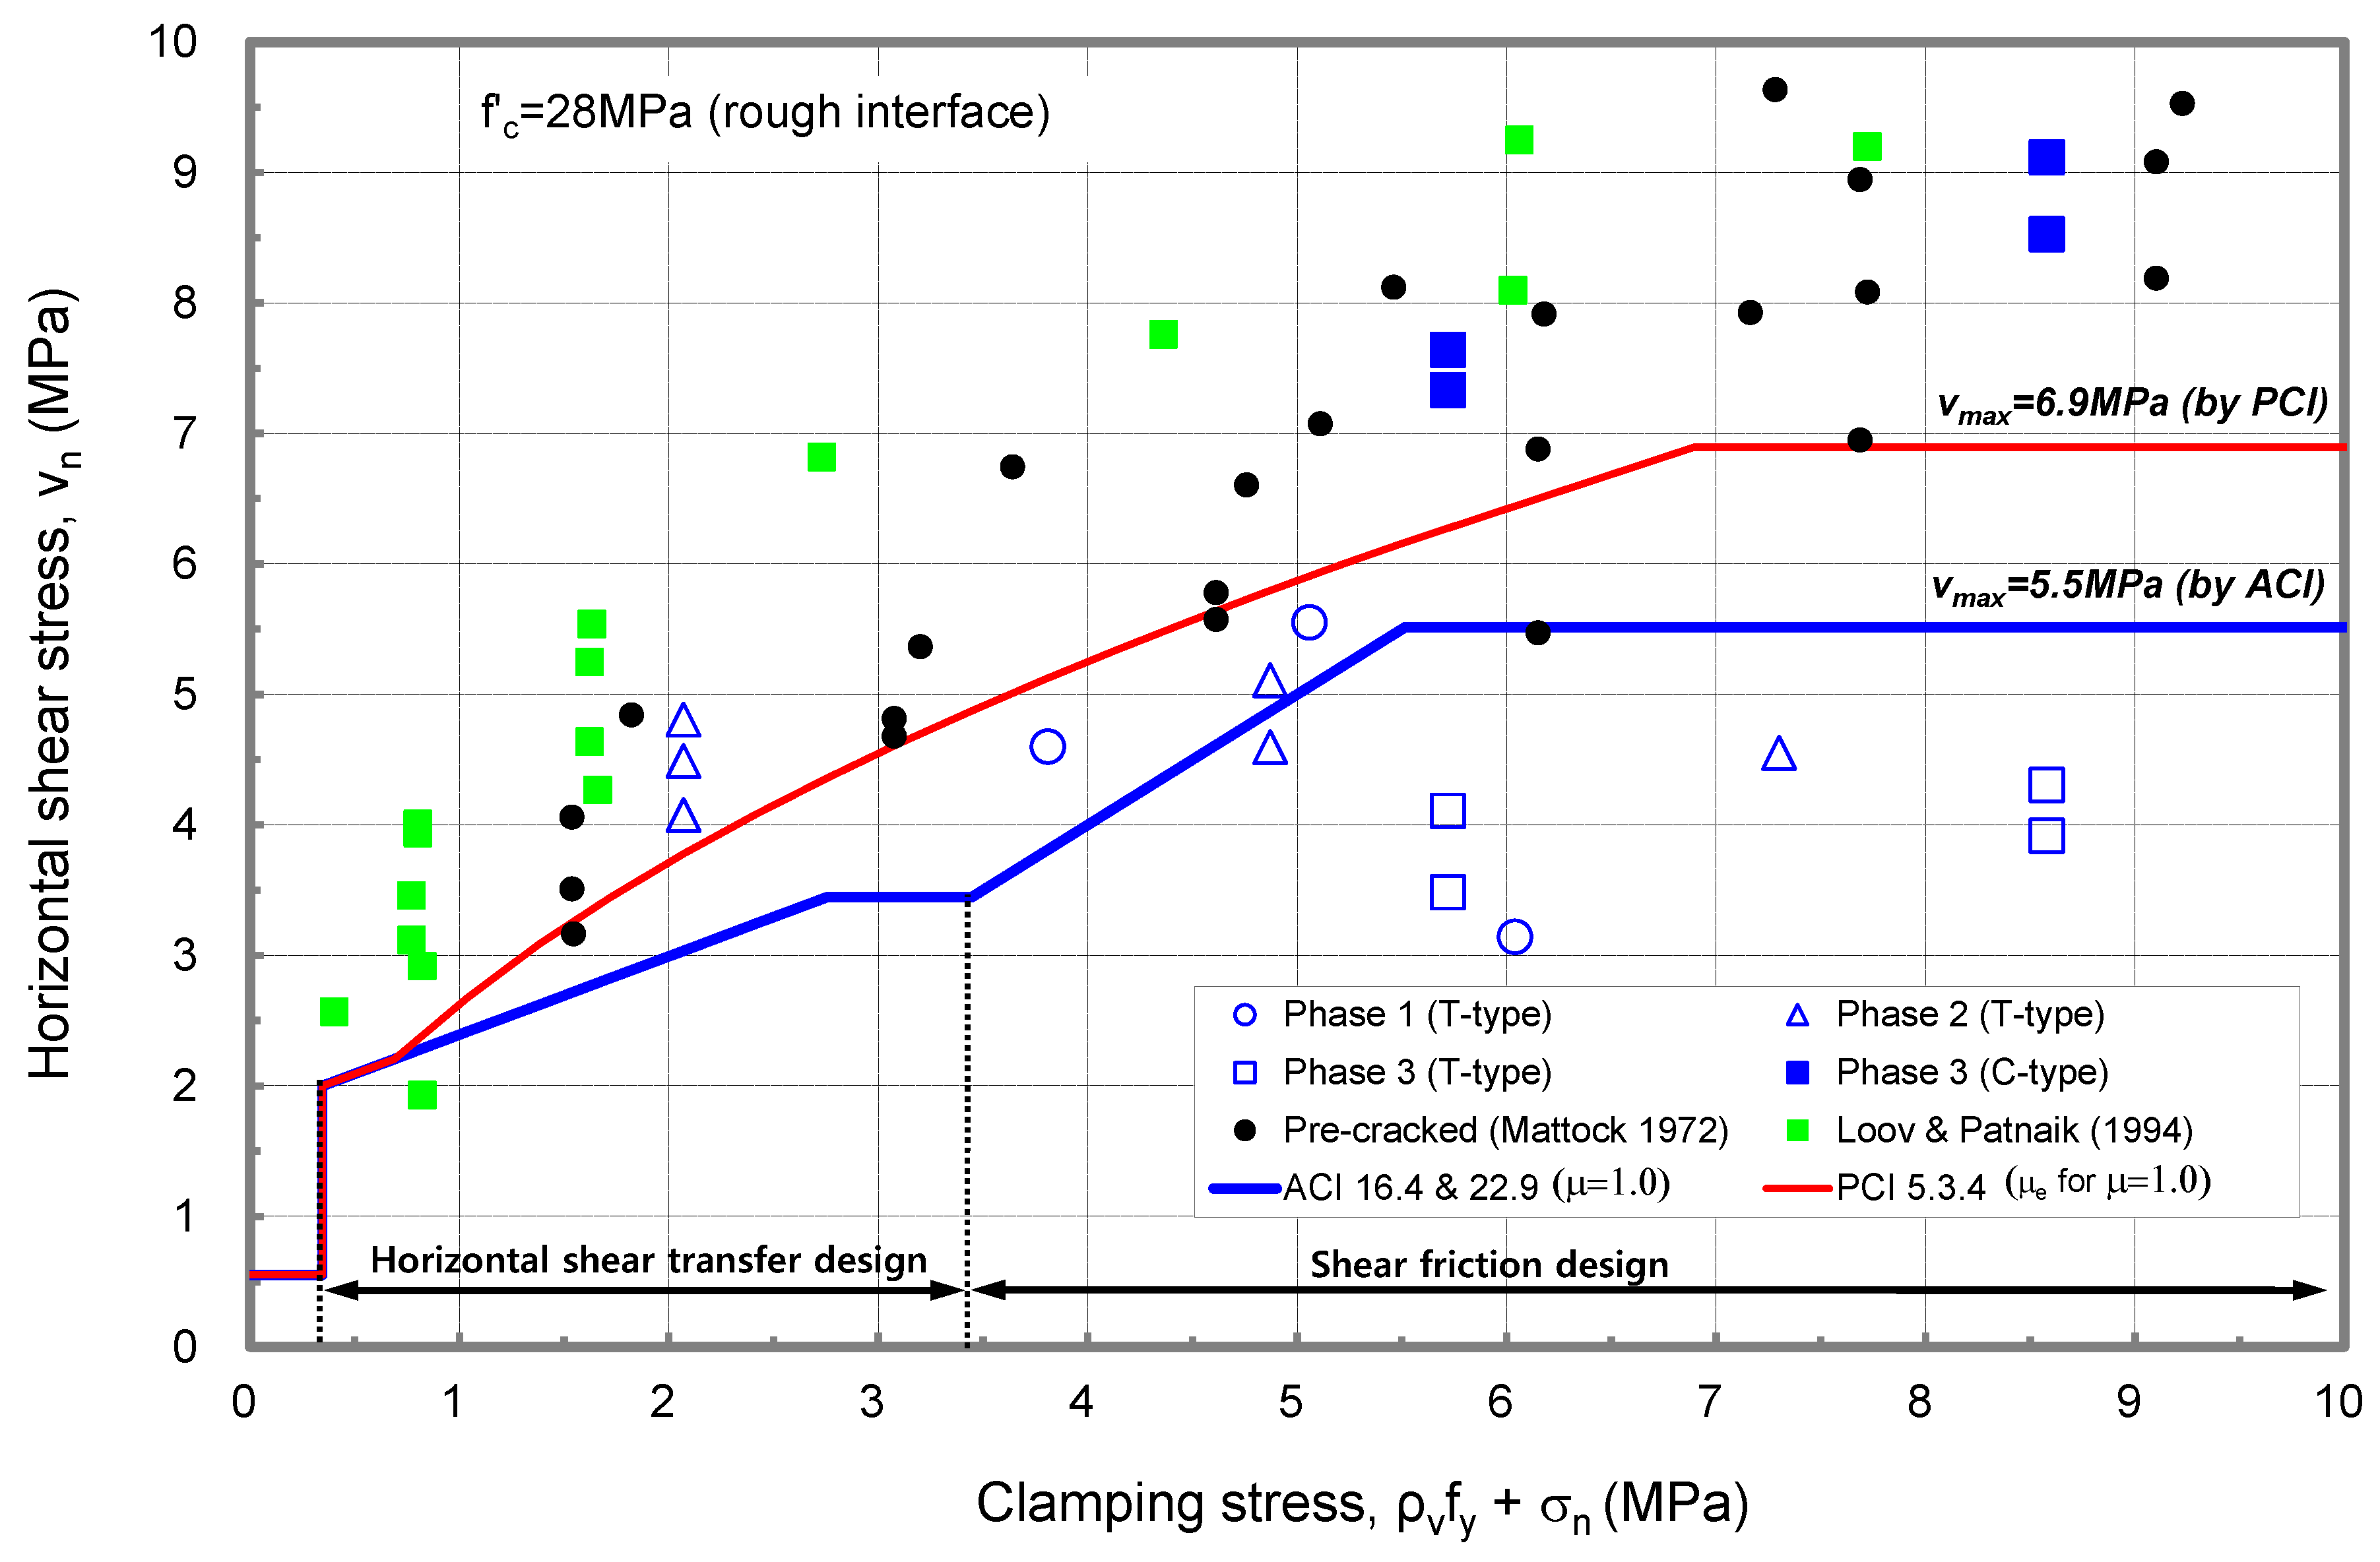
Figure 6 compares horizontal shear stresses obtained by Equation (1) for 17 specimens in the Phase 1 to 3 studies, comparing the horizontal shear stresses of push-off tests [9,10] and beam tests [5]. The 13 composite beam specimens with T-type interface showed maximum horizontal shear stress similar to or smaller than the nominal horizontal shear strength calculated by the shear friction design method of PCI or ACI. Especially, seven specimens with T-type interface showed lower horizontal shear strength than the nominal horizontal shear strength of ACI. Therefore, it is debatable whether the horizontal strength equation of the current design code can provide adequate safety. On the other hand, four specimens with C-type interface showed a higher horizontal shear strength than the nominal horizontal shear strength using the effective friction factor of PCI, and showed strength similar to the push-off test [9,10] and beam test [5] results.

4. Statistical Analysis on Database of Experimental Results

A number of computational equations have been proposed for the horizontal shear strength of the interface based on various research results [5,6,9,13,30,32]. The current design codes specify the horizontal shear strength equation differently because they selectively reflect design parameters such as adhesion, shear friction, and dowel action of shear connectors across the interface. ACI 318 [27] classifies design cases into two categories depending on the size of the clamping stress. Case 1 corresponds to the adhesion at the interface, and Case 2 corresponds to the shear friction by shear reinforcements. However, AASHTO LRFD [29] presents the design expression in Equation (4), simultaneously considering adhesion and shear friction. The fib Model Code (MC 2010 [31]) provides the interface shear strength in Equation (5) which considering the aggregate interlock, shear friction, and dowel action together, although defining the friction factor as 0.7 for a roughened surface.
AASHTO LRFD [29] estimates the interface shear strength for a clean, rough surface as follows:
v n = c + μ ( ρ v f y + σ c )   ( MPa ) ,
where c = cohesion factor, μ = friction factor, A v = area of shear reinforcement crossing the interface area A c v , and f y = yield stress of reinforcement.
MC 2010 [30] estimates the interface shear strength to calculate the capacity of interface reinforcement on a clean, rough surface as follows:
τ u = τ c f c k 3 + μ ( σ n + k 1 ρ f y ) + k 2 ρ f c d f y β v f c ,
where τ c = the coefficient for aggregate interlock effects at rough interfaces, μ = coefficient of friction, k 1 = coefficient of clamping effect by interface reinforcement, k 2 = coefficient for dowel effect of reinforcement, and β c = coefficient of diagonal concrete strut angle.
Table 2 shows the key parameters and limitations for the horizontal shear strength equation of ACI, PCI, AASHTO LRFD, and MC 2010.
The purpose of this study was to assess whether current design standards adequately reflect the effect of the interface conditions of PC composite beams on the horizontal shear strength. A database was constructed from the results of 84 push-off experiments and 95 beam experiments. Table 3 and Table 4 show the configuration of the database of push-off tests and beam flexural tests, respectively. The maximum horizontal shear strength of the tests is represented as the ratio with respect to the predicted values from ACI, PCI, AASHTO LRFD, and MC 2010 design equations.
Table 5 shows strength ratios of the push-off tests as the average value, standard deviation, and coefficient of variation. The ratios were found to have an average value of 1.18 to 2.95 and a coefficient of variation of 9.0 to 45.1% with respect to surface roughness. It is considered that all design code equations are capable of evaluating the horizontal shear strength of the specimen with adequate safety. However, the push-off test on the smooth surface of the interface showed a higher value than the horizontal shear strength calculated by the design code equation, and all design codes underestimate.
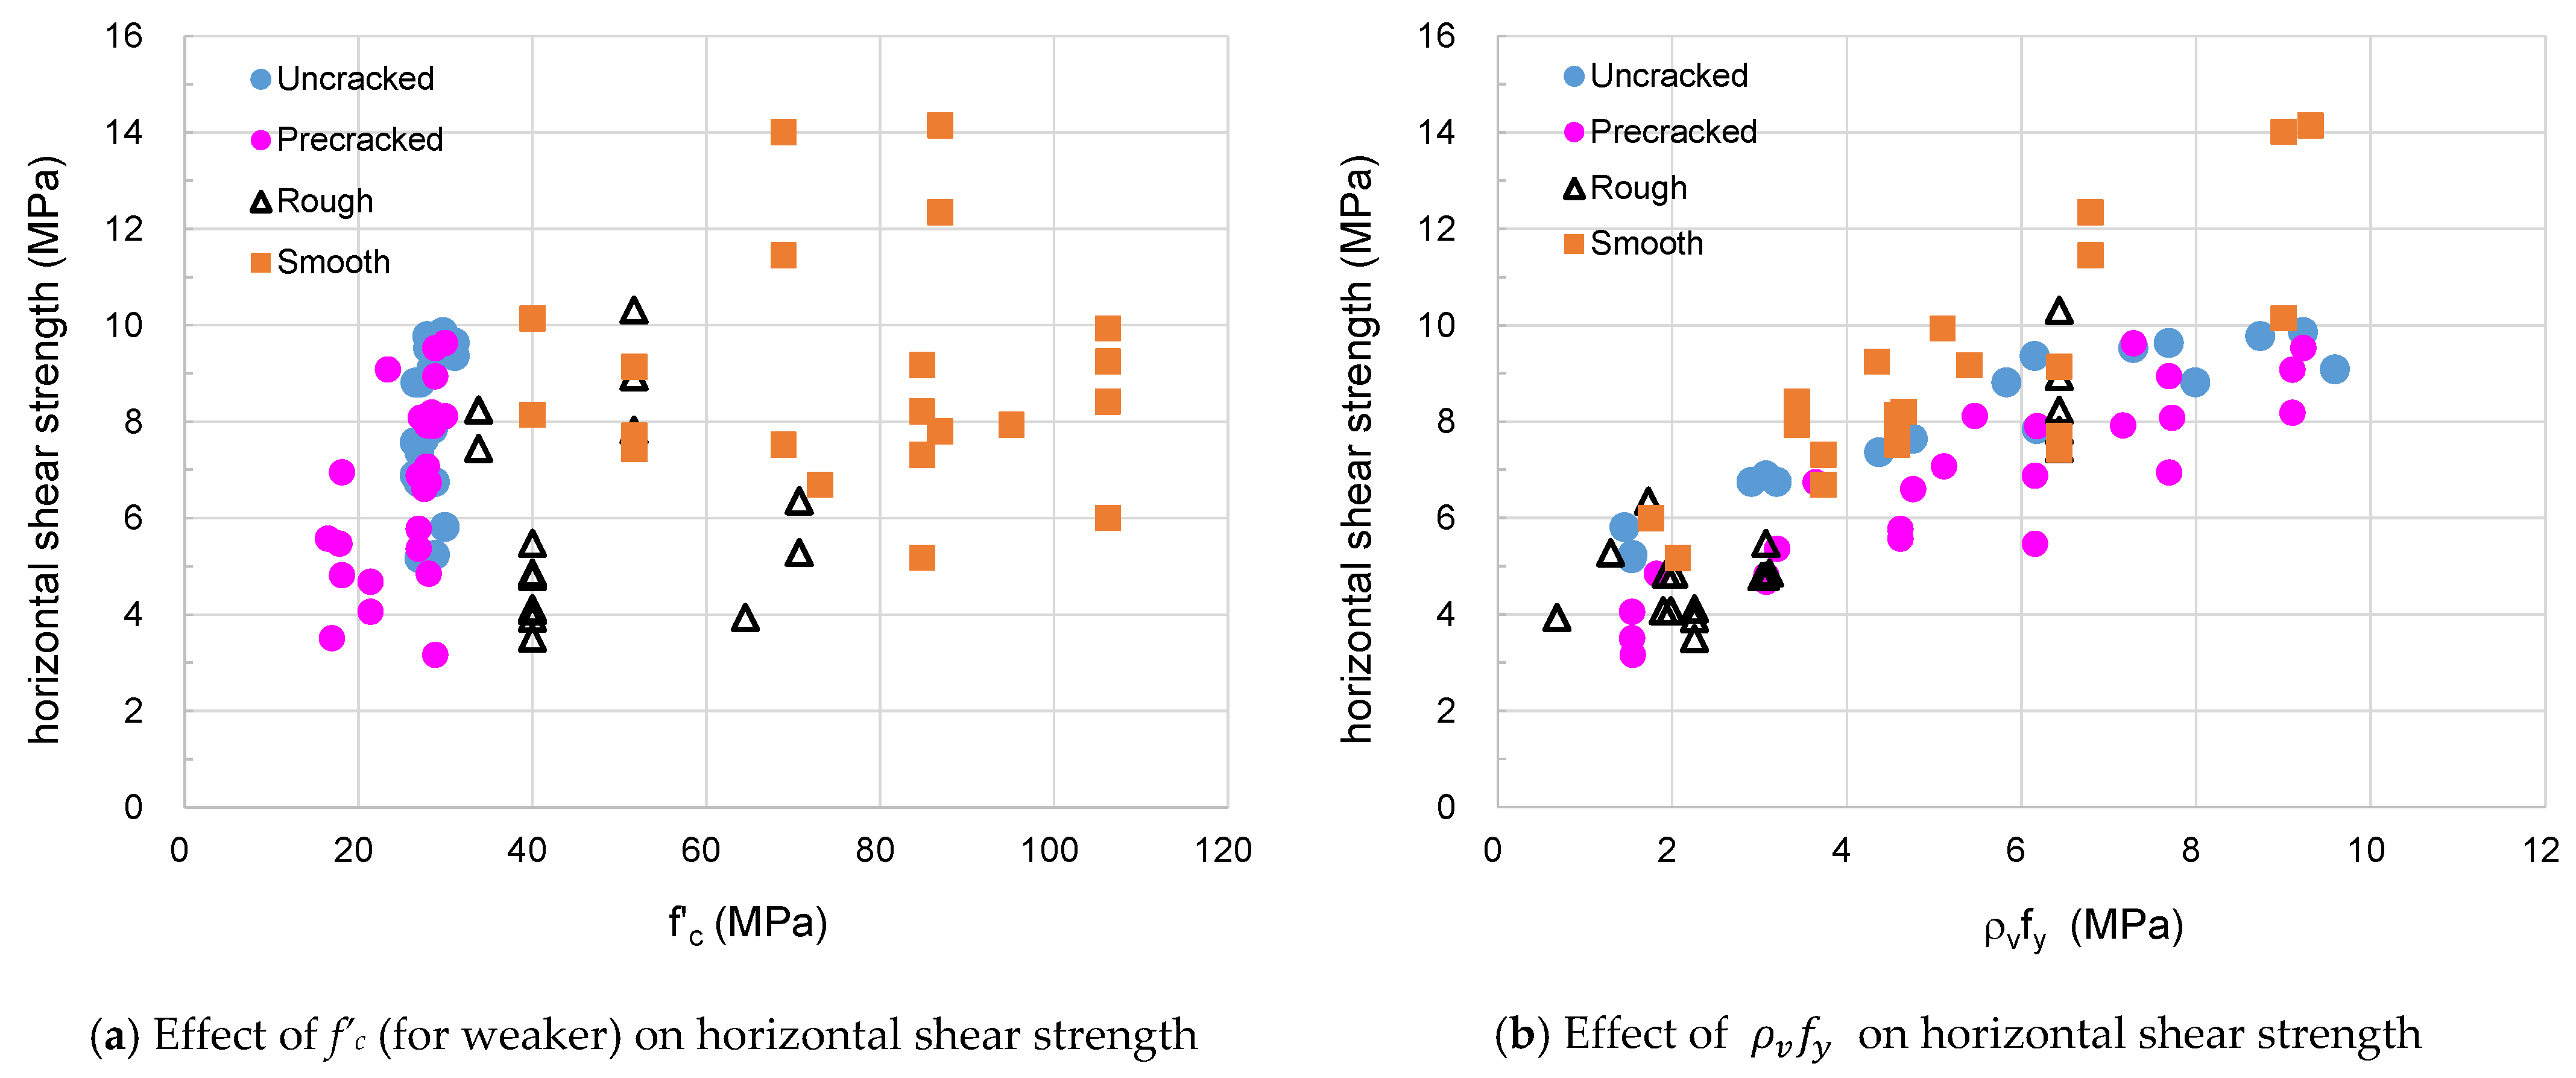
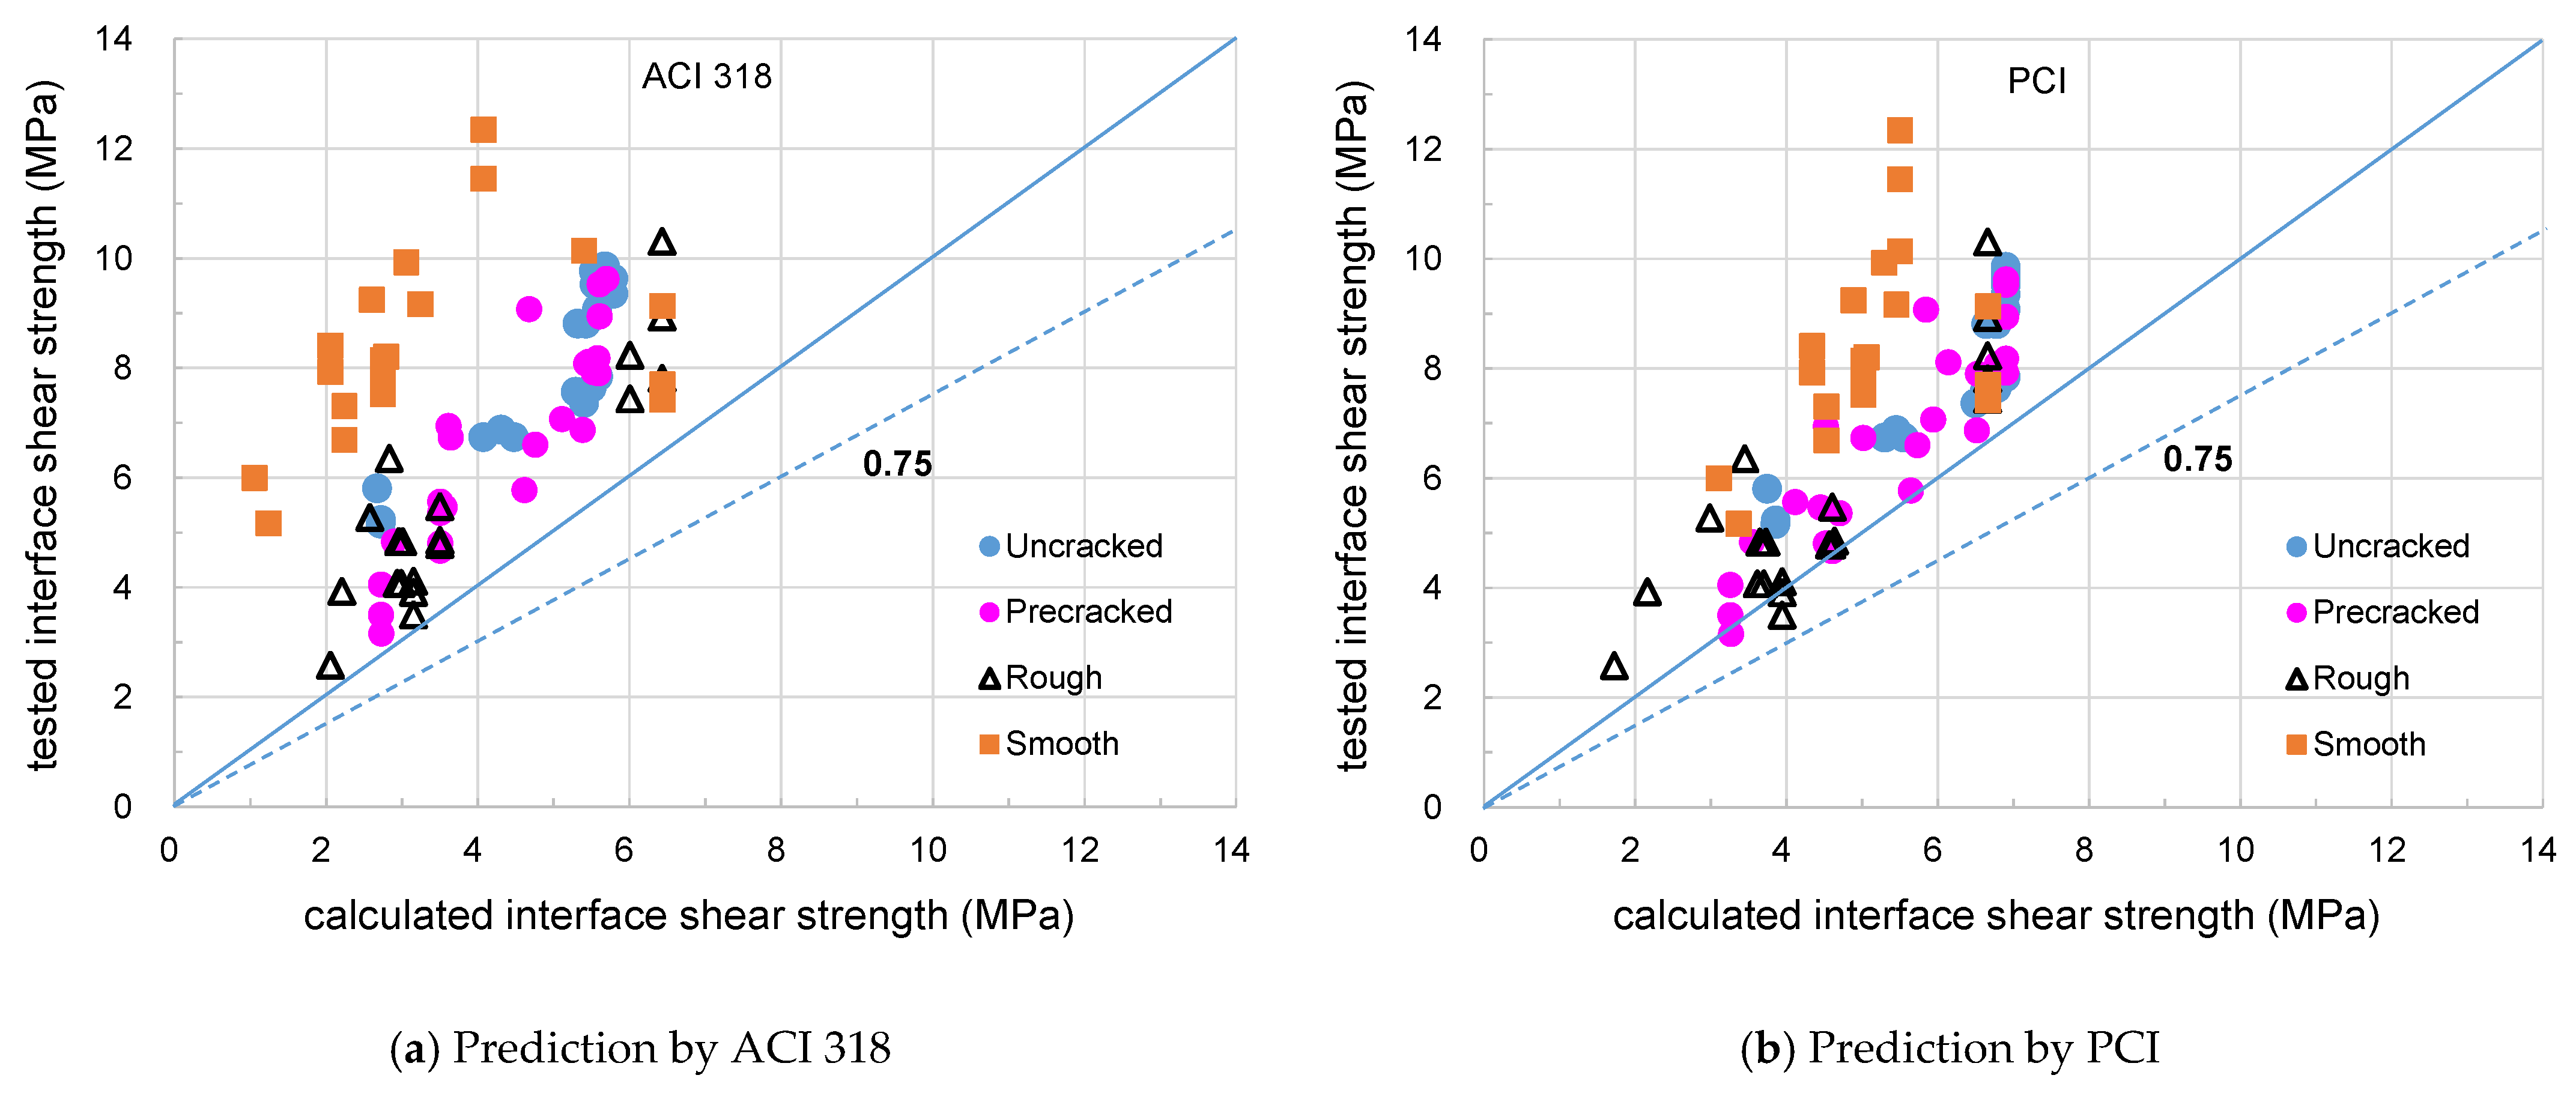
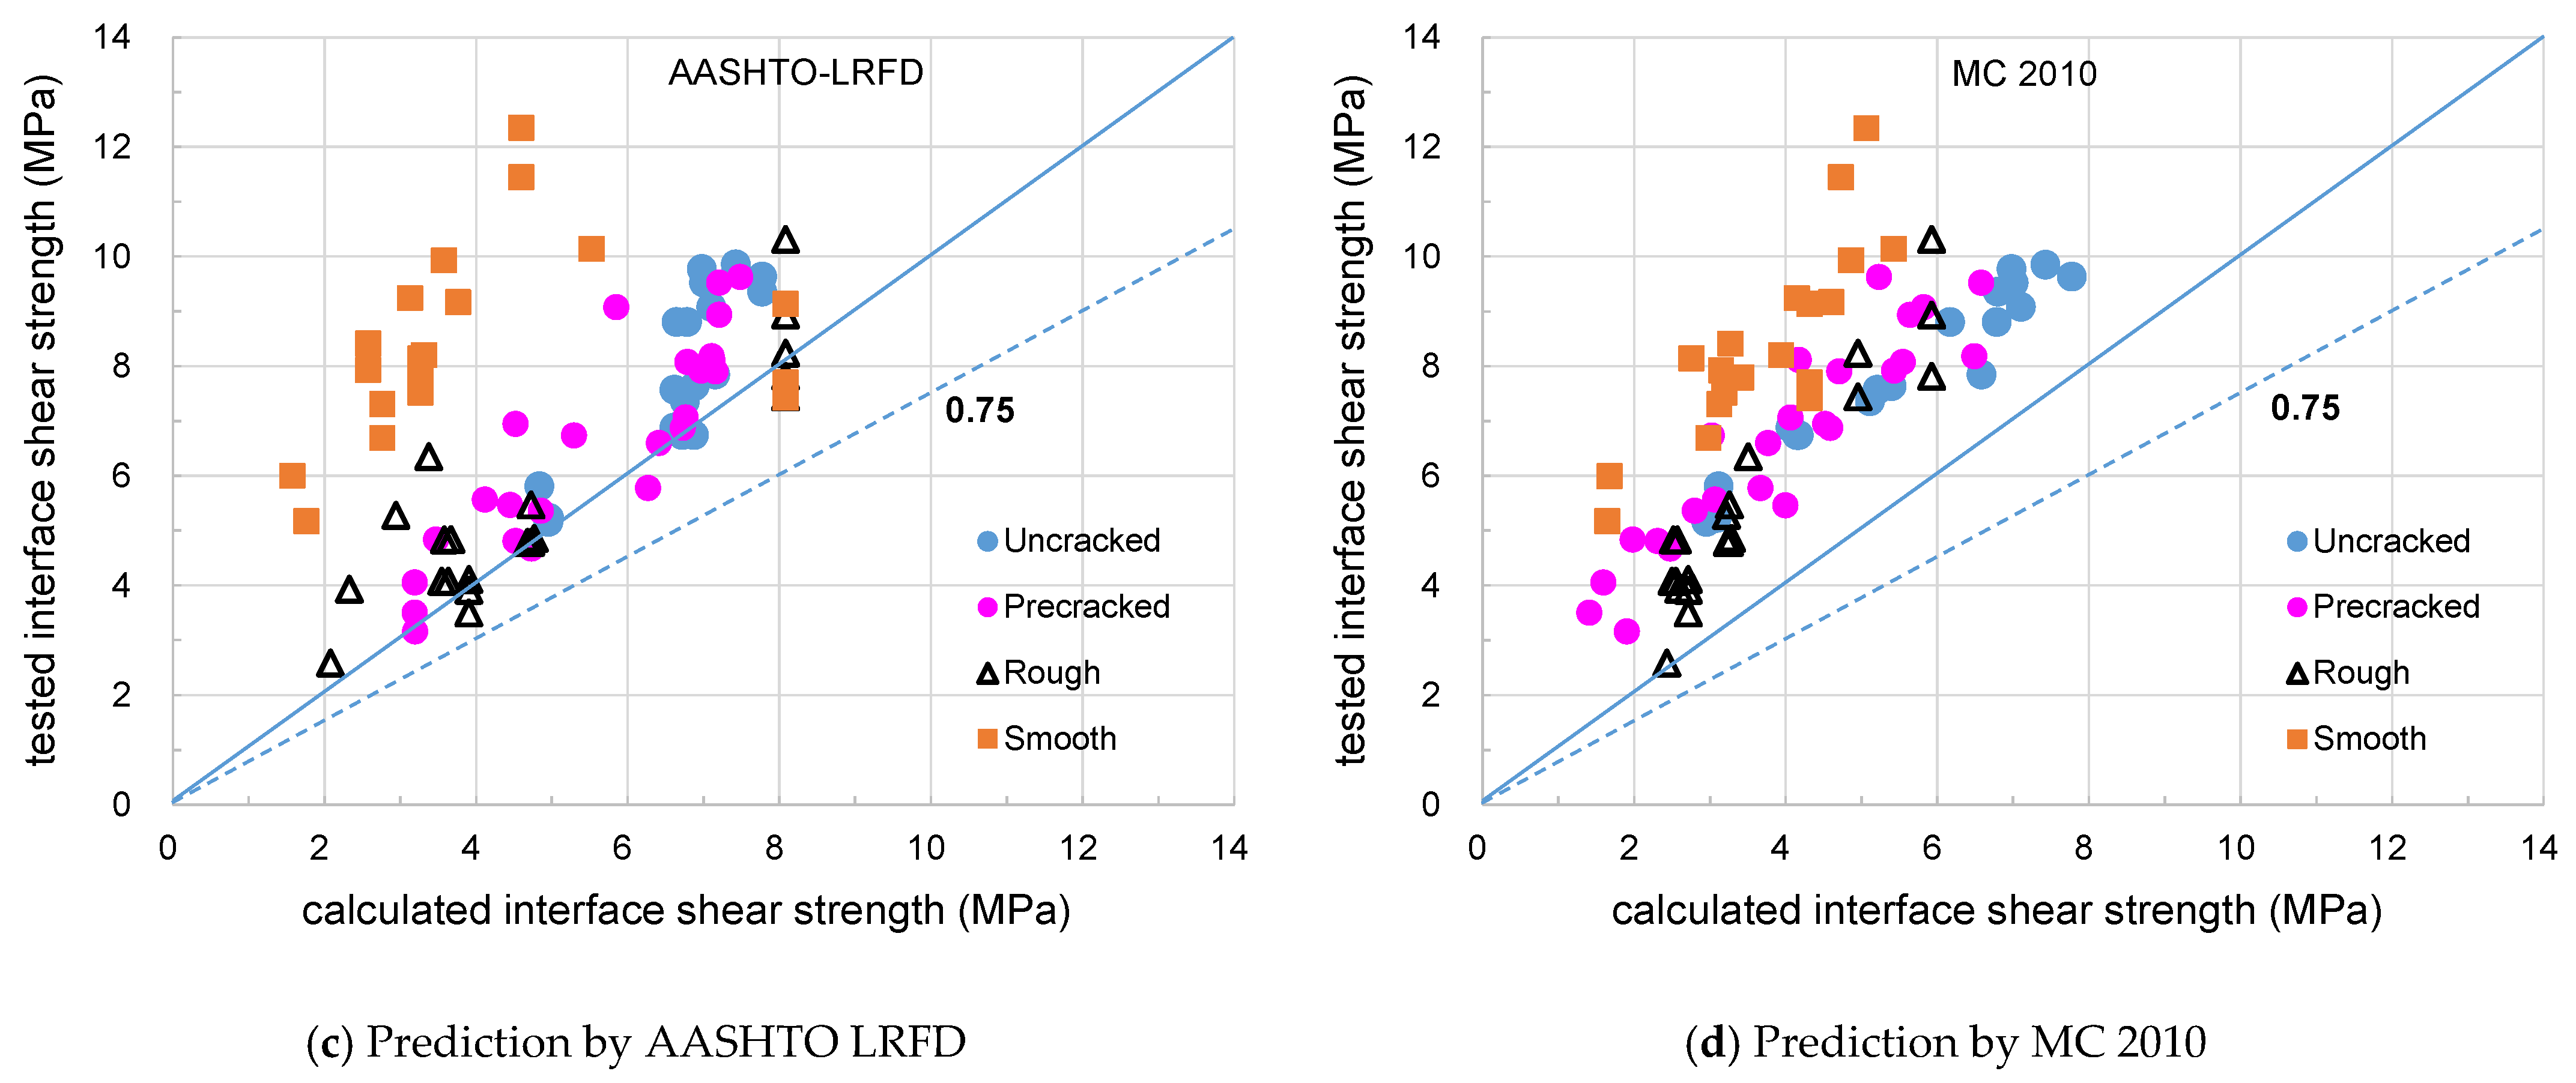
Figure 7 and Figure 8 show the distribution of strength ratios from the push-off tests depending on the interface condition classified as uncracked, pre-cracked, rough, and smooth. In these figures, the strength ratios of the push-off specimens with different levels of roughness were examined to assess the effect of the concrete compressive strength for the weaker layer and the clamping stress on the horizontal shear strength. When the compressive strength of weaker concrete increases, the horizontal shear strength of the interface tends to increase, but shows a large deviation. However, the horizontal shear strength of the interface showed a large value as the clamping stress increased regardless of the surface condition. All design provisions conservatively predict the horizontal shear strength of the experiments. The horizontal shear strength for a smooth surface showed a coefficient of variation of 18.9% by MC 2010, and the scatter was small, as shown in Figure 8.
Table 6 shows the distribution characteristics of the strength ratios of the flexural tests. The beam specimens were first divided into two groups of rough and smooth surfaces, and then the rough surface was classified into Case 1 (horizontal shear transfer) and Case 2 (shear friction) categories.
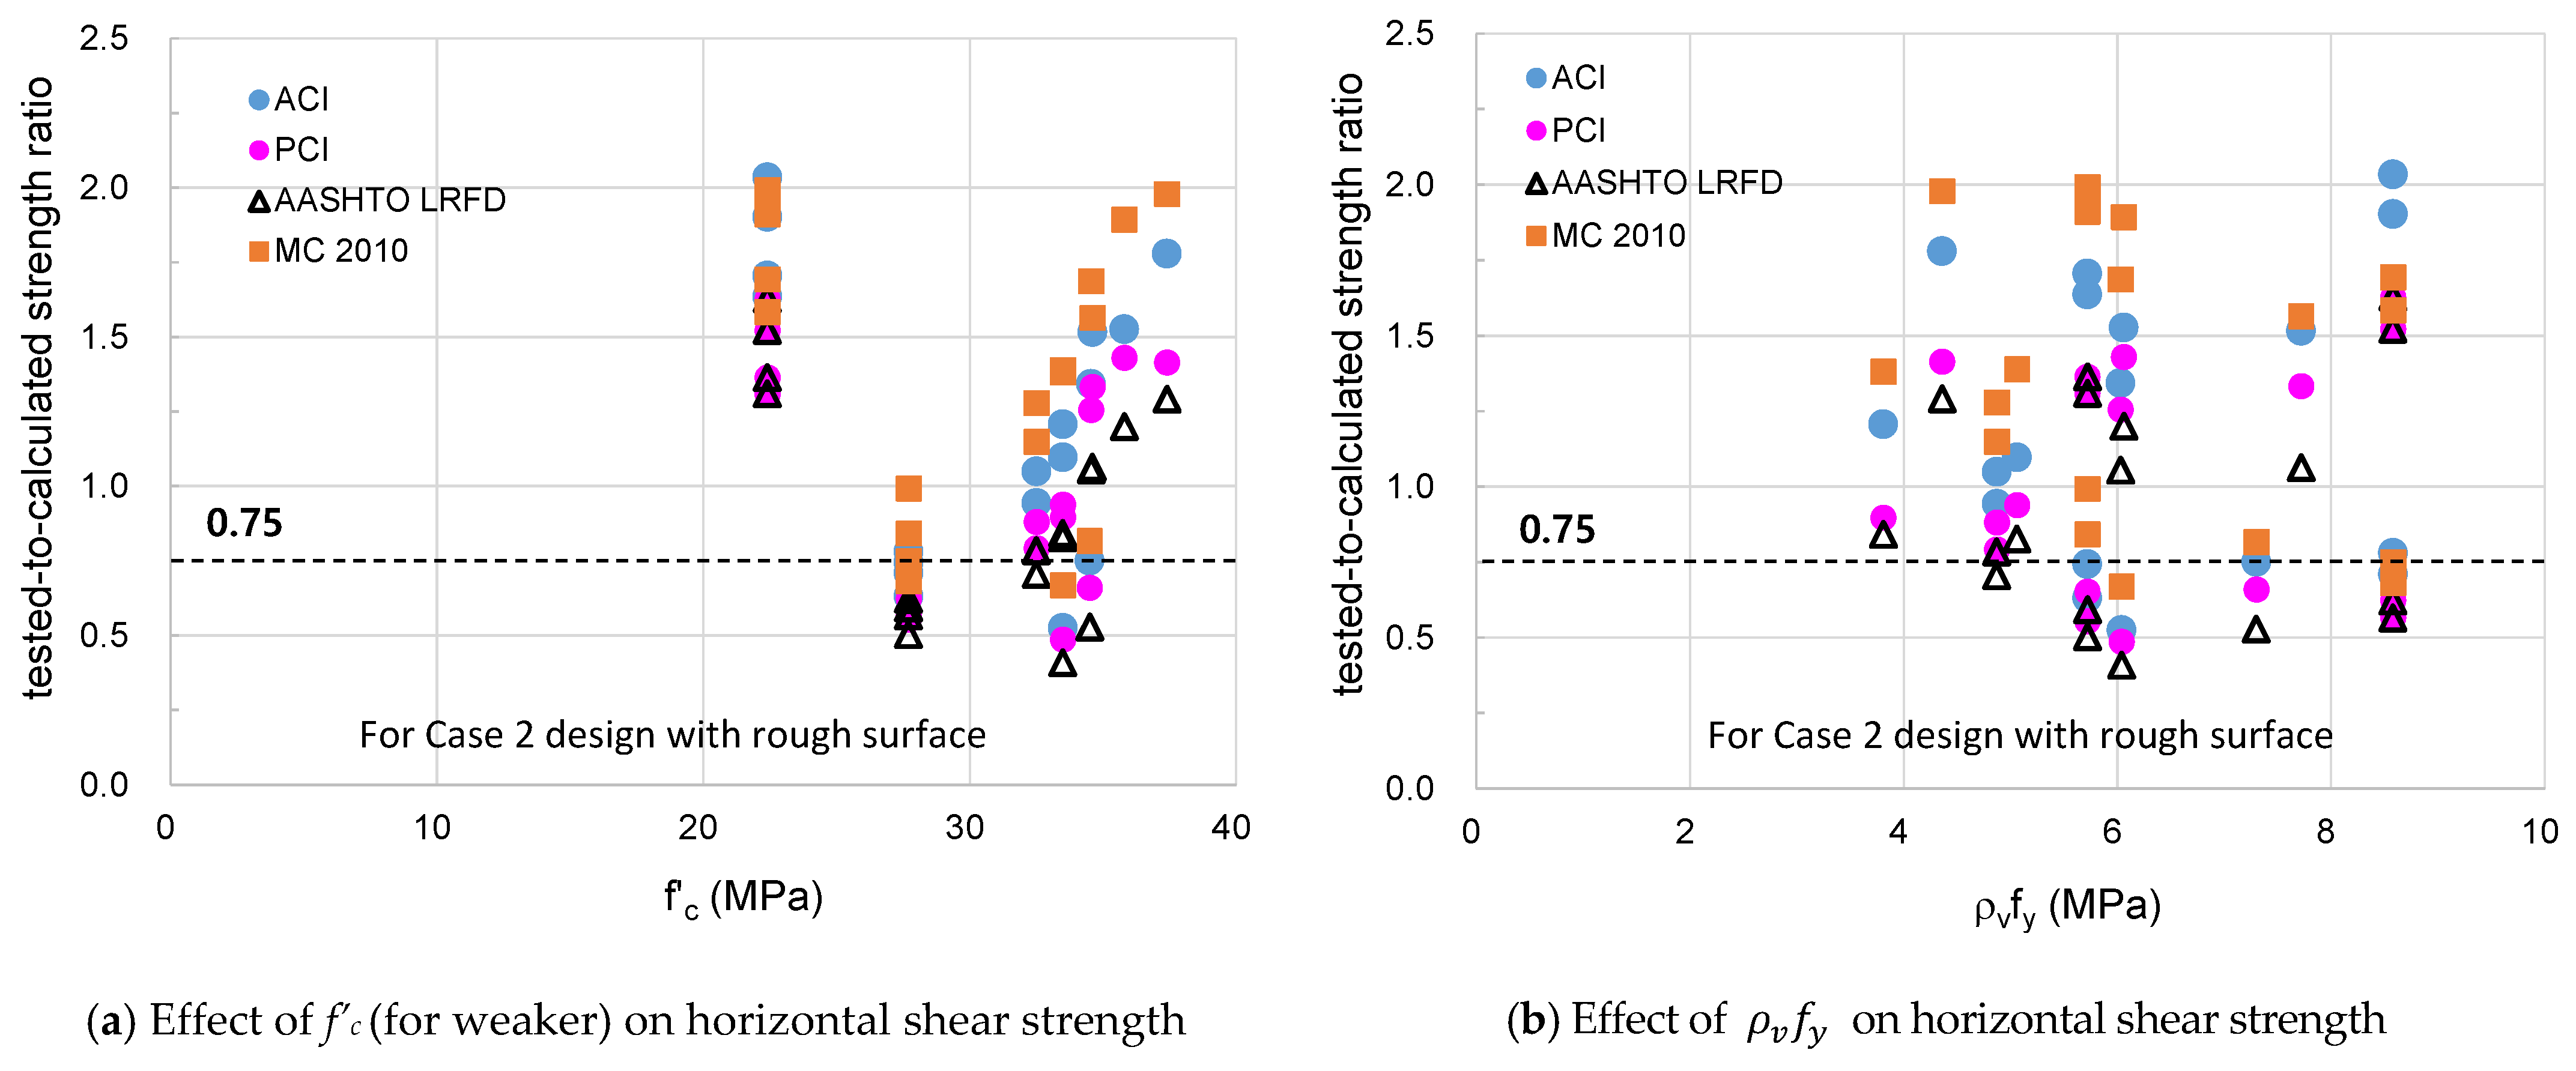
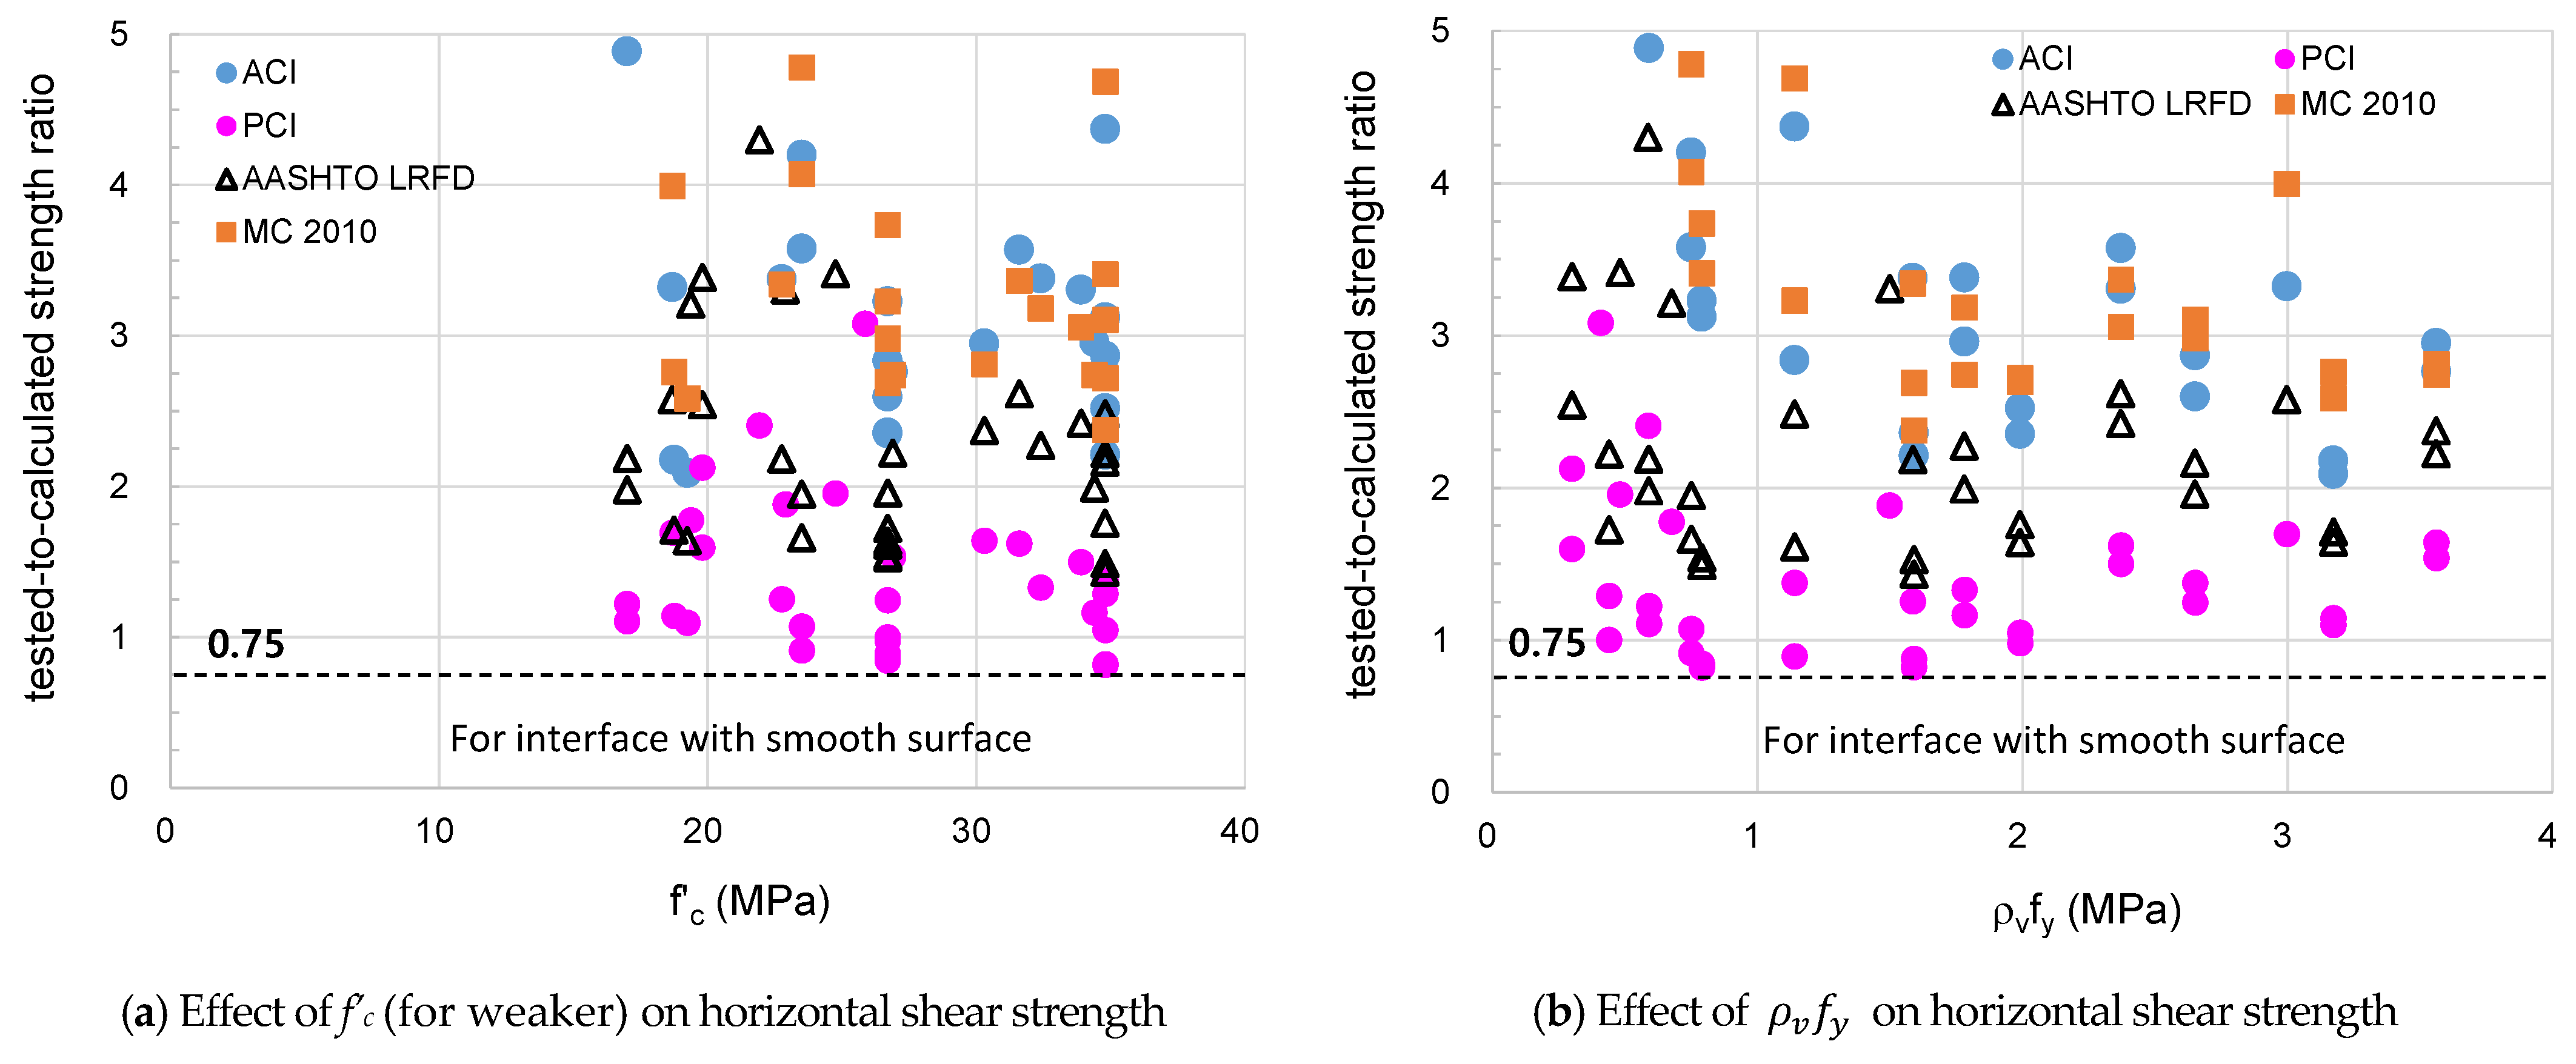
Figure 9 shows the distribution of strength ratios for the Case 1 category with respect to the concrete compressive strength and the clamping stress. Furthermore, Figure 10 shows the distribution of the strength ratios for the Case 2 category. The distribution of the strength ratios for specimens with a smooth surface presented in Figure 11 shows large values for the strength ratios of all design codes. These results are probably due to conservative evaluation of the resistance of the smooth interface by adhesion and shear friction.
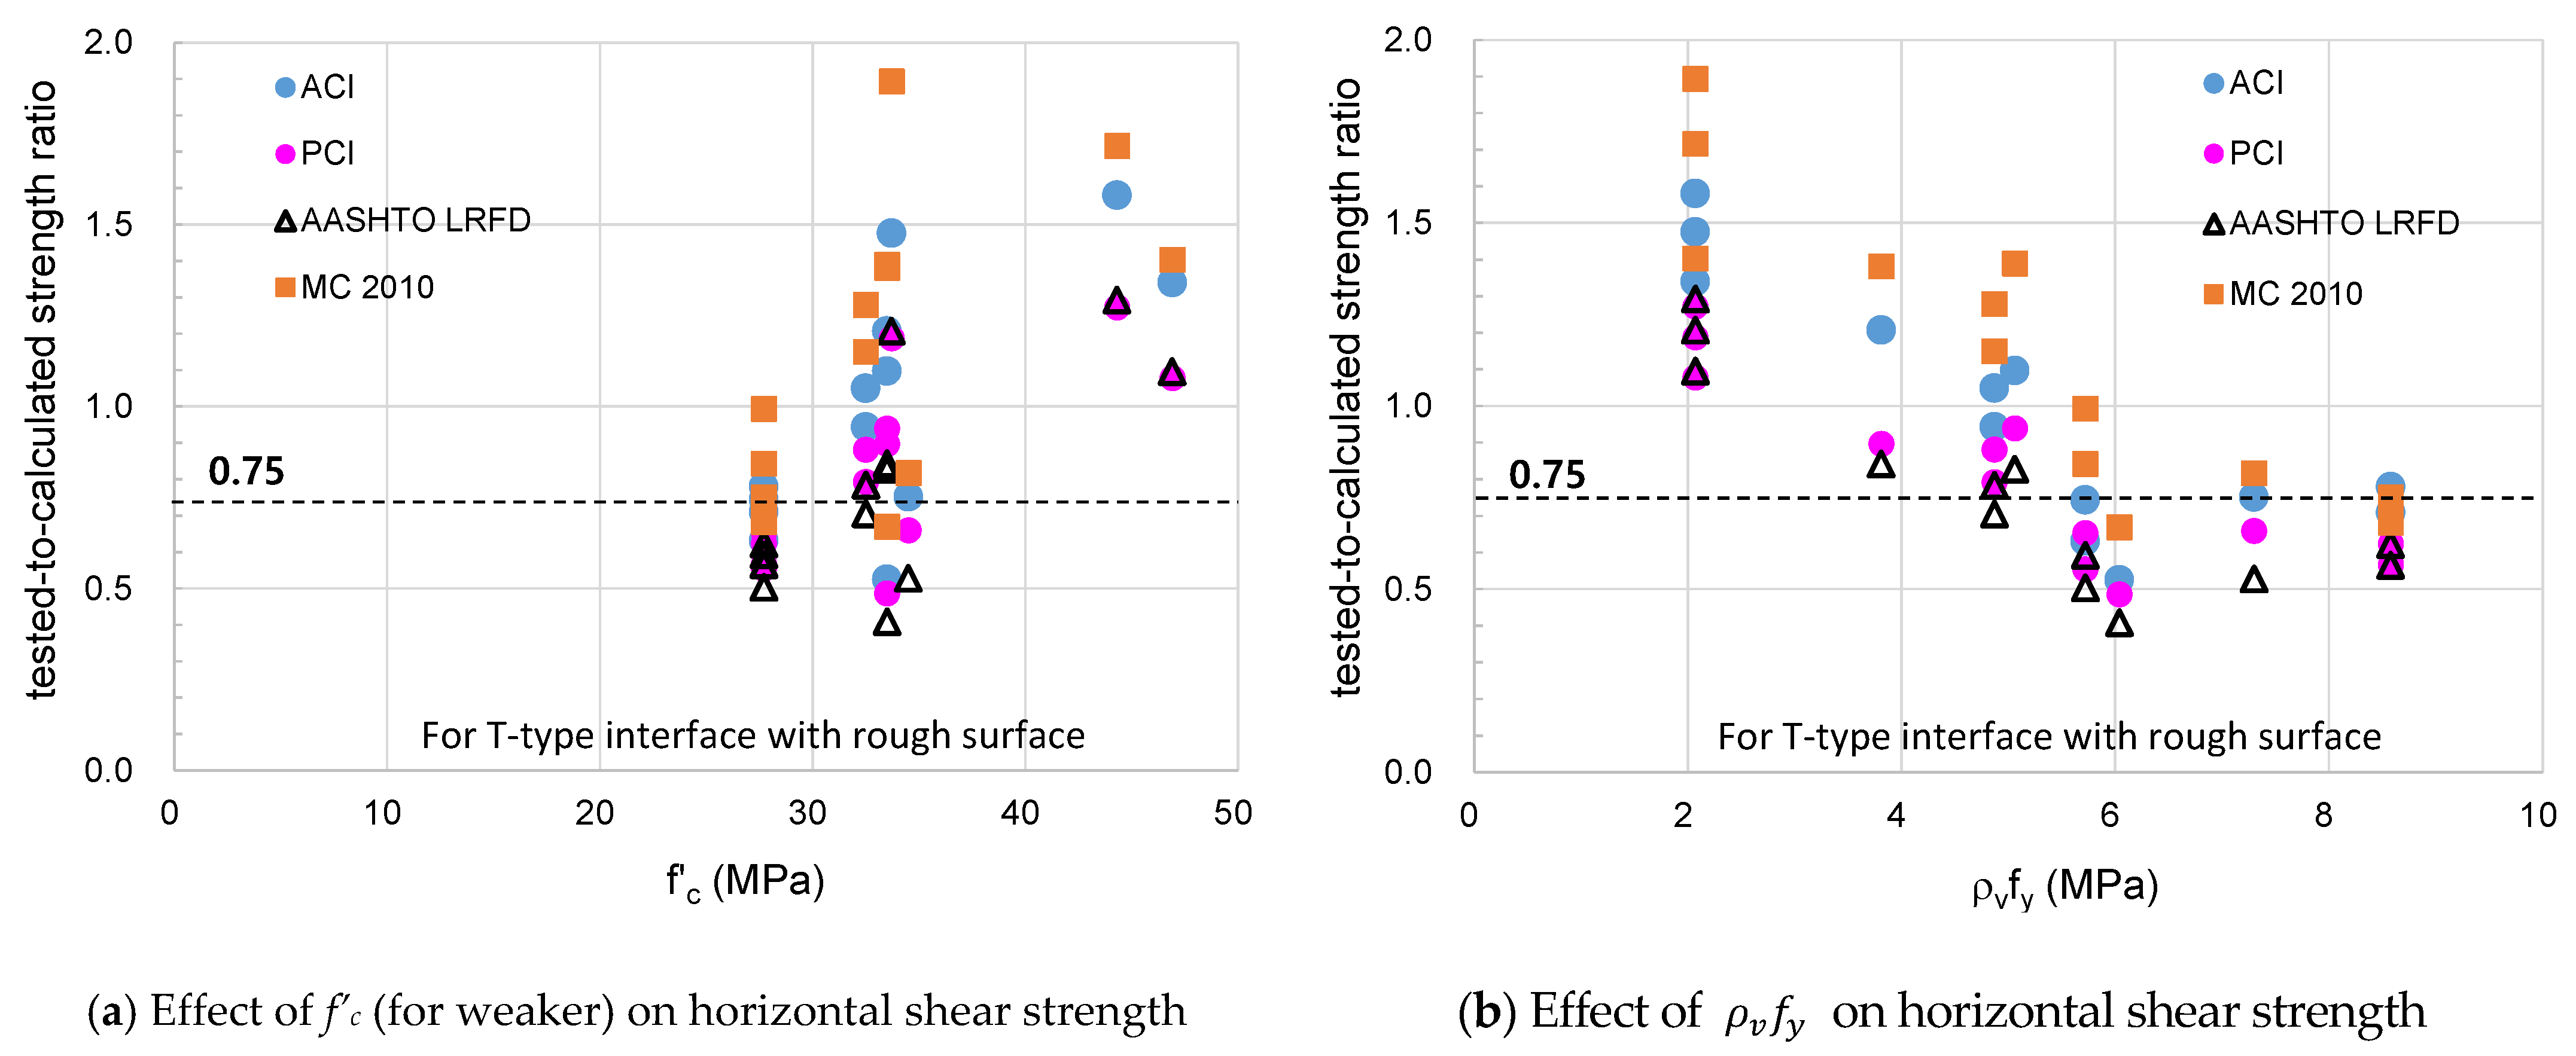
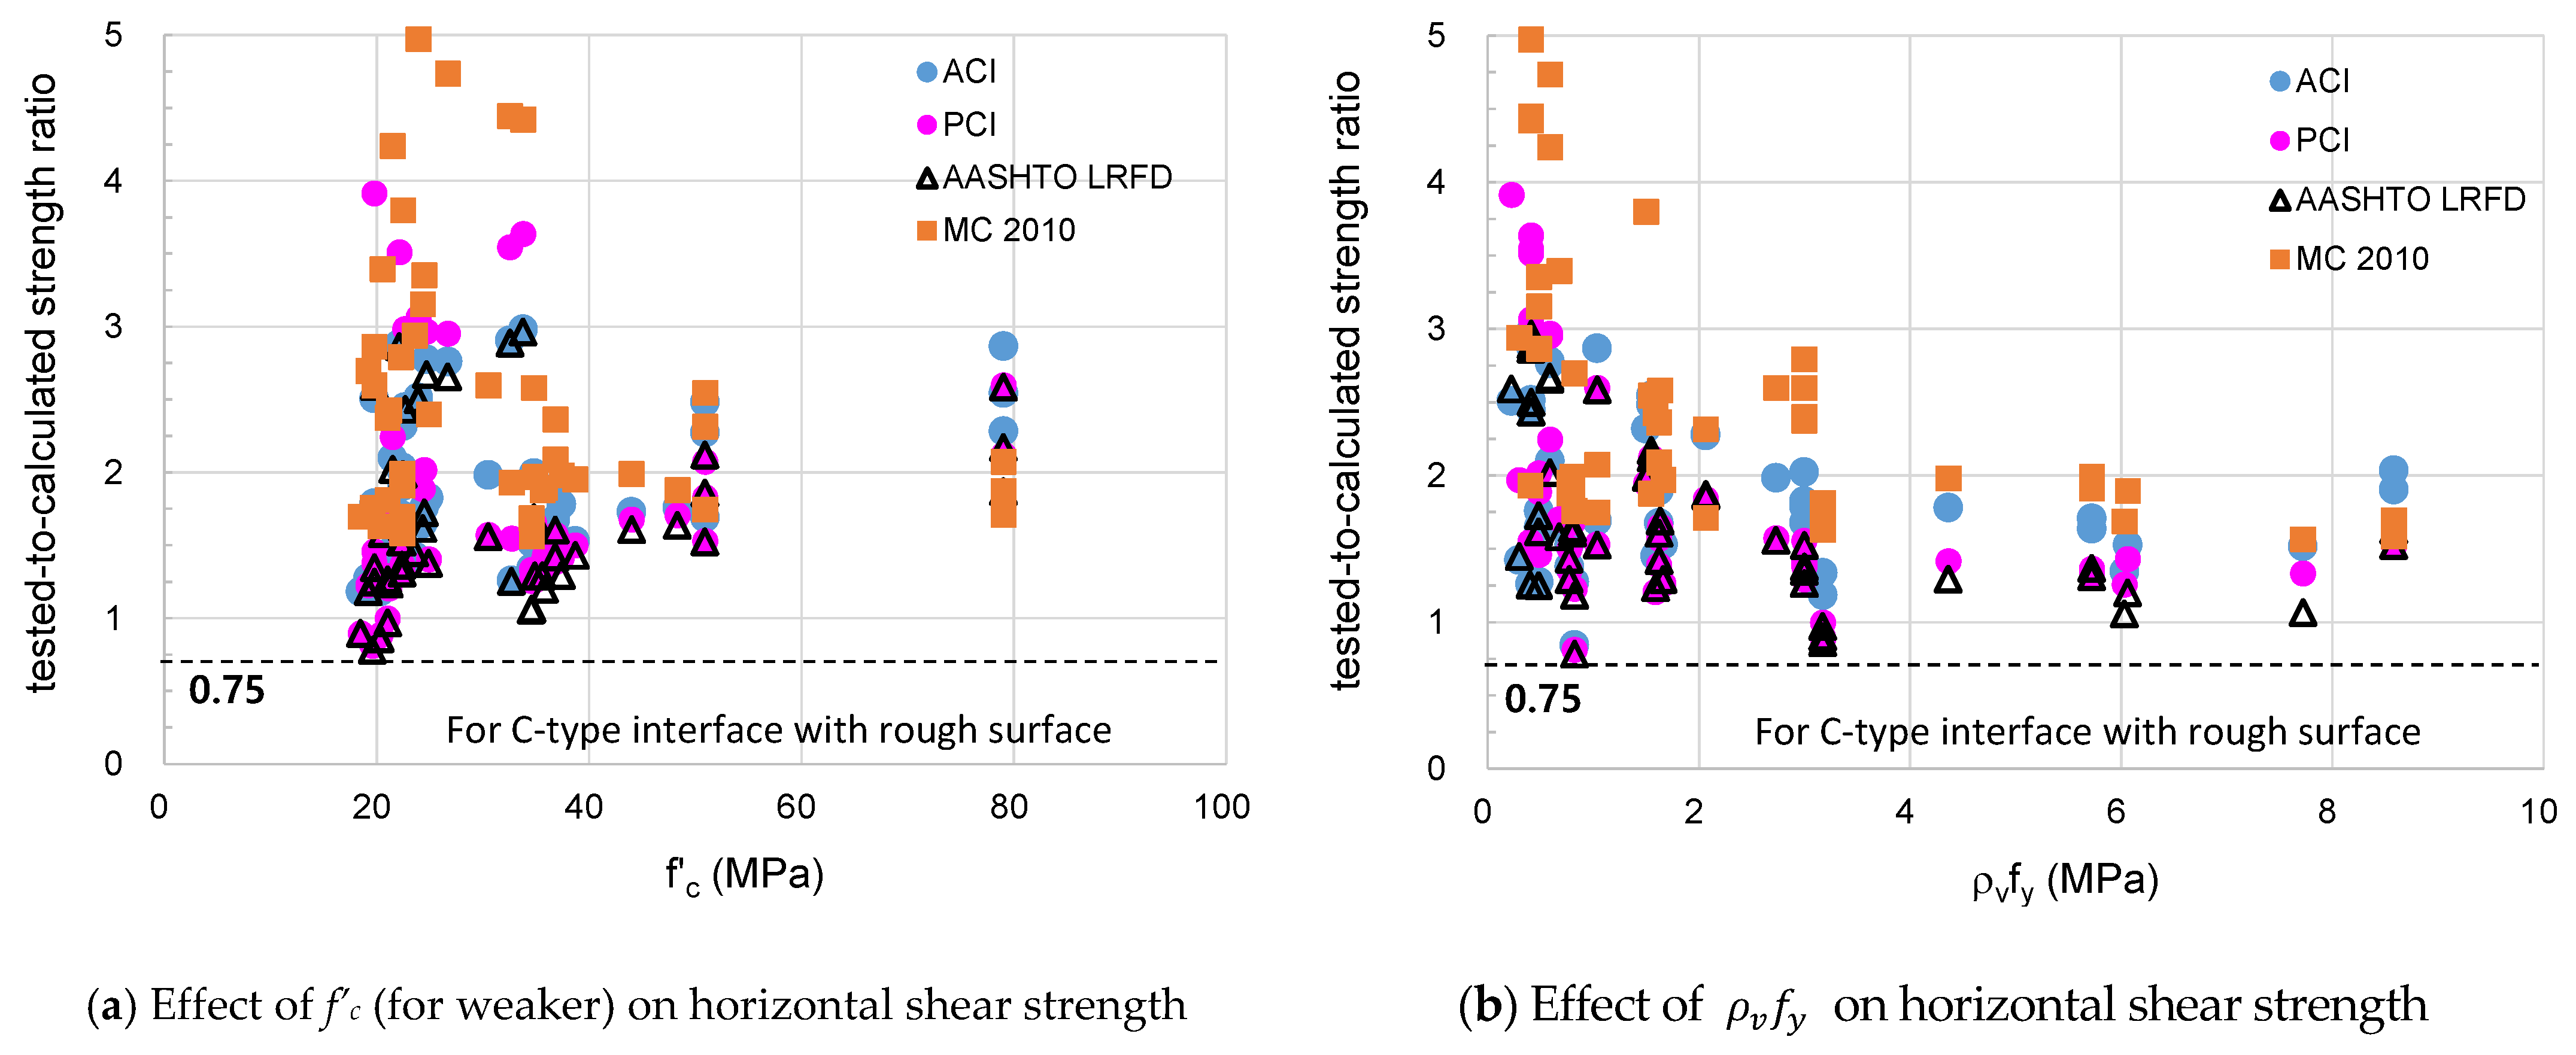
Figure 9 and Figure 11 show that safety-side estimation can be made if a strength reduction factor of 0.75 is used when calculating the horizontal shear strength for cases of a smooth interface or composite beam in the Case 1 category. However, Figure 10 shows unsafe cases in which the horizontal shear strength for Case 2 category was overestimated regardless of concrete compressive strength and clamping stress. This phenomenon is related to the interface location as a design variable that affects the horizontal shear strength of the composite beam. However, the current design codes do not take into account this variable, so it is necessary to quantify such an adverse effect.
Table 7 shows the strength ratios for beam specimens with rough surface connecting to the category divisions of Case 1 and Case 2. It shows statistical indices relating with the distribution of the strength ratio with respect to the interface location. Figure 12 and Figure 13 show the distribution of the strength ratios for a total of 63 beam specimens according to the concrete compressive strength and the clamping stress by classifying them into T-type interface and C-type interface, respectively. As a result, the C-type interface shows a minimum strength ratio of 0.78 to 1.56 and an average value of 1.67 to 2.75 according to the design codes. On the other hand, the strength ratio for T-type interface indicates a minimum value of 0.41~0.67 and an average value of 0.77~1.15 in accordance with the design codes. For composite beams with T-type interface, the horizontal shear strength increased as the compressive strength of concrete increased, but decreased as the clamping stress increased. It was confirmed that the current code equation tends to overestimate the interface shear strength for composite beams, with T-type interface having a clamping stress of 4 MPa or more, as shown in Figure 12b.
However, MC 2010 gives a relatively safe estimation of the horizontal shear strength for specimens with T-type interface in case of Case 2 category. It is considered that MC 2010 specifies the friction factor of 0.7 to reflect the contribution of shear friction by shear connector. On the other hand, ACI code with a friction factor of 1.0 produced a minimum strength ratio of 0.53. However, if a friction factor of 0.7 is applied for ACI prediction for T-type interface in shear friction design category, all strength ratios can rise above a strength reduction factor of 0.75. Therefore, it is recommended that the friction factor of 0.7 is used in order to reflect the deterioration of horizontal shear performance for T-type interface.

5. Conclusions

When a composite PC beam is used in a member with a long span or a large live load, the shear force and the bending moment increase, and the horizontal shear stress acts on the interface within the moment inflection point. In particular, a continuous composite PC beam can exhibit a larger rate of change in the negative moment compared to the length of the moment inflection point. On the other hand, the horizontal interface of the composite PC beam is located in the tensile region or the compression region of the cross-section depending on the negative moment or the positive moment. When designing continuous PC composite beams, the horizontal shear performance may be expected to vary depending on the location of the interface. This study examined whether the horizontal shear design equations properly evaluate the conditions of the interfaces, such as interface locations, surface roughness, and clamping stresses of shear connectors. A database was constructed for 84 push-off experiments and 95 beam flexure tests from previous studies. The adequacy of the design criteria was evaluated through statistical analyses comparing the results of experimental database with ACI, PCI, AASHTO LRFD, and MC 2010 design criteria. The conclusions from this study are as follows.
  • It was found that the horizontal shear strength equations of the current design codes predict conservatively the horizontal shear strength of push-off specimens regardless of the variables such as the concrete compressive strength and the clamping stress of the shear connector on the interface, as well as surface roughness. However, the push-off tests cannot distinguish the difference from the interface location for either C-type or T-type.
  • The horizontal shear strengths by flexure tests were shown to vary greatly depending on the location of the interfaces. In particular, composite beams with roughened T-type interfaces showed a distribution of strength ratios with a minimum value of 0.41 to 0.67 and an average value of 0.77 to 1.15, indicating that horizontal shear strengths are overestimated.
  • The horizontal shear strength of the composite beam with roughened T-type interface increased as the compressive strength of concrete increased, but decreased as the clamping stress increased. Based on evaluation, it could be suggested that the shear connector did not operate sufficiently to control the slip deformation at the interface.
  • In order to prevent members with roughened T-type interface from brittle failure, it is recommended to use a friction coefficient of 0.7 when using the shear friction method of ACI code.
  • It is necessary in the future studies to include the interface location with respect to the neutral axis of composite beam as a variable for the interface shear design equation.

Author Contributions

Original draft manuscript and investigation, Y.-H.O.; validation and review writing J.-H.M. Both authors have read and agreed to the published version of the manuscript.

Funding

This research was supported by the Konyang University Research Fund in 2019 (Grant No. 2019A0022).

Institutional Review Board Statement

Not applicable.

Informed Consent Statement

Not applicable.

Data Availability Statement

The data presented in this study are available on request from the author.

Conflicts of Interest

The authors declare no conflict of interest.

References

  1. Han, S.J.; Heo, I.; Kim, J.H.; Kim, K.S.; Oh, Y.H. Experimental and Numerical Studies on the Structural Performance of a Double Composite Wall. Appl. Sci. 2021, 11, 506. [Google Scholar] [CrossRef]
  2. Han, S.J.; Jeong, J.H.; Joo, H.E.; Choi, S.H.; Choi, S.; Kim, K.S. Flexural and Shear Performance of Prestressed Composite Slabs with Inverted Multi-Ribs. Appl. Sci. 2019, 9, 4946. [Google Scholar] [CrossRef] [Green Version]
  3. Hou, H.; Liu, X.; Qu, B.; Ma, T.; Liu, H.; Feng, M.; Zhang, B. Experimental Evaluation of Flexural Behavior of Composite Beams with Cast-in-place Concrete Slabs on Precast Prestressed Concrete Decks. Eng. Struct. 2015, 126, 405–416. [Google Scholar] [CrossRef]
  4. Saemann, J.C.; Washa, G.W. Horizontal Shear Connections Between Precast Beams and Cast-in-place Slabs. ACI J. 1964, 61, 1383–1408. [Google Scholar]
  5. Loov, R.E.; Patnaik, A.K. Horizontal Shear Strength of Composite Concrete Beams with a Rough Interface. PCI J. 1994, 39, 48–69. [Google Scholar] [CrossRef]
  6. Patnaik, A.H. Behavior of Composite Concrete Beams with Smooth Interface, American Society of Civil Engineers. J. Struct. Eng. 2001, 127, 359–366. [Google Scholar] [CrossRef]
  7. Kahn, L.F.; Slapkus, A. Interface Shear in High Strength Composite T-beams. PCI J. 2004, 49, 102–110. [Google Scholar] [CrossRef]
  8. Gohnert, M. Horizontal Shear Transfer Across a Roughened Surface. Cem. Concr. Compos. 2003, 25, 379–385. [Google Scholar] [CrossRef]
  9. Mattock, A.H.; Hawkins, N.M. Shear Transfer in Reinforced Concrete-Recent Research. PCI J. 1972, 17, 55–75. [Google Scholar] [CrossRef]
  10. Mattock, A.H. Shear Transfer under Monotonic Loading, across an Interface between Concretes Cast at Different Times; Report SM; University of Washington: Seattle, WA, USA, 1976; p. 62. [Google Scholar]
  11. Walraven, J.C.; Reinhardt, H.W. Theory and Experiments on the Mechanical Behaviour of Cracks in Plain and Reinforced Concrete Subjected to Shear Loading. Heron 1981, 26, 68. [Google Scholar]
  12. Hofbeck, J.A.; Ibrahim, I.O.; Mattock, A.H. Shear Transfer in Reinforced Concrete. ACI J. 1969, 66, 119–128. [Google Scholar]
  13. Kahn, L.F.; Mitchell, A.D. Shear Friction Tests with High-Strength Concrete. ACI J. 2002, 99, 98–103. [Google Scholar]
  14. Mansur, M.A.; Vinayagam, T.; Tan, K.H. Shear Transfer Across a Crack in Reinforced High-Strength Concrete. J. Mater. Civ. Eng. 2008, 20, 294–302. [Google Scholar] [CrossRef]
  15. Zeno, G.A. Use of High-Strength Steel Reinforcement in Shear Friction Application; University of Pittsburgh: Pittsburgh, PA, USA, 2009. [Google Scholar]
  16. Scott, J. Interface Shear Strength in Lightweight Concrete Bridge Girders; Virginia Polytechnic Institute and State University: Blacksburg, VA, USA, 2010. [Google Scholar]
  17. Harries, K.A.; Zeno, G.; Shahrooz, B. Toward an Improved Understanding of Shear-Friction Behavior. ACI J. 2012, 109, 835–844. [Google Scholar]
  18. Soltani, M.; Ross, B.E. Database Evaluation of Interface Shear Transfer in Reinforced Concrete Members. ACI J. 2017, 114, 383–394. [Google Scholar] [CrossRef]
  19. Shaw, D.M.; Sneed, L.H. Interface Shear Transfer of Lightweight-Aggregate Concretes Cast at Different Times. PCI J. 2014, 59, 130–144. [Google Scholar] [CrossRef]
  20. Mattock, A.H.; Li, W.K.; Wang, T.C. Shear Transfer in Lightweight Reinforced Concrete. PCI J. 1976, 21, 20–39. [Google Scholar] [CrossRef]
  21. Jiang, H.B.; Fang, Z.C.; Liu, A.R.; Li, Y.H.; Feng, J.H. Interface Shear Behavior Between High-strength Precast Girders and Lightweight Cast-in-place Slabs. Constr. Build. Mater. 2016, 128, 449–460. [Google Scholar] [CrossRef]
  22. Banta, T.E. Horizontal Shear Transfer Between Ultra High Performance Concrete and Lightweight Concrete. Master’s Thesis, Virginia Polytechnic Institute and State University, Blacksburg, VA, USA, 2005; p. 138. [Google Scholar]
  23. Hoff, G.C. High Strength Lightweight Aggregate Concrete for Arctic Applications—Part 3: Structural Parameters, Structural Lightweight Aggregate Concrete Performance; SP-136; ACI: Farmington Hills, MI, USA, 1993; pp. 175–246. [Google Scholar]
  24. Moon, J.H.; Oh, Y.H. Development and Structural Performance Evaluation of Connection Details for the MRS System. Res. Rep. 2008, 337. (In Korean) [Google Scholar]
  25. Moon, J.H.; Oh, Y.H. Evaluation of Design Method and Shear Transfer Capacity on the Horizontal Interface of PC Composite Beams. J. Korea Concr. Inst. 2013, 25, 81–90. (In Korean) [Google Scholar] [CrossRef]
  26. Oh, Y.H.; Moon, J.H.; Kim, Y.N. Shear Friction Performance on the Horizontal Interface for PC Composite Beams Subjected to Negative Moment. J. Korea Concr. Inst. 2021, 33, 15–166. (In Korean) [Google Scholar]
  27. ACI Committee 318. Building Code Requirements for Structural Concrete (ACI 318–19); ACI: Farmington Hills, MI, USA, 2019. [Google Scholar]
  28. PCI Industry Handbook Committee. PCI Design Handbook, 8th ed.; Precast/Prestressed Concrete Institute: Chicago, IL, USA, 2017; p. 884. [Google Scholar]
  29. AASHTO. LRFD Bridge Design Specifications, 4th ed.; American Association of State Highway and Transportation Officials: Washington, DC, USA, 2007; p. 1526. ISBN 1-56051-354-3. [Google Scholar]
  30. Walraven, J.; Frenay, J.; Pruijssers, A. Influence of Concrete Strength and Load History on the Shear Friction Capacity of Concrete Members. PCI J. 1987, 32, 66–84. [Google Scholar] [CrossRef]
  31. Fédération Internationale du Béton. Model Code for Concrete Structures (MC-2010); Fédération Internationale du Béton: Lausanne, Switzerland, 2010. [Google Scholar]
  32. Randl, N. Investigations on Transfer of Forces between Old and New Concrete at Different Joint Roughness. Ph.D. Thesis, University of Innsbruck, Innsbruck, Austria, 1997. (In German). [Google Scholar]
  33. Randl, N. Design Recommendations for Interface Shear Transfer in fib Model Code 2010. Struct. Concr. J. 2013, 14, 230–241. [Google Scholar] [CrossRef]
  34. Santos, P.M.D.; Julio, E.N.B.S. Factors Affecting Bond between New and Old Concrete. ACI Mater. J. 2011, 108, 449–456. [Google Scholar]
  35. Randl, N.; Wicke, M. Schubübertragung Zwischen Alt-und Neubeton. Experimentelle Untersuchungen, Theoretischer Hintergrund Und Bemessungsansatz. Beton-und Stahlbetonbau 2000, 95, 461–473. [Google Scholar] [CrossRef]
  36. Ahmad, S.; Bhargava, P.; Chourasia, A. Shear Transfer Strength of Uncracked Interfaces: A Simple Analytical Model. Constr. Build. Mater. 2018, 192, 366–380. [Google Scholar] [CrossRef]
  37. Halicka, A. Influence New-to-Old Concrete Interface Qualities on the Behaviour of Support Zones of Composite Concrete Beams. Constr. Build. Mater. 2011, 25, 4072–4078. [Google Scholar] [CrossRef]
  38. Jabłoński, Ł.; Halicka, A. Influence of the Interface Reinforcement on Static Performance of Concrete Composite T-Shaped Beams. Bud. Archit. 2020, 19, 63–76. [Google Scholar] [CrossRef]
  39. Júlio, E.N.B.S.; Dias-da-Costa, D.; Branco, F.A.B.; Alfaiate, J.M.V. Accuracy of Design Code Expressions for Estimating Longitudinal Shear Strength of Strengthening Concrete Overlays. Eng. Struct. 2010, 32, 2387–2393. [Google Scholar] [CrossRef]
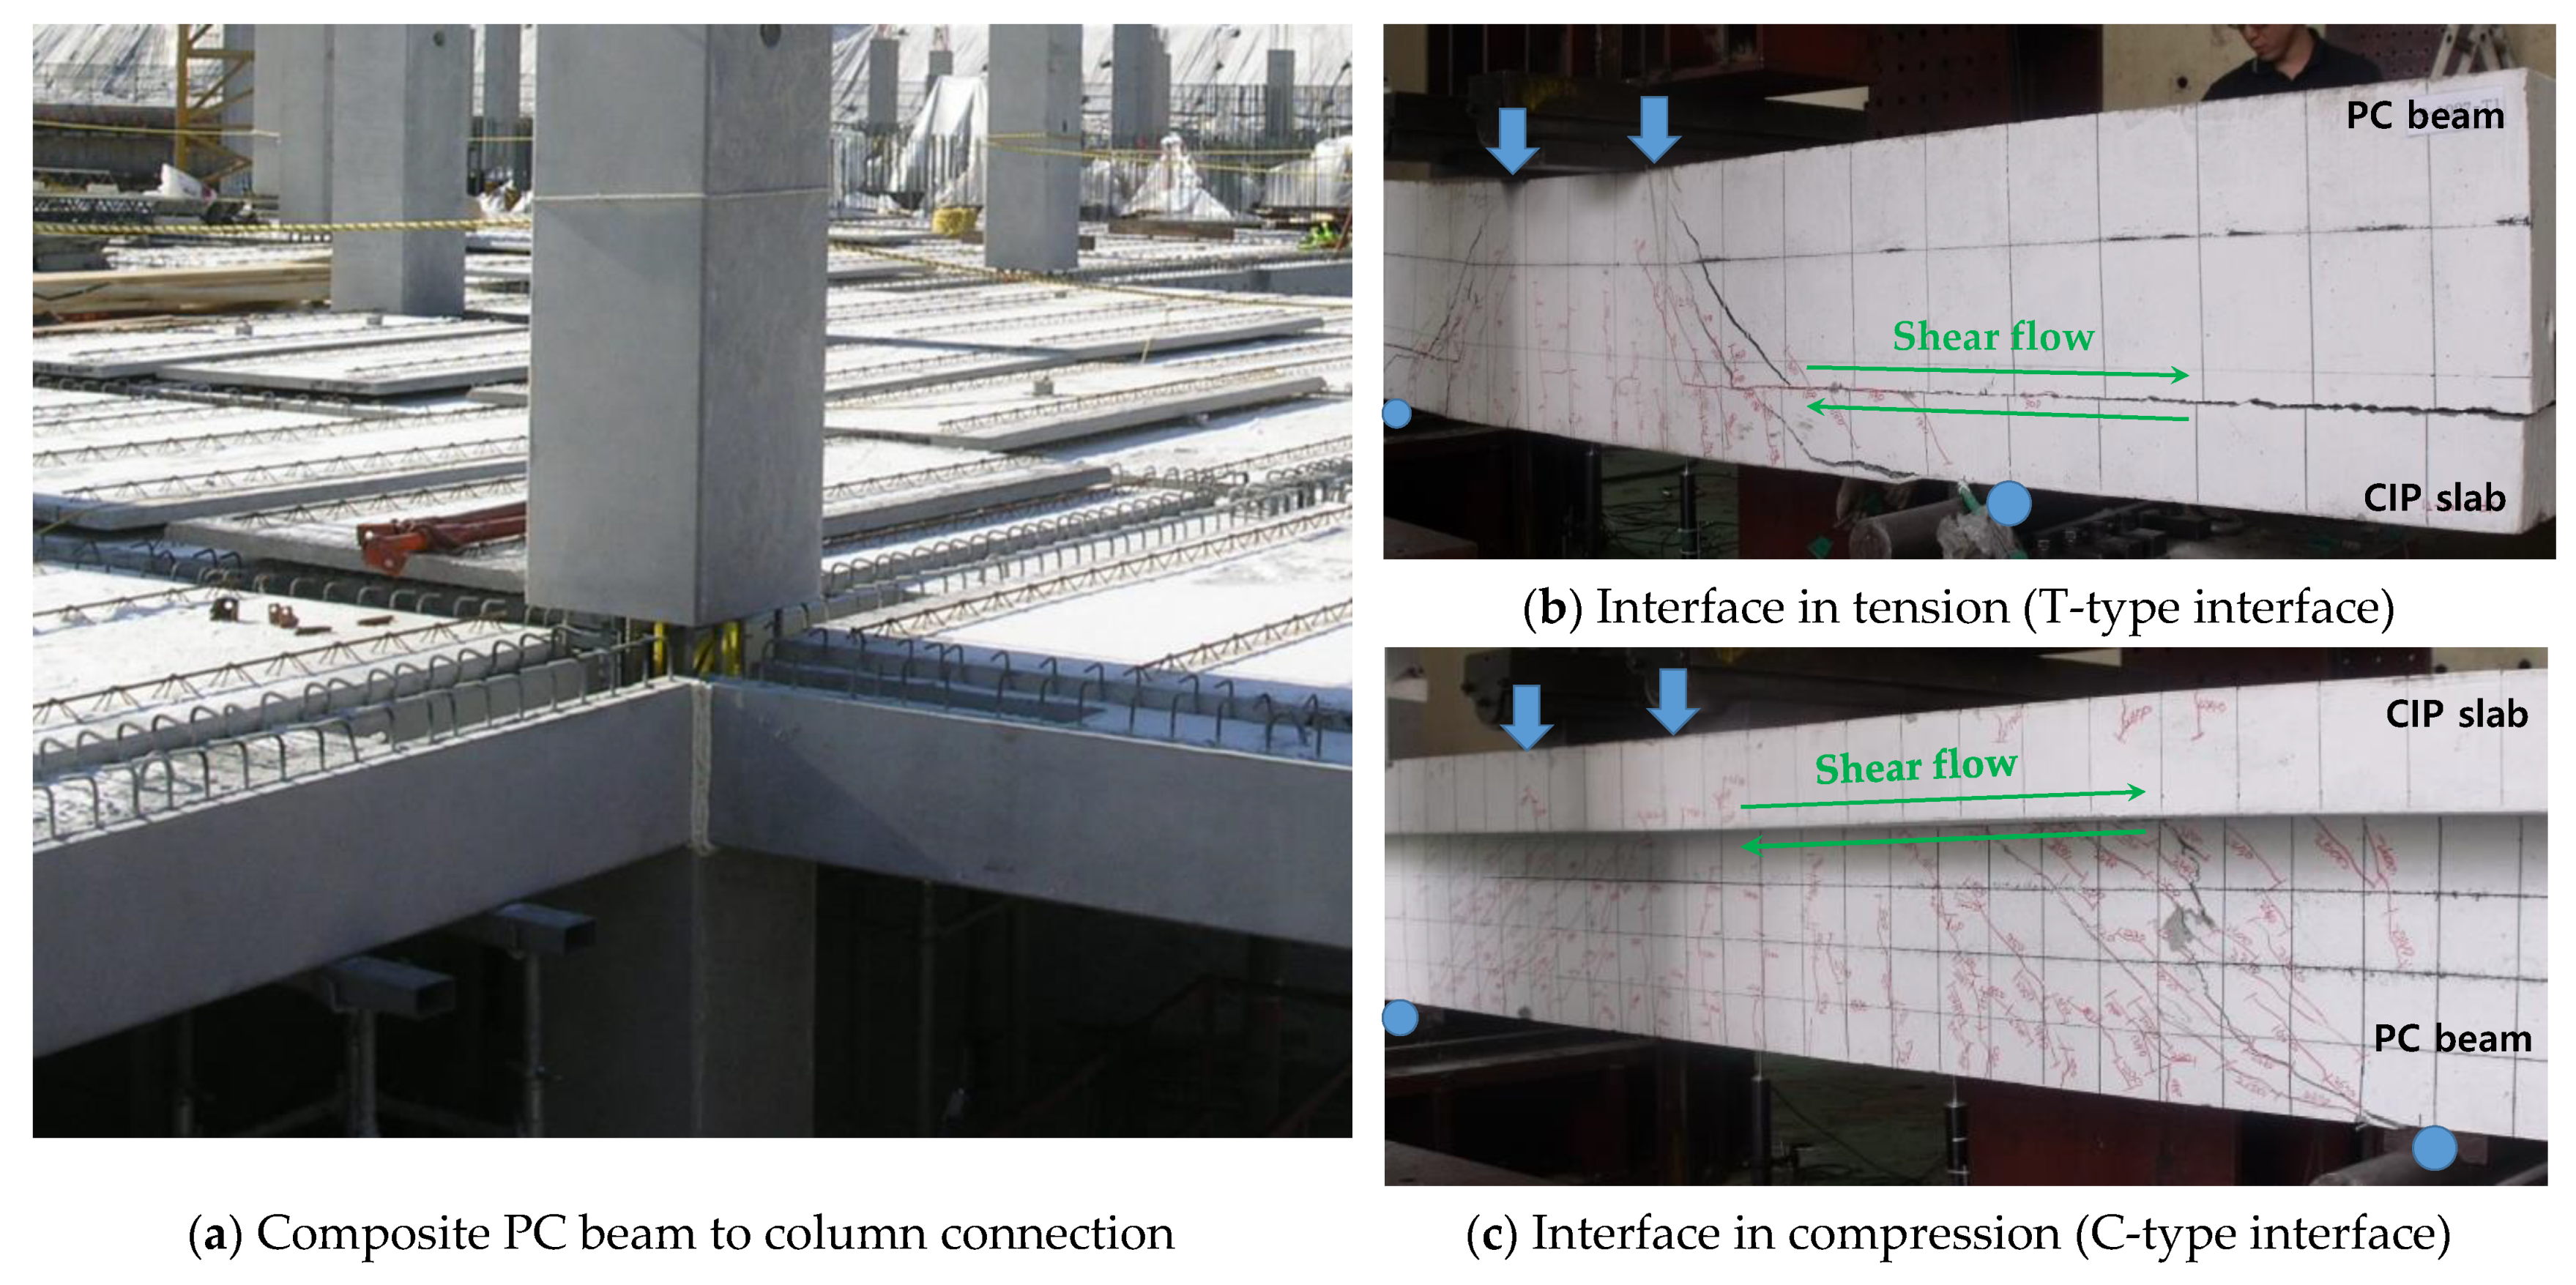
Figure 1. Interface location and principal stresses of the composite PC beams.
Applsci 11 04246 g001
Figure 2. Horizontal shear transfer length (lvh).
Applsci 11 04246 g002
Figure 3. Horizontal shear force (Fh) for the interface of a continuous composite beam.
Applsci 11 04246 g003
Figure 4. Crack patterns and failure modes.
Applsci 11 04246 g004
Figure 5. Normalized load versus deflection relationships.
Applsci 11 04246 g005
Figure 6. Comparison of observed and calculated interface shear strengths.
Applsci 11 04246 g006
Figure 7. Effect of concrete strength and clamping stress on horizontal shear strength for push-off test.
Applsci 11 04246 g007
Figure 8. Comparison of tested and calculated interface shear strength for push-off test.
Applsci 11 04246 g008aApplsci 11 04246 g008b
Figure 9. Tested-to-calculated shear strength ratios for beam tests with Case 1 category (roughened surface).
Applsci 11 04246 g009
Figure 10. Tested-to-calculated shear strength ratios for beam tests with Case 2 category (roughened surface).
Applsci 11 04246 g010
Figure 11. Tested-to-calculated shear strength ratios for beam tests with smooth surface.
Applsci 11 04246 g011
Figure 12. T-type interface with roughened surface for beam specimens.
Applsci 11 04246 g012
Figure 13. C-type interface for beam specimens with roughened surface.
Applsci 11 04246 g013
Table 1. Variables and test results of composite beam specimens in previous studies.
StageSpecimenInterfaced
(mm)
f′c (MPa)Tensile RebarShear ReinforcementNominal StrengthPmax
(kN)
Fh
(=Max/0.9d)
(kN)
vh
(MPa)
Failure
Mode
LocationSurfaceWidth (mm)PCCIPRebarfy
(MPa)
Rebarρvfy
(MPa)
2Vn
(kN)
2Mn/a
(kN)
Phase 1
study [24]
ITB-STT-typemedium38058043.233.910-D225412-D13@1500.008956828881998217024115.55Flexural Comp.
ITB-A1medium38062043.933.714-D225412-D10@1000.007551025282528194922884.60Interface shear
ITB-A2medium50084046.035.216-D25543D16@100
+D13@100
0.013428
519
60523568237431403.14Interface shear
Phase 2
study [25]
SF-1027T-typemedium40052048.534.512-D255439-D16@120
(double)
0.017142834352642177019864.55Interface shear
SF-685-Amedium56.632.511-D255436-D16@180
(double)
0.011442824902546191221455.11Interface shear
SF-685-Bmedium56.632.5171919284.59Interface shear
SF-291-Amedium46.133.77-D255434-D13@200
(double)
0.004851917931757174418844.49Interface shear
SF-291-Brough44.357.917841747186720174.81Flexural Comp.
SF-291-CKeyed49.746.918121773158417114.08Interface shear
Phase 3
study [26]
SF-6.82-T1T-typerough40052031.227.712-D255489-D16@120
(double)
0.017150338572304161218084.30Interface shear
SF-6.82-T2rough146516443.91Interface shear
SF-4.55-T1rough11-D255486-D16@180
(double)
0.011450327012189153717244.10Interface shear
SF-4.55-T2rough130414633.48Interface shear
SF-6.82-C1C-typerough40052036.222.412-D255489-D16@120
(double)
0.017150340802746341238289.11Flexural Comp.
SF-6.82-C2rough319135808.52Flexural Comp.
SF-4.55-C1rough11-D255486-D16@180
(double)
0.011450329232560274530797.33Flexural Comp.
SF-4.55-C2rough286132097.64Flexural Comp.
Table 2. Comparison of parameters and limitations in design codes.
CodeHorizontal Shear StrengthParameterInterface RoughnessLimitations
SmoothRough
ACI 318 [27] v n h = c + μ ρ v f y c (MPa)0.561.8 v n h 3.5   MPa
A v ( min ) or rough surface
μ -0.6
v n = μ   ρ v f y μ 0.61.0 v n K 1 f c
v n K 2
K 1 0.20.2
K 2 (MPa)5.5 3.3 + 0.08 f c
AASHTO LRFD [29] v n = c + μ ( ρ v f y + σ c ) c (MPa)0.521.65 v n K 1 f c
v n K 2
μ 0.61.0
K 1 0.20.25
K 2 (MPa)5.5210.34
PCI [28] v n = μ e   ρ v f y K 1 0.20.25 v n K 1 f c
v n K 2
K 2 (MPa)5.56.9
MC 2010 [30] τ u = τ c f c k 3 + μ ( σ n + k 1 ρ v f y )
+ k 2 ρ v f c d f y
τ c 00.1 τ u β v f c
μ 0.60.7
k 1 0.50.5
k 2 1.10.9
β v f c 6.1910.46
Table 3. List from experimental database by push-off tests.
InvestigatorQuantityInterface A c v
(mm2)
f c
for Weaker
(MPa)
ρ v f y
(MPa)
Hofbeck et al. [12]12Uncracked32,30026~311.5~9.2
Mattock et al. [20]6Uncracked32,30027~291.5~9.6
Hofbeck et al. [12]19Pre-cracked32,30016~301.5~9.2
Mattock et al. [20]6Pre-cracked32,30027~291.5~9.1
Kahn and Mitchell [13]4Rough92,92065~710.4~1.7
Shaw and Sneed [19]6Rough31,93034~526.4
Harries et al. [17]4Rough103,460~106,420402.0~3.1
Scott [16]3Rough247,740402.3
Zeno [15]4Rough103,480~106,450401.9~3.1
Mansur et al. [14]18Smooth35,93040~1061.8~9.3
Shaw and Sneed [19]3Smooth31,930526.4
Table 4. List from experimental database by beam tests.
InvestigatorQuantityInterface A c v
(mm2)
f c for Weaker
(MPa)
ρ v f y
(MPa)
LocationSurface
Saemann and Washa [4]32C-typeSmooth
Intermediated
Rough
Keyed
81,290
~121,935
17~340.2~3.2
Loov and Patnaik [5]16C-typeRough89,832
~359,328
20~480.4~7.7
Kahn and Slapkus [7]6C-typeRough152,90350~781.0~2.1
Patnaik [6]24C-typeSmooth90,000
~225,000
17~350.3~3.6
Moon and Oh [24]3T-typeIntermediated440,800
~1,000,000
333.8~6.0
Moon and Oh [25]6T-typeIntermediated
Rough
Keyed
420,00033~472.1~7.3
Oh et al. [26]8T-type
C-type
Rough420,00022~285.7~8.6
Table 5. Statistical analysis between design provisions and database of push-off tests.
InterfaceStatisticsExperimental-to-Nominal Shear Strength Ratio
ACIPCIAASHTOMC 2010
Total
specimens
Average1.881.381.491.80
Maximum5.712.573.823.59
Minimum1.110.890.901.06
STD0.830.340.670.46
COV (%)43.924.345.125.6
Uncracked
interface
Average1.651.301.181.47
Maximum2.171.551.401.86
Minimum1.361.130.981.19
STD0.210.120.130.19
COV (%)12.49.011.213.1
Pre-cracked
interface
Average1.511.221.181.79
Maximum1.941.551.552.55
Minimum1.160.970.921.26
STD0.200.160.170.35
COV (%)13.613.114.219.6
Rough
interface
Average1.461.261.191.56
Maximum2.241.841.881.92
Minimum1.110.890.901.06
STD0.280.280.280.20
COV (%)19.322.023.912.8
Smooth
interface
Average2.951.762.442.35
Maximum5.712.573.823.59
Minimum1.151.120.921.72
STD1.050.380.720.44
COV (%)35.621.829.618.9
Table 6. Statistical analysis between design provisions and database from beam specimens.
InterfaceStatisticsExperimental-to-Nominal Shear Strength Ratio
ACIPCIAASHTOMC 2010
All beam specimensAverage2.301.541.773.42
Maximum7.153.915.2416.64
Minimum0.530.490.410.67
STD0.190.720.822.80
COV (%)52.046.646.381.8
Case 1:
Horizontal shear
transfer
( ρ v f y 54 f r i c t i o n o a f a c e R   S < 3.5 MPa)
Average1.901.871.712.85
Maximum2.983.912.966.19
Minimum0.840.810.781.40
STD0.560.800.591.26
COV (%)29.442.734.744.2
Case 2:
Shear friction
( ρ v f y 54 f r i c t i o n o a f a c e R   S > 3.5 MPa)
Average1.221.020.931.35
Maximum2.031.631.631.99
Minimum0.530.490.410.67
STD0.480.390.380.47
COV (%)39.437.940.734.8
Interface with smooth surfaceAverage4.861.382.325.31
Maximum16.383.085.2416.64
Minimum2.090.821.432.38
STD3.430.500.853.77
COV (%)70.536.136.471.0
Table 7. Statistical analysis of design provisions depending on the interface location.
InterfaceStatisticsExperimental-to-Nominal Shear Strength Ratio
ACIPCIAASHTOMC 2010
T-type with rough surfaceAverage0.990.810.771.15
Maximum1.581.271.291.89
Minimum0.530.490.410.67
STD0.340.250.280.40
COV (%)34.031.136.534.6
C-type with rough surfaceAverage1.891.841.672.75
Maximum2.983.912.966.19
Minimum0.840.810.781.56
STD0.530.760.571.23
COV (%)28.141.434.344.8
Publisher’s Note: MDPI stays neutral with regard to jurisdictional claims in published maps and institutional affiliations.