Abstract
Identification of bacteria by mass spectrometry offers the potential of a high-throughput non-targeted method to determine the presence of Salmonella. While MALDI-TOF mass spectrometry can identify Salmonella at the genus and species level, few studies have reported subtyping beyond the species level due to the diversity and complexity of Salmonella that includes more than 2600 serovars. Liquid chromatography-tandem mass spectrometry (LC-MS/MS) approaches enable profiling of a greater number of proteins over a larger dynamic range and offer the potential to detect small differences between closely related isolates. We evaluate the discriminatory power of bottom-up LC-MS/MS with a collection of nineteen isolates that differ at the genus, species, subspecies, or strain level. Isolates were classified by matching the sequence of identified peptides to reference proteomes translated from genomes with known taxonomic ranks. The degree of proteomic similarity between the tested isolates and reference strains correlated with how closely they were related. All tested Salmonella isolates were easily distinguished from their close relatives, E. coli and Shigella, and readily grouped by species and subspecies. Additionally, each Salmonella isolate most closely matched to its correct serovar. This approach presents a simple and effective proteomic approach to identification of Salmonella genus, species, and subspecies.
1. Introduction
Despite decades of efforts to control Salmonella contamination, this pathogen remains the most common foodborne bacteria in the U.S. [1]. Each year more than one million human Salmonella infections occur in the United States, with non-typhoidal Salmonella alone accounting for more than three billion dollars in medical expenses [2,3]. Subtyping of Salmonella, i.e., identification beyond the species level, is essential for tracking and control of this pathogen and provides information regarding potential pathogenicity and antibiotic resistance. However, full characterization of a Salmonella isolate for rapid outbreak response is challenging due to its tremendous complexity and diversity, with more than 2600 serovars identified. In fact, new serotypes continue to be discovered all the time [4]. While polymerase chain reaction (PCR) methods have become common, they rely on the pre-selection of a set of markers [5]. Whole genome sequencing (WGS) has emerged as a typing tool for foodborne pathogens, including Salmonella [6,7]. However, it is not yet adopted for routine use in most diagnostic laboratories [7,8].
Mass spectrometry (MS) provides a complementary means for identification of bacteria. Two common approaches have been recognized: (1) biomarkers (targeted methods) [9,10,11] and (2) spectral profiles (non-targeted methods) [12,13]. Biomarker-based approaches rely on selection and detection of a number of characteristic peptides or proteins that are predictive of a pathogen. In the case of Salmonella, due to high sequence homology below the species level, identification of markers is challenging [11,14]. For example, an analysis of 4893 Salmonella enterica genomes revealed that genomic markers for identification of Salmonella enterica subsp. enterica were few, and no genomic regions were useful for definitive identification of a Salmonella serovar [14]. An informatics pipeline recently developed by our group for selection of Salmonella taxon markers based on shotgun proteomics and BLAST searches also suggested a lack of representative subspecies and serovar peptide markers. Multistep classification with multiple peptide sequences was required to define subspecies and serovar specificity [11]. Nontargeted approaches, on the other hand, provide a global view of overall analyte content, serving as a mass fingerprint used for comparison of multiple features with existing databases generated by reference strains to aid identification [12]. Among these approaches, whole-cell matrix-assisted laser desorption/ionization time-of-flight (MALDI-TOF) MS has been used extensively and approved by the U.S. Food and Drug Administration for bacterial identification for clinical use. This approach is, however, largely focused on discrimination at the genus and species level due to a limited number of detectable peaks, typically a few dozen peaks per profile [15,16]. Consequently, whole-cell MALDI-TOF MS has not been effective for routine subtyping of Salmonella [17,18], although a few studies have reported identification of a limited number of subspecies and serovars with advanced statistical analyses [17,19,20,21].
Advances in MS hardware and the combination with liquid chromatography (LC) have made deep proteome analysis possible, and thousands of proteins are typically identified in a single experiment. This facilitates the detection of a large portion of a bacterial proteome, offering greater opportunities to discover small differences expressed by closely related bacteria [11,16,22,23,24,25,26,27,28,29]. Several groups proposed the use of LC-MS/MS for classification/identification of bacteria by matching tryptic peptides derived from bacterial proteins against a set of reference genomes or translated proteomes. In most cases, the number of matching peptides per genome was compared [22,23]. In some cases, data analyses were further modified to include the number of unique tryptic peptides to aid identification [22,23,24,25]. A pipeline that further computed accurate statistical significance was proposed to assign the microorganism(s) [28,29].
The degree to which MS can distinguish strains within a given type of bacteria depends on the degree of divergence within a given genera, e.g., some bacteria are remarkably different genetically even beyond the species level while others are nearly indistinguishable [15]. Salmonella is extremely complex and therefore is often overlooked when it comes to MS-based subtyping. The aim of this study is to address how well proteomics can subtype Salmonella as well as differentiate this pathogen from its close relatives E. coli and Shigella. Here, a collection of nineteen isolates encompassing a wide range of taxonomic ranks were analyzed by LC-MS/MS. This consists of three genera (Salmonella, Escherichia, and Shigella), two species (Salmonella enterica and Salmonella bongori), two subspecies (Salmonella enterica subsp. enterica and Salmonella enterica subsp. arizonae), six serovars (S. typhimurium, S. saintpaul , S. heidelberg, S. paratyphi B, S. muenchen, and S. enteritidis), and multiple strains of S. typhimurium, S. saintpaul, S. heidelberg, and S. enteritidis. This range of phylogenetic diversity provides a realistic assessment of the discriminatory power of proteomics and mass spectrometry for Salmonella. The performance and related findings will be discussed.
2. Materials and Methods
2.1. Selection of Bacterial Isolates
Bacterial isolates were obtained from the stock culture collection at the Food and Drug Administration/Center for Food Safety and Applied Nutrition. Salmonella reference collection A (SARA), the so-called “Typhimurium complex” representing Salmonella Typhimurium and its closest serovars, was selected to challenge the method [30]. This covers Salmonella Typhimurium (str. SARA2, SARA18, and SARA19), Salmonella Saintpaul (str. SARA23 and SARA24), Salmonella Heidelberg (str. SARA31, SARA36, and SARA39), Salmonella Paratyphi B (str. SARA50), and Salmonella Muenchen (str. SARA63). Salmonella Enteritidis (str. SE8a and SE22) was included due to its high prevalence. Strains of a different subspecies (Salmonella enterica subsp. arizonae str. SARC5 and SARC6) and a different species (Salmonella bongori str. SARC12) were also included to test the discriminatory power of the method. Escherichia coli (O157:H7 and str. K-12) and Shigella (S. sonnei str. Ss64 and S. flexneri str. 2457M) were selected due to their close relatedness to Salmonella and their known difficulty of differentiation from each other. The isolates and taxonomic positions are summarized in Figure 1.
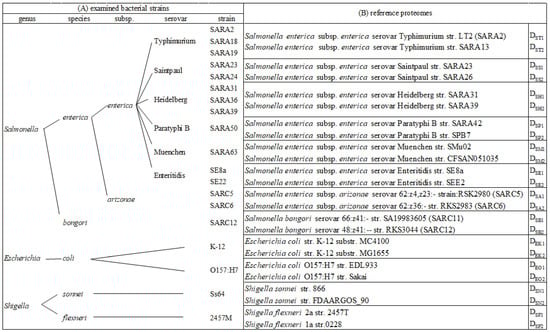
Figure 1.
(A) Bacterial strains examined by proteomic analysis and (B) selected reference proteomes from proteome database used for peptide alignment and bacterial identification.
2.2. Sample Preparation
Bacterial culture, lysis, and proteolytic digestion were prepared as previously described [11]. Briefly, each pure culture was grown overnight on trypticase soy agar (TSA), harvested, and lysed by pressure cycling (Barocycler NEP 3229, Pressure BioSciences, Easton, MA, USA). The cell lysate was then reduced, alkylated, and digested with trypsin (trypsin gold; Promega, Madison, WI, USA) overnight. Each bacterium was prepared as two biological sample preparation replicates.
2.3. Liquid Chromatography
A nanoACQUITY UPLC system (Waters Corp, Milford, MA) was coupled with the mass spectrometers stated below to perform LC-MS/MS measurements, using the method described previously [11]. Briefly, 100 ng of Salmonella digest was first captured on a trap column (180 μm × 20 mm, 5 μm, 100 Å, M-class Symmetry C18; Waters Corp., Milford, MA, USA) and then separated on an analytical column (100 μm × 100 mm, 130 Å, 1.7 μm, M-class Peptide BEH column; Waters Corp., Milford, MA, USA) at a flow rate of 300 nL/min at 40 °C with the gradient: 0 min, 3% solvent B; 0–120 min, 3–40% solvent B; 120–121 min, 40–85% solvent B; 121–125 min, 85% solvent B; 125–126 min, 85–3% solvent B; 126–140 min, 3% solvent B; solvent A: water with 0.1% formic acid, solvent B: acetonitrile with 0.1% formic acid.
2.4. Mass Spectrometry
An Orbitrap Elite mass spectrometer (Thermo Scientific) was used to collect data for str. SARA2, SARA18, SARA19, SARA24, SARA39, SARA50, SARA63, SE8a, SE22, SARC12, K-12, O157:H7, Ss64, 2457M, and the remaining strains (str. SARA23, SARA31, SARA36, SARC5, and SARC6) were analyzed by an Orbitrap Fusion Lumos Tribrid mass spectrometer (Thermo Scientific, San Jose, CA, USA) due to a system upgrade. Data acquisition in the Orbitrap Elite used the method previously reported [11]. In brief, full scans were acquired in the Orbitrap with 30 k resolution, an automatic gain control (AGC) of 5 × 10⁵ ions, and a maximum injection time of 100 ms. The 15 most intense ions were selected for fragmentation in the linear ion trap by collision-induced dissociation (CID). Fragment ion spectra were acquired in the linear ion trap with an AGC of 1 × 10⁴ ions and a maximum injection time of 50 ms. For data collected in the Orbitrap Fusion Lumos, the full scans were acquired in the Orbitrap with 120 k resolution. Data-dependent acquisition was performed in the linear ion trap with top-speed mode of a cycle time of 3 s to maximize the number of MS/MS scans. AGC targets were set to 2 × 10⁵ ions for MS scans and 1 × 10⁴ ions for MS/MS scans. The maximum injection time was set at 50 ms for MS scans and 35 ms for MS/MS scans. Each biological sample preparation was analyzed in three technical replicates, resulting in a total of six replicates for each bacterium.
2.5. Databases
For peptide identification using the MASCOT search engine (Matrix Science, Boston, MA, USA), a custom protein sequence database was used composed of all non-redundant Salmonella protein sequences from the National Center for Biotechnology Information (NCBI) Reference Sequence (RefSeq) database (927,496 protein entries) as well as protein sequences from other major foodborne bacteria [31] (two translated proteomes per bacterium, see Table S1) and common laboratory protein contaminants [32], resulting in a total of 1,036,046 protein entries.
For scripted peptide alignment and subsequent bacterial classification, a smaller database comprised of 56 translated proteomes was used, including two for each Salmonella serovar studied here (Figure 1B) and two from each major foodborne bacteria (detailed information for all reference proteomes is provided in Table S1). Preference was given to complete genome assemblies. The translated proteomes were downloaded from the NCBI in May 2019.
2.6. Database Search and Criteria for Peptide Identifications
Initial peptide identification by a database search and subsequent processing follows the previously described workflow [11]. In brief, tandem mass spectra were searched against the larger protein sequence database described above using the MASCOT search engine (Matrix Science, Boston, MA, USA), with a precursor ion mass tolerance of 50 ppm for data collected in Orbitrap Elite and 10 ppm for Orbitrap Lumos. Fragment ion mass tolerance was set as 0.8 Da. Trypsin was selected as the digestion enzyme with up to two miscleavages. Carbamidomethylation of cysteine residues was set as a fixed modification and oxidation of methionine residues was set as a variable modification. Data from each set of six replicate injections were merged using MassSieve v 1.13 to create a single list of peptide identifications for each isolate [33]. Peptide identifications were accepted with an ion score equal to or greater than the identity score threshold (p ≥ 0.05). Indeterminate peptide identifications were removed. Peptides from proteins with less than two identified peptides were discarded.
2.7. Peptide Alignment to Reference Proteomes
For each tested isolate, a custom Python script was used to read the sequence of each peptide identified by LC-MS/MS and screen through all protein records in each individual reference proteome for matched sequences and return the number of reference proteomes that contain each peptide (the number of matches) (Figure 2). Only matches with 100% sequence identity and coverage were accepted. The degree of proteome similarity between the tested isolate and each reference proteome, defined as the proportion of MS-identified peptides that matched the reference proteome, was calculated and represented by a heatmap.
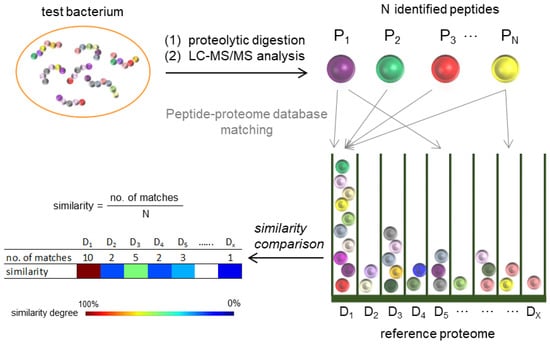
Figure 2.
Schematic representation of bacterial classification by a proteomic approach.
3. Results and Discussion
The Salmonella genus is comprised of two species, six subspecies, and more than 2600 serovars. The large number of highly homologous serovars makes subtyping a challenge. For example, genomic analysis of the reference Salmonella strains listed in Figure 1B shows an average nucleotide identity (ANI; based on BLAST) [34] of >99% for strains within the same serovar, 99% for serovars within the same subspecies, 93% for subspecies within the same species, and 89% for species within the genus. A larger variation was observed when compared to a different genus; 80% ANI between Salmonella and E. coli and Shigella and 66% when compared to other common foodborne bacteria listed in Table S1. Clearly, a sensitive method is required to distinguish between highly related Salmonella isolates, especially for those below the species level.
Here, we evaluate the feasibility and effectiveness of bottom-up proteomics for Salmonella subtyping. Briefly, a tested isolate is lysed, proteolytically digested, analyzed by LC-MS/MS, and classified based on the comparison of experimentally identified peptide sequences to reference proteomes translated from genomes with known taxonomic ranks (Figure 1). The results for S. Typhimurium str. SARA2 are shown in Figure 3. Of the 6767 peptides that were identified by LC-MS/MS, 6571 peptides matched to the correct reference proteome S. Typhimurium SARA2 (DST1). The small difference between the two numbers, 196 peptides, is likely due to incomplete or incorrect genome annotation or, to a lesser extent, false positive peptide identifications. A slightly lower number of identified peptides match to the reference proteomes from different S. Typhimurium strains (DST2, str. SARA13, 6430 matches), due in part to the presence of a plasmid in the SARA2 strain. Fewer of the peptides identified in S. Typhimurium str. SARA2 were present in reference proteomes from other S. enterica subsp. enterica serovars (5900–6400 matches for DSS, DSH, DSP, DSM, and DSE). The presence of S. Typhimurium peptides decreased markedly when the taxonomic difference of the reference proteome was more pronounced: approximately 5000 and 4800 peptides were common to different subspecies (DSA) and different species (DSB), respectively. Only approximately 3200 S. Typhimurium peptide matches were found in the reference proteomes used for E. coli. and Shigella. The number dropped to <2400 when a strain from other common foodborne bacteria was compared. As shown in Figure 3, most S. Typhimurium peptides are found in the reference proteomes of serovars from the same subspecies and the number of matches decreased as the taxonomic distance increased.
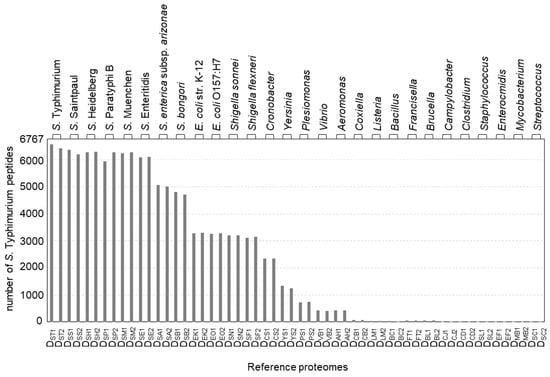
Figure 3.
The number of peptides identified in the S. typhimurium SARA2 isolate present in each reference proteome. See Table S1 for the detailed reference proteome information.
Figure 4 displays a heatmap of the degree of similarity between each of the 19 isolates and the 24 reference proteomes, with red representing the highest degree of similarity and blue the lowest (detailed data are provided in Table S2). Each row in Figure 4 represents a tested isolate with each column representing its degree of similarity to a reference strain. Taking the S. typhimurium str. SARA2 data in Figure 3 as an example in the top row: a similarity degree of 97% is shown to the database DST1. Rows 2 to 15 are fourteen other Salmonella isolates of various taxa. A similar trend was observed with the closest match to the correct serovar: SARA18: DST1, SARA19: DST1, SARA23: DSS1, SARA24: DSS1, SARA31: DSH1, SARA36: DSH2, SARA39: DSH2, SARA50: DSP2, SARA63: DSM2, SE8a: DSE1, SE22: DSE2, SARC5: DSA1, SARC6: DSA2, and SARC12: DSB2. The data showed that all tested Salmonella isolates were correctly identified at the serovar level. Further, for isolates that have been sequenced and annotated (SARA2, SARA23, SARA31, SARA39, SE8a, SARC5, SARC6, and SARC12), the highest match was the correct strain, suggesting that our approach can detect strain-level differences.
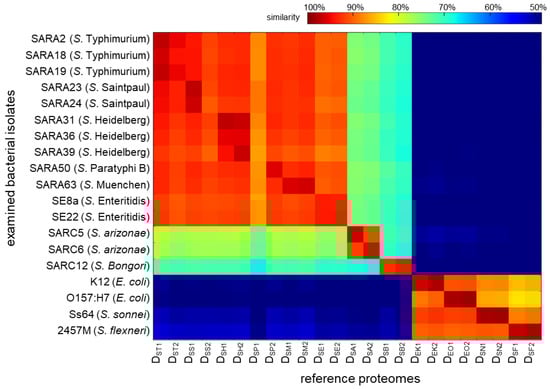
Figure 4.
Heatmap representing the degree of similarity in sequences between proteomic data and reference proteomes, with the similarity decreasing from red (100%) to blue (48%). The match to other foodborne bacteria is less than 40% and not shown here. The detailed data are provided in Table S2.
In addition to identification, the degree of similarity between the tested isolates and the reference proteomes was shown to correlate with taxonomic relatedness, viz. the degree of similarity decreases as the taxonomic distance increases. Given the small serovar-to-serovar genomic variation (99% ANI), it is expected that the degree of similarity to the correct reference strain is only marginally better than from another strain of the same serovar or a strain from a closely related serovar (Figure 4). In contrast, isolates are clearly distinguished from reference proteomes at further taxonomic positions, e.g., different subspecies, species, and genera, on the right-hand side of the heatmap.
Interestingly, reference proteomes DSS2 and DSP1 do not appear to be suitable surrogate databases for their serovars. Although DSS1 was the best match for SARA23, the other reference proteome of S. Saintpaul, DSS2, was the ninth in rank (DSS1 > DST1 > DST2 > DSH2 > DSP2 > DSM2 > DSH1 > DSM1 > DSS2, row 4, Figure 4). It has been shown that gene contents can sometimes differ more within a serovar than between serovars [35]. For example, the degree of genome homology between S. Saintpaul SARA23 and SARA29 was shown to be relatively low [36]. DSS2 is translated from the genome of S. saintpaul SARA26 and is likely less representative of SARA23 than expected. Notably, reference proteome DSP1 (derived from S. Paratyphi B SARA42) is surprisingly dissimilar to all 12 of the S. enterica subsp. enterica isolates and was an outlier across all 19 isolates shown on the heatmap (column 7, Figure 4). This is likely due to a poorly annotated or poorly sequenced genome and suggests that visualization of the similarity of peptide identifications to a reference proteome can be used to assess the quality of a genomic assembly.
Figure 5 summarizes the degree of proteome similarity of the fifteen tested Salmonella isolates to the reference proteomes. An average of 96 ± 1.3% similarity was observed for a Salmonella isolate to its strain-specific reference proteome, 94 ± 2.4% to different strains within the same serovar, and 92 ± 1.8% to different serovars with the same subspecies. While the overall trend suggests that a reference proteome at a closer taxonomic position yields a higher degree of similarity, finding a clear threshold score to define the taxonomic relationship to a specific Salmonella serovar might not be possible. For example, a degree of similarity of 94% could be the correct strain, a different strain of the same serovar, or a different serovar of the same subspecies. The data are consistent with the high degree of sequence homology between serovars, and similarly presents a challenge for conventional Salmonella subtyping tools such as pulsed-field gel electrophoresis (PFGE) and PCR. In contrast, there was a pronounced difference when compared to reference strains from a different subspecies or species: an average of 75 ± 1.7% and 70 ± 1.2% similarity when compared to different Salmonella subspecies and different species, respectively. The genus-level difference was even more significant: 48 ± 1.1% to E. coli and Shigella and 5.1 ± 9.2% to other common foodborne bacteria. While more isolates would be required to establish a statistical cut-off, this method is able to provide a rapid assessment of Salmonella genus, species, and subspecies and can provide an estimate of similarity to a set of serovars for previously unsequenced isolates.
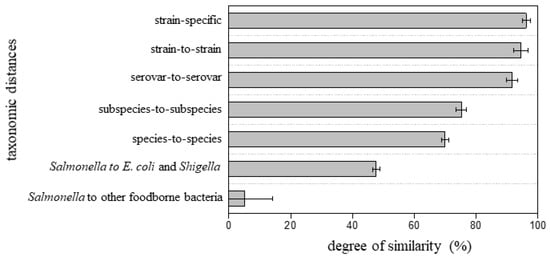
Figure 5.
Degree of similarity of the fifteen Salmonella isolates to reference proteomes with various taxonomic distances.
Two other foodborne bacteria, E. coli and Shigella, were also evaluated. They are closely related to Salmonella and all three pathogens belong to the family Enterobacteriaceae. While food safety methods require the ability to distinguish between all three genera, it can be a challenge to differentiate Shigella from E. coli. These two genera were historically considered as the same species because they share many common biochemical characteristics and are indistinguishable phylogenetically based on DNA homology by 16S ribosomal gene sequencing [37]. Indeed, the average ANI of the eight E. coli/Shigella reference strains included in the database used in this work (Figure 1B) is 98 ± 0.9%, comparable to the number obtained within E. coli (98 ± 1.2%) and Shigella (99 ± 0.8%). Similar to Salmonella subtyping, E. coli and Shigella cannot be reliably differentiated by conventional MALDI-TOF MS analyses due to this high sequence homology [38]. Two isolates each of E. coli and Shigella were analyzed and the results were shown in the bottom 4 rows of Figure 3. The data clearly showed that E. coli and Shigella were closely related but quite distinct from Salmonella, i.e., the E. coli and Shigella isolates showed > 82% similarity to each other but <53% to the reference Salmonella strains. Specifically, the tested E. coli isolates showed an average of 98 ± 1.0% similarity to reference proteomes of the correct serotype, 90 ± 1.0% to E. coli proteomes of a different serotype, 86 ± 1.8% to Shigella, 48 ± 1.0% to Salmonella, and 5.1 ± 9.2% to other foodborne bacteria. Similarly, the Shigella isolates showed an average of 98 ± 0.6% to reference proteomes of the correct species, 90 ± 1.1% to a different species of Shigella, 91 ± 1.1% to E. coli, 51 ± 1.1% to Salmonella, and 5.6 ± 9.9% to other foodborne bacteria. Again, the percent similarity correlated to their taxonomic relatedness and the best matches were to the correct bacteria to the species level, demonstrating our approach is capable of typing bacteria that are otherwise difficult to differentiate.
4. Conclusions
The inherent complexity and diversity of Salmonella create a significant challenge to subtype this pathogen within a diagnostically reasonable time frame. Here, we take advantage of publicly available genomic data to create a reference proteome database that contains protein sequences from a set of reference strains with known taxonomic ranks for Salmonella identification and subtyping based on the percentage of proteolytic peptides identified by LC-MS/MS that are found in each reference proteome. The data showed the percentage of identified peptides that match to a given reference proteome can provide a useful tool for identification of the Salmonella genus, species, and subspecies and an approximation of serovar identity. While the correct serovar and even strain was identified for each tested Salmonella isolate, the approach is most confident for subspecies-level identification or above. This method requires no predetermined selection of markers and thus provides greater flexibility for isolates that have not been previously sequenced. This approach can provide deep taxonomic information for a Salmonella isolate within less than three days, which can provide useful guidance in outbreak response.
Supplementary Materials
The following are available online at https://www.mdpi.com/article/10.3390/app11094264/s1, Table S1: Reference proteomes for bacterial assignment, Table S2: Total number of peptides identified by LC-MS/MS and their matches to each reference proteome.
Author Contributions
Conceptualization, S.-H.C. and M.A.M.; Methodology, S.-H.C. and M.A.M.; Software, S.-H.C. and M.A.M.; Validation, S.-H.C. and M.A.M.; Formal Analysis, S.-H.C.; Investigation, S.-H.C.; Resources, T.R.C.; Data Curation, S.-H.C. and M.A.M.; writing—original draft preparation, S.-H.C.; writing—review and editing, M.A.M., C.H.P., and T.R.C.; Visualization, S.-H.C.; Supervision, M.A.M. and T.R.C.; Project Administration, T.R.C.; Funding Acquisition, T.R.C. All authors have read and agreed to the published version of the manuscript.
Funding
This research was funded by the U.S. Food and Drug Administration through a position for S.-H.C. at the Joint Institute for Food Safety and Applied Nutrition (JIFSAN) at the University of Maryland.
Institutional Review Board Statement
Not applicable.
Informed Consent Statement
Not applicable.
Acknowledgments
The authors thank Hsueh-Ying Chen for informatics consultation, Ruth Timme for bacterial genome consultation, and Dwayne Roberson, Rebecca Bell, Christina Ferreira, Rachel Binet, and Jie Zheng for providing isolates.
Conflicts of Interest
The authors declare no conflict of interest.
References
- CDC Foodborne Germs and Illnesses Home Page. Available online: https://www.cdc.gov/foodsafety/foodborne-germs.html (accessed on 3 December 2020).
- USDA Cost Estimates of Foodborne Illnesses Home Page. Available online: https://ww.ers.usda.gov/data-products/cost-estimates-of-foodborne-illnesses/ (accessed on 3 December 2020).
- CDC Salmonella Home Page. Available online: https://www.cdc.gov/salmonella/index.html (accessed on 3 December 2020).
- Food Safety News: Managing for Salmonella in 2015 Continues to Present Challenges. Available online: https://www.foodsafetynews.com/2015/06/managing-for-salmonella-in-2015/ (accessed on 5 June 2015).
- Ricke, S.C.; Kim, S.A.; Shi, Z.; Park, S.H. Molecular-based identification and detection of Salmonella in food production systems: Current perspectives. J. Appl. Microbiol. 2018, 125, 313–327. [Google Scholar] [CrossRef]
- Bell, R.L.; Jarvis, K.G.; Ottesen, A.R.; McFarland, M.A.; Brown, E.W. Recent and emerging innovations in Salmonella detection: A food and environmental perspective. Microb. Biotechnol. 2016, 9, 279–292. [Google Scholar] [CrossRef]
- Yoshida, C.; Gurnik, S.; Ahmad, A.; Blimkie, T.; Murphy, S.A.; Kropinski, A.M.; Nash, J.H. Evaluation of Molecular Methods for Identification of Salmonella Serovars. J. Clin. Microbiol. 2016, 54, 1992–1998. [Google Scholar] [CrossRef] [PubMed]
- Lüth, S.; Kleta, S.; Al Dahouk, S. Whole genome sequencing as a typing tool for foodborne pathogens like Listeria monocytogenes—The way towards global harmonisation and data exchange. Trends Food Sci. Technol. 2018, 73, 67–75. [Google Scholar] [CrossRef]
- Hu, A.; Chen, C.T.; Tsai, P.J.; Ho, Y.P. Using capillary electrophoresis-selective tandem mass spectrometry to identify pathogens in clinical samples. Anal. Chem. 2006, 78, 5124–5133. [Google Scholar] [CrossRef] [PubMed]
- Kooken, J.; Fox, K.; Fox, A.; Wunschel, D. Assessment of marker proteins identified in whole cell extracts for bacterial speciation using liquid chromatography electrospray ionization tandem mass spectrometry. Mol. Cell. Probes 2014, 28, 34–40. [Google Scholar] [CrossRef]
- Chen, S.H.; Parker, C.H.; Croley, T.R.; McFarland, M.A. Identification of Salmonella Taxon-Specific Peptide Markers to the Serovar Level by Mass Spectrometry. Anal. Chem. 2019, 91, 4388–4395. [Google Scholar] [CrossRef] [PubMed]
- Sauer, S.; Kliem, M. Mass spectrometry tools for the classification and identification of bacteria. Nat. Rev. Microbiol. 2010, 8, 74–82. [Google Scholar] [CrossRef]
- McFarland, M.A.; Andrzejewski, D.; Musser, S.M.; Callahan, J.H. Platform for identification of Salmonella serovar differentiating bacterial proteins by top-down mass spectrometry: S. Typhimurium vs. S. Heidelberg. Anal. Chem. 2014, 86, 6879–6886. [Google Scholar] [CrossRef]
- Laing, C.R.; Whiteside, M.D.; Gannon, V.P.J. Pan-genome Analyses of the Species Salmonella enterica, and Identification of Genomic Markers Predictive for Species, Subspecies, and Serovar. Front. Microbiol. 2017, 8, 1345. [Google Scholar] [CrossRef] [PubMed]
- Sandrin, T.R.; Goldstein, J.E.; Schumaker, S. MALDI TOF MS profiling of bacteria at the strain level: A review. Mass Spectrom. Rev. 2013, 32, 188–217. [Google Scholar] [CrossRef]
- Gekenidis, M.T.; Studer, P.; Wuthrich, S.; Brunisholz, R.; Drissner, D. Beyond the matrix-assisted laser desorption ionization (MALDI) biotyping workflow: In search of microorganism-specific tryptic peptides enabling discrimination of subspecies. Appl. Environ. Microbiol. 2014, 80, 4234–4241. [Google Scholar] [CrossRef]
- Martiny, D.; Busson, L.; Wybo, I.; El Haj, R.A.; Dediste, A.; Vandenberg, O. Comparison of the Microflex LT and Vitek MS systems for routine identification of bacteria by matrix-assisted laser desorption ionization-time of flight mass spectrometry. J. Clin. Microbiol. 2012, 50, 1313–1325. [Google Scholar] [CrossRef]
- Kang, L.; Li, N.; Li, P.; Zhou, Y.; Gao, S.; Gao, H.; Xin, W.; Wang, J. MALDI-TOF mass spectrometry provides high accuracy in identification of Salmonella at species level but is limited to type or subtype Salmonella serovars. Eur. J. Mass Spectrom. (Chichester) 2017, 23, 70–82. [Google Scholar] [CrossRef]
- Kuhns, M.; Zautner, A.E.; Rabsch, W.; Zimmermann, O.; Weig, M.; Bader, O.; Gross, U. Rapid discrimination of Salmonella enterica serovar Typhi from other serovars by MALDI-TOF mass spectrometry. PLoS ONE 2012, 7, e40004. [Google Scholar] [CrossRef]
- Dieckmann, R.; Helmuth, R.; Erhard, M.; Malorny, B. Rapid classification and identification of salmonellae at the species and subspecies levels by whole-cell matrix-assisted laser desorption ionization-time of flight mass spectrometry. Appl. Environ. Microbiol. 2008, 74, 7767–7778. [Google Scholar] [CrossRef] [PubMed]
- Dieckmann, R.; Malorny, B. Rapid screening of epidemiologically important Salmonella enterica subsp. enterica serovars by whole-cell matrix-assisted laser desorption ionization-time of flight mass spectrometry. Appl. Environ. Microbiol. 2011, 77, 4136–4146. [Google Scholar] [CrossRef]
- Dworzanski, J.P.; Snyder, A.P.; Chen, R.; Zhang, H.; Wishart, D.; Li, L. Identification of bacteria using tandem mass spectrometry combined with a proteome database and statistical scoring. Anal. Chem. 2004, 76, 2355–2366. [Google Scholar] [CrossRef] [PubMed]
- Dworzanski, J.P.; Deshpande, S.V.; Chen, R.; Jabbour, R.E.; Snyder, A.P.; Wick, C.H.; Li, L. Mass spectrometry-based proteomics combined with bioinformatic tools for bacterial classification. J. Proteome Res. 2006, 5, 76–87. [Google Scholar] [CrossRef] [PubMed]
- Jabbour, R.E.; Deshpande, S.V.; Wade, M.M.; Stanford, M.F.; Wick, C.H.; Zulich, A.W.; Skowronski, E.W.; Snyder, A.P. Double-blind characterization of non-genome-sequenced bacteria by mass spectrometry-based proteomics. Appl. Environ. Microbiol. 2010, 76, 3637–3644. [Google Scholar] [CrossRef]
- Tracz, D.M.; McCorrister, S.J.; Chong, P.M.; Lee, D.M.; Corbett, C.R.; Westmacott, G.R. A simple shotgun proteomics method for rapid bacterial identification. J. Microbiol. Methods 2013, 94, 54–57. [Google Scholar] [CrossRef] [PubMed]
- Boulund, F.; Karlsson, R.; Gonzales-Siles, L.; Johnning, A.; Karami, N.; Al-Bayati, O.; Ahren, C.; Moore, E.R.B.; Kristiansson, E. Typing and Characterization of Bacteria Using Bottom-up Tandem Mass Spectrometry Proteomics. Mol. Cell. Proteom. 2017, 16, 1052–1063. [Google Scholar] [CrossRef] [PubMed]
- Karlsson, R.; Gonzales-Siles, L.; Gomila, M.; Busquets, A.; Salva-Serra, F.; Jaen-Luchoro, D.; Jakobsson, H.E.; Karlsson, A.; Boulund, F.; Kristiansson, E.; et al. Proteotyping bacteria: Characterization, differentiation and identification of pneumococcus and other species within the Mitis Group of the genus Streptococcus by tandem mass spectrometry proteomics. PLoS ONE 2018, 13, e0208804. [Google Scholar] [CrossRef]
- Alves, G.; Wang, G.; Ogurtsov, A.Y.; Drake, S.K.; Gucek, M.; Suffredini, A.F.; Sacks, D.B.; Yu, Y.K. Identification of Microorganisms by High Resolution Tandem Mass Spectrometry with Accurate Statistical Significance. J. Am. Soc. Mass Spectrom. 2016, 27, 194–210. [Google Scholar] [CrossRef]
- Alves, G.; Wang, G.; Ogurtsov, A.Y.; Drake, S.K.; Gucek, M.; Sacks, D.B.; Yu, Y.-K. Rapid Classification and Identification of Multiple Microorganisms with Accurate Statistical Significance via High-Resolution Tandem Mass Spectrometry. J. Am. Soc. Mass Spectrom. 2018, 29, 1721–1737. [Google Scholar] [CrossRef]
- Beltran, P.; Plock, S.A.; Smith, N.H.; Whittam, T.S.; Old, D.C.; Selander, R.K. Reference collection of strains of the Salmonella typhimurium complex from natural populations. J. Gen. Microbiol. 1991, 137, 601–606. [Google Scholar] [CrossRef] [PubMed]
- Food and Drug Administration. Bad Bug Book, Foodborne Pathogenic Microorganisms and Natural Toxins, 2nd ed.; Center for Food Safety and Applied Nutrition of the Food and Drug Administration (FDA), US Department of Health and Human Services: Silver Spring, MD, USA, 2012; [Salmonella species]; pp. 9–14.
- The Global Proteome Machine: cRAP Protein Sequences Home Page. Available online: https://www.thegpm.org/crap/ (accessed on 17 October 2017).
- Slotta, D.J.; McFarland, M.A.; Markey, S.P. MassSieve: Panning MS/MS peptide data for proteins. Proteomics 2010, 10, 3035–3039. [Google Scholar] [CrossRef] [PubMed]
- Richter, M.; Rossello-Mora, R.; Oliver Glockner, F.; Peplies, J. JSpeciesWS: A web server for prokaryotic species circumscription based on pairwise genome comparison. Bioinformatics 2016, 32, 929–931. [Google Scholar] [CrossRef]
- Porwollik, S.; Boyd, E.F.; Choy, C.; Cheng, P.; Florea, L.; Proctor, E.; McClelland, M. Characterization of Salmonella enterica subspecies I genovars by use of microarrays. J. Bacteriol. 2004, 186, 5883–5898. [Google Scholar] [CrossRef]
- Jacobsen, A.; Hendriksen, R.S.; Aaresturp, F.M.; Ussery, D.W.; Friis, C. The Salmonella enterica pan-genome. Microb. Ecol. 2011, 62, 487–504. [Google Scholar] [CrossRef]
- Chaudhuri, R.R.; Henderson, I.R. The evolution of the Escherichia coli phylogeny. Infect. Genet. Evol. 2012, 12, 214–226. [Google Scholar] [CrossRef] [PubMed]
- Bizzini, A.; Durussel, C.; Bille, J.; Greub, G.; Prod’hom, G. Performance of matrix-assisted laser desorption ionization-time of flight mass spectrometry for identification of bacterial strains routinely isolated in a clinical microbiology laboratory. J. Clin. Microbiol. 2010, 48, 1549–1554. [Google Scholar] [CrossRef] [PubMed]


Publisher’s Note: MDPI stays neutral with regard to jurisdictional claims in published maps and institutional affiliations. |
© 2021 by the authors. Licensee MDPI, Basel, Switzerland. This article is an open access article distributed under the terms and conditions of the Creative Commons Attribution (CC BY) license (https://creativecommons.org/licenses/by/4.0/).