Article

PPIA and YWHAZ Constitute a Stable Pair of Reference Genes during Electrical Stimulation in Mesenchymal Stem Cells

1
The Department of Materials, Faculty of Science and Engineering, School of Natural Sciences, The Henry Royce Institute, Royce Hub Building, The University of Manchester, Manchester M13 9PL, UK
2
Division of Cell Matrix Biology and Regenerative Medicine, Faculty of Biology, Medicine and Health, School of Biological Sciences, The University of Manchester, Manchester M13 9PT, UK
*
Authors to whom correspondence should be addressed.
Current address: Centre for Skin Sciences, Faculty of Life Sciences, The University of Bradford, Bradford BD7 1DP, UK.
Appl. Sci. 2022, 12(1), 153; https://doi.org/10.3390/app12010153
Submission received: 23 November 2021 / Revised: 15 December 2021 / Accepted: 22 December 2021 / Published: 24 December 2021

Abstract

:
Mesenchymal stem cells (MSCs) are multipotent adult stem cells with great potential in regenerative medicine. One method for stimulating proliferation and differentiation of MSCs is via electrical stimulation (ES). A valuable approach for evaluating the response of MSCs to ES is to assess changes in gene expression, relative to one or more reference genes. In a survey of 25 publications that used ES on cells, 70% selected GAPDH as the reference gene. We conducted a study to assess the suitability of six potential reference genes on an immortalized human MSC line following direct current ES at seeding densities of 5000 and 10,000 cells/cm2. We employed three methods to validate the most stable reference genes from qRT-PCR data. Our findings show that GAPDH and ACTB exhibit reduced stability when seeded at 5000 cell/cm2. In contrast, we found that the most stable genes across both plating densities and stimulation regimes were PPIA and YWHAZ. Thus, in ES gene expression studies in MSCs, we support the use of PPIA and YWHAZ as an optimal reference gene pair, and discourage the use of ACTB and GAPDH at lower seeding densities. However, it is strongly recommended that similar verification studies are carried out based on cell type and different ES conditions.

1. Introduction

In the field of regenerative medicine, changes in gene expression are often studied to provide evidence that stem cells are undergoing the process of differentiation. Of the techniques used to gather these data, one of the most common is real-time quantitative reverse transcription polymerase chain reaction, qRT-PCR [1]. Analysis of qRT-PCR data using the ∆∆CT method requires a comparison to be made between the detection level of a gene of interest relative to one or more reference genes, also commonly referred to as housekeeping genes, that remain stable during the experimental procedure [2].
Mesenchymal stem cells (MSCs) are of particular interest to the research community due to their immunomodulatory characteristics and their multipotency, which enables differentiation down osteogenic, chondrogenic, adipogenic, and neurogenic lineages [3,4]. Despite the evident potential of MSCs, there are still many hurdles to overcome before their effective use in patients. One main issue is that on implantation, cells often migrate away from the repair site, and therefore efficient integration with the target tissue or organ proves problematic [5]. A promising method for solving this could be the application of electrical stimulation (ES) to cells in vitro or in vivo, which has been shown to stimulate cell proliferation [6,7,8,9], initiate cell migration [10,11,12,13] and accelerate differentiation [14,15,16,17]. These benefits could help solve the issues faced in the translation of stem cell therapies. In addition, the relative low cost of using an electric signal for differentiation as opposed to expensive growth factors could pave the way for a more rapid, reproducible, and cost-effective method for rendering cell therapies available to all.
An accurate, rapid and convenient method for assessing the effect of ES on MSCs is to investigate changes in gene expression, including differentiation marker genes, through qRT-PCR [1]. However, such analyses require the identification and use of one or more reference genes that do not change following ES. Some studies have been published on the ideal reference genes for equine and porcine MSCs in growth conditions and multilineage differentiation [2,18], bone marrow and umbilical cord-derived human MSCs in long-term culture [19], adipose-derived MSCs [20], and in MSCs undergoing osteogenic differentiation [21], and tenogenic differentiation [22]. However, there has been no reference gene study published explicitly for MSCs following ES. Thus, our aim was to identify one or more reference genes that can be confidently used for gene expression studies on electrically stimulated human MSCs.

2. Materials and Methods

2.1. Cell Culture

An immortalized human MSC line, Y201, gifted by Dr. Stephen Richardson, was used [23]. The passage number of cells on seeding in these experiments was P85. Cells were grown in Dulbecco’s Modified Eagle’s Medium with 1000 mg/L glucose, L-glutamine, and sodium bicarbonate (Sigma Aldrich, Gillingham, UK), supplemented with 10% fetal bovine serum (Sigma Aldrich, Gillingham, UK) and 1% penicillin/streptomycin (ThermoFisher, Paisley, UK). Primary bone-marrow human MSCs were purchased from Lonza, Batch No. 19TL029340 and lot no. PT-2501. Cells at Passage 5 were expanded at a density of 10,000 cells/cm2 and cultured for 7 days prior to 4 days of ES (100 mV/mm). The growth medium used was Dulbecco’s Modified Eagle’s Medium with 4500 mg/L glucose, L-glutamine, without sodium pyruvate (Sigma Aldrich, Gillingham, UK), supplemented with 10% fetal bovine serum (Sigma Aldrich, Gillingham, UK) and 1% penicillin/streptomycin (ThermoFisher, Paisley, UK).
In this experiment, cells were seeded into a CellStar 6-well plate (Sigma Aldrich, Gillingham, UK) 72 h prior to the first application of ES. A volume of 3 mL of medium was pipetted into each well, and was changed one day post-seeding, then every 3 days thereafter.
Cells were incubated at 37 °C, 5% CO2, and normoxic conditions. Cells were seeded at a density of 5000 cells/cm2 or 10,000 cells/cm2.

2.2. Direct Current ES

An electric field of 100 mV/mm was applied to the cells in a 6-well plate through 2 × 0.5 mm 99.95% L-shaped platinum wire (Alfa Aesar, ThermoFisher, Paisley, UK) electrodes using a ‘9130′ programmable direct current (DC) power supply (BK Precision) [16]. Electrodes were attached to the lid of a CellStar 6-well treated culture plate Sigma Aldrich, Gillingham, UK), with each well connected in parallel using jumper cables. Between uses, any protein build-up on electrodes was removed by applying a reverse voltage for 5 min in 3 mL of PBS. Prior to use, the ES device was sanitized with 70% ethanol, and UV-irradiated for 15 min. The cells were stimulated for 30 min or 60 min per day (m/d) for a period of 5 days.

2.3. RNA Extraction and Quantitation

The stimulated cells underwent 30 or 60 m/d of ES over 5 days; RNA was extracted from the cells immediately after the last period of ES on day 5. The RNEasy Mini Kit (Qiagen, Manchester, UK) was used as per the manufacturer’s instructions for cells cultured in 2D. The quantity of RNA was determined using the Qubit RNA Broad Range Assay Kit and the Qubit fluorometer (ThermoFisher, Paisley, UK). The purity of the RNA was validated by the Nanodrop One machine (ThermoFisher, Paisley, UK), as per the A260/280 ratio. The acceptable RNA purity value was taken to be ≥2.

2.4. Quantitative Reverse Transcription Polymerase Chain Reaction (qRT-PCR)

Gene expression data were generated using qRT-PCR. RNA was reverse transcribed to c-DNA using the High-Capacity RNA-to-cDNA Kit (ThermoFisher). Conversion was assumed to be 100%. The concentration of cDNA was diluted to 2 ng/µL. On each plate, the unstimulated controls had n = 2, and there was n = 3 for the electrically stimulated samples.
For qRT-PCR, each well of a 96-well PCR plate was loaded with 10 µL of SYBRTM Green Master Mix (ThermoFisher, Paisley, UK), 2 µL of primer mix (0.2 µL of forward and reverse primer, 1.6 µL of RNAse-free water), 3 µL of RNAse-free water and 5 µL of cDNA. The primer stock concentration was 100µM. The qRT-PCR analysis was performed on a StepOne Plus instrument (ThermoFisher, Paisley, UK), and subsequently the ∆∆CT method was used to calculate the fold changes.
PPIA and YWHAZ sequences were obtained from [19], and 18S, B2M, GAPDH, and ACTB were designed in-house.
The mRNA sequences were obtained from the NCBI nucleotide database (https://www.ncbi.nlm.nih.gov/nucleotide/, accessed on 20 November 2021) and were selected as such to have a melting temperature of 60 °C and minimal primer dimer or hairpin loop formation. For genes with one variant, the above-mentioned database was consulted for an appropriate primer pair. For more complex genes with more than one variant, Primer 3 (https://primer3.ut.ee, accessed 20 November 2021) was used. In addition, B2M, GAPDH and ACTB primers were designed to amplify a product spanning an intronic region and with at least one primer binding across the boundary of two exons. However, 18S is expressed from a single exon, so it was not possible in this case. Where multiple transcript variants are known to exist, primers were design to detect all, or as many variants as possible. All primers were checked for specificity using the NCBI Primer Designing Tool (https://www.ncbi.nlm.nih.gov/tools/primer-blast/, accessed 20 November 2021). The sequences for the primers used are shown in Table 1.

2.5. Metabolic Activity

The stimulated cells underwent 30 or 60 m/d of ES over 5 days. The cellular metabolic activity was measured on day 5, prior to the final ES period, using the Deep Blue Cell Viability Kit (BioLegend, London, UK). A volume of 1 mL of the solution administered to each well was constituted of 10% of the ‘Deep Blue’ resazurin solution, and 90% of cell media. The incubation period was 1 h, after which the fluorescence intensity of 200 µL of supernatant was measured at excitation wavelength of 544 nm and an emission wavelength of 590 nm on a plate reader (FLUOstar® OPTIMA, BMG LabTech, Ortenberg, Germany).

2.6. Primer Amplification Efficiency

The primer amplification efficiency (E) was calculated using the following equation:
E   ( % ) = ( 10 1 m 1 ) × 100
where m is the slope of the standard curve for which CT value (y-axis) is plotted against log10 of the cDNA mass in ng. The standard curve parameters were calculated by linear regression in GraphPad Prism software.

2.7. Data Analysis

NormFinder v0.953 was downloaded from the following website: https://moma.dk/normfinder-software (accessed on 18 November 2021) and was run through Visual Basic for Applications (VBA) for Microsoft Excel [24]. The ∆∆CT method was used to calculate the fold changes for each gene (Gene 1) versus the gene determined by NormFinder to be the most stable for each seeding density (Gene 2) across unstimulated control and ES groups.
The series of equations used were as follows:
Δ C T = C T ,   G e n e   1 C T ,   G e n e   2  
Δ Δ C T = Δ C T C o n t r o l   Δ C T ,   a v e r a g e
F o l d   c h a n g e = 2 Δ Δ C T
The BestKeeper software was downloaded from the following website: https://www.gene-quantification.de/bestkeeper.html, (accessed on 18 November 2021) and was also run on VBA on Microsoft Excel [25].
In the ∆∆CT method results, fold changes for each gene were statistically analyzed using the unpaired t-test, without adjustment for multiple comparisons. Where the control was compared with 30 and 60 m/d of ES, a two-way ANOVA was used Tukey’s multiple comparisons test. The metabolic activity assay was also analyzed by a two-way ANOVA.

3. Results

3.1. Primers Are Effective and Selective for Their Respective Genes

A survey was undertaken of 25 published journal articles showing gene expression data in electrically stimulated cells, and 70% of these used GAPDH as the reference gene, with the second most popular (12%) being ACTB (Supplementary Table S1). In addition to these two genes, we also chose to include in our study, 18S, B2M, PPIA and YWHAZ as additional potential candidate reference genes [19,26].
Firstly, we wanted to verify if the primers used for each gene (Table 1) were effective over a range of cDNA concentrations, and that the PCR products were therefore unique and specific. This was achieved by plotting the standard curves for the 6 reference genes, (Figure 1). The values from the linear regression of these standard curves were used to calculate the primer efficiencies (Table 2). The efficiency values for each of the primers in this study fall between 93.25% and 106.10%, indicating a satisfactory level of amplification with individual gradients between −3.2 and −3.5 (Table 2). We studied the melt curves derived from the StepOne software v.2.3 in order to check that the PCR products were in fact a single double-stranded DNA product. The melt curves confirmed this with the presentation of a single solitary peak, indicating the amplification of a single product for each gene (Supplementary Figure S1).

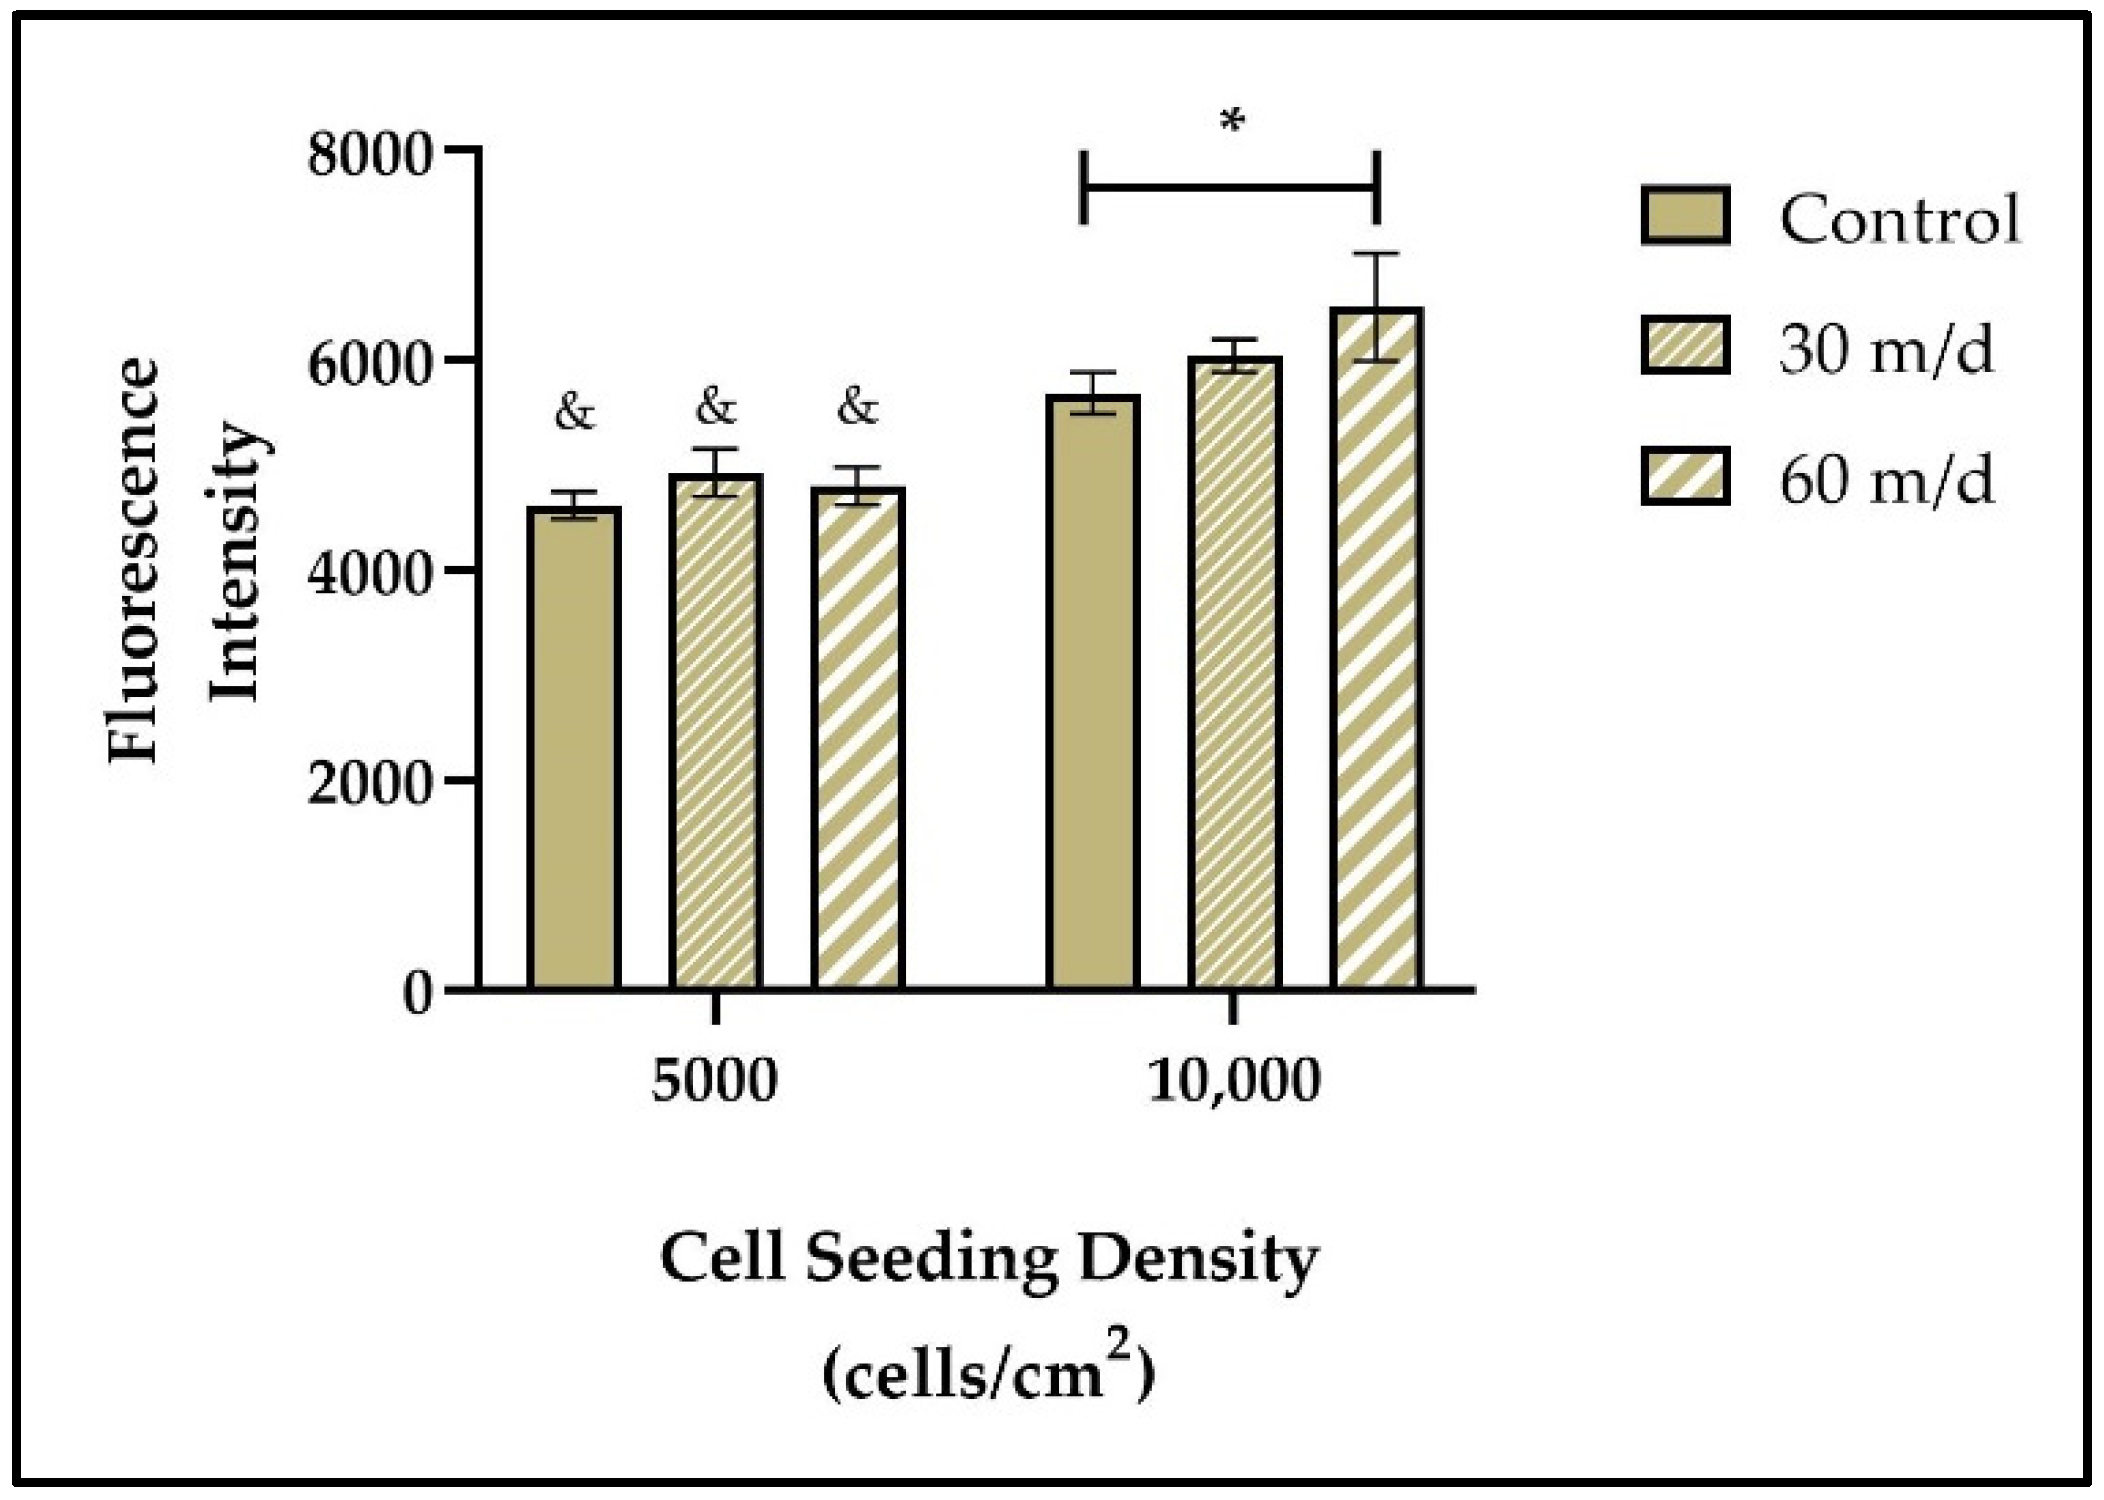
3.2. Cells Remain Viable under ES

The immortalized human Y201 MSC line was selected for use in this study. We next chose to examine whether the ES regimes we decided to use on the MSCs were cytotoxic. The cellular metabolic activity was measured on day 5, prior to the final period of ES, Thus, we assessed the effect of both 30 and 60 min per day (m/d) of ES on cell viability at two seeding densities based on measurements of the cells’ metabolic activity (Figure 2). There was no statistical significance seen between the electrically stimulated cells and the control cells in the 5000 cells/cm2 group; however, at 10,000 cells/cm2, 60 m/d of ES incited a significant increase in the metabolic activity. This effect could be due to oxidative stress resulting from the over-confluence observed in the 10,000 cells/cm2 group. This chosen seeding density proved to be excessive due to the highly proliferative nature of the Y201 cell line we used for these experiments. Importantly, there were no decreases in metabolic activity that would have been indicative of cell death, and therefore ES cytotoxicity.

3.3. The Effect of the Duration of ES on Reference Gene Activity

Part of this study was to determine if increasing the duration of the ES over five daily applications had an effect on the expression of the six potential reference genes in our study. The ∆∆CT method was used to calculate the fold changes, for which a “gold standard” reference gene should remain as close as possible to 1.0 under all experimental conditions versus the unstimulated control cells and another reference gene. Finding a reference gene pair is particularly advantageous as this corrects for any inaccurate RNA quantification steps and for differences in the efficiency of the reverse transcription process. Furthermore, it was necessary to assess if the fold changes after 60 m/d of ES were statistically different from that of the 30 m/d group or the control group. The fold changes of PPIA, 18S, and GAPDH were normalized to YWHAZ in unstimulated cells or in cells exposed to both durations of ES (Figure 3). The increases observed in 18S after 30 and 60 m/d were not significant, nor was the rise in expression of GAPDH after 60 m/d. For all three of the reference genes tested, there were no significant differences in expression between the ES durations of 30 m/d and 60 m/d. The clear similarity observed in response for both the 30 m/d and 60 m/d groups provided the rationale to continue focusing solely on the expression changes in cells stimulated for 60 m/d. It was also assumed that a reference gene exhibiting stable, consistent expression after 60 m/d of ES would be likely to also remain stable under a shorter period of ES of the same electric field strength.

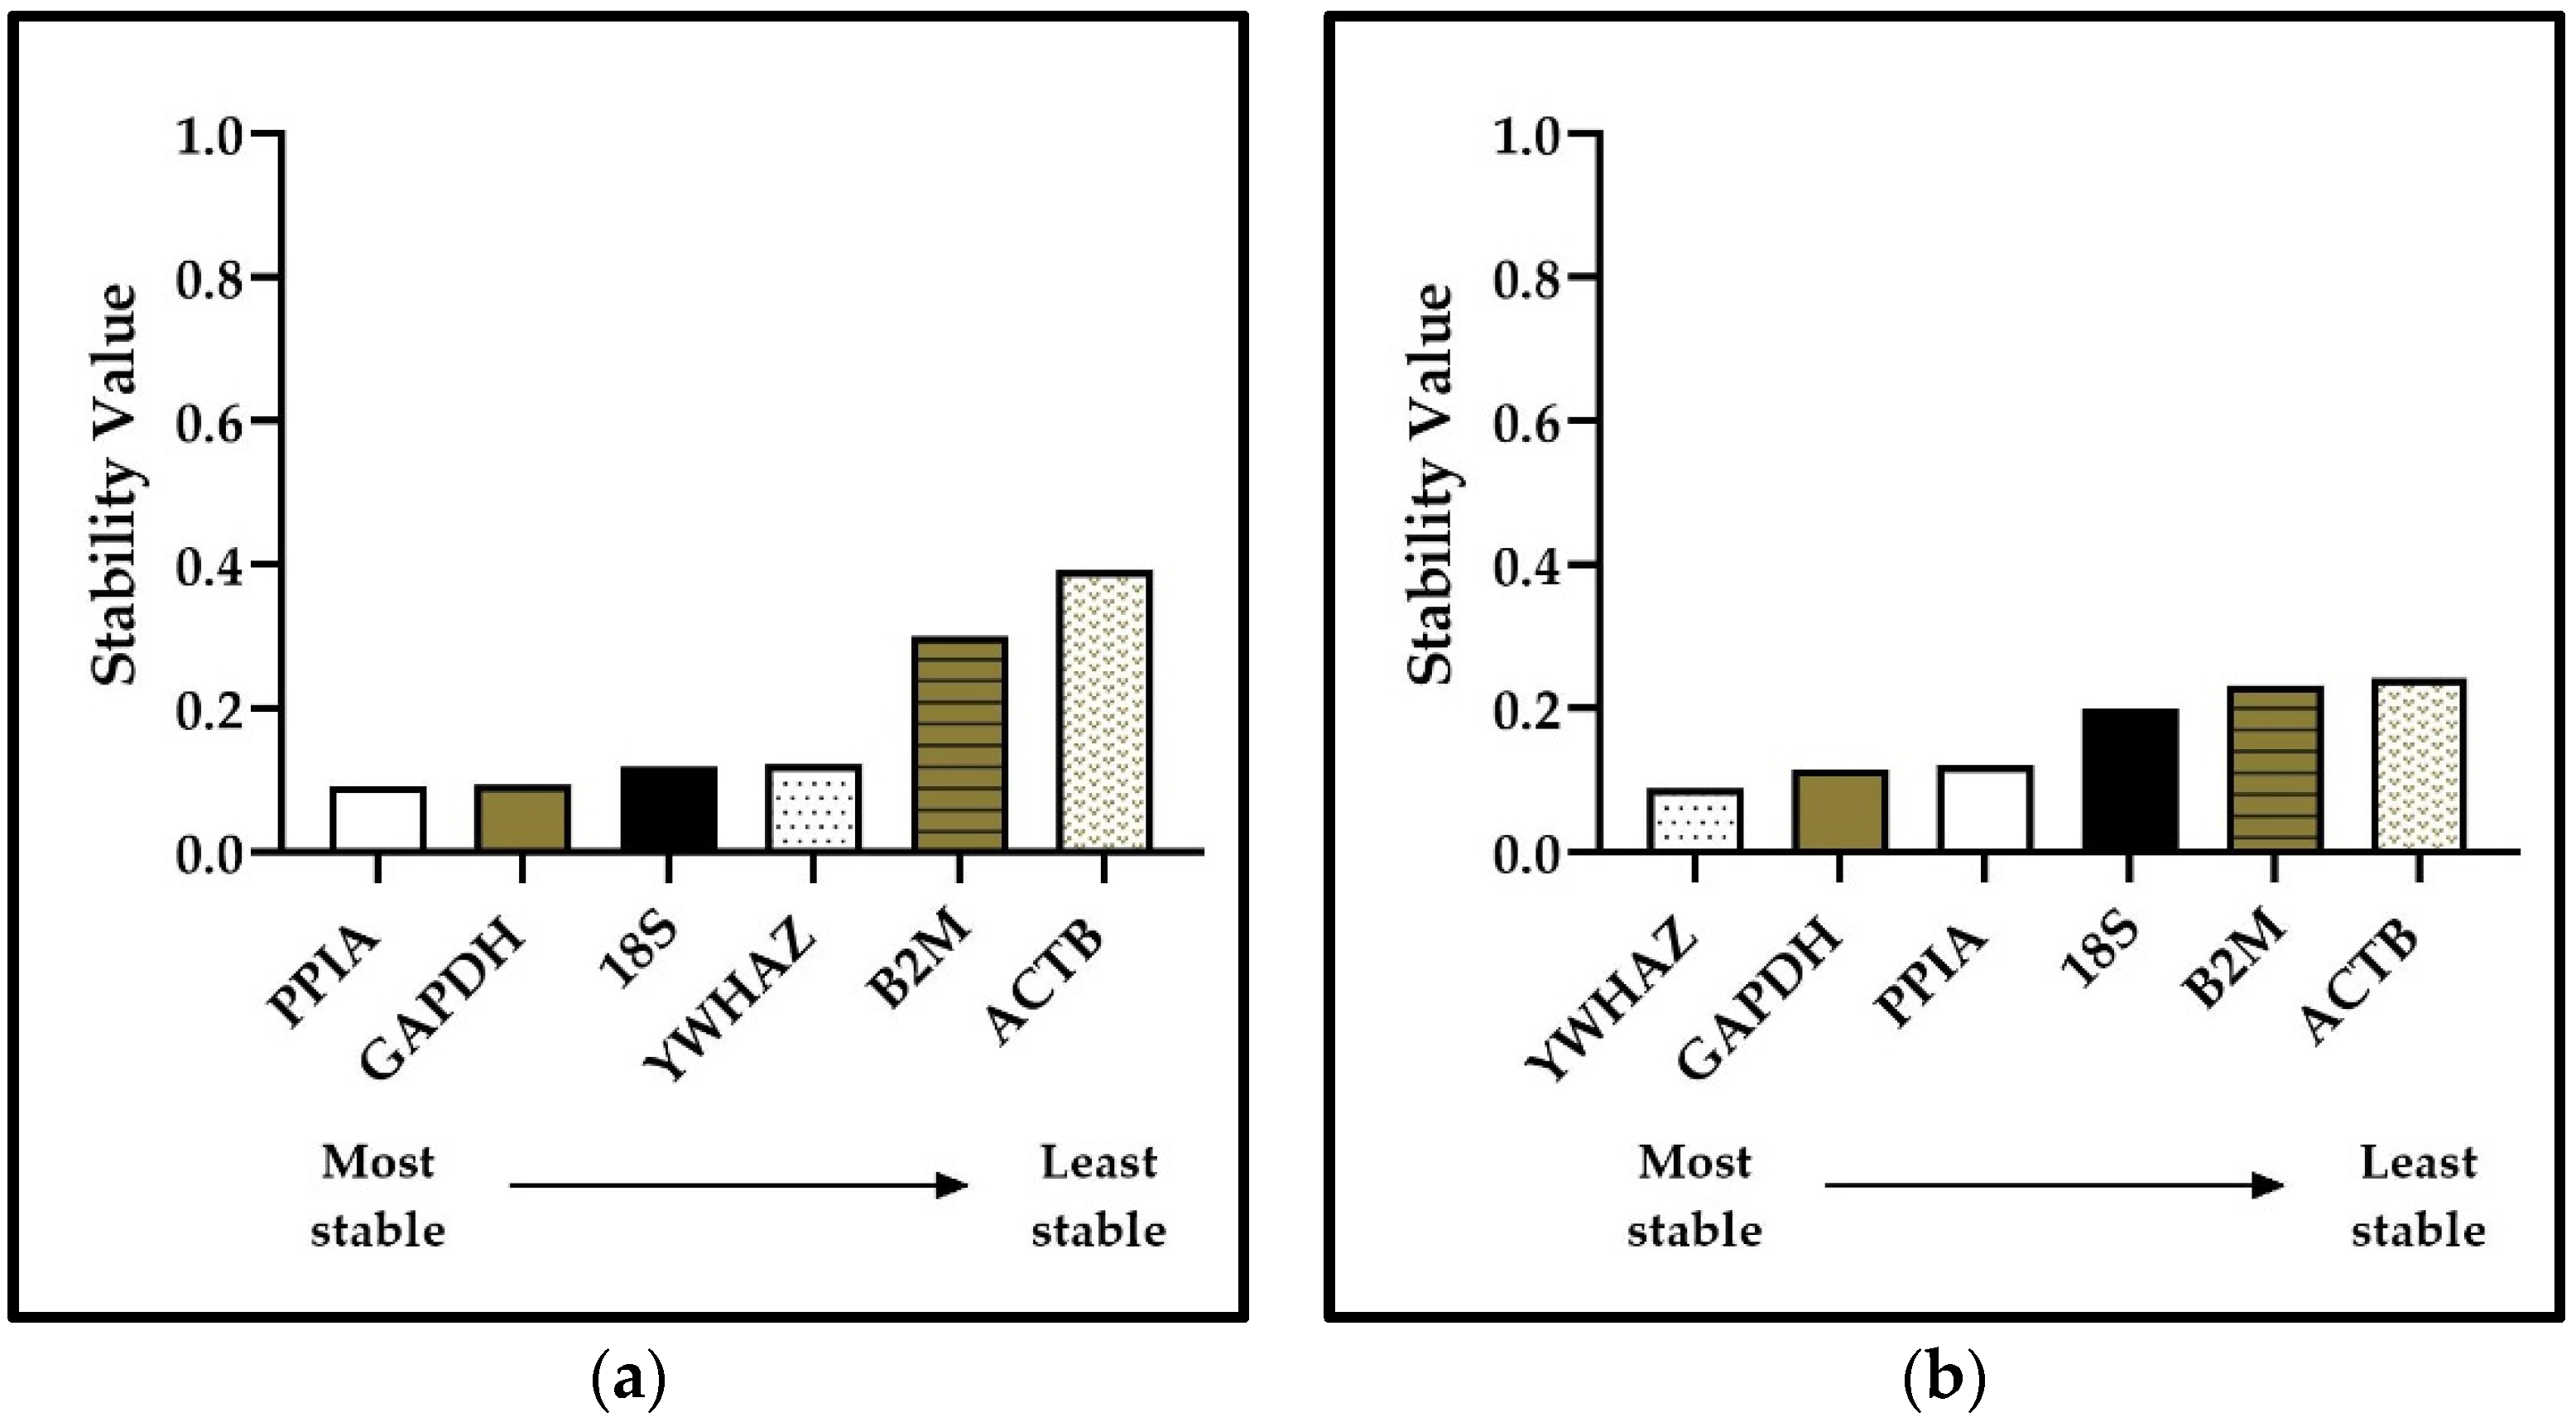
3.4. NormFinder Results

To prevent bias and to gain a more detailed analysis of the CT values, we used the NormFinder software v0.953. Stability values for each gene are determined via an algorithm. The lower the stability value, the higher the relative stability of the gene. The NormFinder results are presented for cells stimulated for 60 m/d at each seeding density in Figure 4. The results show that PPIA is the most stable gene for the 5000 cells/cm2 group and ACTB is the least stable at this seeding density (Figure 4a). For the cells seeded at 10,000 cells/cm2, YWHAZ was found to be the most stable, and ACTB was again the least stable (Figure 4b). GAPDH was ranked as the second most stable gene in both seeding density groups (Figure 4a,b).
Interestingly, the stability of the genes studied increased consistently with increasing seeding density. As would be expected, this would imply that cells seeded at the lower density are more greatly affected by the ES potentially due to their heightened levels of exposure.

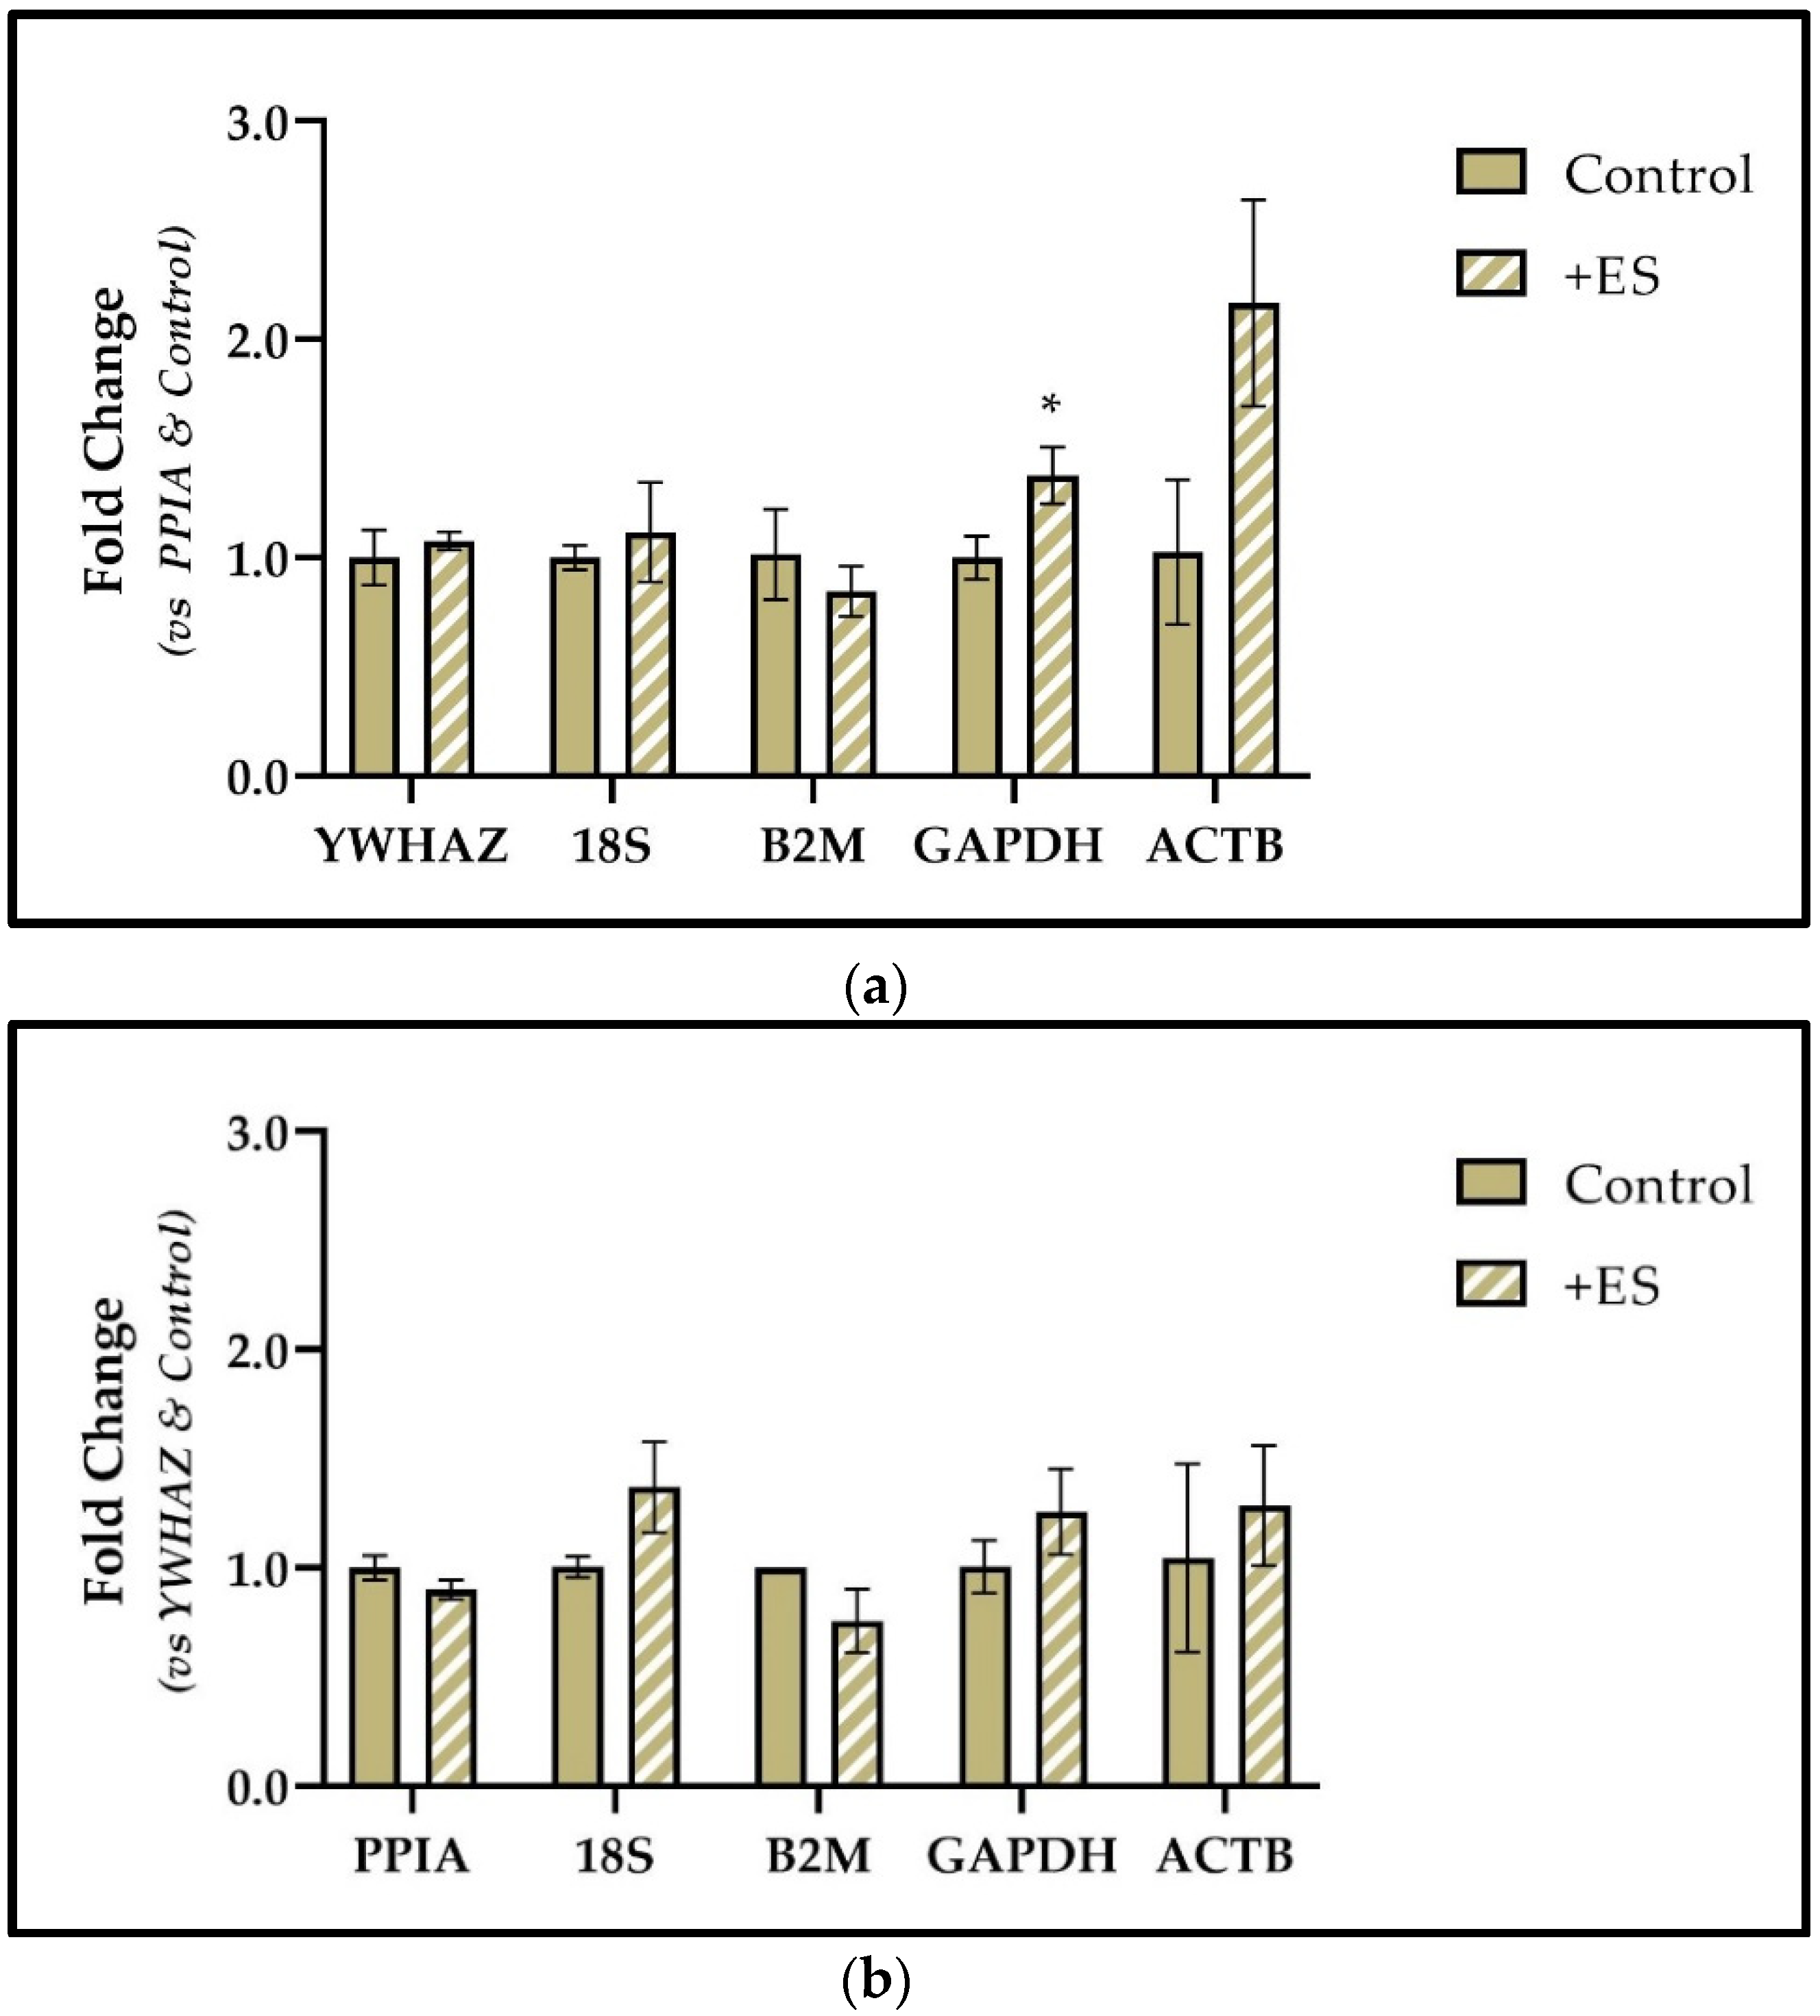
3.5. ∆∆CT Method Results

The ∆∆CT method calculates the fold change of a gene of interest versus a reference gene. Crucially, it is the only way to interpret qRT-PCR data from the raw threshold cycle (CT) values. This is why we considered it important to validate the reference genes using the same method, as this would be used when analysing if a gene of interest was changing under ES conditions. The fold changes for the reference genes were plotted versus the gene determined to be the most stable by NormFinder for each of the seeding densities using the ∆∆CT method (Figure 5).
The ∆∆CT results showed a significant increase in GAPDH expression while ACTB also exhibited an upwards trend in expression, relative to PPIA at 5000 cells/cm2 (Figure 5a). The p-value for ACTB was 0.06, therefore it was close to being significant, but failed to reach significance possibly because of the relatively large standard deviation in the values.
In contrast, YWHAZ, 18S, and B2M did not show any significant differences in the ES groups versus PPIA and the control cells (Figure 5a). At the seeding density of 10,000 cells/cm2, the expression of none of the potential reference genes were significantly altered following ES (Figure 5b). However, the most consistent pair were PPIA and YWHAZ, with an average fold change in the ES group of 1.08 and 0.90 respectively (Figure 5a,b).
Our results suggest that GAPDH may be a poor choice for a reference gene at seeding densities below 10,000 cells/cm2. The significant increase noted in GAPDH contradicts the NormFinder results, which placed GAPDH as the second most stable gene consistently at both seeding densities. This highlights the importance of using more than one method to determine reference gene stability. The selection of a poor reference gene could easily mask a significant upregulation of a gene of interest.
Despite the lack of significance, ACTB may also not be an appropriate reference gene for studies involving ES due to its observed increase in expression and high variability at 5000 cells/cm2. It is important to recognise that this study only focused on an electric field strength of 100 mV/mm and a direct current set-up in a 2D culture environment. Within the system, there are many variables at play which all could influence the reference gene activity. Based on this precise experimental set-up, ACTB and GAPDH will be avoided in future, especially at lower seeding densities. In contrast, PPIA and YWHAZ would appear to be a stable pair regardless of the number of cells seeded prior to ES.

3.6. BestKeeper Results

In the literature, studies on the most suitable reference genes employ multiple platforms to compare the findings and ultimately verify their conclusions. We, therefore, decided to also input our raw CT values into BestKeeper [25]. The Pearson’s correlation coefficient (r) value results generated by BestKeeper were studied, and are shown in Table 3. Each potential gene pair has been ranked in order of the highest average r value over both seeding densities. As an r value of one illustrates a highly positive linear correlation, PPIA and YWHAZ constituted the gene pair with the strongest relationship, and also demonstrated the most consistent pairing with the lowest standard deviation. ACTB consistently appeared in the lowest ranked gene pairings, with the lowest average r values and the highest standard deviations. Next, four out of the possible five pairings including GAPDH were ranked sequentially in the middle of the dataset. However, these r values were still indicative of a strongly positive correlation between the pairs and had a low standard deviation across the seeding densities.
An r value above 0.9 would still be determined to be a highly positive correlation, and would indicate that PPIA and GAPDH would make a suitable reference gene pair; however, the significant increases in GAPDH as shown by the ΔΔCT show the innate value in using multiple methods to gain a full and accurate picture of the reference gene expression. The in-depth descriptive statistics of each data set can be found in Supplementary Tables S2 and S3.

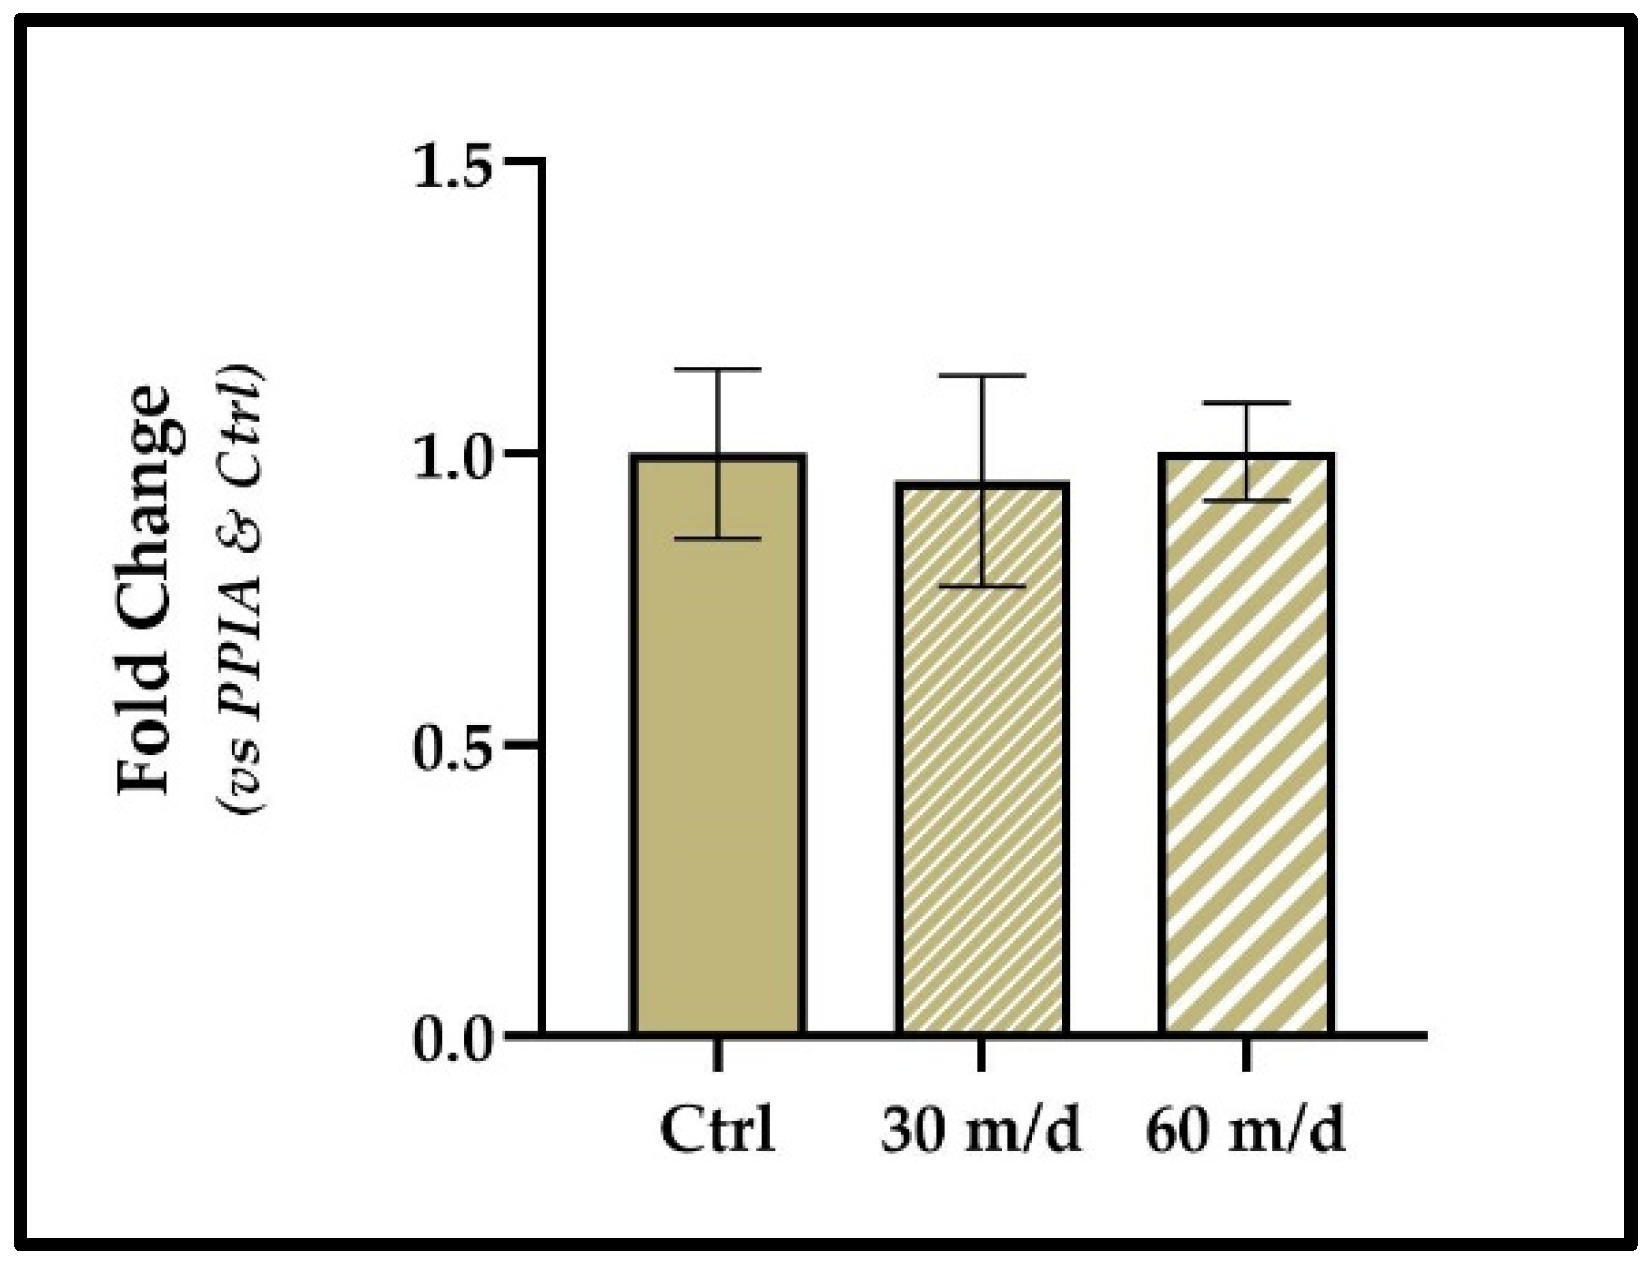
3.7. PPIA and YWHAZ Expression in Primary Human MSCs

As previously mentioned in Results Section 3.2, an immortalized human MSC line was used in this study. A question we posed was if the findings were also consistent in primary human MSCs, that still retain replicative senescence and are of a different donor. Therefore, we assessed the expression of YWHAZ versus PPIA in primary human bone marrow-derived MSCs (Figure 6). We found no change in the gene expression after 30 or 60 m/d of ES; therefore, YWHAZ and PPIA were also stable with increasing duration of ES in primary MSCs as well as the Y201 MSC line. This shows that the human immortalized cells used in this study are a highly relevant MSC line, with transferrable results.

4. Discussion

In general, most gene expression studies use only one reference gene, rather than a pair of reference genes (Supplementary Table S1). Using pairs of reference genes is the gold standard because any inaccuracies in the relative concentrations of cDNA can be adjusted for in further analysis. Not only is RNA quantification often prone to error, but also the RNA-to-cDNA reverse transcription efficiency can be variable between samples. In addition, there is evidence that the efficiency of reverse transcription may be gene dependent as well [27]. Interestingly, our work has highlighted that ACTB may be problematic in showing high variability between replicates, possibly due to variability in its ability to be reverse transcribed. The input concentration of cDNA is calculated by assuming a ‘perfect’ reverse transcription efficiency of 100% for all genes [27]; however, the actual efficiency is unknown and will differ, as already mentioned, between genes and between samples.
Knowing therefore that two reference genes are strongly correlated, and using them both as a baseline, gives further confidence that any differences assessed between the reference genes and the genes of interest will be genuine. It is proposed that the CT values of PPIA and YWHAZ be averaged and then compared with that of a gene of interest. A further advantage of using a pair of reference genes is the ability to quickly identify a scenario in which either gene does change. A similar analysis, as carried out in this study, could then be conducted to find a new, more suitable pair.
Many other published reference or ‘housekeeping’ gene articles use BestKeeper, NormFinder, and also GeNorm [2,19,22]. It is acknowledged that a further platform could add greater accuracy in the determination of the most stable reference genes; however, this was achieved using the ∆∆CT method and stable genes were still able to be confidently identified. Furthermore, it has previously been shown that evaluating the analysis from multiple approaches provides a more accurate estimate of the best reference genes; GeNorm was also determined to be less rigorous than NormFinder, particularly where some genes had a high variability across samples [28].
Of the primers used, three out of the six had efficiencies of over 100%; this means that the rate of doubling was slightly above two per cycle [29]. The ∆∆CT method calculations rely on the assumption that each cycle is accompanied by a doubling of the number of target sequence molecules; therefore efficiencies of less than 90% are more problematic as the molecules are not achieving said threshold [30,31].
The seeding densities of 5000 and 10,000 cells/cm2 have both commonly been used in previous ES studies [13,14,32,33,34]. The electric field strength was selected primarily because the same ES device had also shown pro-osteogenic effects at 100 mV/mm in the literature, and it falls within the range of physiological EFs that are established in vivo for both development and regeneration [14,35]. The metabolic activity differences at the higher seeding density do not constitute an unusual finding; increases were observed in rat adipose-derived MSCs in the same ES set-up and in cells seeded on a substrate formed of hydroxyapatite, respectively [14,34]. Evidently, the seeding density plays a role in the cells’ response to ES. However, a full analysis of this effect falls out of the scope of this study and will be appropriately investigated in future work.
In a survey taken of published literature using ES, 70% of the papers cited GAPDH as the reference gene in the study. Based on our findings, the use of GAPDH as the only reference gene in ES studies should be verified before continued use, especially at lower seeding densities. However, it is equally acknowledged that the field of ES research uses a vast array of parameters, different cell types, as well as varying modalities for delivering the stimulation to the cells such as DC ES, AC ES, a capacitive set-up, or even electromagnetic stimulation. Even a factor as seemingly small as the electrode material can have a large impact on the cellular response due to differences in faradic by-products [36]. Therefore, the results in this study only serve as an indication of how MSCs react in the system described. Any decisions to use PPIA and YWHAZ as a reference gene pair should be first validated in each specific ES set-up.
Hydrogen peroxide (H2O2) is produced at the cathode during DC ES, and therefore, the levels of exposure per cell to the H2O2 concentration would be elevated when fewer cells are present in the well. The reason for GAPDH’s increase in expression at the lower seeding density of 5000 cells/cm2 could be linked to findings that GAPDH is involved in regulating intracellular redox levels [37].
A possible explanation for the lack of stability of ACTB could be due to its role in cell migration [38]. MSCs in a direct current electric field migrate towards the anode at electric field strengths as low as 25 mV/mm [13]. Consequently, this could provide rationale for ACTB’s involvement in the cellular response.
All in all, 18S, while stable, has drawbacks due to the fact that it is expressed at much higher levels than the average gene of interest, appearing after 10–12 cycles. Due to the difference between the gene of interest and the reference gene being an exponent of 2 in fold change calculations, small differences are highly sensitive, and errors can be reduced by selecting a reference gene with a CT value more similar to that of the genes of interest in the study. Moreover, due its single exon any primers targeting 18S cDNA could also amplify the corresponding genomic region. Thus, contaminating DNA might skew the findings unless removed prior to reverse transcription.
Overall, comparing the findings from NormFinder, the ∆∆CT method, and BestKeeper has proven the value of using multiple platforms. As much as NormFinder identified ACTB as the least stable gene at both seeding densities, it consistently placed GAPDH as the second most stable gene. This exposes a flaw in solely relying upon NormFinder, as when the fold changes were calculated, GAPDH significantly increased in the 5000 cells/cm2 group. The Pearson correlation coefficient analysis from BestKeeper ranked GAPDH mostly in the middle of the dataset. This further highlights the importance of selecting a stable reference gene pair. A poor reference gene has the potential of giving inaccurate gene expression results, which could confound and delay the advancement of knowledge within the research community. Thus, the value in carefully choosing the reference gene pairs used in gene expression studies cannot be underestimated.
In summary, our study identified PPIA and YWHAZ as the most stable reference genes following ES. These two genes were similarly found to be the most stable following long-term MSC culture [19]. The ∆∆CT method showed an undeviating similarity in expression of both genes. This was further reinforced by the BestKeeper Pearson’s correlation coefficient data, which ranked PPIA and YWHAZ as the best potential gene pair overall with a very highly positive and consistent relationship at both seeding densities. This finding was also replicated in primary MSCs, which provides confidence that the conclusions from this study are not only applicable to the immortalized MSCs, but to primary cells from a different donor.
Due to the wide variation in parameters, conditions, electrical and temporal regimes applied by numerous research groups, this paper cannot state that PPIA and YWHAZ are unilaterally the most stable reference genes under ES. However, it is hoped that this study will encourage researchers to thoroughly assess the transcriptional response of commonly-used reference genes across different time points, varying electric field strengths, and duration of stimulation prior to investigating pathways of interest.

Supplementary Materials

The following are available online at https://www.mdpi.com/article/10.3390/app12010153/s1, Table S1: List of reference genes used in 25 published articles involving gene expression studies under ES. Figure S1: Melt curves for each of the reference genes used in this study. Table S2: BestKeeper descriptive statistics for each reference gene in the 5000 cells/cm2 group. Table S3: BestKeeper descriptive statistics for each reference gene in the 10,000 cells/cm2 group, References [39,40,41,42,43,44,45,46,47,48,49,50,51,52,53,54,55] are cited in the supplementary materials.

Author Contributions

Conceptualization, D.M.A., L.S., E.A., S.H.C.; methodology, L.S.; formal analysis, L.S.; investigation, L.S.; resources, S.H.C., E.A.; data curation, L.S.; writing—original draft preparation, L.S.; writing—review and editing, E.A., D.M.A., S.H.C.; supervision, S.H.C., E.A. All authors have read and agreed to the published version of the manuscript.

Funding

This research was funded by the Engineering and Physical Sciences Research Council (EPSRC) and the Medical Research Council (MRC) Centre for Doctoral Training in Regenerative Medicine (EP/L014904/1).

Institutional Review Board Statement

Not applicable.

Informed Consent Statement

Not applicable.

Data Availability Statement

The datasets analyzed in this study are available from the corresponding authors on reasonable request.

Acknowledgments

The authors wish to thank Stephen Richardson, Division of Cell Matrix Biology and Regenerative Medicine, The University of Manchester for gifting the Y201 cells, and his contribution to the design of experiments. Some of this work was conducted in the Henry Royce Institute for Advanced Materials, funded by the following EPSRC grants: EP/R00661X/1, EP/S019367/1, EP/P025021/1. The authors also wish to thank Katherine Bexley for assistance with the design of primers used in this study.

Conflicts of Interest

The authors declare no conflict of interest.

References

  1. Okamura, K.; Inagaki, Y.; Matsui, T.K.; Matsubayashi, M. OPEN RT-qPCR analyses on the osteogenic differentiation from human iPS cells: An investigation of reference genes. Sci. Rep. 2020, 10, 11748. [Google Scholar] [CrossRef]
  2. Lee, W.J.; Jeon, R.H.; Jang, S.J.; Park, J.S.; Lee, S.C.; Baregundi Subbarao, R.; Lee, S.L.; Park, B.W.; King, W.A.; Rho, G.J. Selection of reference genes for quantitative gene expression in porcine mesenchymal stem cells derived from various sources along with differentiation into multilineages. Stem Cells Int. 2015, 2015, 235192. [Google Scholar] [CrossRef]
  3. Denu, R.A.; Hematti, P. Effects of Oxidative Stress on Mesenchymal Stem Cell Biology. Oxid. Med. Cell. Longev. 2016, 2016, 2989076. [Google Scholar] [CrossRef] [PubMed] [Green Version]
  4. Hanna, H.; Mir, L.M.; Andre, F.M. In vitro osteoblastic differentiation of mesenchymal stem cells generates cell layers with distinct properties. Stem Cell Res. Ther. 2018, 9, 203. [Google Scholar] [CrossRef]
  5. Ullah, I.; Subbarao, R.B.; Rho, G.J. Human mesenchymal stem cells-current trends and future prospective. Biosci. Rep. 2015, 35, e00191. [Google Scholar] [CrossRef]
  6. Li, P.; Xu, J.; Liu, L.; Zhang, Y.; Liu, M.; Fan, Y. Promoting Proliferation and Differentiation of Pre-Osteoblasts MC3T3-E1 Cells Under Combined Mechanical and Electrical Stimulation. J. Biomed. Nanotechnol. 2019, 15, 921–929. [Google Scholar] [CrossRef] [PubMed]
  7. Tian, J.; Shi, R.; Liu, Z.; Ouyang, H.; Yu, M.; Zhao, C.; Zou, Y.; Jiang, D.; Zhang, J.; Li, Z. Self-powered implantable electrical stimulator for osteoblasts’ proliferation and differentiation. Nano Energy 2019, 59, 705–714. [Google Scholar] [CrossRef]
  8. Gu, X.; Fu, J.; Bai, J.; Wang, J.; Pan, W.; Zhang, C. Low-Frequency Electrical Stimulation Induces the Proliferation and Differentiation of Peripheral Blood Stem Cells Into Schwann Cells. Am. J. Med. Sci. 2015, 349, 157–161. [Google Scholar] [CrossRef]
  9. Lee, J.H.; Jeon, W.-Y.; Kim, H.-H.; Lee, E.-J.; Kim, H.-W. Electrical stimulation by enzymatic biofuel cell to promote proliferation, migration and differentiation of muscle precursor cells. Biomaterials 2015, 53, 358–369. [Google Scholar] [CrossRef]
  10. Tai, G.; Tai, M.; Zhao, M. Electrically stimulated cell migration and its contribution to wound healing. Burn. Trauma 2018, 6, 20. [Google Scholar] [CrossRef] [PubMed] [Green Version]
  11. Feng, J.F.; Liu, J.; Zhang, L.; Jiang, J.Y.; Russell, M.; Lyeth, B.G.; Nolta, J.A.; Zhao, M. Electrical Guidance of Human Stem Cells in the Rat Brain. Stem Cell Rep. 2017, 9, 177–189. [Google Scholar] [CrossRef] [Green Version]
  12. Wu, S.Y.; Hou, H.S.; Sun, Y.S.; Cheng, J.Y.; Lo, K.Y. Correlation between cell migration and reactive oxygen species under electric field stimulation. Biomicrofluidics 2015, 9, 054120. [Google Scholar] [CrossRef] [PubMed] [Green Version]
  13. Zhao, Z.; Watt, C.; Karystinou, A.; Roelofs, A.J.; McCaig, C.D.; Gibson, I.R.; De Bari, C. Directed migration of human bone marrow mesenchymal stem cells in a physiological direct current electric field. Eur. Cells Mater. 2011, 22, 344–358. [Google Scholar] [CrossRef]
  14. Mobini, S.; Leppik, L.; Thottakkattumana Parameswaran, V.; Barker, J.H. In vitro effect of direct current electrical stimulation on rat mesenchymal stem cells. PeerJ 2017, 5, e2821. [Google Scholar] [CrossRef] [Green Version]
  15. Eischen-Loges, M.; Oliveira, K.M.C.; Bhavsar, M.B.; Barker, J.H.; Leppik, L. Pretreating mesenchymal stem cells with electrical stimulation causes sustained long-lasting pro-osteogenic effects. PeerJ 2018, 6, e4959. [Google Scholar] [CrossRef]
  16. Srirussamee, K.; Mobini, S.; Cassidy, N.J.; Cartmell, S.H. Direct electrical stimulation enhances osteogenesis by inducing Bmp2 and Spp1 expressions from macrophages and preosteoblasts. Biotechnol. Bioeng. 2019, 116, 3421–3432. [Google Scholar] [CrossRef]
  17. Balint, R.; Cassidy, N.J.; Hidalgo-Bastida, L.A.; Cartmell, S. Electrical stimulation enhanced mesenchymal stem cell gene expression for orthopaedic tissue repair. J. Biomater. Tissue Eng. 2013, 3, 212–221. [Google Scholar] [CrossRef]
  18. Nazari, F.; Parham, A.; Maleki, A.F. GAPDH, β-actin and β2-microglobulin, as three common reference genes, are not reliable for gene expression studies in equine adipose- and marrow-derived mesenchymal stem cells. J. Anim. Sci. Technol. 2015, 57, 18. [Google Scholar] [CrossRef] [Green Version]
  19. Jeon, R.-H.; Lee, W.-J.; Son, Y.-B.; Bharti, D.; Shivakumar, S.B.; Lee, S.-L.; Rho, G.-J. PPIA, HPRT1, and YWHAZ Genes Are Suitable for Normalization of mRNA expression in Long-Term Expanded Human Mesenchymal Stem Cells. Biomed Res. Int. 2019, 2019, 3093545. [Google Scholar] [CrossRef]
  20. Ayanoğlu, F.B.; Elçin, A.E.; Elçin, Y.M. Evaluation of the stability of standard reference genes of adipose-derived mesenchymal stem cells during in vitro proliferation and differentiation. Mol. Biol. Rep. 2020, 47, 2109–2122. [Google Scholar] [CrossRef] [PubMed]
  21. Quiroz, F.G.; Posada, O.M.; Gallego-Perez, D.; Higuita-Castro, N.; Sarassa, C.; Hansford, D.J.; Agudelo-Florez, P.; López, L.E. Housekeeping gene stability influences the quantification of osteogenic markers during stem cell differentiation to the osteogenic lineage. Cytotechnology 2010, 62, 109–120. [Google Scholar] [CrossRef] [PubMed] [Green Version]
  22. Vigano, M.; Orfei, C.P.; de Girolamo, L.; Pearson, J.R.; Ragni, E.; De Luca, P.; Colombini, A. Housekeeping Gene Stability in Human Mesenchymal Stem and Tendon Cells Exposed to Tenogenic Factors. Tissue Eng. Part C 2018, 24, 360–367. [Google Scholar] [CrossRef] [PubMed] [Green Version]
  23. James, S.; Fox, J.; Afsari, F.; Lee, J.; Clough, S.; Knight, C.; Ashmore, J.; Ashton, P.; Preham, O.; Hoogduijn, M.; et al. Multiparameter Analysis of Human Bone Marrow Stromal Cells Identifies Distinct Immunomodulatory and Differentiation-Competent Subtypes. Stem Cell Rep. 2015, 4, 1004–1015. [Google Scholar] [CrossRef] [PubMed] [Green Version]
  24. Andersen, C.L.; Jensen, J.L.; Ørntoft, T.F. Normalization of real-time quantitative reverse transcription-PCR data: A model-based variance estimation approach to identify genes suited for normalization, applied to bladder and colon cancer data sets. Cancer Res. 2004, 64, 5245–5250. [Google Scholar] [CrossRef] [Green Version]
  25. Pfaffl, M.W.; Tichopad, A.; Prgomet, C.; Neuvians, T.P. Determination of stable housekeeping genes, differentially regulated target genes and sample integrity: BestKeeper-Excel-based tool using pair-wise correlations. Biotechnol. Lett. 2004, 26, 509–515. [Google Scholar] [CrossRef]
  26. Li, X.; Yang, Q.; Bai, J.; Xuan, Y.; Wang, Y. Identification of appropriate reference genes for human mesenchymal stem cell analysis by quantitative real-time PCR. Biotechnol. Lett. 2015, 37, 67–73. [Google Scholar] [CrossRef] [PubMed] [Green Version]
  27. Schwaber, J.; Andersen, S.; Nielsen, L. Shedding light: The importance of reverse transcription efficiency standards in data interpretation. Biomol. Detect. Quantif. 2019, 17, 100077. [Google Scholar] [CrossRef] [PubMed]
  28. Sundaram, V.; Sampathkumar, N.; Massaad, C.; Grenier, J. Optimal use of statistical methods to validate reference gene stability in longitudinal studies. PLoS ONE 2019, 14, e0219440. [Google Scholar] [CrossRef] [Green Version]
  29. Jacob, F.; Guertler, R.; Naim, S.; Nixdorf, S.; Fedier, A.; Hacker, N.F.; Heinzelmann-Schwarz, V. Careful Selection of Reference Genes Is Required for Reliable Performance of RT-qPCR in Human Normal and Cancer Cell Lines. PLoS ONE 2013, 8, e59180. [Google Scholar] [CrossRef] [Green Version]
  30. Bustin, S.A.; Benes, V.; Garson, J.A.; Hellemans, J.; Huggett, J.; Kubista, M.; Mueller, R.; Nolan, T.; Pfaffl, M.W.; Shipley, G.L.; et al. The MIQE guidelines: Minimum information for publication of quantitative real-time PCR experiments. Clin. Chem. 2009, 55, 611–622. [Google Scholar] [CrossRef] [PubMed] [Green Version]
  31. Svec, D.; Tichopad, A.; Novosadova, V.; Pfaffl, M.W.; Kubista, M. How good is a PCR efficiency estimate: Recommendations for precise and robust qPCR efficiency assessments. Biomol. Detect. Quantif. 2015, 3, 9–16. [Google Scholar] [CrossRef] [Green Version]
  32. Thrivikraman, G.; Madras, G.; Basu, B. Electrically driven intracellular and extracellular nanomanipulators evoke neurogenic/cardiomyogenic differentiation in human mesenchymal stem cells. Biomaterials 2016, 77, 26–43. [Google Scholar] [CrossRef]
  33. Clark, C.C.; Wang, W.; Brighton, C.T. Up-regulation of expression of selected genes in human bone cells with specific capacitively coupled electric fields. J. Orthop. Res. 2014, 32, 894–903. [Google Scholar] [CrossRef]
  34. Ravikumar, K.; Boda, S.K.; Basu, B. Synergy of substrate conductivity and intermittent electrical stimulation towards osteogenic differentiation of human mesenchymal stem cells. Bioelectrochemistry 2017, 116, 52–64. [Google Scholar] [CrossRef]
  35. McCaig, C.D.; Rajnicek, A.M.; Song, B.; Zhao, M. Controlling Cell Behavior Electrically: Current Views and Future Potential. Physiol. Rev. 2005, 85, 943–978. [Google Scholar] [CrossRef] [PubMed] [Green Version]
  36. Ruzgys, P.; Novickij, V.; Novickij, J.; Šatkauskas, S. Influence of the electrode material on ROS generation and electroporation efficiency in low and high frequency nanosecond pulse range. Bioelectrochemistry 2019, 127, 87–93. [Google Scholar] [CrossRef] [PubMed]
  37. Tristan, C.; Shahani, N.; Sedlak, T.W.; Sawa, A. The diverse functions of GAPDH: Views from different subcellular compartments. Cell. Signal. 2011, 23, 317–323. [Google Scholar] [CrossRef] [PubMed] [Green Version]
  38. Bunnell, T.M.; Burbach, B.J.; Shimizu, Y.; Ervasti, J.M. β-Actin specifically controls cell growth, migration, and the G-actin pool. Mol. Biol. Cell 2011, 22, 4047–4058. [Google Scholar] [CrossRef]
  39. Kim, I.S.; Song, J.K.; Song, Y.M.; Cho, T.H.; Lee, T.H.; Lim, S.S.; Kim, S.J.; Hwang, S.J. Novel effect of biphasic electric current on in vitro osteogenesis and cytokine production in human mesenchymal stromal cells. Tissue Eng. Part A 2009, 15, 2411–2422. [Google Scholar] [CrossRef] [Green Version]
  40. Hu, W.W.; Hsu, Y.T.; Cheng, Y.C.; Li, C.; Ruaan, R.C.; Chien, C.C.; Chung, C.A.; Tsao, C.W. Electrical stimulation to promote osteogenesis using conductive polypyrrole films. Mater. Sci. Eng. C 2014, 37, 28–36. [Google Scholar] [CrossRef] [PubMed]
  41. Kwon, H.J.; Lee, G.S.; Chun, H. Electrical stimulation drives chondrogenesis of mesenchymal stem cells in the absence of exogenous growth factors OPEN. Nat. Publ. Gr. 2016, 6, 39302. [Google Scholar] [CrossRef]
  42. Qi, Z.; Xia, P.; Pan, S.; Zheng, S.; Fu, C.; Chang, Y.; Ma, Y.; Wang, J.; Yang, X. Combined treatment with electrical stimulation and insulin-like growth factor-1 promotes bone regeneration in vitro. PLoS ONE 2018, 13, e0197006. [Google Scholar] [CrossRef] [Green Version]
  43. Sun, S.; Liu, Y.; Lipsky, S.; Cho†, M. Physical manipulation of calcium oscillations facilitates osteodifferentiation of human mesenchymal stem cells. FASEB J. 2007, 21, 1472–1480. [Google Scholar] [CrossRef] [PubMed] [Green Version]
  44. Jing, W.; Zhang, Y.; Cai, Q.; Chen, G.; Wang, L.; Yang, X.; Zhong, W. Study of Electrical Stimulation with Different Electric-Field Intensities in the Regulation of the Differentiation of PC12 Cells. ACS Chem. Neurosci. 2019, 10, 348–357. [Google Scholar] [CrossRef]
  45. Cai, S.; Bodle, J.C.; Mathieu, P.S.; Amos, A.; Hamouda, M.; Bernacki, S.; Mccarty, G.; Loboa, E.G. Primary cilia are sensors of electrical field stimulation to induce osteogenesis of human adipose-derived stem cells. FASEB J. 2017, 31, 346–355. [Google Scholar] [CrossRef] [PubMed] [Green Version]
  46. Thrivikraman, G.; Madras, G.; Basu, B. Intermittent electrical stimuli for guidance of human mesenchymal stem cell lineage commitment towards neural-like cells on electroconductive substrates. Biomaterials 2014, 35, 6219–6235. [Google Scholar] [CrossRef]
  47. Nyoung Heo, D.; Acquah, N.; Kim, J.; Lee, S.-J.; Castro, N.J.; Zhang, L.G. Directly Induced Neural Differentiation of Human Adipose-Derived Stem Cells Using Three-Dimensional Culture System of Conductive Microwell with Electrical Stimulation. Tissue Eng. Part A 2018, 24, 537–545. [Google Scholar] [CrossRef]
  48. Zhang, J.; Li, M.; Kang, E.-T.; Neoh, K.G. Electrical stimulation of adipose-derived mesenchymal stem cells in conductive scaffolds and the roles of voltage-gated ion channels. Acta Biomater. 2016, 32, 46–56. [Google Scholar] [CrossRef]
  49. Piruzyan, M.; Shitanda, I.; Shimauchi, Y.; Okita, G.; Tsurekawa, Y.; Moriuchi, M.; Nakano, Y.; Teramoto, K.; Suico, M.A.; Shuto, T.; et al. A novel condition of mild electrical stimulation exerts immunosuppression via hydrogen peroxide production that controls multiple signaling pathway. PLoS ONE 2020, 15, e0234867. [Google Scholar] [CrossRef]
  50. Lee, G.S.; Kim, M.G.; Kwon, H.J. Electrical stimulation induces direct reprogramming of human dermal fibroblasts into hyaline chondrogenic cells. Biochem. Biophys. Res. Commun. 2019, 513, 990–996. [Google Scholar] [CrossRef]
  51. He, X.; Li, L.; Tang, M.; Zeng, Y.; Li, H.; Yu, X. Biomimetic electrical stimulation induces rat bone marrow mesenchymal stem cells to differentiate into cardiomyocyte-like cells via TGF-beta 1 in vitro. Prog. Biophys. Mol. Biol. 2019, 148, 47–53. [Google Scholar] [CrossRef] [PubMed]
  52. Guo, W.; Zhang, X.; Yu, X.; Wang, S.; Qiu, J.; Tang, W.; Li, L.; Liu, H.; Wang, Z.L. Self-Powered Electrical Stimulation for Enhancing Neural Differentiation of Mesenchymal Stem Cells on Graphene-Poly(3,4-ethylenedioxythiophene) Hybrid Microfibers. ACS Nano 2016, 10, 5086–5095. [Google Scholar] [CrossRef] [PubMed]
  53. Wang, Y.; Rouabhia, M.; Zhang, Z. Pulsed electrical stimulation benefits wound healing by activating skin fibroblasts through the TGFβ1/ERK/NF-κB axis. Biochim. Biophys. Acta Gen. Subj. 2016, 1860, 1551–1559. [Google Scholar] [CrossRef]
  54. Zhuang, H.; Wang, W.; Seldes, R.M.; David Tahernia, A.; Fan, H.; Brighton, C.T. Electrical Stimulation Induces the Level of TGF-beta1 mRNA in Osteoblastic Cells by a Mechanism Involving Calcium/Calmodulin Pathway. Biochem. Biophys. Res. Commun. 1997, 237, 225–229. [Google Scholar] [CrossRef]
  55. Hiemer, B.; Krogull, M.; Bender, T.; Ziebart, J.; Krueger, S.; Bader, R.; Jonitz-Heincke, A. Effect of electric stimulation on human chondrocytes and mesenchymal stem cells under normoxia and hypoxia. Mol. Med. Rep. 2018, 18, 2133–2141. [Google Scholar] [CrossRef] [PubMed] [Green Version]
Figure 1. Standard curves of the threshold cycle value (CT) versus the log of the total cDNA (ng) for the 6 potential reference genes considered in this study.
Applsci 12 00153 g001
Figure 2. Alamar Blue metabolic activity assay results for Y201 cells seeded at 5000, or 10,000 cells/cm2 on day 5 in either unstimulated (control) conditions, or under ES of 30 or 60 min per day (m/d). * p < 0.05 versus unstimulated control cells seeded at 10,000 cells/cm2; & p < 0.05 versus all three 10,000 cells/cm2 groups. N = 3 for controls, and N = 5 for ES groups. Statistical analysis performed by a two-way ANOVA, and Tukey’s multiple comparisons test.
Applsci 12 00153 g002
Figure 3. Gene expression of PPIA, 18S, and GAPDH normalized to YWHAZ and the unstimulated control group in Y201 cells under ES regimes of 30 and 60 min per day (m/d) at a seeding density of 10,000 cells/cm2. N = 2 for controls and n = 3 for both 30 m/d and 60 m/d ES groups. Statistical analysis performed by a two-way ANOVA for each gene, and Tukey’s multiple comparisons test.
Applsci 12 00153 g003
Figure 4. The NormFinder stability value results for the most stable gene across both unstimulated control cells and cells stimulated for 60 min per day. A separate NormFinder analysis was performed for cells seeded at (a) 5000 cells/cm2, and (b) 10,000 cells/cm2.
Applsci 12 00153 g004
Figure 5. Gene expression analysis performed using the ∆∆CT method in unstimulated controls (Control) and cells stimulated for 60 min per day (+ES). Expression is normalized to the control and to the gene determined to be the most stable for the respective seeding density by NormFinder. Each graph corresponds to the two seeding densities used: (a) 5000 cells/cm2, and (b) 10,000 cells/cm2. * p < 0.05 versus control of the same gene. Each gene was analyzed separately using an unpaired T-test; N = 2 for control, N = 3 for +ES group.
Applsci 12 00153 g005
Figure 6. Gene expression of YWHAZ in primary human bone marrow-derived MSCs stimulated for 30 and 60 min per day versus PPIA and the unstimulated control. N = 3 for all groups.
Applsci 12 00153 g006
Table 1. Forward and reverse sequences for the 6 primers used to identify the potential reference genes.
Gene NameForward SequenceReverse SequenceNo. of Transcript
Variants Detected,
(Total)
Peptidylprolyl isomerase A (PPIA)TGCTGGACCCAACACAAATGAACACCACATGCTTGCCATC2, (2)
Tyrosine 3-monooxygenase/tryptophan 5-monooxygenase activation protein, zeta
(YWHAZ)
CGAAGCTGAAGCAGGAGAAGTTTGTGGGACAGCATGGATG6, (6)
18S ribosomal RNA (18S)CTCAACACGGGAAACCTCACCGCTCCACCAACTAAGAACG1, (1)
Beta-2-microglobulin
(B2M)
TGGGTTTCATCCATCCGACAGCTTACATGTCTCGATCCCACT1, (1)
Glyceraldehyde-3-phosphate dehydrogenase
(GAPDH)
AAGGTCGGAGTCAACGGATTCTCCTGGAAGATGGTGATGG5, (6)
Beta-Actin
(ACTB)
CACAGAGCCTCGCCTTTGCCCATCACGCCCTGGTGC1, (1)
Table 2. Standard curve parameters and primer efficiencies of each potential reference gene.
Gene
Name
ReferenceProduct
Length
Slope
Efficiency
(%)
y-InterceptR2
Value
PPIANM_001300981.281−3.184106.1027.070.999
YWHAZNM_001135699.2 110−3.250103.0926.450.999
18SUniversal Probe
Library, 18S probe 77
114−3.184106.1015.670.999
B2MNM_004048.4219−3.311100.4626.690.997
GAPDHNM_001357943.2171−3.36798.1526.540.998
ACTBNM_001101.5189−3.49593.2527.720.999
Table 3. Pearson’s correlation coefficient (r) values for each potential reference gene pair as determined by BestKeeper.
Pearson’s Correlation
Coefficient (r)
Reference
Gene Pair
Seeding Density (Cells/cm2)AverageStandard Deviation
500010,000
PPIA:YWHAZ0.9790.9940.9870.0106
PPIA:B2M0.9900.9420.9660.0339
YWHAZ:18S0.9810.9120.9470.0488
PPIA:GAPDH0.9320.9570.9450.0177
YWHAZ:B2M0.9710.9140.9430.0403
PPIA:18S0.9570.8750.9160.0580
YWHAZ:GAPDH0.8420.9610.9020.0841
B2M:GAPDH0.9230.8220.8730.0714
18S:GAPDH0.8010.9560.8790.1096
18S:B2M0.9300.680.8050.1768
GAPDH:ACTB0.2310.9580.5950.5141
PPIA:ACTB−0.1110.8830.3860.7029
B2M:ACTB−0.1100.7230.3070.5890
YWHAZ:ACTB−0.2710.8690.2990.8061
18S:ACTB−0.3630.8800.2590.8789
Publisher’s Note: MDPI stays neutral with regard to jurisdictional claims in published maps and institutional affiliations.

