Abstract
Bone is a highly dynamic tissue characterized mainly by the interactions of osteoblasts and osteoclasts. When the healing ability of bone regeneration is disturbed, targeted biophysical stimulations such as electrical stimulation are applied. In this study the indirect effects of electrically stimulated human osteoblasts on osteoclastogenesis were investigated to better understand detailed cellular interactions. Therefore, two different cell developmental stages were examined: peripheral blood mononuclear cells (PBMCs) as precursors and pre-osteoclasts as differentiated cells. Previously, over a 21-day period, human osteoblasts were stimulated with a low-frequency alternating electric field. The supernatants were collected and used for an indirect co-culture of PBMCs and pre-osteoclasts. The cellular viability and the induction of differentiation and activity were analyzed. Further, the secretion of relevant osteoclastic markers was examined. Supernatants of 7 d and 14 d stimulated osteoblasts led to a decrease in the viability of PBMCs and an increased number of cells containing actin ring structures. Supernatants from osteoblasts stimulated over 7 d induced PBMC differentiation and pre-osteoclastic activation. Furthermore, pre-osteoclasts showed varying mRNA transcripts of MCP-1, ACP5, CA2, and CASP8 when cultivated with media from osteoblasts. Supernatants from day 21 did not influence PBMCs at all but increased the viability of pre-osteoclasts. We could show that different time points of stimulated osteoblasts have varying effects on the cells and that changes can be observed due to the differentiation stages of the cells. Through the effects of the indirect stimulation, it was possible to underline the importance of studying not only osteoblastic differentiation and mineralization behavior under electric stimulation but also analyzing changes in osteoclastogenesis and the activity of osteoclasts.
1. Introduction
Electrical stimulation is a frequently used medical application to treat different disorders in nerves, muscles, and cardiac tissue, and it can play an essential role in wound healing [1]. Since Fukada and Yasuda described the piezoelectric properties of bone, research has been conducted using externally applied electric fields to improve bone healing [2,3]. Animal studies and even clinical applications of electric stimulation devices revealed positive effects on bone regeneration; however, the fundamental cellular processes are still not fully understood [3,4].
There are different possibilities to apply electric fields, such as capacitive coupling, inductive coupling with pulsed electromagnetic fields (PEMF), and direct coupling. For the capacitive coupling, electrodes are placed outside of the tissue or the cell culture plate, avoiding possible side reactions with the environment. Due to the barriers between the stimulated cells and the electrodes, electrical signals are reduced, resulting in the need for high voltages. PEMF are applied by placing a conductive coil over the tissue of interest or the cell culture. While current flows through the coil, an electromagnetic field arises. The pulsed signals are used to mimic natural voltage potentials. The third type, often used in in vitro studies, is direct coupling. During direct stimulation, the electrodes are placed in contact with the tissue or cell culture medium [5,6]. Due to this direct contact, the biocompatibility of the materials used is essential. Furthermore, the direct current (DC) can lead to a rise in temperature, changes in the pH, the accumulation of charged proteins on the electrode, and harmful faradic by-products such as hydrogen peroxide and free metal ions from the used electrode [1,7,8]. Biphasic electrical stimulation such as alternating current (AC) can avoid these effects.
Several studies have already used alternating electric fields to stimulate osteoblasts, but little is known about the effect on osteoclastogenesis and osteoclast-like cells [7,9,10,11]. A balance between bone resorption through the activation of osteoclasts and bone formation through osteoblast activity is essential for bone regeneration [12,13]. Therefore, studies regarding the differentiation of macrophages and the activity and formation of osteoclasts under electrical fields are essential. Among the few studies regarding this issue, most use PEMF or sometimes direct stimulation with DC [14,15,16,17,18,19]. Stimulation via PEMF leads to a decrease in cell numbers, an increased apoptotic rate, and reduced osteoclast formation [14,16,19,20]. Stimulation with DC revealed different migration behaviors of osteoblasts and osteoclasts as they moved in opposite directions during stimulation [18]. There are no studies yet on the effects of direct alternating fields. The situation is similar regarding studies of the influence of electrical stimulation on macrophages generated out of peripheral blood mononuclear cells (PBMCs) and possible osteoclast precursors. Electrical stimulation is mainly performed with PEMF, and in some cases with DC, revealing both anti-inflammatory and pro-inflammatory effects with low-frequency electromagnetic field stimulation [21,22]. Furthermore, reduced proliferation, higher apoptosis rates, and altered migration behavior of macrophages were observed under PEMF and DC [23,24,25]. Due to the mentioned problem of monophasic stimulation, analyses with alternating electrical fields are necessary.
Studies regarding human macrophages and osteoclasts are as crucial as studies on osteoblasts in understanding fundamental bone remodeling processes under electric stimulation. Indirect and direct co-culture systems allow the investigation of the interaction and interplay between these cell types [26]. These cellular interactions could even be shown in an osteoid model, i.e., non-mineralized bone tissue [27]. In general, secreted cytokines and released factors modify the cell reaction of each cell type; thus, the crosstalk can change cell behavior in comparison to mono-cultured cells [28]. Shankar et al. revealed the importance of a co-culture system between osteoblasts and osteoclasts while observing the influence of PEMF [17]. Changes in differentiation and the bone-resorption capability of osteoclasts were observed after incubating cells with a medium derived from PEMF-stimulated osteocytes [29].
Therefore, in our present study, the effect of electrically stimulated human osteoblasts on osteoclast formation processes was investigated. The aim of our study was to gain a better understanding of the effects of cytokines released by electrically stimulated osteoblasts with alternating electric fields on osteoclastogenesis (Figure 1). Consequently, the indirect influence of electric stimulation on the viability and differentiation of PBMCs and osteoclast-progenitor cells was investigated. Study data should help to understand the activation of PBMCs and pre-osteoclasts in the periphery of electrically active bone implants by releasing cytokines from osteoblasts in direct proximity to the electrical field.
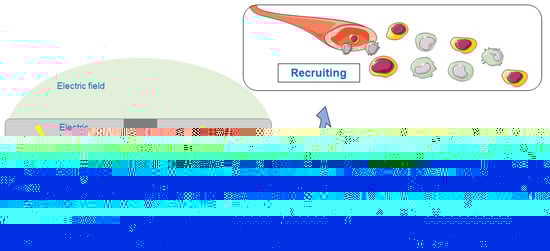
Figure 1.
Schematic overview of the study aim. Stimulated osteoblasts produce signaling molecules that influence osteoclastogenesis through recruiting and remodeling processes. Single pictures were used from Servier Medical Art (http://smart.servier.com/, accessed on 14 June 2022).
2. Materials and Methods
The setup used to analyze the indirect influence of electrically stimulated osteoblasts on osteoclastogenesis is shown in a graphical overview in Figure 2. A detailed description of each step can be found in the following sections.
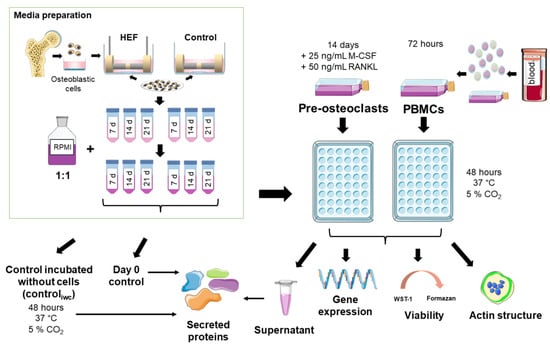
Figure 2.
Schematic overview of the used methods. Single pictures were used from Servier Medical Art (http://smart.servier.com/, accessed on 23 May 2022) or bioicons (https://bioicons.com/, 23 May 2022).
2.1. Electrical Stimulation of Human Primary Osteoblasts
Human primary osteoblasts were isolated, cultivated, and electrically stimulated for the experiments, as previously described by Sahm et al. [30]. In brief, spongiosa was isolated from femoral heads allocated from patients undergoing total hip replacement (registration number: A 2010-0010, approval date: 27 January 2017). After digestion with collagenase a and dispase (both: Roche, Basel; Switzerland), the cell suspension was purified through filtration and centrifugation steps. The cells were cultivated in a cell culture flask with Dulbecco’s Modified Eagle Medium without CaCl2 to increase proliferation (DMEM, PAN-Biotech, Aidenbach, Germany), containing 10% fetal calf serum (FCS, PAN-Biotech, Aidenbach, Germany), 1% amphotericin B, 1% penicillin-streptomycin, and 1% HEPES buffer (all: Sigma-Aldrich, Munich, Germany). Ascorbic acid (final concentration: 50 μg/mL), β-glycerophosphate (final concentration: 10 mM), and dexamethasone (final concentration: 100 nM) (all: Sigma-Aldrich, Munich, Germany) were added to bring cells to a similar stage of differentiation. The cells were kept in cell culture under standard cell culture conditions (5% CO2 and 37 °C) until the second passage and stored in liquid nitrogen until use.
For the electrical stimulation experiment, osteoblasts from seven different human donors (four females (age: 77.25 ± 2.21 years), three males (age: 73 ± 9.54 years)) were thawed and cultured for another passage at 37°C and 5% CO2. Rat tail collagen-coated coverslips (diameter: 15 mm, Neuvitro Corporation, Vancouver, WA, USA) were placed in a 6-well plate, and 30,000 cells were seeded on each coverslip. The cells adhered for 30 min, and 5 mL of cell culture medium (Dulbecco’s Modified Eagle Medium (DMEM w/o calcium)) was added with 10% fetal calf serum (FCS, both: PAN-Biotech, Aidenbach, Germany), 1% amphotericin B, 1% penicillin-streptomycin, and 1% HEPES buffer (all: Sigma-Aldrich, Munich, Germany) containing the osteogenic additives ascorbic acid (final concentration: 50 μg/mL), β-glycerophosphate (final concentration: 10 mM), dexamethasone (final concentration: 100 nM) (all: Sigma-Aldrich, Munich, Germany) and CaCl2 (final concentration: 1.8 mmol/L) for mineralization. An in vitro stimulation electrode was used, which was designed similarly to the clinically used ASNIS III s-series stimulation screw system [31,32]. The electrode consists of two 14 mm Ti6Al4V cylindrical electrodes separated by a 5 mm long insulator made of polyetheretherketone. The detailed stimulation protocol can be found as described by Sahm et al. [30]. The stimulation electrodes were placed in each well. In addition to the electrically stimulated osteoblasts (ESO), unconnected electrodes served as a control (non-stimulated osteoblasts—NSO). A sinusoidal signal with 0.7 Vrms and 20 Hz was applied 24 h after cell seeding using a Metrix GX 305 and GX310 function generator (Metrix Electronics, Bramley, Hampshire, UK). The distance between the electrode and the well bottom was 1 mm, which leads to an electric field of approximately 150 V/m in the cell medium and the well bottom under the center of the electrode [30]. The alternating current was applied 3 × 45 min/d with 225 min breaks between stimulations and a longer 855 min break between the last and the first new stimulation. This was performed to keep comparability with clinical studies [31]. The supernatant was collected and refreshed after 7, 14, and 21 days. The supernatant was collected 20 h after the last stimulation interval had started. It was centrifuged, pooled, and frozen for indirect stimulation.
2.2. Isolation and Differentiation of Peripheral Blood Mononuclear Cells
Peripheral blood mononuclear cells (PBMCs) were isolated from buffy coats from eight anonymous donors using SepMateTM-50 mL tubes and Histopaque®-107, following manufacturers’ instructions. The approval was obtained by the Local Ethical Committee (registration number: A2011-140, approval date: 24 November 2021). The generated cells were resuspended in Roswell Park Memorial Institute (RPMI) 1640 medium (PAN™-Biotech GmbH, Aidenbach, Germany) containing 10% fetal calf serum, 2% glutamine, and 1% penicillin-streptomycin. After seven days of culture in suspension cell culture flasks to increase the number of mononuclear cells (Greiner bio-one GmbH, Frickenhausen, Germany), the cells were harvested [33]. Nonadherent cells were transferred into a 50 mL centrifugation tube; adherent cells were incubated twice over 10–15 min with cold PBS and then gently scraped from the bottom of the flask. Cells were pooled, centrifuged at 120× g for 8 min, and counted with trypan blue. A total of 100,000 viable cells were plated in each well of a 48-well plate to form a monolayer on the bottom of the well. Each donor was divided into “PBMCs” and “pre-osteoclasts”.
2.3. Indirect Stimulation
For the experiments, PBMCs were cultured for 72 h until further use and osteoclasts were cultured for 14 d with the above-mentioned medium supplemented with 25 ng/mL Macrophage Colony-Stimulating Factor (M-CSF) and 50 ng/mL Receptor Activator of Nuclear Factor-ƘB Ligand (RANKL) (both: PreproTech EC, London, UK). Medium was refreshed for the “pre-osteoclasts” after 5 and 10 d.
To analyze the indirect influence of electric stimulation by released mediators, PBMCs and pre-osteoclasts were cultivated for 48 h with the supernatants of the stimulated osteoblasts over 48 h. The media from the ESO and the NSO were used after the stimulation time points of 7 d, 14 d, and 21 d. The pooled supernatants were mixed 1:1 with fresh RPMI 1640 containing 2% fetal calf serum, 2% glutamine, and 1% penicillin-streptomycin.
2.4. Cell Viability
To determine cell viability after 48 h, the supernatant was removed and replaced with a suspension of the water-soluble tetrazolium salt (WST-1, Roche GmbH, Grenzach-Wyhlen, Germany) in the medium. Therefore, the WST-1 reagent was diluted 1:10 with RPMI 1640 and transfused into the cells. Diluted WST-1 reagent without cells served as a blank. After an incubation time of 30 min at 37 °C and 5% CO2, 100 µL of the solution was transferred as duplicates into a 96-well plate. The color change was quantified using the Infinite 200 pro multimode plate reader (Tecan Group Ltd., Maennedorf, Switzerland) at a wavelength of 450 nm and a reference filter of 630 nm. The blank was subtracted from the values of each sample.
2.5. Actin-DAPI Staining
Fluorescence images were used to visualize the cell morphology and confirm the osteoclastic differentiation of the pre-osteoclasts via the formation of actin rings. After 48 h of incubation, cells were fixed with 4% paraformaldehyde (Grimm MED Logistik GmbH, Torgelow, Germany) for 10 min at room temperature (RT), washed with phosphate-buffered saline (PBS, Sigma-Aldrich Chemie GmbH, Taufkirchen, Germany), and permeabilized with 1:200 diluted Triton X (Merck KGaA, Darmstadt, Germany) for 5 min. After another rinsing step with PBS, Acti-stain™ 488 (Cytoskeleton, Inc., Denver, CO, USA) was diluted 1:140 with PBS to a concentration of 100 nM and transferred onto the cells. The cells were incubated in the dark for 30 min and washed 3 x with PBS afterward. The 4′,6-Diamidin-2-phenylin-dol (DAPI, Merck KGaA, Darmstadt, Germany) reagent was diluted 1:1000 with PBS, and cells were incubated with the solution for 5 min in the dark. A final rinse with PBS completed the staining process before the plates were stored at 4 °C, protected from light until further use. The images were captured using FITC (EX480/30, DM505, BA535/45) and DAPI (EX375/28, DM415, BA460/60) fluorescent filters with the Nikon Eclipse TS100 microscope and the Nikon digital sight DS-2Mv camera (all: Nikon GmbH, Duesseldorf, Germany). The superimposition of the images was performed with Gimp (GNU Image Manipulation Program).
2.6. Gene Expression Analysis
The gene expression of stimulated and unstimulated PBMCs and pre-osteoclasts was analyzed after 48 h incubation time. The RNA was extracted with the peqGOLD Total RNA Kit (VWR International GmbH, Darmstadt, Germany) following the manufacturer’s instructions. Cells were lysed with the lysis buffer, and the lysate of the corresponding duplicate determinations was placed together in one column. By adding 25 µL of 60 °C nuclease-free water (Carl Roth GmbH & Co. KG, Karlsruhe, Germany), the RNA was eluted by centrifugation for 2 min at the highest possible speed. RNA concentration was measured using the Tecan Reader Infinite® 200 Pro, and nuclease-free water was used to determine the blank value. The transcription of 150 ng RNA into complementary DNA (cDNA) was performed using the High Capacity cDNA Reverse Transcription Kit (Thermo Fisher Scientific, Waltham, MA, USA) following the manufacturer’s instructions. Afterward, all samples were diluted 1:1 with nuclease-free water and stored at −20 °C for further usage. Semi-quantitative reverse transcription-polymerase chain reaction (qPCR) was performed in duplicate using the innuMIX qPCR MasterMix SyGreen Kit (Analytik Jena, Germany). The primers used in this process are listed in Table 1. The results were evaluated using the delta-delta Ct (∆∆Ct) method [34]. HPRT served as a housekeeper gene, and the stimulated samples were related to the matching non-stimulated osteoclast control from the same time point.

Table 1.
Primer sequences for the genes of interest.
2.7. Quantification of the Secreted Proteins
Secreted tartrate-resistant acid phosphatase 5 b (TRAP5b), bone morphogenetic protein 2 (BMP2), cystatin C, interferon-β (IFN-β), interleukin 10 (IL-10), interleukin-17A (IL-17A), interleukin-1β (IL-1β), interleukin-4 (IL-4), interleukin-6 (IL-6), interleukin-23 (IL-23), osteopontin (OPN), free active transforming growth factor-β 1 (TGF-β1), and tumor necrosis factor-α (TNF-α) were analyzed out of the supernatant of each sample with a customized human BioLegend’s LEGENDplex™ multiplex assay (Biolegend, San Diego, CA, USA). Analysis was performed following the manufacturer’s instructions, and internal standards served to determine the concentration of each protein. The volume of used samples, standards, and kit reagents was adjusted to 15 µL. The samples and standards were incubated with the beads overnight. The multiplex assay was measured with a BD FACSVerse™ (Becton, Dickinson and Company, Franklin Lakes, NJ, USA).
To identify the initial concentration of the cytokines secreted by electrically stimulated osteoblasts, the supernatant used for stimulation was diluted 1:1 with RPMI medium, as explained in 3.3. The multiplex assay was measured directly with a BD FACSVerse™. Further, the diluted supernatant was incubated under standard cell culture conditions (5% CO2 and 37 °C) for 48 h and was then handled as the PBMC and pre-osteoclast samples. This measurement served as an internal control to validate the number of proteins that would be degraded during the 48 h incubation. The internal control was named “control incubated without cells” (controliwc).
The total protein content of each supernatant was determined to normalize the protein concentration measured with the LEGENDplex™ multiplex assay. Therefore, the supernatant was analyzed with the Invitrogen Qubit Protein Assay Kit and the Qubit fluorometer Q32857 (both: Thermo Fisher Scientific, Waltham, MA, USA) following manufacturer instructions. The quantification of the total protein content was ensured through included standards.
2.8. Display of the Data and Statistical Analysis
The statistical analysis was performed using GraphPad PRISM (GraphPad Software, San Diego, CA, USA). All experiments were conducted with eight replicates, each from a different donor. The ROUT method was used to identify any outliers. The analysis of the released proteins led to non-detectable amounts of protein for some donors for varying proteins. Therefore, and through the ROUT method, the number of replicates was reduced to n ≥ 7 for osteoclasts and n ≥ 6 for the PBMCs. The normal distribution was verified with the Shapiro–Wilk test. The two-way ANOVA with Tukey was used to compare the results of the electric stimulations among each other and with the control, as well as the different time points. p-values smaller than 0.05 were included as significant. The data were shown in boxplots and heat maps. Boxplots represented the median, the 25% and 75% quartile, and whiskers for indicating minimum and maximum.
3. Results
3.1. Initial Concentration of Cytokines in the Supernatants
The indirect influence of electric stimulation was analyzed using PBMCs and pre-osteoclasts. The supernatants of electrically stimulated osteoblasts (ESO) and non-stimulated osteoblasts (NSO) were collected after 7 d, 14 d, and 21 d, pooled, and used for the stimulation. The supernatants were diluted 1:1 with RPMI, as described in Section 2.3.
The concentration of possible mediators released by human osteoblasts that might affect the PBMCs and pre-osteoclasts was analyzed before incubating the diluted supernatant with the cells. The protein concentrations of BMP-2, cystatin C, IFN-β, IL-10, IL-1β, IL-6, OPN, TGF-β1, and TNF-α were determined via LEGENDplex™ multiplex assay. No signal was detectable for BMP-2, cystatin C, IL-1β, and OPN. The concentrations for TNF-α, IL-6, IL-10, IFN-β, and TGF-β1 are shown in Table 2. The highest concentration of TNF-α was detectable with the ESO for all time points: about twice as high as with the NSO. The amount of IL-6 rose in the ESO supernatants constant over time. The IL-6 concentration for the NSO peaked at 14 d. IL-10, IFN-β, and TGF-β1 were not detectable for all time points. IL-10 was just determined for 14 d ESO, 7 d NSO, and 21 d NSO. IFN-β was determined for ESO only at 14 d. The IFN-β concentration in the control varied between the stimulation times, with the highest amount at 21 d. The TGF-β1 concentration was only measurable in HEF after 21 d whereas, for the control, it was also measurable at 7 d.
Table 2.
Protein concentration of the pooled supernatants of electrically stimulated osteoblasts (ESO) and non-stimulated osteoblasts (NSO) after 7, 14, and 21 days.
3.2. Influence of Conditioned Osteoblastic Supernatants on Peripheral Blood Mononuclear Cell (PBMC)
3.2.1. Morphology and Viability
Different cell morphologies were expressed in PBMC cell cultures by treatment with various supernatants. Smaller and larger cell morphologies were seen in all stimulation groups, reflecting the different cell types of PBMCs. A few cells with a green actin ring structure were observed at all stimulation time points with ESO. The NSO showed fewer actin rings on days 7 and 14; stimulation with the 21 d control medium led to a rise in the number of cells with ring structures (Figure 3a,b).
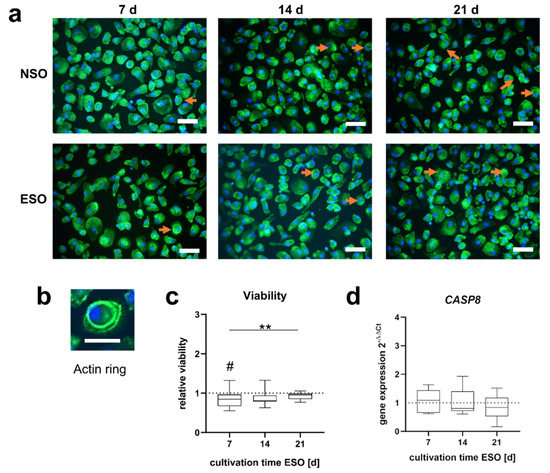
Figure 3.
Morphology and viability of PBMCs after 48 h incubation with pooled supernatant of osteoblast stimulated over 7, 14, and 21 d (ESO) and without electric stimulation (NSO). (a) Morphology of PBMCs. The actin skeleton is visualized in a green color and the nucleus in blue. Cells with an actin ring structure are highlighted with an orange arrow. The scale bar measures 50 µm. (b) PBMC with an actin ring. The scale bar measures 20 µm. (c) The viability of ESO PBMCs related to the viability of NSO PBMCs. Significant differences were determined using the two-way ANOVA with Tukey. # indicates significant differences between the stimulated and control groups: # p < 0.05. * indicates significant differences between stimulation time points: ** p <0.01 [n = 8]. (d) CASP8 gene expression data with ESO related to NSO PBMCs using the 2−∆∆Ct method. Significant differences were determined using the two-way ANOVA with Tukey [n = 8].
The viability of PBMCs was influenced by indirect stimulation (Figure 3c). The supernatant of ESO obtained after 7 and 14 d reduced the viability of PBMCs compared to the unstimulated control. This reduction was significant after 7 d (p = 0.036) and not significant after 14 d (p = 0.062). After 21 d of stimulation, the medium had no impact on viability. The rise in viability from 7 d to 21 d was significant (p = 0.042) as well. No significant changes were observed in the CASP8 gene expression (Figure 3d).
3.2.2. Gene Expression
The gene expression of PBMCs stimulated with osteoblastic cell culture supernatants was analyzed for RANK, ACP5, CTSK, CA2, and MMP9. RANK was significantly higher with the 14 d supernatant compared to the 21 d (p = 0.017). ACP5 was significantly enhanced while using the 7 d (p = 0.025) and 14 d (p = 0.025) supernatants of the ESO compared to the 21 d supernatant (Figure 4a). A similar trend was observable for CTSK and MMP9. CTSK was significantly upregulated with the 7 d ESO supernatant (p = 0.042), slightly upregulated with 14 d, and unaffected with 21 d. MMP9 gene expression showed an upward trend with 7 d and a downward trend with 21 d. The supernatants did not significantly influence the gene expression of CA2 for ESO (Figure 4a).
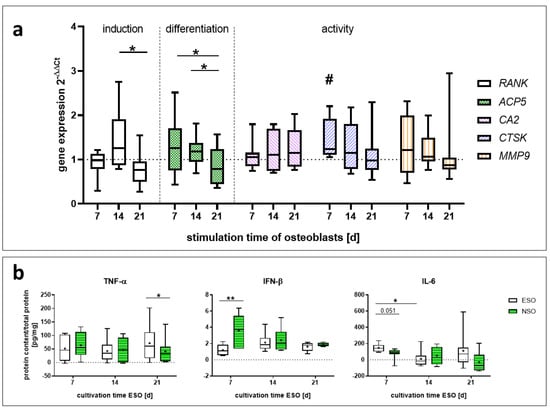
Figure 4.
Gene expression and protein data of PBMCs after 48 h incubation with pooled supernatant of osteoblast (ESO) stimulated over 7, 14, and 21 d and without electric stimulation (NSO). (a) Gene expression data were related to the NSO using the 2−∆∆Ct method. Boxplots are used to present the distribution of the total results with significant changes [n = 8]. Significant differences were determined using the two-way ANOVA with Tukey. # indicates significant differences between ESO and NSO cultivation: # p < 0.05. * indicates significant differences between stimulation time points: * p < 0.05. (b) The protein concentration was related to the total protein concentration of the supernatant of each sample. Afterward, the respective protein concentration from the controliwc was subtracted. Boxplots are used to present the distribution of the total results [n ≥ 6]. Significant differences were determined using the two-way ANOVA with Tukey. * indicates significant differences: * p < 0.05, ** p < 0.01.
3.2.3. Released Mediators
The amounts of released TRAP5b, BMP-2, cystatin C, IFN-β, IL-1β, -4, -6, -10, -17A, -23, OPN, TGF-β1, and TNF-α were analyzed for PBMCs stimulated with ESO and NSO, and the controliwc. The concentration of the controliwc was subtracted from the concentration of the cultivated PBMCs.
No proteins could be detected for IL-1β, -4, -17A-23, and BMP-2. For OPN, cystatin C, TRAP5b, IL-10, and TGF-β1, no significant changes in the protein concentration could be determined (Figure S1). The concentration of released TNF-α was not influenced by the 7 d and 14 d media (Figure 4b). The 21 d medium led to an increased amount with the ESO compared to the NSO (p = 0.015). IFN-β was downregulated for the 7 d medium (p = 0.0055). Later stimulation times did not influence the IFN-β release. New IL-6 was mainly produced by cells stimulated with the 7 d medium. The 7 d medium led to an increase in IL-6 compared to the NSO (p = 0.051) and the 14 d ESO (p = 0.023). The additional stimulation times 14 d and 21 d did not affect the IL-6 concentration (Figure 4b).
3.3. Influence of Conditioned Osteoblastic Supernatants on Pre-Osteoclasts
3.3.1. Morphology and Viability
The morphology of the pre-osteoclasts was visualized through staining of the actin cytoskeleton (Figure 5a,b). The cells were mainly round-shaped and larger than PBMCs. Some cells showed a more intense green glowing actin ring structure. Multinuclear cells with more than three nuclei could not be observed.
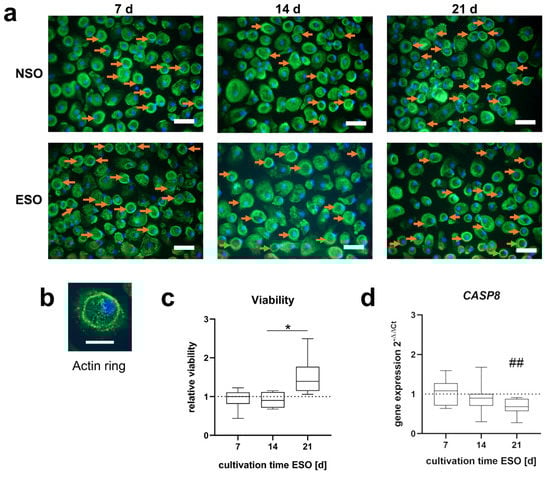
Figure 5.
Morphology and viability of pre-osteoclasts after 48 h incubation with pooled supernatant of osteoblast stimulated over 7, 14, and 21 d (ESO) and without electric stimulation (NSO). (a) The morphology of PBMCs shows mostly round cell shapes. The actin skeleton is visualized in a green color and the nucleus in blue. Cells with an actin ring structure are highlighted with an orange arrow. The scale bar measures 50 µm. (b) Pre-osteoclast with an actin ring. The scale bar measures 20 µm. (c) The viability of pre-osteoclasts related to the viability of the control. Significant differences were determined using the two-way ANOVA with Tukey, * indicates significant differences between stimulation time points: * p <0.05 [n = 8]. (d) CASP8 gene expression data with ESO related to NSO PBMCs using the 2−∆∆Ct method. Significant differences were determined using the two-way ANOVA with Tukey, # indicates significant differences between the stimulated and control groups: ## p < 0.01 [n = 8].
The 7 d and 14 d media of the stimulated osteoblasts did not influence the viability of the pre-osteoclasts. With the 21 d supernatant, the viability rose compared to 7 d and 14 d. The rise in viability from 14 d to 21 d was significantly higher (p = 0.012) (Figure 5c). The CASP8 expression was reduced with the further stimulation time of the ESO. On day 21 CASP8 was significantly downregulated compared to NSO (p = 0.006) (Figure 5d).
3.3.2. Gene Expression
The gene expression of RANK, ACP5, CTSK, CA2, and MMP9 was determined to analyze the influence of released osteoblastic mediators on pre-osteoclastic differentiation and activity (Figure 6a). The 14 d and 21 d supernatants from ESO led to a downregulation of ACP5, which was significant for 14 d (p = 0.034). RANK, CA2, CTSK, and MMP9 were upregulated with the medium of 7 d stimulated osteoblasts and downregulated with 14 d and 21 d media. RANK and CTSK did not significantly change. The expression of CA2 was upregulated with 7 d medium and dropped significantly compared to 14 d (p = 0.0012) and 21 d (p = 0.054). CA2 was downregulated compared to the control with 21 d (p = 0.032). MMP9 was significantly upregulated with 7 d ESO compared to the control (p = 0.0462) and dropped when compared to 14 d (p = 0.0241) and 21 d (p = 0.0469). In addition, the gene expression of the recruiting marker monocyte chemoattractant protein (MCP1) was analyzed (Figure S2). A significant increase in the MCP1 gene expression could be detected with the 7 d ESO (p = 0.0455).
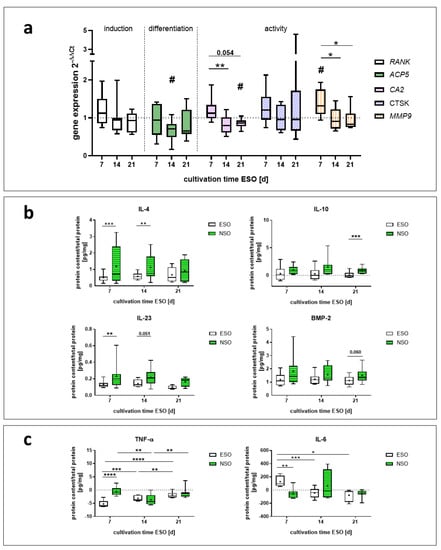
Figure 6.
Gene expression and protein data of pre-osteoclasts after 48 h incubation with pooled supernatant of osteoblast (ESO) stimulated over 7, 14, and 21 d and without electric stimulation (NSO). (a) Gene expression data were related to the NSO using the 2−∆∆Ct method. Boxplots are used to present the distribution of the total results with significant changes [n = 8]. Significant differences were determined using the two-way ANOVA with Tukey. # indicates significant differences between the ESO and NSO: # p < 0.05. * indicates significant differences between stimulation time points: * p <0.05. (b, c) Protein concentration related to the total protein concentration of the supernatant. The respective protein concentration from the controliwc was subtracted. Boxplots are used to present the distribution of the total results [n ≥ 6]. Significant differences were determined using the two-way ANOVA with Tukey. * indicates significant differences: * p < 0.05, ** p < 0.01, *** p < 0.001, **** p < 0.0001. (b) Proteins that were produced by the pre-osteoclasts (c) proteins that were consumed by the pre-osteoclasts.
3.3.3. Released Mediators
The release of TRAP5b, BMP-2, cystatin C, IFN-β, IL-1β, -4, -6, -10, -17A, -23, OPN, TGF-β1, and TNF-α were analyzed for the pre-osteoclasts stimulated with ESO and NSO, and the controliwc. The concentration of the controliwc was subtracted from the concentration of the cultivated pre-osteoclasts. The data for IFN-β are not shown as no proteins could be detected.
The different stimulation conditions did not significantly influence the concentration of IL-1β, OPN, cystatin C, TRAP5b, TGF-β1, and IL-17A (Figure S3). For TNF-α and IL-6 lower amounts of proteins were detected after the stimulation with pre-osteoclasts compared to the incubated medium without any cells (controliwc). As the protein concentrations of the controliwc were subtracted from the protein concentrations of the sample, negative concentrations are shown (Figure 6c).
The concentration of IL-4 was downregulated by 7 d, 14 d, and 21 d ESO media compared to NSO. This downregulation was significant for 7 d (p = 0.0008) and for 14 d (p = 0.0087). A similar trend was observed for IL-10, IL-23, and BMP-2. The IL-10 concentration was downregulated with 7 d and 14 d ESO media and significantly downregulated for 21 d compared to the NSO (p = 0.0002). For IL-23, differences between the ESO and the control were the most pronounced after 7 d (p = 0.008) and slighter at 14 d (p = 0.051) and 21 (p = 0.08). The concentration of BMP-2 was mainly changed through indirect stimulation with the 21 d medium. BMP-2 was reduced with the ESO supernatant (p = 0.059) compared to the NSO (Figure 6b).
For TNF-α, the lowest protein amount was detected for the cultivation with 7 d ESO supernatant compared to the NSO (p < 0.0001). With 14 d and 21 d, no changes between the ESO and NSO were observed. IL-6 was mainly regulated by the 7 d supernatant; stimulation with ESO led to a significant upregulation of IL-6 compared to NSO (p = 0.0036). Media generated after 14 d and 21 d stimulation did not affect the IL-6 release (Figure 6c).
4. Discussion
The tailoring of bone remodeling processes through external stimulation is essential for the treatment of osteoporosis, critical-size bone defects, and poorly ingrown artificial joints. Electric stimulation with externally applied electrical fields is one possible treatment method. Positive results have been observed in clinical use in the past, but open questions remain regarding the cellular processes [35]. Various in vitro studies focus on the influence of electric fields on the differentiation of osteoblasts and their bone-forming potential [3]. However, bone healing depends not only on the bone formation capacity of the osteoblast. Bone resorption processes through osteoclasts play an essential role in bone turnover and fracture healing.
Co-cultures between osteoblasts and osteoclasts are essential to verify cellular behavior and interaction, as differences between cells in co-culture and cells in monoculture have been noted [28,36]. Consequently, they improve the comparability of in vitro studies with in vivo studies [37]. The system used in this study gives the first insights into how released cytokines from osteoblasts can influence osteoclastogenesis. With the exchange of the supernatant of stimulated osteoblasts, a study focused on the changes in osteoclast formation, differentiation, and activity through indirect stimulation was possible. However, this study can only make assumptions about the impact on osteogenesis through the feedback of the osteoclasts. Further studies using a trans-well system or 3D scaffolds are important to include the direct exchange and feedback of the cells. Nevertheless, results obtained in this study revealed indirect effects of ESO (Figure 7): (I) Electrical stimulation of osteoblasts resulted in the release of various cytokines that influence osteoclastic differentiation and activation. They respond with an additional release of pro-and anti-inflammatory cytokines. (II) The viability of PBMCs is most influenced by the supernatants from the ESO of the two earlier time points. At the same time, osteoclastogenesis is induced in the cells. (III) Pre-osteoclasts revealed an increased activity when cultivated with 7 d medium, and ESO supernatants at day 21 led to higher viability.
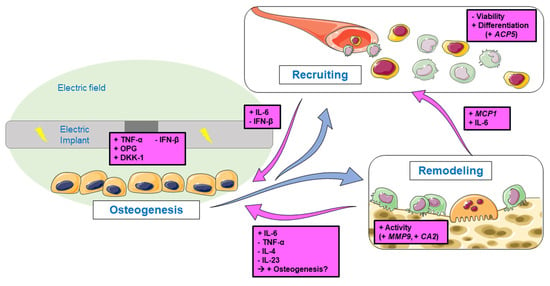
Figure 7.
Schematic overview of the aims and results of this study. Stimulated osteoblasts produce signaling molecules that influence osteoclastogenesis through recruiting and remodeling processes. The observed changes in gene expression and protein release of the progenitor cells and osteoclasts-like cells are shown in pink. Single pictures were used from Servier Medical Art (http://smart.servier.com/, accessed on 14 June 2022).
4.1. Differentiation of PBMCs
Monocytes as well as macrophages play an important role in inflammation, homeostasis, tissue development, and injury repair [38]. They have the potential to differentiate into osteoclasts. Therefore, understanding their differentiation potential is important for further information on bone remodeling processes [39]. This study focused on the impact of indirect stimulation with ESO on the induction of PBMC differentiation into osteoclasts. It was possible to initiate osteoclastic differentiation of PBMCs without the external differentiation factors M-CSF and RANKL [28] by using supernatants from stimulated osteoblasts. A higher number of osteoclast-like cells were seen with 7 d and 14 d ESO media, and an increase in ACP5 gene expression could be observed. Further, a significant upregulation in CTSK gene expression could be observed with the 7 d medium, a gene that is an important marker for the activity of osteoclastic cells [40]. As no major changes in the RANK gene expression were noticeable, it can be assumed that RANKL was not the key factor for the induced osteoclastogenesis. Studies have shown that other mediators such as TNF-α, TGF-β, and IL-33 have the potential to enhance osteoclast differentiation in the absence of the RANK-RANKL pathway [41,42,43]. In this study, TNF-α was doubled in the ESO supernatants; thus, the differentiation through TNF-α can be assumed [41,44,45]. Further, Lei et al. revealed the inhibition of RANKL-induced osteoclastogenesis in directly electrically stimulated macrophages, which would underline the assumption of a RANKL-independent differentiation observed in this study [20]. Another argument supporting the hypothesis is the IFN-β concentration, as IFN-β is an anti-osteoclastogenic cytokine [46]. The highest amount of released IFN-β was detectable in PBMCs cultivated with the 7 d NSO medium. Comparing the protein concentration of ESO and NSO proves that, especially after seven days, the presence of osteoclastic antagonists such as IFN-β and IL-10 were present in the NSO medium, but not in the ESO medium. IL-10, like IFN-β, is known for its possible role in inhibiting osteoclast formation [47]. Vice versa, the induction of ACP5 and CTSK mRNA transcripts in PBMCs cultivated with the 7 d ESO medium correlates with the absence of IFN-β and IL-10 proteins. Although the anti-osteoclast mediators IL-10 and IFN-β were detectable in the ESO medium after 14 days, the induction of the osteoclastic differentiation and activity markers was still demonstrated. However, besides the presence of higher IL-6 protein concentrations, the clearly enhanced concentration of the TNF-α protein in particular seemed to be more inductive for osteoclastogenesis. Although IFN-β and IL-10 were no longer detectable in the 21 d ESO medium, the composition of the medium did not affect osteoclastogenesis. This could be due to the presence of other mediators in the medium, which we did not consider in our setup. However, in our previous work, we could show that, especially on day 21, the highest mineralization of osteoblasts was detectable following stimulation with alternating electric fields [30]. Since osteoclastogenesis is particularly inhibited by enhanced calcium ion levels [48] the accumulation of calcium in the 21 d ESO medium might have a greater inhibitory effect on osteoclastogenesis than the ESO media of the earlier time points.
4.2. Activation of Pre-Osteoclasts
Osteoclasts are the major antagonists for osteoblasts, and their interplay is essential for bone turnover and remodeling [36]. On the one hand, excessive activity of osteoclasts can lead to diseases such as osteoporosis, periprosthetic osteolysis, or bone tumors; on the other hand, reduced activity can lead to osteopetrosis [49]. Therefore, studying osteoclastic cell behavior under electric stimulation is important to understand bone remodeling processes. Before the pre-osteoclast cells were incubated with the specific osteoblast supernatants, they were first stimulated with RANKL and M-CSF. Both are essential factors that induce and promote osteoclastogenesis in vitro [50]. The subsequent change of cell culture conditions with the osteoblast media was intended to clarify whether the factors secreted by osteoblasts can maintain osteoclastogenesis.
As for the PBMCs, most of the changes were observed with the 7 d medium. MMP9 and CA2 were upregulated in pre-osteoclasts cultured with the ESO supernatant compared to the NSO. MMP9 plays an important role in bone resorption processes and remodeling by degrading the organic matrix and releasing the extracellular matrix proteins [51]. Oliveria et al. reported an upregulation of MMP9 during the improved healing process of an amputated rat limb through electric stimulation [52]. This highlights the importance of MMP9 and its role as a marker for osteoclastogenesis through electric stimulation. CA2 is important for bone resorption as it regulates the pH through H+ production, leading to an acidification of the extracellular environment [53]. The simultaneous upregulation of MMP9 and CA2 indicates an increased induction of osteoclast activity through the cultivation with 7 d ESO supernatants. This increase in activity can be related, as explained before, to the increased TNF-α concentration in the ESO medium compared to the NSO medium. Further, the medium of the NSO contained a higher concentration of the osteoclastic antagonists IFN-β and IL-10. This could have led to the higher activity of the pre-osteoclasts which were cultured with the ESO medium compared to the cells cultured with the NSO medium. In addition, a higher IL-6 protein release and MCP1 expression were observed. IL-6 is known to trigger the expression of MCP-1 in cells, and the resulting higher MCP-1 expression may, in turn, further increase osteoclastogenesis [54,55,56], resulting in the enhanced recruitment of monocytic cells through the 7 d ESO supernatant. It can be postulated that the stimulation with electric fields alters the osteoblastic secretion of proteins, which in turn influence the differentiation and activity of osteoclastic cells and therefore affect remodeling processes. This fact might be more marked at the earlier stimulation time points than the later ones, as the induction and the maintenance of osteoclastogenesis were more prominent with 7 d ESO medium.
It was not possible to generate multinuclear osteoclasts through the pre-stimulation or through the cultivation with the ESO or NSO media. To improve the outcome in the generation of osteoclasts, the usage of mineralized surfaces or scaffolds can be implemented. Through the cultivation on apatite-containing materials, osteoclastogenesis is enhanced and more robust sealing zones are formed compared to the cultivation on plastic [57]. Further, resorption pits, as results from osteoclast activity, can be used to make assumptions about the resorption activity [57,58,59].
4.3. Influence on Cell Viability during Osteoclastogenesis
The ESO supernatants influenced the viability of both PBMCs and pre-osteoclasts. Thereby, the 7 d and 14 d ESO supernatants led to different changes in viability compared to the 21 d supernatants. The 7 d and 14 d supernatants reduced the viability of cultivated PBMCs but did not influence pre-osteoclasts. Supernatants from day 21 did not change PBMCs’ viability but increased the viability of pre-osteoclasts. This reveals a cell stage-dependent influence on the viability through the released cytokines and chemokines from stimulated osteoblasts. PBMCs consist of multipotent progenitor cell populations with a high capacity to differentiate into different cell types [60]. In addition to this differentiation potential, PBMCs as precursors have a higher proliferation capacity than already differentiated cells [61]. ESO supernatants of 7 d and 14 d increased the differentiation potential of PBMCs compared to the fewer-differentiated cells cultivated with NSO. It is possible that the enhanced differentiation reduced the viability of the cells. This assumption can be strengthened by the reduced differentiation with 21 d and the simultaneous unchanged viability. Further investigations are necessary to confirm this assumption.
Compared to the PBMCs, the pre-osteoclasts were further differentiated, as actin ring structures were observed in all cultivation conditions. The 21 d supernatants did not enhance the osteoclasts’ activation or differentiation but increased the viability of the cells. Further, the CASP8 gene expression was downregulated by the 21 d supernatant. As CASP8 is known to be an initiator for apoptosis, reduced apoptosis can be assumed, leading to higher viability [62]. Cell cycle analysis and live dead assays can provide further information about cell viability. Especially the cell cycle analysis can reveal the proliferation possibilities and provide more details on the differentiation state of the cells [61]. Moreover, other possible cytokines could have influenced the proliferation rate. Therefore, a more comprehensive screening of the ESO supernatant can be implemented to increase the understanding of stimulation factors released from osteoblasts under electric stimulation.
4.4. Feedback Signaling on Osteogenesis and Bone Remodeling
Due to the differentiation and activation of PBMCs and pre-osteoclasts, feedback signals are assumed. Compared to the NSO media, lower amounts of IL-4, IL-23, and TNF-α were observed in the supernatants of pre-osteoclasts cultivated with ESO media. These proteins are known for their anti-osteoclastogenic properties, leading to reduced osteoblastic differentiation and activity [63,64]. As electric stimulation indirectly reduced the amount of released IL-4, IL-23, and TNF-α, promoting feedback on osteoblasts can be expected. The increase in IL-6 concentration supports this assumption, as IL-6 is known to be important for osteogenesis [65,66,67]. Moreover, a rise in IL-6 can also improve the recruitment of new osteoclastic progenitors, as it can act as a proinflammatory signal [68,69]. The analyzed BMP-2 concentration is in contrast to the previous hypotheses, as lower amounts of BMP-2, an inducer of osteoblast differentiation [70], were observed with ESO. Further studies on osteogenesis are necessary to observe the impact of the released cytokines. It can be expected that the indirect stimulation of PBMCs and pre-osteoclasts influences bone remodeling processes.
Therefore, analyses of the interaction between progenitor cells, osteoclasts, and osteoblasts are necessary. Co-cultures such as trans-well systems or 3D scaffolds would allow the observation of feedback signals and the resulting changes in cell differentiation simultaneously [71]. Moreover, 3D scaffolds with a matrix that is similar to bone tissue would give a more physiological environment and allow the study of osteoblastic and osteoclastic cells together in one culture setup. Further, it has been described that exosomes and apoptotic bodies as osteoclast-derived extracellular vesicles can carry different miRNAs, which can influence osteogenesis [72]. Therefore, a protein screening of the supernatant as well as the determination of extracellular vesicles might give a more detailed insight into the signaling and interplay between the different cell types.
5. Conclusions
The application of external electric fields is a method that is used to improve bone healing, but there are still open questions regarding the fundamental cellular mechanisms and how to improve clinical outcomes. For this reason, we have postulated the following question: Is there an influence of electrically stimulated osteoblasts on the induction of osteoclastogenesis? It could be shown that electrically stimulated human osteoblasts release signaling factors in a time-dependent manner which affects the viability, differentiation, and activity of PBMCs and pre-osteoclasts. In this context, different stimulation times of osteoblasts led to different cell responses in both PBMCs and pre-osteoclasts. Further studies with direct co-culture systems are necessary to understand the effect of electrical stimulation on osteoblasts and osteoclasts simultaneously and how their interaction affects cell behavior.
Supplementary Materials
The following supporting information can be downloaded at: https://www.mdpi.com/article/10.3390/app122211840/s1, Figure S1: Released cytokines of PBMCs after 48 h incubation with pooled supernatant of osteoblast stimulated over 7, 14, and 21 d and without electrical stimulation, Figure S2: MCP1 expression of pre-osteoclasts after 48 h incubation with pooled supernatant of osteoblast stimulated over 7, 14, and 21 d and without electrical stimulation, Figure S3: Released cytokines of pre-osteoclasts after 48 h incubation with pooled supernatant of osteoblast stimulated over 7, 14, and 21 d and without electrical stimulation.
Author Contributions
Conceptualization: F.S. and A.J.-H.; methodology: A.J. and F.S.; resources: A.J.-H. and R.B.; data curation: A.J. and F.S.; writing—original draft preparation: F.S.; writing—review and editing: A.J., A.J.-H., R.D. and R.B.; visualization: A.J. and F.S.; supervision: A.J.-H., R.D. and R.B.; project administration: A.J.-H.; funding acquisition: A.J.-H. and R.D. All authors have read and agreed to the published version of the manuscript.
Funding
Funded by the Deutsche Forschungsgemeinschaft (DFG, German Research Foundation): JO 1483/1-1 and CRC ELAINE 1270/2-299150580.
Institutional Review Board Statement
The study was conducted in accordance with the Declaration of Helsinki and approved by the Institutional Ethics Committee of Rostock University Medical Centre (registration number: A 2010-0010, approval date: 27 January 2017; registration number: A2011-140, approval date: 24 November 2021).
Informed Consent Statement
Informed consent was obtained from all subjects involved in the study.
Data Availability Statement
The datasets generated during the current study are available from the corresponding author on reasonable request.
Acknowledgments
We gratefully acknowledge Doris Hansmann and Simone Krüger from the department of Orthopedics (Rostock University Medical Center) as well Wendy Bergmann and Michael Müller from the Core Facility for Cell Sorting and Cell Analysis (Rostock University Medical Center) for their technical support.
Conflicts of Interest
The authors declare no conflict of interest. The funders had no role in the design of the study; in the collection, analyses, or interpretation of data; in the writing of the manuscript; or in the decision to publish the results.
References
- Balint, R.; Cassidy, N.J.; Cartmell, S.H. Electrical Stimulation: A Novel Tool for Tissue Engineering. Tissue Eng. Part. B Rev. 2013, 19, 48–57. [Google Scholar] [CrossRef] [PubMed]
- Fukada, E.; Yasuda, I. On the Piezoelectric Effect of Bone. J. Phys. Soc. Japan 1957, 12, 1158–1162. [Google Scholar] [CrossRef]
- deVet, T.; Jhirad, A.; Pravato, L.; Wohl, G.R. Bone Bioelectricity and Bone-Cell Response to Electrical Stimulation: A Review. Crit. Rev. Biomed. Eng. 2021, 49, 1–19. [Google Scholar] [CrossRef] [PubMed]
- Ryan, C.N.M.; Doulgkeroglou, M.N.; Zeugolis, D.I. Electric Field Stimulation for Tissue Engineering Applications. BMC Biomed. Eng. 2021, 3, 1. [Google Scholar] [CrossRef] [PubMed]
- Chen, C.; Bai, X.; Ding, Y.; Lee, I.-S. Electrical Stimulation as a Novel Tool for Regulating Cell Behavior in Tissue Engineering. Biomater. Res. 2019, 23, 25. [Google Scholar] [CrossRef]
- Griffin, M.; Bayat, A. Electrical Stimulation in Bone Healing: Critical Analysis by Evaluating Levels of Evidence. Eplasty 2011, 11, e34. [Google Scholar]
- Ercan, B.; Webster, T.J. The Effect of Biphasic Electrical Stimulation on Osteoblast Function at Anodized Nanotubular Titanium Surfaces. Biomaterials 2010, 31, 3684–3693. [Google Scholar] [CrossRef]
- Srirussamee, K.; Xue, R.; Mobini, S.; Cassidy, N.J.; Cartmell, S.H. Changes in the Extracellular Microenvironment and Osteogenic Responses of Mesenchymal Stem/Stromal Cells Induced by in Vitro Direct Electrical Stimulation. J. Tissue Eng. 2021, 12, 2041731420974147. [Google Scholar] [CrossRef]
- Sahm, F.; Ziebart, J.; Jonitz-Heincke, A.; Hansmann, D.; Dauben, T.; Bader, R. Alternating Electric Fields Modify the Function of Human Osteoblasts Growing on and in the Surroundings of Titanium Electrodes. Int. J. Mol. Sci. 2020, 21, 6944. [Google Scholar] [CrossRef]
- Supronowicz, P.R.; Ajayan, P.M.; Ullmann, K.R.; Arulanandam, B.P.; Metzger, D.W.; Bizios, R. Novel Current-Conducting Composite Substrates for Exposing Osteoblasts to Alternating Current Stimulation. J. Biomed. Mater. Res. 2001, 59, 499–506. [Google Scholar] [CrossRef]
- Creecy, C.M.; O’Neill, C.F.; Arulanandam, B.P.; Sylvia, V.L.; Navara, C.S.; Bizios, R. Mesenchymal Stem Cell Osteodifferentiation in Response to Alternating Electric Current. Tissue Eng. Part A 2013, 19, 467–474. [Google Scholar] [CrossRef] [PubMed]
- Zhang, B.; Xie, Y.; Ni, Z.; Chen, L. Effects and Mechanisms of Exogenous Electromagnetic Field on Bone Cells: A Review. Bioelectromagnetics 2020, 41, 263–278. [Google Scholar] [CrossRef] [PubMed]
- Detsch, R.; Boccaccini, A.R. The Role of Osteoclasts in Bone Tissue Engineering. J. Tissue Eng. Regen. Med. 2015, 9, 1133–1149. [Google Scholar] [CrossRef] [PubMed]
- Chang, K.; Chang, W.H.-S.; Tsai, M.-T.; Shih, C. Pulsed Electromagnetic Fields Accelerate Apoptotic Rate in Osteoclasts. Connect. Tissue Res. 2006, 47, 222–228. [Google Scholar] [CrossRef]
- Chang, K.; Chang, W.H.-S.; Wu, M.-L.; Shih, C. Effects of Different Intensities of Extremely Low Frequency Pulsed Electromagnetic Fields on Formation of Osteoclast-like Cells. Bioelectromagnetics 2003, 24, 431–439. [Google Scholar] [CrossRef] [PubMed]
- Rubin, J.; McLeod, K.J.; Titus, L.; Nanes, M.S.; Catherwood, B.D.; Rubin, C.T. Formation of Osteoclast-like Cells Is Suppressed by Low Frequency, Low Intensity Electric Fields. J. Orthop. Res. 1996, 14, 7–15. [Google Scholar] [CrossRef]
- Shankar, V.S.; Simon, B.J.; Bax, C.M.R.; Pazianas, M.; Moonga, B.S.; Adebanjo, O.A.; Zaidi, M. Effects of Electromagnetic Stimulation on the Functional Responsiveness of Isolated Rat Osteoclasts. J. Cell Physiol. 1998, 176, 537–544. [Google Scholar] [CrossRef]
- Ferrier, J.; Ross, S.M.; Kanehisa, J.; Aubin, J.E. Osteoclasts and Osteoblasts Migrate in Opposite Directions in Response to a Constant Electrical Field. J. Cell Physiol. 1986, 129, 283–288. [Google Scholar] [CrossRef]
- He, Z.; Selvamurugan, N.; Warshaw, J.; Partridge, N.C. Pulsed Electromagnetic Fields Inhibit Human Osteoclast Formation and Gene Expression via Osteoblasts. Bone 2018, 106, 194–203. [Google Scholar] [CrossRef]
- Lei, Y.; Su, J.; Xu, H.; Yu, Q.; Zhao, M.; Tian, J. Pulsed Electromagnetic Fields Inhibit Osteoclast Differentiation in RAW264.7 Macrophages via Suppression of the Protein Kinase B/Mammalian Target of Rapamycin Signaling Pathway. Mol. Med. Rep. 2018, 18, 447–454. [Google Scholar] [CrossRef]
- Pesce, M.; Patruno, A.; Speranza, L.; Reale, M. Extremely Low Frequency Electromagnetic Field and Wound Healing: Implication of Cytokines as Biological Mediators. Eur. Cytokine Netw. 2013, 24, 1–10. [Google Scholar] [CrossRef] [PubMed]
- Chen, Y.; Menger, M.M.; Braun, B.J.; Schweizer, S.; Linnemann, C.; Falldorf, K.; Ronniger, M.; Wang, H.; Histing, T.; Nussler, A.K.; et al. Modulation of Macrophage Activity by Pulsed Electromagnetic Fields in the Context of Fracture Healing. Bioengineering 2021, 8, 167. [Google Scholar] [CrossRef] [PubMed]
- Groiss, S.; Lammegger, R.; Brislinger, D. Anti-Oxidative and Immune Regulatory Responses of THP-1 and PBMC to Pulsed EMF Are Field-Strength Dependent. Int. J. Environ. Res. Public Health 2021, 18, 9519. [Google Scholar] [CrossRef] [PubMed]
- Srirussamee, K.; Mobini, S.; Cassidy, N.J.; Cartmell, S.H. Direct Electrical Stimulation Enhances Osteogenesis by Inducing Bmp2 and Spp1 Expressions from Macrophages and Preosteoblasts. Biotechnol. Bioeng. 2019, 116, 3421–3432. [Google Scholar] [CrossRef] [PubMed]
- Sun, Y.-S.; Peng, S.-W.; Cheng, J.-Y. In Vitro Electrical-Stimulated Wound-Healing Chip for Studying Electric Field-Assisted Wound-Healing Process. Biomicrofluidics 2012, 6, 34117. [Google Scholar] [CrossRef] [PubMed]
- Detsch, R.; Mayr, H.; Seitz, D.; Ziegler, G. Is Hydroxyapatite Ceramic Included in the Bone Remodelling Proccess? An In Vitro Study of Resorption and Formation Processes. Key Eng. Mater. 2008, 361–363, 1123–1126. [Google Scholar] [CrossRef]
- Zehnder, T.; Boccaccini, A.R.; Detsch, R. Biofabrication of a Co-Culture System in an Osteoid-like Hydrogel Matrix. Biofabrication 2017, 9, 025016. [Google Scholar] [CrossRef]
- Borciani, G.; Montalbano, G.; Baldini, N.; Cerqueni, G.; Vitale-Brovarone, C.; Ciapetti, G. Co-Culture Systems of Osteoblasts and Osteoclasts: Simulating in Vitro Bone Remodeling in Regenerative Approaches. Acta Biomater. 2020, 108, 22–45. [Google Scholar] [CrossRef]
- Wang, W.; Junior, J.R.P.; Nalesso, P.R.L.; Musson, D.; Cornish, J.; Mendonca, F.; Caetano, G.F.; Bartolo, P. Engineered 3D Printed Poly(Varepsilon-Caprolactone)/Graphene Scaffolds for Bone Tissue Engineering. Mater. Sci. Eng. C Mater. Biol. Appl. 2019, 100, 759–770. [Google Scholar] [CrossRef]
- Sahm, F.; Freiin Grote, V.; Zimmermann, J.; Haack, F.; Uhrmacher, A.M.; van Rienen, U.; Bader, R.; Detsch, R.; Jonitz-Heincke, A. Long-Term Stimulation with Alternating Electric Fields Modulates the Differentiation and Mineralization of Human Pre-Osteoblasts. Front. Physiol. 2022, 13, 965181. [Google Scholar] [CrossRef]
- Grunert, P.C.; Jonitz-Heincke, A.; Su, Y.; Souffrant, R.; Hansmann, D.; Ewald, H.; Krüger, A.; Mittelmeier, W.; Bader, R. Establishment of a Novel In Vitro Test Setup for Electric and Magnetic Stimulation of Human Osteoblasts. Cell Biochem. Biophys. 2014, 70, 805–817. [Google Scholar] [CrossRef] [PubMed]
- Hiemer, B.; Krogull, M.; Bender, T.; Ziebart, J.; Krueger, S.; Bader, R.; Jonitz-Heincke, A. Effect of Electric Stimulation on Human Chondrocytes and Mesenchymal Stem Cells under Normoxia and Hypoxia. Mol. Med. Rep. 2018, 18, 2133–2141. [Google Scholar] [CrossRef] [PubMed]
- Klinder, A.; Markhoff, J.; Jonitz-Heincke, A.; Sterna, P.; Salamon, A.; Bader, R. Comparison of Different Cell Culture Plates for the Enrichment of Non-Adherent Human Mononuclear Cells. Exp. Ther. Med. 2019, 17, 2004–2012. [Google Scholar] [CrossRef]
- Livak, K.J.; Schmittgen, T.D. Analysis of Relative Gene Expression Data Using Real-Time Quantitative PCR and the 2−ΔΔCT Method. Methods 2001, 25, 402–408. [Google Scholar] [CrossRef] [PubMed]
- Bhavsar, M.B.; Han, Z.; DeCoster, T.; Leppik, L.; Costa Oliveira, K.M.; Barker, J.H.; Oliveira, K.M.C.; Bhavsar, M.B.; Barker, J.H.; Han, Z.; et al. Electrical Stimulation-Based Bone Fracture Treatment, If It Works so Well Why Do Not More Surgeons Use It? Eur. J. Trauma Emerg. Surg. 2020, 46, 245–264. [Google Scholar] [CrossRef] [PubMed]
- Sieberath, A.; Della Bella, E.; Ferreira, A.M.; Gentile, P.; Eglin, D.; Dalgarno, K. A Comparison of Osteoblast and Osteoclast In Vitro Co-Culture Models and Their Translation for Preclinical Drug Testing Applications. Int. J. Mol. Sci. 2020, 21, 912. [Google Scholar] [CrossRef]
- Duncan, R.L.; Turner, C.H. Mechanotransduction and the Functional Response of Bone to Mechanical Strain. Calcif. Tissue Int. 1995, 57, 344–358. [Google Scholar] [CrossRef]
- Ogle, M.E.; Segar, C.E.; Sridhar, S.; Botchwey, E.A. Monocytes and Macrophages in Tissue Repair: Implications for Immunoregenerative Biomaterial Design. Exp. Biol. Med. 2016, 241, 1084–1097. [Google Scholar] [CrossRef]
- Anesi, A.; Generali, L.; Sandoni, L.; Pozzi, S.; Grande, A. From Osteoclast Differentiation to Osteonecrosis of the Jaw: Molecular and Clinical Insights. Int. J. Mol. Sci. 2019, 20, 4925. [Google Scholar] [CrossRef]
- Wilson, S.R.; Peters, C.; Saftig, P.; Brömme, D. Cathepsin K Activity-Dependent Regulation of Osteoclast Actin Ring Formation and Bone Resorption. J. Biol. Chem. 2009, 284, 2584–2592. [Google Scholar] [CrossRef]
- Kim, N.; Kadono, Y.; Takami, M.; Lee, J.; Lee, S.-H.; Okada, F.; Kim, J.H.; Kobayashi, T.; Odgren, P.R.; Nakano, H.; et al. Osteoclast Differentiation Independent of the TRANCE–RANK–TRAF6 Axis. J. Exp. Med. 2005, 202, 589–595. [Google Scholar] [CrossRef] [PubMed]
- Mun, S.H.; Ko, N.Y.; Kim, H.S.; Kim, J.W.; Kim, D.K.; Kim, A.-R.; Lee, S.H.; Kim, Y.-G.; Lee, C.K.; Lee, S.H.; et al. Interleukin-33 Stimulates Formation of Functional Osteoclasts from Human CD14+ Monocytes. Cell. Mol. Life Sci. 2010, 67, 3883–3892. [Google Scholar] [CrossRef] [PubMed]
- Kobayashi, K.; Takahashi, N.; Jimi, E.; Udagawa, N.; Takami, M.; Kotake, S.; Nakagawa, N.; Kinosaki, M.; Yamaguchi, K.; Shima, N.; et al. Tumor Necrosis Factor α Stimulates Osteoclast Differentiation by a Mechanism Independent of the Odf/Rankl–Rank Interaction. J. Exp. Med. 2000, 191, 275–286. [Google Scholar] [CrossRef] [PubMed]
- Fuller, K.; Murphy, C.; Kirstein, B.; Fox, S.W.; Chambers, T.J. TNFα Potently Activates Osteoclasts, through a Direct Action Independent of and Strongly Synergistic with RANKL. Endocrinology 2002, 143, 1108–1118. [Google Scholar] [CrossRef]
- Heiland, G.R.; Zwerina, K.; Baum, W.; Kireva, T.; Distler, J.H.; Grisanti, M.; Asuncion, F.; Li, X.; Ominsky, M.; Richards, W.; et al. Neutralisation of Dkk-1 Protects from Systemic Bone Loss during Inflammation and Reduces Sclerostin Expression. Ann. Rheum. Dis. 2010, 69, 2152–2159. [Google Scholar] [CrossRef]
- Amarasekara, D.S.; Yun, H.; Kim, S.; Lee, N.; Kim, H.; Rho, J. Regulation of Osteoclast Differentiation by Cytokine Networks. Immune Netw. 2018, 18, e8. [Google Scholar] [CrossRef]
- Evans, K.E.; Fox, S.W. Interleukin-10 Inhibits Osteoclastogenesis by Reducing NFATc1 Expression and Preventing Its Translocation to the Nucleus. BMC Cell Biol. 2007, 8, 4. [Google Scholar] [CrossRef]
- Cho, H.; Lee, J.; Jang, S.; Lee, J.; Oh, T.I.; Son, Y.; Lee, E. Casr-Mediated Hbmscs Activity Modulation: Additional Coupling Mechanism in Bone Remodeling Compartment. Int. J. Mol. Sci. 2021, 22, 325. [Google Scholar] [CrossRef]
- Bi, H.; Chen, X.; Gao, S.; Yu, X.; Xiao, J.; Zhang, B.; Liu, X.; Dai, M. Key Triggers of Osteoclast-Related Diseases and Available Strategies for Targeted Therapies: A Review. Front. Med. 2017, 4, 234. [Google Scholar] [CrossRef]
- Xu, F.; Teitelbaum, S.L. Osteoclasts: New Insights. Bone Res. 2013, 1, 11–26. [Google Scholar] [CrossRef]
- Zheng, X.; Zhang, Y.; Guo, S.; Zhang, W.; Wang, J.; Lin, Y. Dynamic Expression of Matrix Metalloproteinases 2, 9 and 13 in Ovariectomy-Induced Osteoporosis Rats. Exp. Ther. Med. 2018, 16, 1807–1813. [Google Scholar] [CrossRef] [PubMed]
- Oliveira, K.M.C.; Barker, J.H.; Berezikov, E.; Pindur, L.; Kynigopoulos, S.; Eischen-Loges, M.; Han, Z.; Bhavsar, M.B.; Henrich, D.; Leppik, L. Electrical Stimulation Shifts Healing/Scarring towards Regeneration in a Rat Limb Amputation Model. Sci. Rep. 2019, 9, 11433. [Google Scholar] [CrossRef] [PubMed]
- Lehenkari, P.; Hentunen, T.A.; Laitala-Leinonen, T.; Tuukkanen, J.; Väänänen, H.K. Carbonic Anhydrase II Plays a Major Role in Osteoclast Differentiation and Bone Resorption by Effecting the Steady State Intracellular PH and Ca2+. Exp. Cell Res. 1998, 242, 128–137. [Google Scholar] [CrossRef] [PubMed]
- Arendt, B.K.; Velazquez-Dones, A.; Tschumper, R.C.; Howell, K.G.; Ansell, S.M.; Witzig, T.E.; Jelinek, D.F. Interleukin 6 Induces Monocyte Chemoattractant Protein-1 Expression in Myeloma Cells. Leukemia 2002, 16, 2142–2147. [Google Scholar] [CrossRef] [PubMed][Green Version]
- Biswas, P.; Delfanti, F.; Bernasconi, S.; Mengozzi, M.; Cota, M.; Polentarutti, N.; Mantovani, A.; Lazzarin, A.; Sozzani, S.; Poli, G. Interleukin-6 Induces Monocyte Chemotactic Protein-1 in Peripheral Blood Mononuclear Cells and in the U937 Cell Line. Blood 1998, 91, 258–265. [Google Scholar] [CrossRef]
- Miyamoto, K.; Ninomiya, K.; Sonoda, K.-H.; Miyauchi, Y.; Hoshi, H.; Iwasaki, R.; Miyamoto, H.; Yoshida, S.; Sato, Y.; Morioka, H.; et al. MCP-1 Expressed by Osteoclasts Stimulates Osteoclastogenesis in an Autocrine/Paracrine Manner. Biochem. Biophys. Res. Commun. 2009, 383, 373–377. [Google Scholar] [CrossRef]
- Takahashi, N.; Ejiri, S.; Yanagisawa, S.; Ozawa, H. Regulation of Osteoclast Polarization. Odontology 2007, 95, 1–9. [Google Scholar] [CrossRef]
- Azari, A.; Schoenmaker, T.; de Souza Faloni, A.P.; Everts, V.; de Vries, T.J. Jaw and Long Bone Marrow Derived Osteoclasts Differ in Shape and Their Response to Bone and Dentin. Biochem. Biophys. Res. Commun. 2011, 409, 205–210. [Google Scholar] [CrossRef]
- Detsch, R.; Schaefer, S.; Deisinger, U.; Ziegler, G.; Seitz, H.; Leukers, B. In Vitro-Osteoclastic Activity Studies on Surfaces of 3D Printed Calcium Phosphate Scaffolds. J. Biomater. Appl. 2011, 26, 359–380. [Google Scholar] [CrossRef]
- Zhang, M.; Huang, B. The Multi-Differentiation Potential of Peripheral Blood Mononuclear Cells. Stem Cell Res. Ther. 2012, 3, 48. [Google Scholar] [CrossRef]
- Ruijtenberg, S.; van den Heuvel, S. Coordinating Cell Proliferation and Differentiation: Antagonism between Cell Cycle Regulators and Cell Type-Specific Gene Expression. Cell Cycle 2016, 15, 196–212. [Google Scholar] [CrossRef] [PubMed]
- Fritsch, M.; Günther, S.D.; Schwarzer, R.; Albert, M.-C.; Schorn, F.; Werthenbach, J.P.; Schiffmann, L.M.; Stair, N.; Stocks, H.; Seeger, J.M.; et al. Caspase-8 Is the Molecular Switch for Apoptosis, Necroptosis and Pyroptosis. Nature 2019, 575, 683–687. [Google Scholar] [CrossRef] [PubMed]
- Amarasekara, D.S.; Kim, S.; Rho, J. Regulation of Osteoblast Differentiation by Cytokine Networks. Int. J. Mol. Sci. 2021, 22, 2851. [Google Scholar] [CrossRef]
- Gilbert, L.; He, X.; Farmer, P.; Boden, S.; Kozlowski, M.; Rubin, J.; Nanes, M.S. Inhibition of Osteoblast Differentiation by Tumor Necrosis Factor-Alpha. Endocrinology 2000, 141, 3956–3964. [Google Scholar] [CrossRef] [PubMed]
- Bastidas-Coral, A.P.; Bakker, A.D.; Zandieh-Doulabi, B.; Kleverlaan, C.J.; Bravenboer, N.; Forouzanfar, T.; Klein-Nulend, J. Cytokines TNF-α, IL-6, IL-17F, and IL-4 Differentially Affect Osteogenic Differentiation of Human Adipose Stem Cells. Stem Cells Int. 2016, 2016, 1318256. [Google Scholar] [CrossRef]
- Xie, Z.; Tang, S.; Ye, G.; Wang, P.; Li, J.; Liu, W.; Li, M.; Wang, S.; Wu, X.; Cen, S.; et al. Interleukin-6/Interleukin-6 Receptor Complex Promotes Osteogenic Differentiation of Bone Marrow-Derived Mesenchymal Stem Cells. Stem Cell Res. Ther. 2018, 9, 13. [Google Scholar] [CrossRef]
- Park, Y.-T.; Lee, S.-M.; Kou, X.; Karabucak, B. The Role of Interleukin 6 in Osteogenic and Neurogenic Differentiation Potentials of Dental Pulp Stem Cells. J. Endod. 2019, 45, 1342–1348. [Google Scholar] [CrossRef]
- Ishimi, Y.; Miyaura, C.; Jin, C.H.; Akatsu, T.; Abe, E.; Nakamura, Y.; Yamaguchi, A.; Yoshiki, S.; Matsuda, T.; Hirano, T. IL-6 Is Produced by Osteoblasts and Induces Bone Resorption. J. Immunol. 1990, 145, 3297–3303. [Google Scholar]
- Feng, W.; Liu, H.; Luo, T.; Liu, D.; Du, J.; Sun, J.; Wang, W.; Han, X.; Yang, K.; Guo, J.; et al. Combination of IL-6 and SIL-6R Differentially Regulate Varying Levels of RANKL-Induced Osteoclastogenesis through NF-ΚB, ERK and JNK Signaling Pathways. Sci. Rep. 2017, 7, 41411. [Google Scholar] [CrossRef]
- Yamaguchi, A.; Sakamoto, K.; Minamizato, T.; Katsube, K.; Nakanishi, S. Regulation of Osteoblast Differentiation Mediated by BMP, Notch, and CCN3/NOV. Jpn. Dent. Sci. Rev. 2008, 44, 48–56. [Google Scholar] [CrossRef]
- Remmers, S.J.A.; de Wildt, B.W.M.; Vis, M.A.M.; Spaander, E.S.R.; de Vries, R.B.M.; Ito, K.; Hofmann, S. Osteoblast-Osteoclast Co-Cultures: A Systematic Review and Map of Available Literature. PLoS ONE 2021, 16, e0257724. [Google Scholar] [CrossRef] [PubMed]
- Yuan, F.-L.; Wu, Q.; Miao, Z.-N.; Xu, M.-H.; Xu, R.-S.; Jiang, D.-L.; Ye, J.-X.; Chen, F.; Zhao, M.-D.; Wang, H.; et al. Osteoclast-Derived Extracellular Vesicles: Novel Regulators of Osteoclastogenesis and Osteoclast–Osteoblasts Communication in Bone Remodeling. Front. Physiol. 2018, 9, 628. [Google Scholar] [CrossRef] [PubMed]


Publisher’s Note: MDPI stays neutral with regard to jurisdictional claims in published maps and institutional affiliations. |
© 2022 by the authors. Licensee MDPI, Basel, Switzerland. This article is an open access article distributed under the terms and conditions of the Creative Commons Attribution (CC BY) license (https://creativecommons.org/licenses/by/4.0/).