Article

Solid Fraction Determination at the Rigidity Point by Advanced Thermal Analysis

1
Department of Foundry and Steelmaking, TECNALIA, Basque Research and Technology Alliance (BRTA), Derio, 48160 Bilbao, Spain
2
Faculty of Engineering of Bilbao (UPV/EHU), Department of Mechanical Engineering, 48013 Bilbao, Spain
3
Befesa Aluminio, 48950 Erandio, Spain
*
Author to whom correspondence should be addressed.
Appl. Sci. 2022, 12(1), 237; https://doi.org/10.3390/app12010237
Submission received: 11 November 2021 / Revised: 21 December 2021 / Accepted: 23 December 2021 / Published: 27 December 2021

Abstract

:
The aim of this work is to determine the Solid Fraction (SF) at the rigidity point (FRP) by applying advanced thermal analysis techniques. The variation of the FRP value is important to explain the solidification behavior and the presence or absence of defects in aluminum alloys. As the final alloy composition plays a key role on obtained properties, the influence of major and minor alloying elements on FRP has been studied. A Taguchi design of experiments and a previously developed calculating method, based on the application of high rank derivatives has been employed to determinate first the rigidity point temperature (RPT) and after the corresponding FRP for AlSi10Mg alloys. A correlation factor of r2 of 0.81 was obtained for FRP calculation formula in function of the alloy composition.

1. Introduction

Lightweight aluminum structural parts are increasingly used in cars. The main reasons are a combination of low cost and low weight that can reduce the weight of the car, reducing the carbon footprint. Among industrial casting methods, vacuum high pressure die casting (V-HPDC) is increasingly used in the manufacture of critical components with complex and thin geometry [1]. AlSi10Mg is the most commonly employed alloy for V-HPDC, with good shock performance and high elongation values.
Simulation software, such as casting simulators and crash simulators, are used to simulate the behavior of the obtained parts. In both cases, an accurate prediction of the solidification properties of a given alloy as a function of its composition is a key point in obtaining accurate predictions of in-service properties. However, when it comes to accurately predicting casting performance and defect occurrence, there is certainly some way to go [2]. As described by Bonollo [3], the actual variation of the solidification parameters over time within the injected part in an HPDC process is very difficult to determine, which makes it difficult to relate this parameter to the final casting quality. A precise control of the solidification process and SF evolution is important, as it is related to the size, shape and spacing of the dendrite arms, affecting the macroscopic properties [4].
The solidification sequence of an aluminum alloy starts with the formation of crystal nuclei within the molten metal, with undercooling. The temperature at which the nuclei form and do not re-dissolve is called the liquidus temperature. A higher cooling rate causes the reduction of this temperature and of the binary eutectic temperature [5]. As the molten aluminum decreases in temperature, some dendrites begin to precipitate. There is primary forward growth of these dendrites and secondary lateral growth, until two primary dendrites collapse into each other, forming a dendritic network, at the so-called Dendrite Coherence Point (DCP). Dendrite coherence, or dendrite collision, is important in the formation of the solidification structure and in the castability of alloys [6].
The growth and thickening of the branches of the primary dendrites promote the initiation of contact between the secondary dendrites and when coalescence ends, solid bridges form between the dendrites and some stiffness is detected, at the so-called Rigidity Point (RP). Solid particles can move by the lubricating effects of the liquid films between them, but with restrictions [7]. Shrinkage porosity defects, macro-segregation and hot cracks can appear [8,9]. Therefore, the study of solidification parameters in the zone between DCP and RP combined with SF is crucial to calculate solidification parameters and alloy compositions to reduce casting defects and to employ in casting simulators [10]. In order to obtain accurate simulations, inverse modelling has been used by authors [11] and it is essential to have the simulation curve of the selected alloy well defined to predict casting defects, and the solidification curve changes with variations in alloy composition. The amount of SF also crucial to determine the casting temperatures of an alloy for semi-solid processes in order to avoid cold fillings, segregations and other defects [12]. It is also fundamental to define the onset time of squeeze-pins in HPDC [13].
Thermal analysis (TA) is commonly used to control the quality of aluminum in the aluminum industry. It is based on the continuous recording of molten aluminum temperature, using standardized analysis cups. With the obtained curves and their derivatives, the solidification parameters are determined [14,15,16,17].
The RPT value can be determined by different processes. In the mechanical method, the force used to agitate an impeller inside a vessel where the metal is solidifying is continuously recorded until the impeller stops, and this is the moment that determines the RP [18]. In the in situ neutron diffraction determination, neutron diffraction is measured continuously, but it is an expensive method with less accurate results [19]. The two-thermocouple method records the melt temperature at the core and at the inner wall of the test vessel, determining the RP from the differences between the core and wall temperatures versus the time curve. The single thermocouple method uses only the signal from a thermocouple in the center of the test vessel and is a less expensive method, due to the reduction in commercial test cups price and by avoiding doubling the number of needed calculations. It is sometimes difficult to determine the exact point because there is not always a clear inflection point in the first derivative curve, as the signal corresponding to this event is very weak. Recent developments employ higher order derivatives to determine the characteristic points of solidification, calculating the total amounts of the different precipitated phases and other low energy reactions [20,21], such as SF. The authors of this article have developed new methods based on the application of higher-order derivatives applied to the DCP and RPT [15,22].
The FRP can be determined using different experimental and/or arithmetic methods [16,23]. The Newtonian and Fourier methods [24] are the most commonly used. In the Newtonian method, the solid fraction at each point or temperature is calculated by determining the integration or cumulative area between the cooling rate (first derivative (dT/dt) of the cooling curve) and the baseline dTBL/dt (BL). BL corresponds to the cooling rate curve without phase transformations. In the Newtonian method, it is necessary to exactly define the solidus and liquidus temperatures to define the integration interval [25]. Djurdjevik et al. obtained values of around 72% FRP at 564 °C for AlSi8Cu3 alloys [18] and values ranging from 58 to 68% for FRP different AlSiCu alloys [26]. Another study obtained a value close to 89% for FRP at a temperature of 561 °C for AlSi7Cu0.5Mg [27]. Finally, a recent work determines the RPT values and SF of various AlSi and AlSiCu alloys [28].
A modification of the alloy composition can also lead to a variation of the solidification parameters, with solidification parameters being affected by the major and minor alloying elements [7]. The effect of major and minor alloying elements on FRP, especially in the AlSi10Mg alloy, is not well known.
The aim of this work is to go one step further by using TA to predict the SF at the stiffness point in a more accurate, economical, and direct way. Considering the lack of data in the literature, the determination of the solidification characteristics at the RP in function of a specific alloy composition will allow a more accurate control of the process, quality, and an improved simulation calculation, promoting a better prediction of casting defects. Statistical analysis of the results obtained for a wide range of alloy chemical compositions shows a good correlation of the predicted and obtained values for FRP.

2. Materials and Methods

A Taguchi methodology has been used to identify the effect of major and minor alloying elements on the solidification path of 25 different alloy compositions, obtained with an orthogonal L16 and a modified L8 matrix plus a reference alloy. The addition of twelve alloying elements have been studied, with a maximum and minimum alloying percentage for each alloying element defined in the L16 matrix and intermediate alloying percentages in the L8 matrix. Some of the elements have a limited percentage in the alloy, such as Ti or Sr, but the addition of small quantities of selected alloying elements that promotes changes in the solidification and microstructure of the alloy, as grain refiners or eutectic modifiers is well known. The total amount and the alloying elements have been selected taking into account their presence in industrial alloys. The AlSi10Mg alloy has been selected according to EN AC-43.400 (defined in EN 1706:2010) standard, because it is commonly used in the V-HPDC of aluminum structural parts. The alloy compositions obtained are represented in Table 1.
For the melting tests and TA determination, 300 g ± 10 g of molten aluminum alloy at 750 °C was poured into a calibrated sand cup for each experiment, recording temperatures between 630–400 °C. TA data were collected using a National Instruments high-speed data acquisition system connected to a personal computer, repeating each experiment three times. The average cooling rate of the test samples was about 3 °C/s.
The methodology used for the determination of RPT values, previously described by the authors [22], coincides with the point of intersection with zero of the second and third derivatives after the maximum liquidus temperature and with the zero crossing of the third derivative. The higher order derivatives (second and third derivatives) are used to obtain more precise values, especially since the RPT is not easily detectable from the first derivative. The method used is based on the fact that an acceleration in the rate dT/dt shows an increase in SF during dendrite growth. After the coherence point of the dendrites, a further increase in the SF value is no longer able to accelerate the heat transfer, and the latent heat generated shows a steady state, with the first derivative having almost constant values [29]. An example of direct determination of RPT and FRP from the derived curves can be observed in Figure 1. The RP point is located at the point of intersection with zero of the second and third derivatives after the maximum liquidus temperature. Once the RP point is defined, we can determinate The RPT value on the X-axes, and the FRP value on the y-axes at the intersection with the solid fraction curve of the perpendicular line that cross the RP. We can observe how as the temperature decreases, the value of the solid fraction increases progressively. This method allows to determine the amount of solid fraction at the stiffness point directly, without having to perform a two-step procedure. Employing this method, the size of the thermal analysis test samples does not influence the logarithmic curves, since temperature is a thermodynamically large property.
Once the FRP values of the 25 alloys were obtained, cast alloys samples were extracted and prepared according to standard metallographic procedures for observation and comparison with an optic microscope model DMI5000 M (LEICA Microsystems, Wetzlar, Germany). For the identification of the different phases obtained in the alloys structures, well-defined microstructures [30,31,32,33,34,35,36,37] have been used. A scanning electron microscope (SEM), equipped with an energy dispersive X-ray spectrometer (EDS) model JSM-5910LV (JEOL, Croissy-sur-Seine, France), was used to complete the analysis and to corroborate the optical determination of the phases.

3. Results

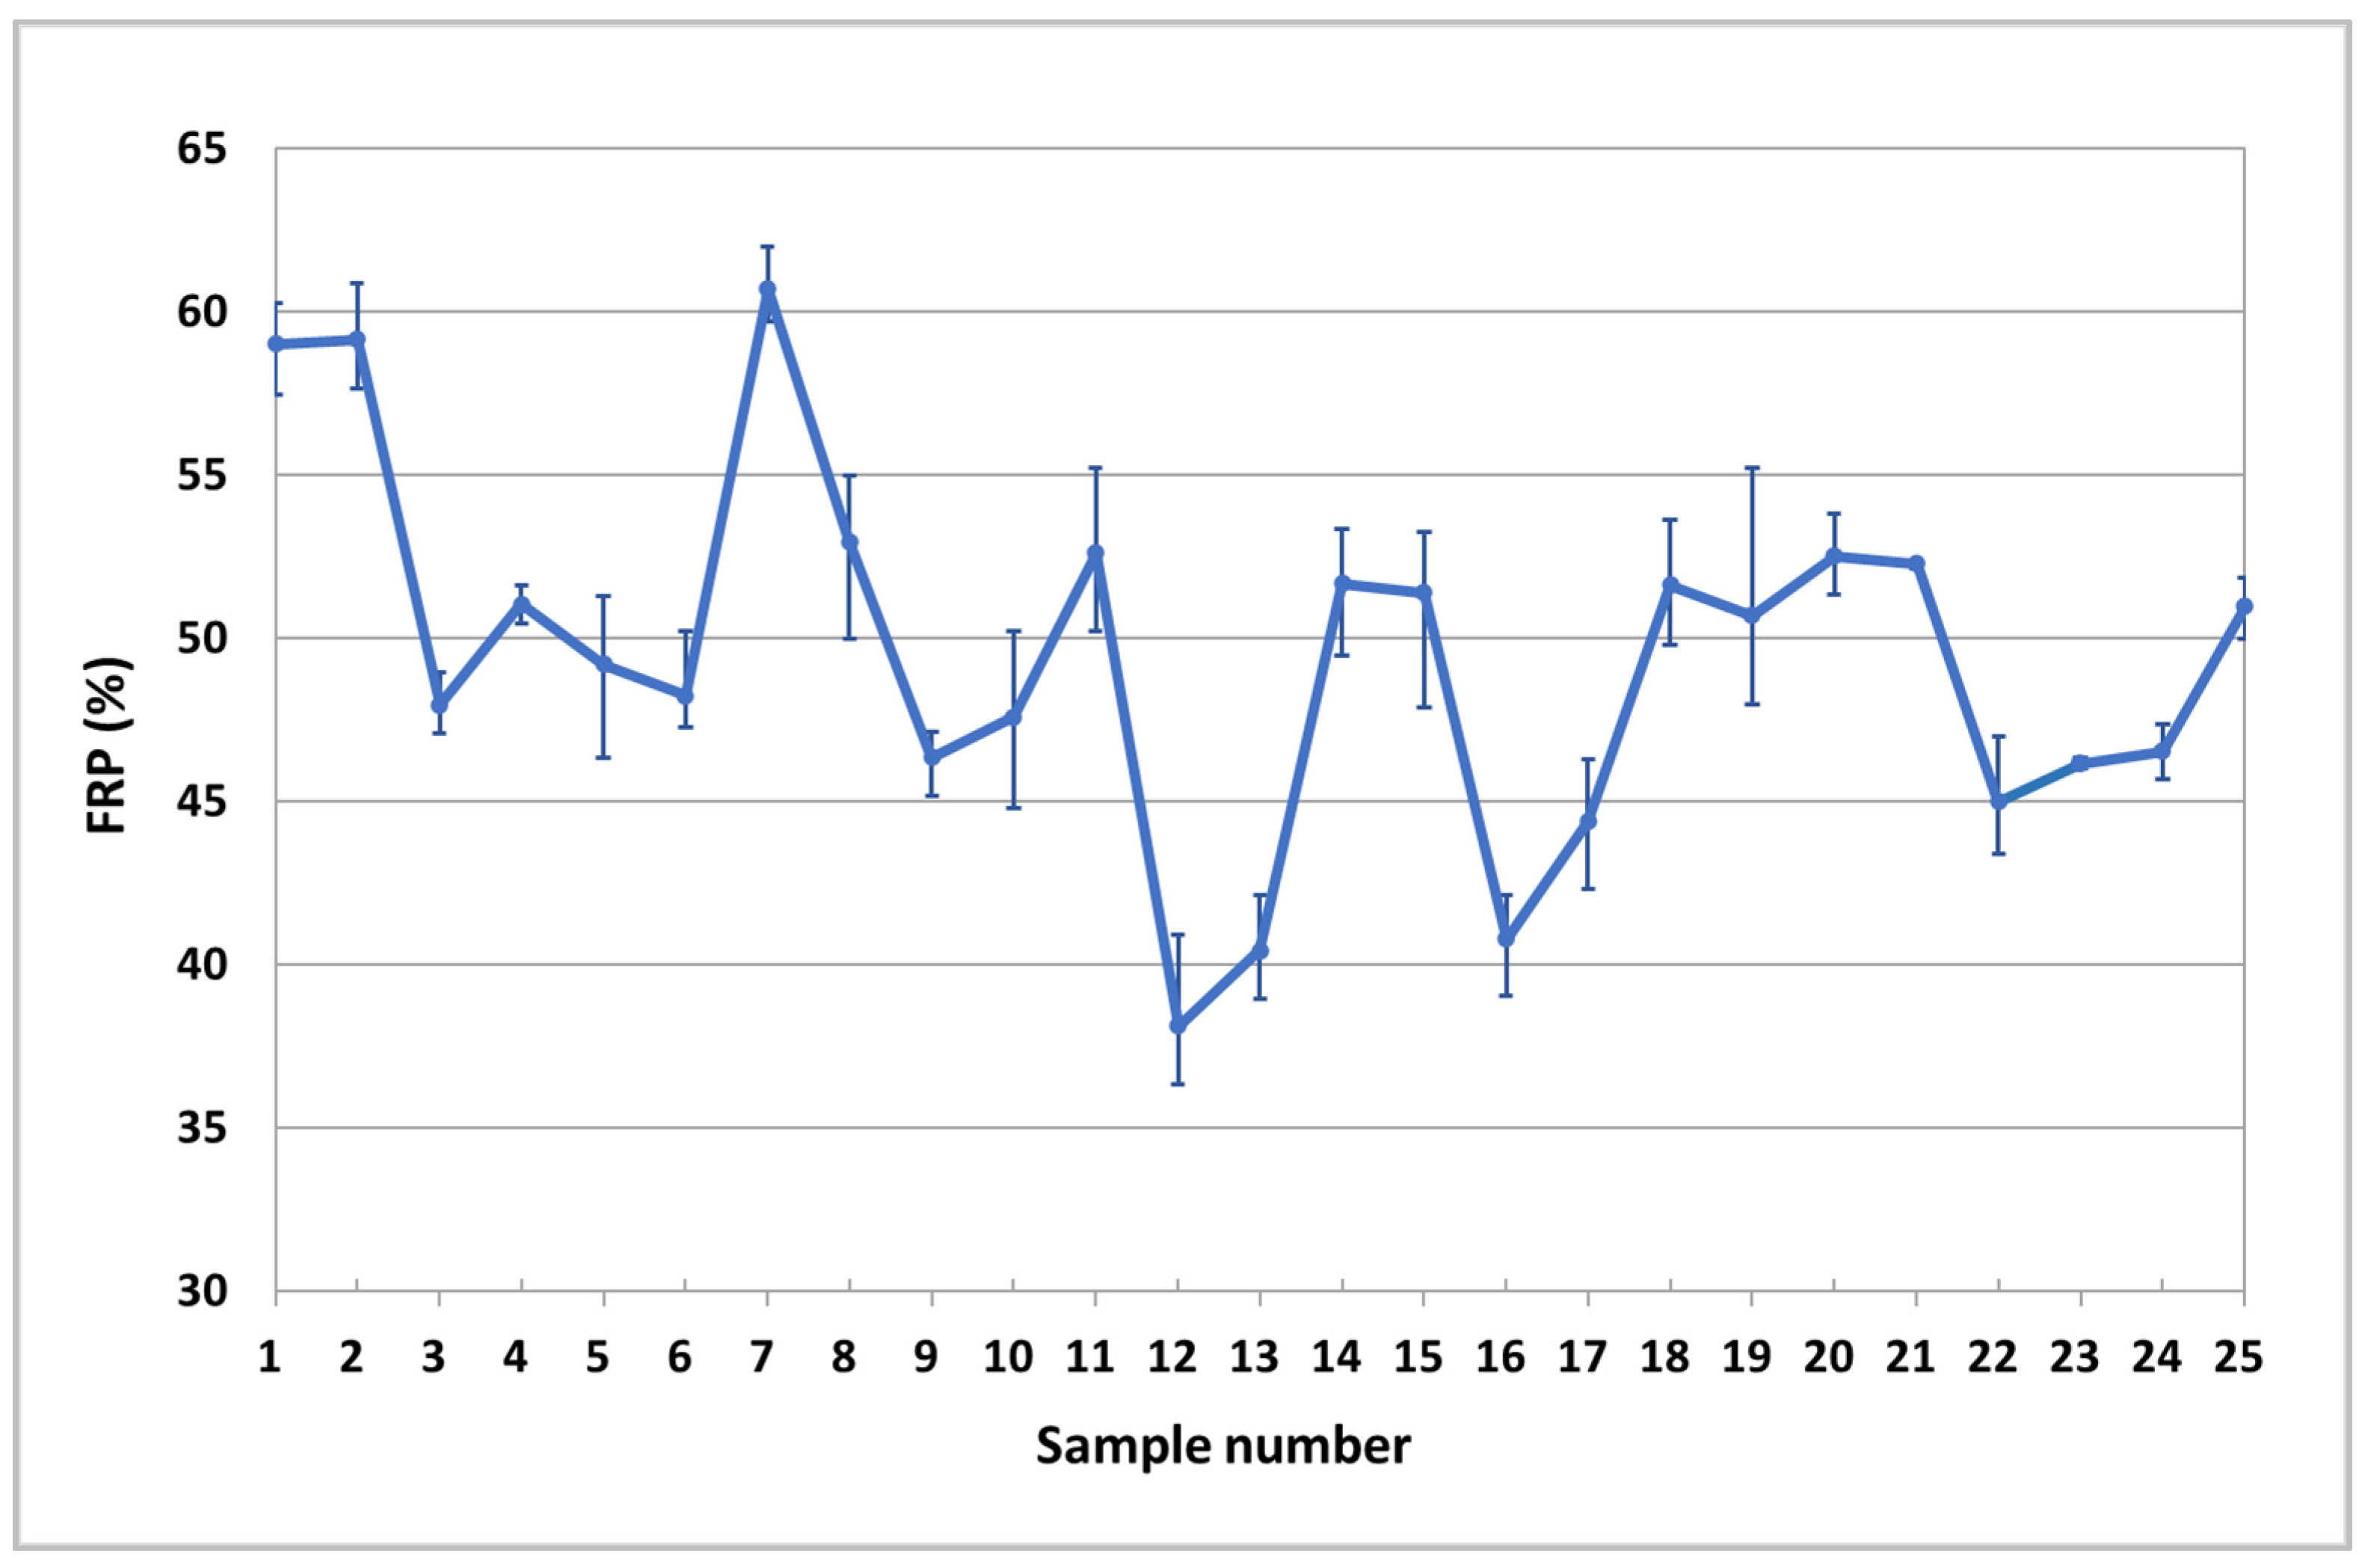
The RPT values used for the calculation of the FRP were those previously discussed, obtained and explained in our previous works [22]. To compare the values obtained, a comparison graph was used. As it can be observed in Figure 2, employing the SF values obtained, a regression coefficient of 0.81 was determined. The results obtained were compared with the scarce literature data [18,19,28,38,39] and were found to be within the range of solid fraction values previously described in the literature. We can observe how a variation of the composition of the alloy at the studied limits promotes a clear variation of the FRP values. If we check values of the error bars, we can observe how the variation of values obtained between samples is quite small all the studied alloys, showing that the method employed is quite repetitive.
Using linear regression calculations, the Equation below is obtained. FRP values are estimated as a function of the exact alloy composition, with their corresponding linear regression coefficient (r2) and standard error (Sey). A negative value of a coefficient in the formula promotes a decrease in the estimated property value and a positive value provides an increase in the estimated property value. The calculation formula obtained for the determination of the FRP as a function of major and minor alloying elements is shown below in Equation (1). The first value of the formula is a constant or intercept, as the expected mean value of FRP when all the alloying elements are zero. The rest of the regression coefficients indicate the effect of each one of the elements on FRP value.
FRP (%) = 82.09 − 2.67.Si + 1.70.Mg + 4.61.Fe − 11.30.Cu + 1.88.Ni + 1.64.Cr −
18.35.Mn − 6.16.Ti − 12.41.Zn − 3.62.Pb − 52.98.Sn + 161.77.Sr.
r2 = 0.81; Sey = 3.41
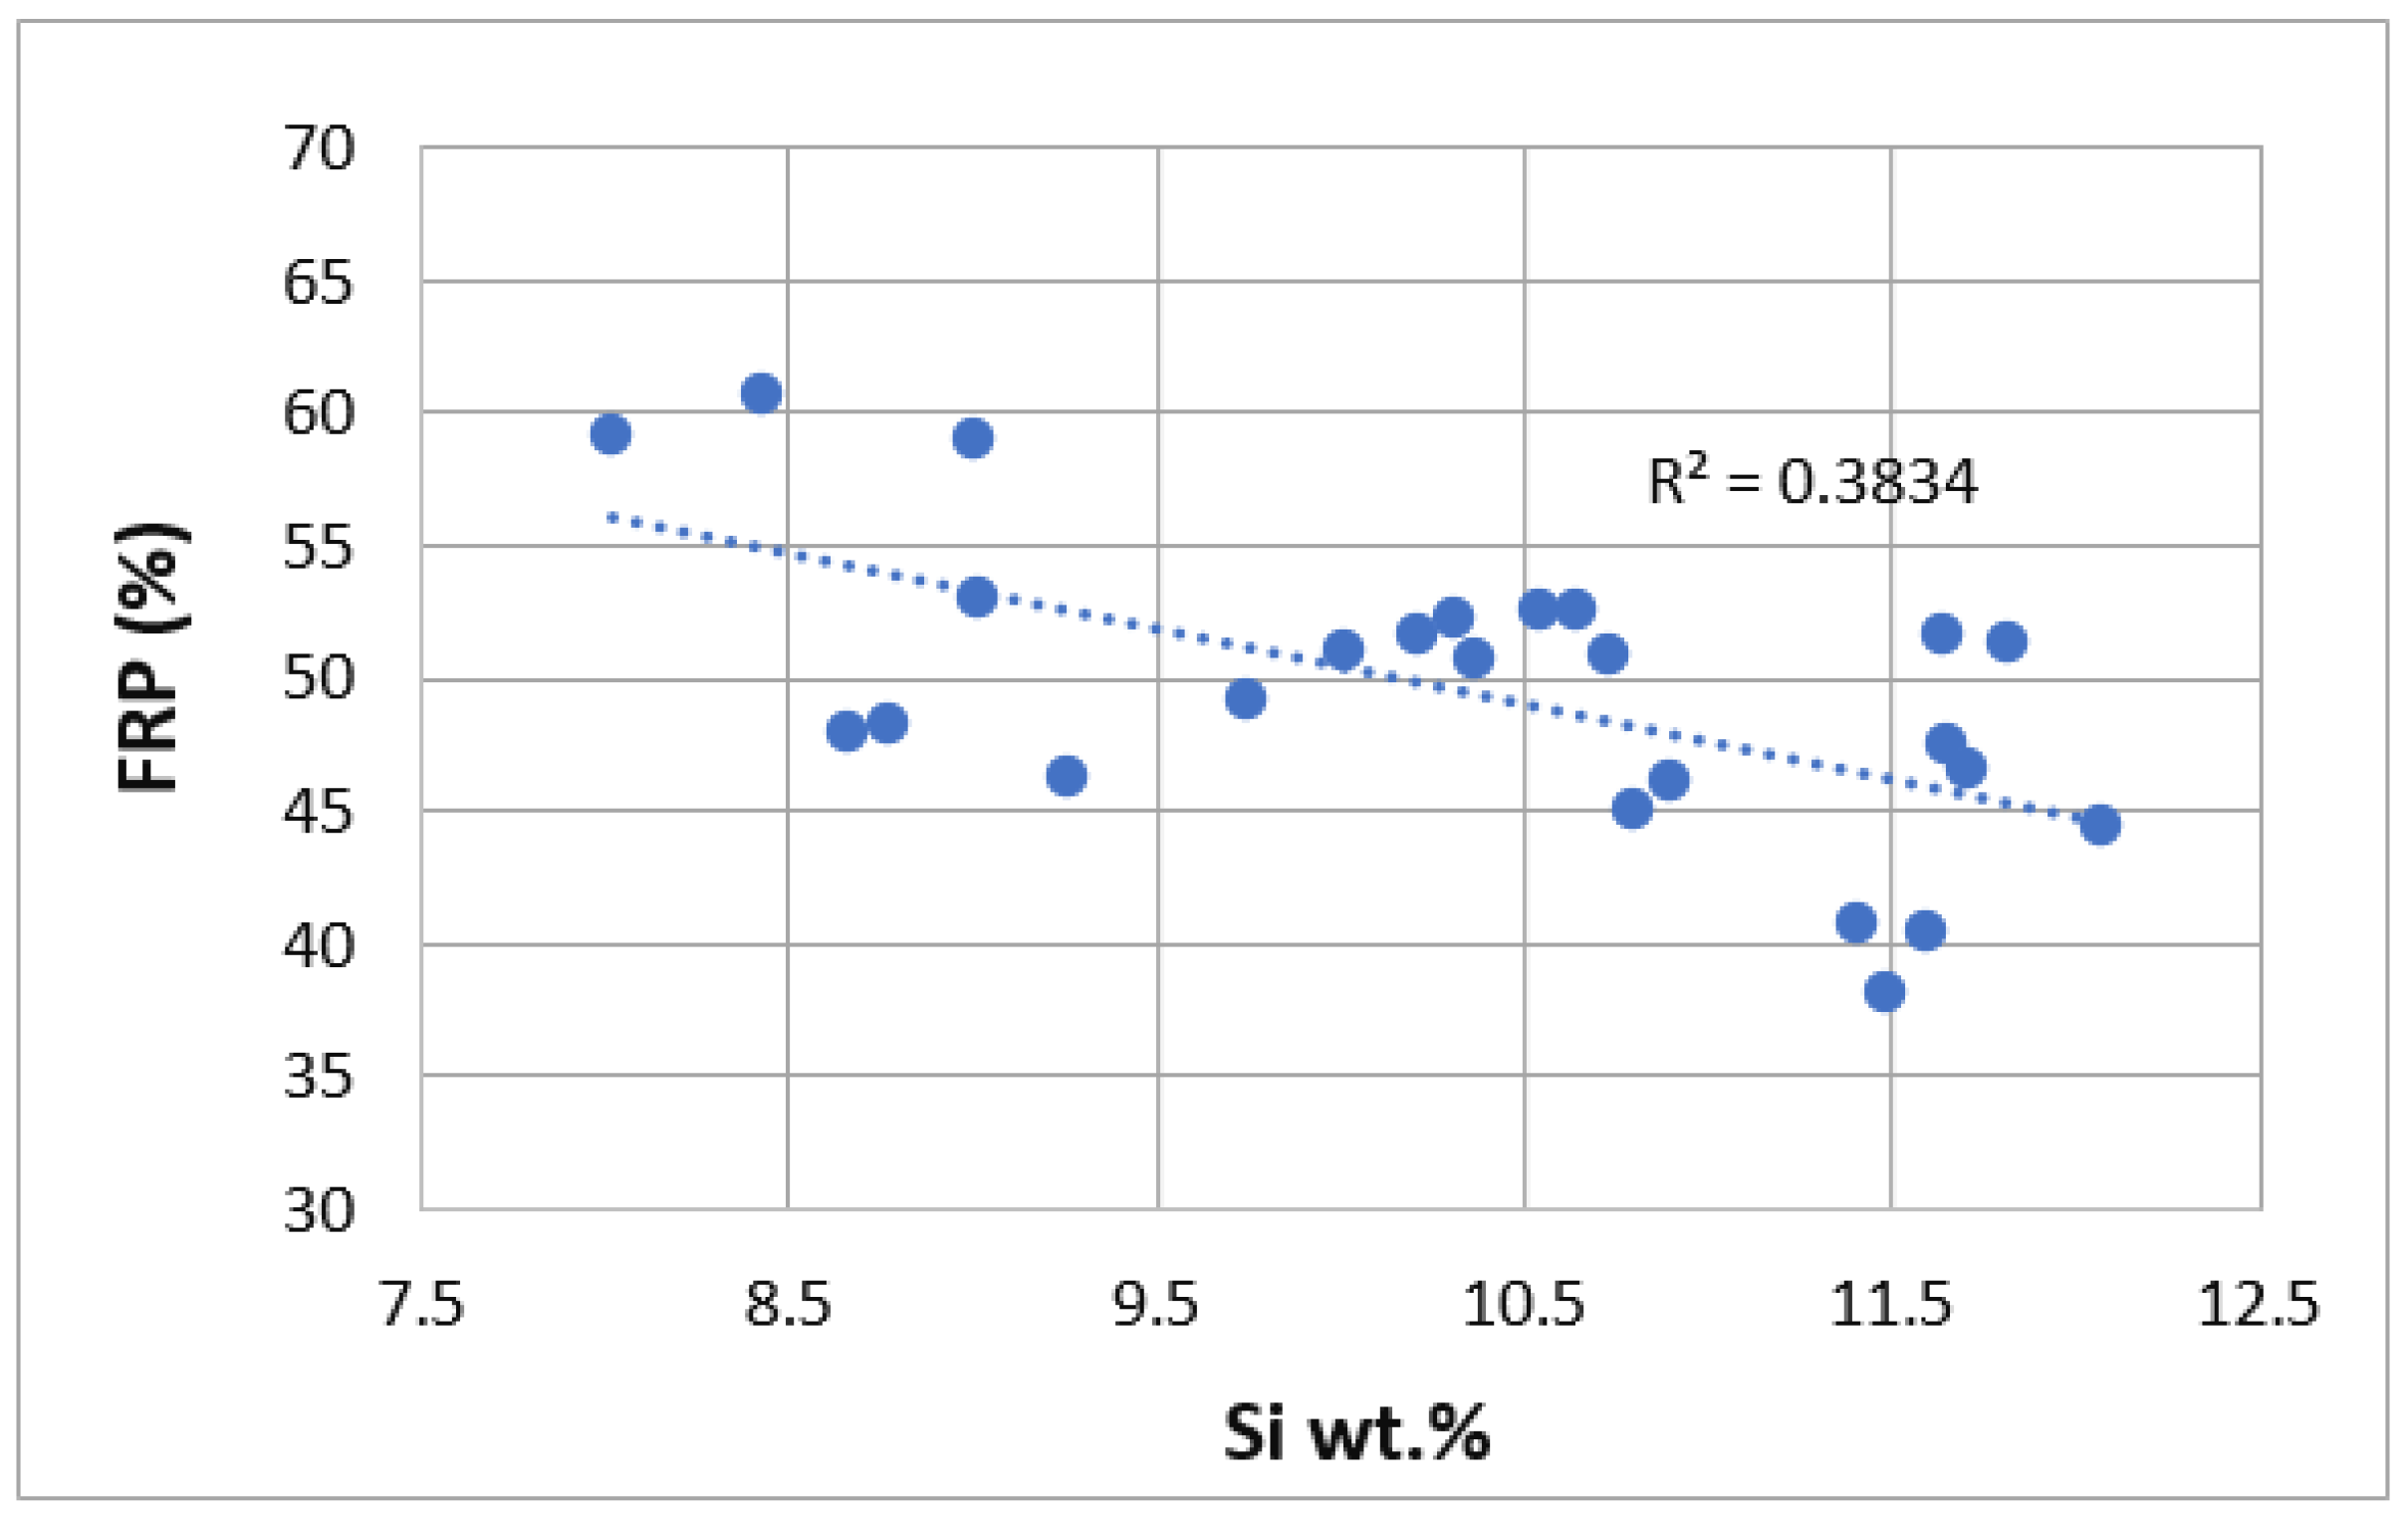
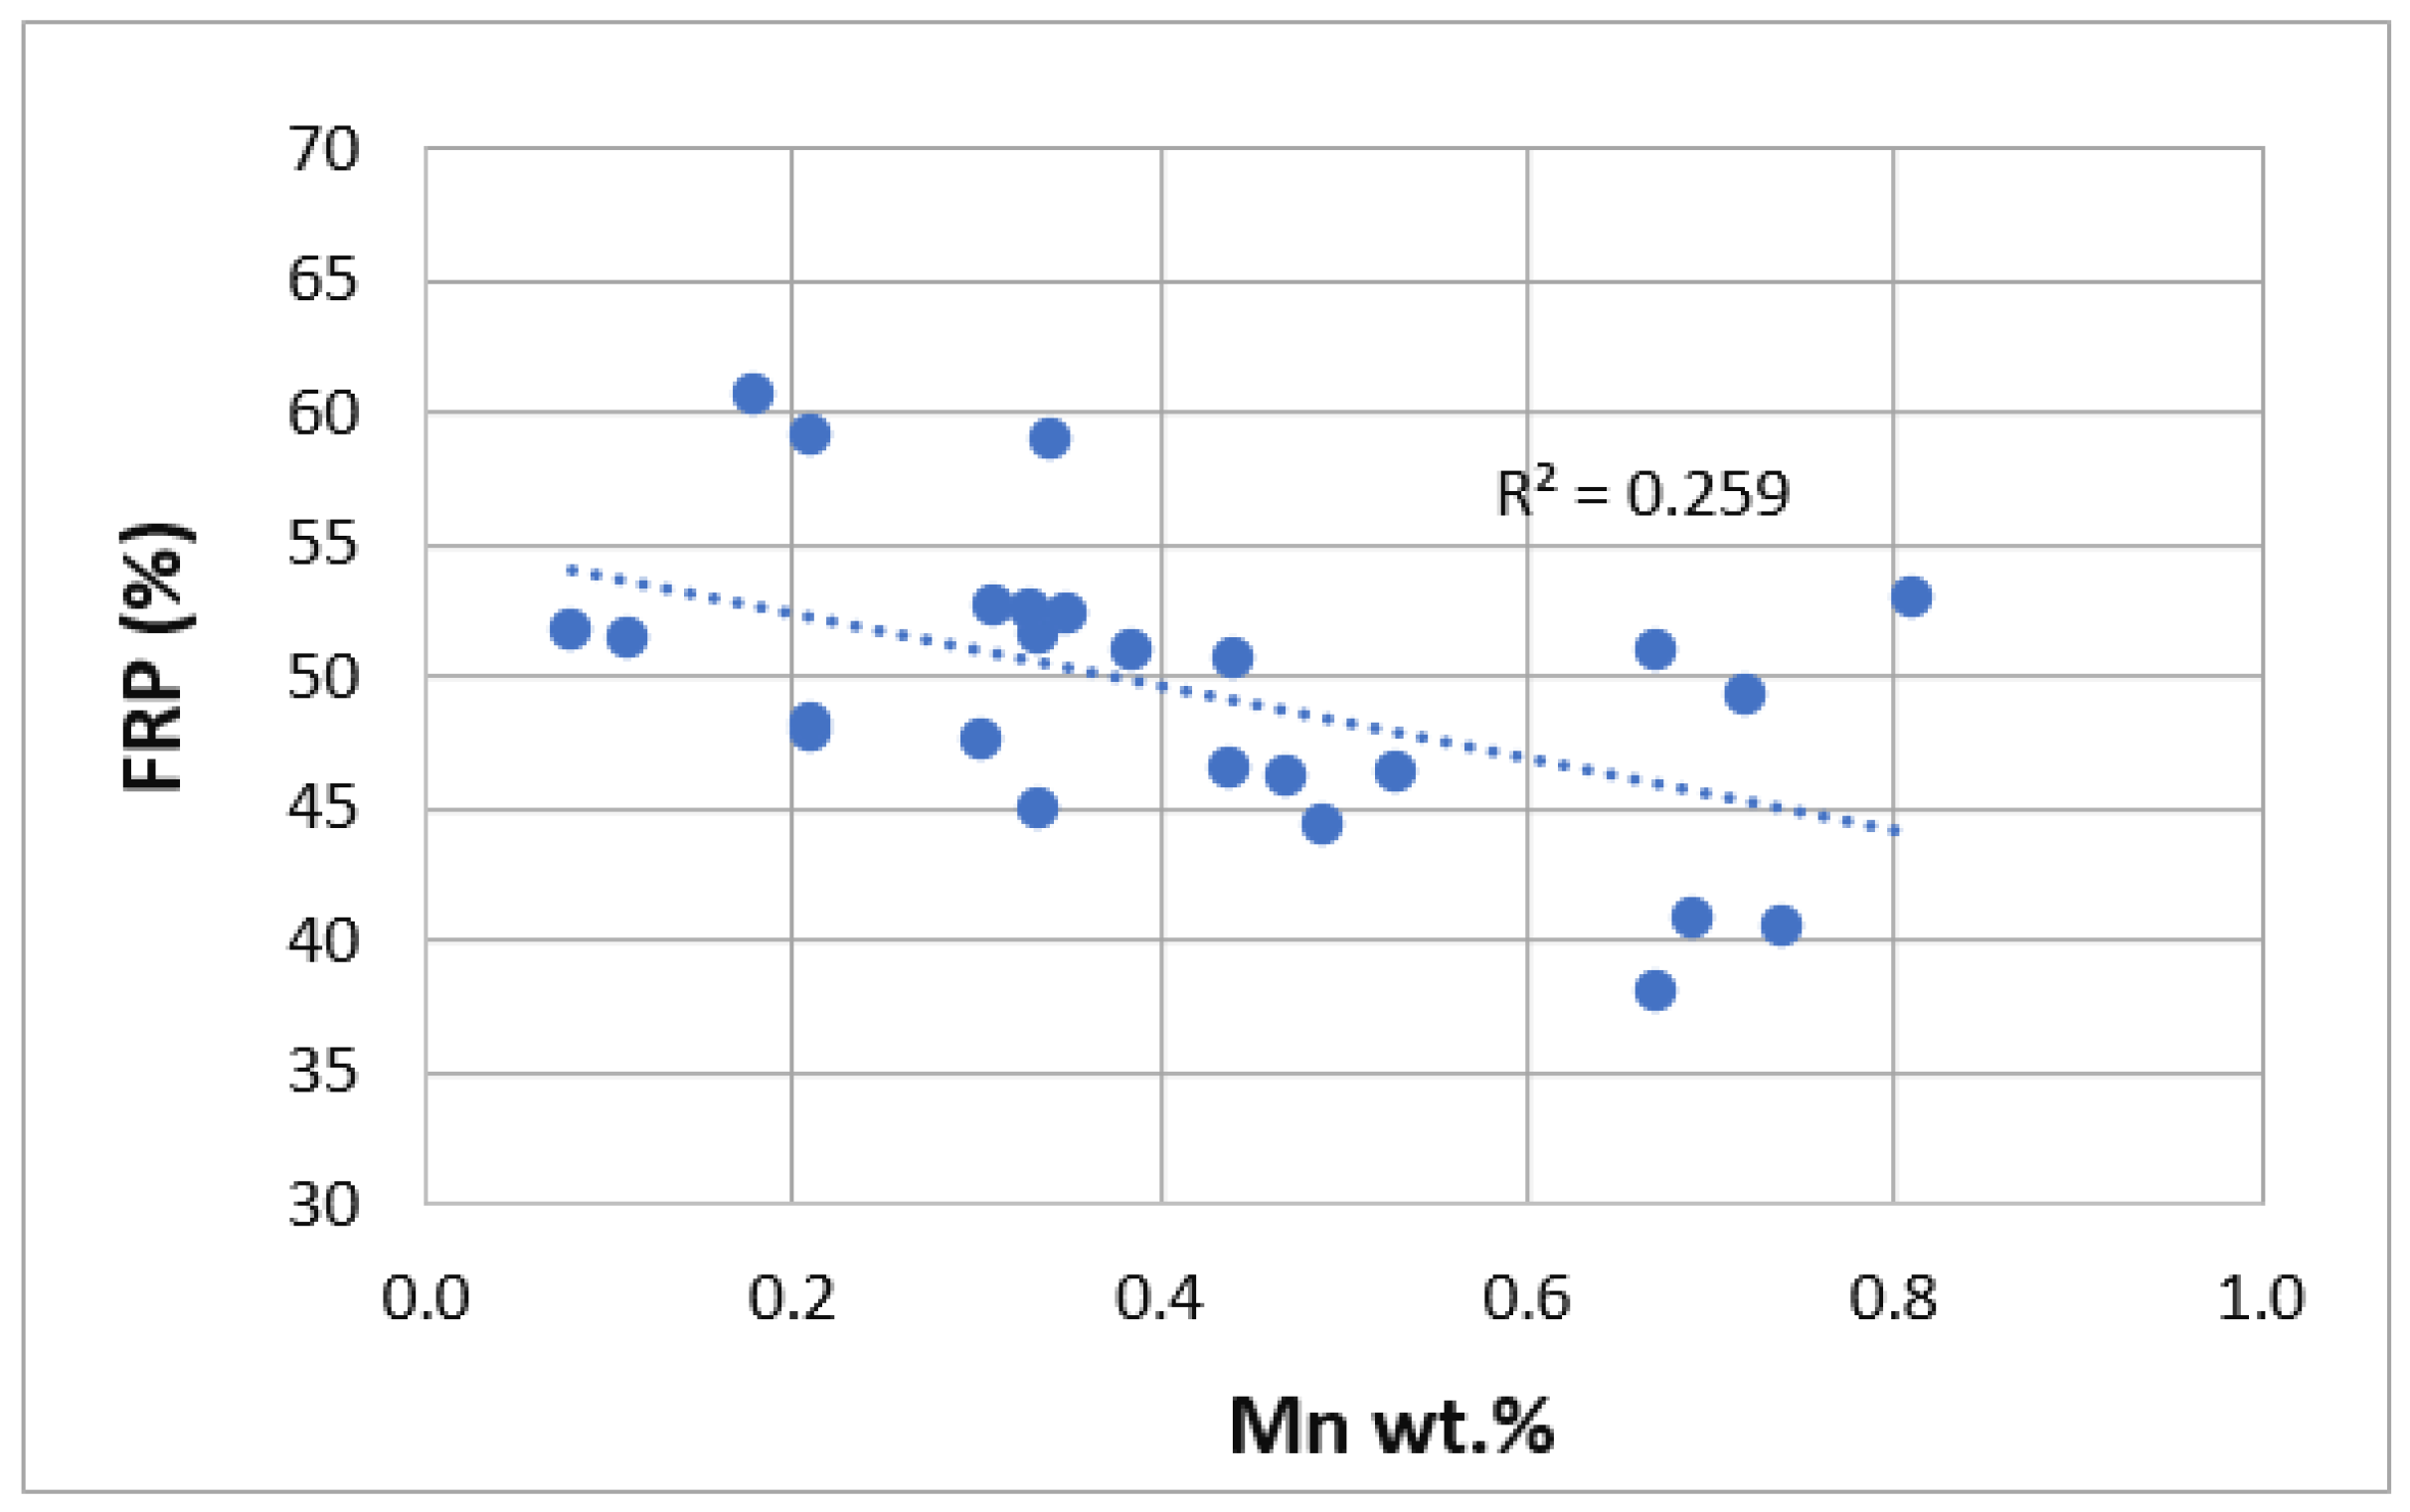
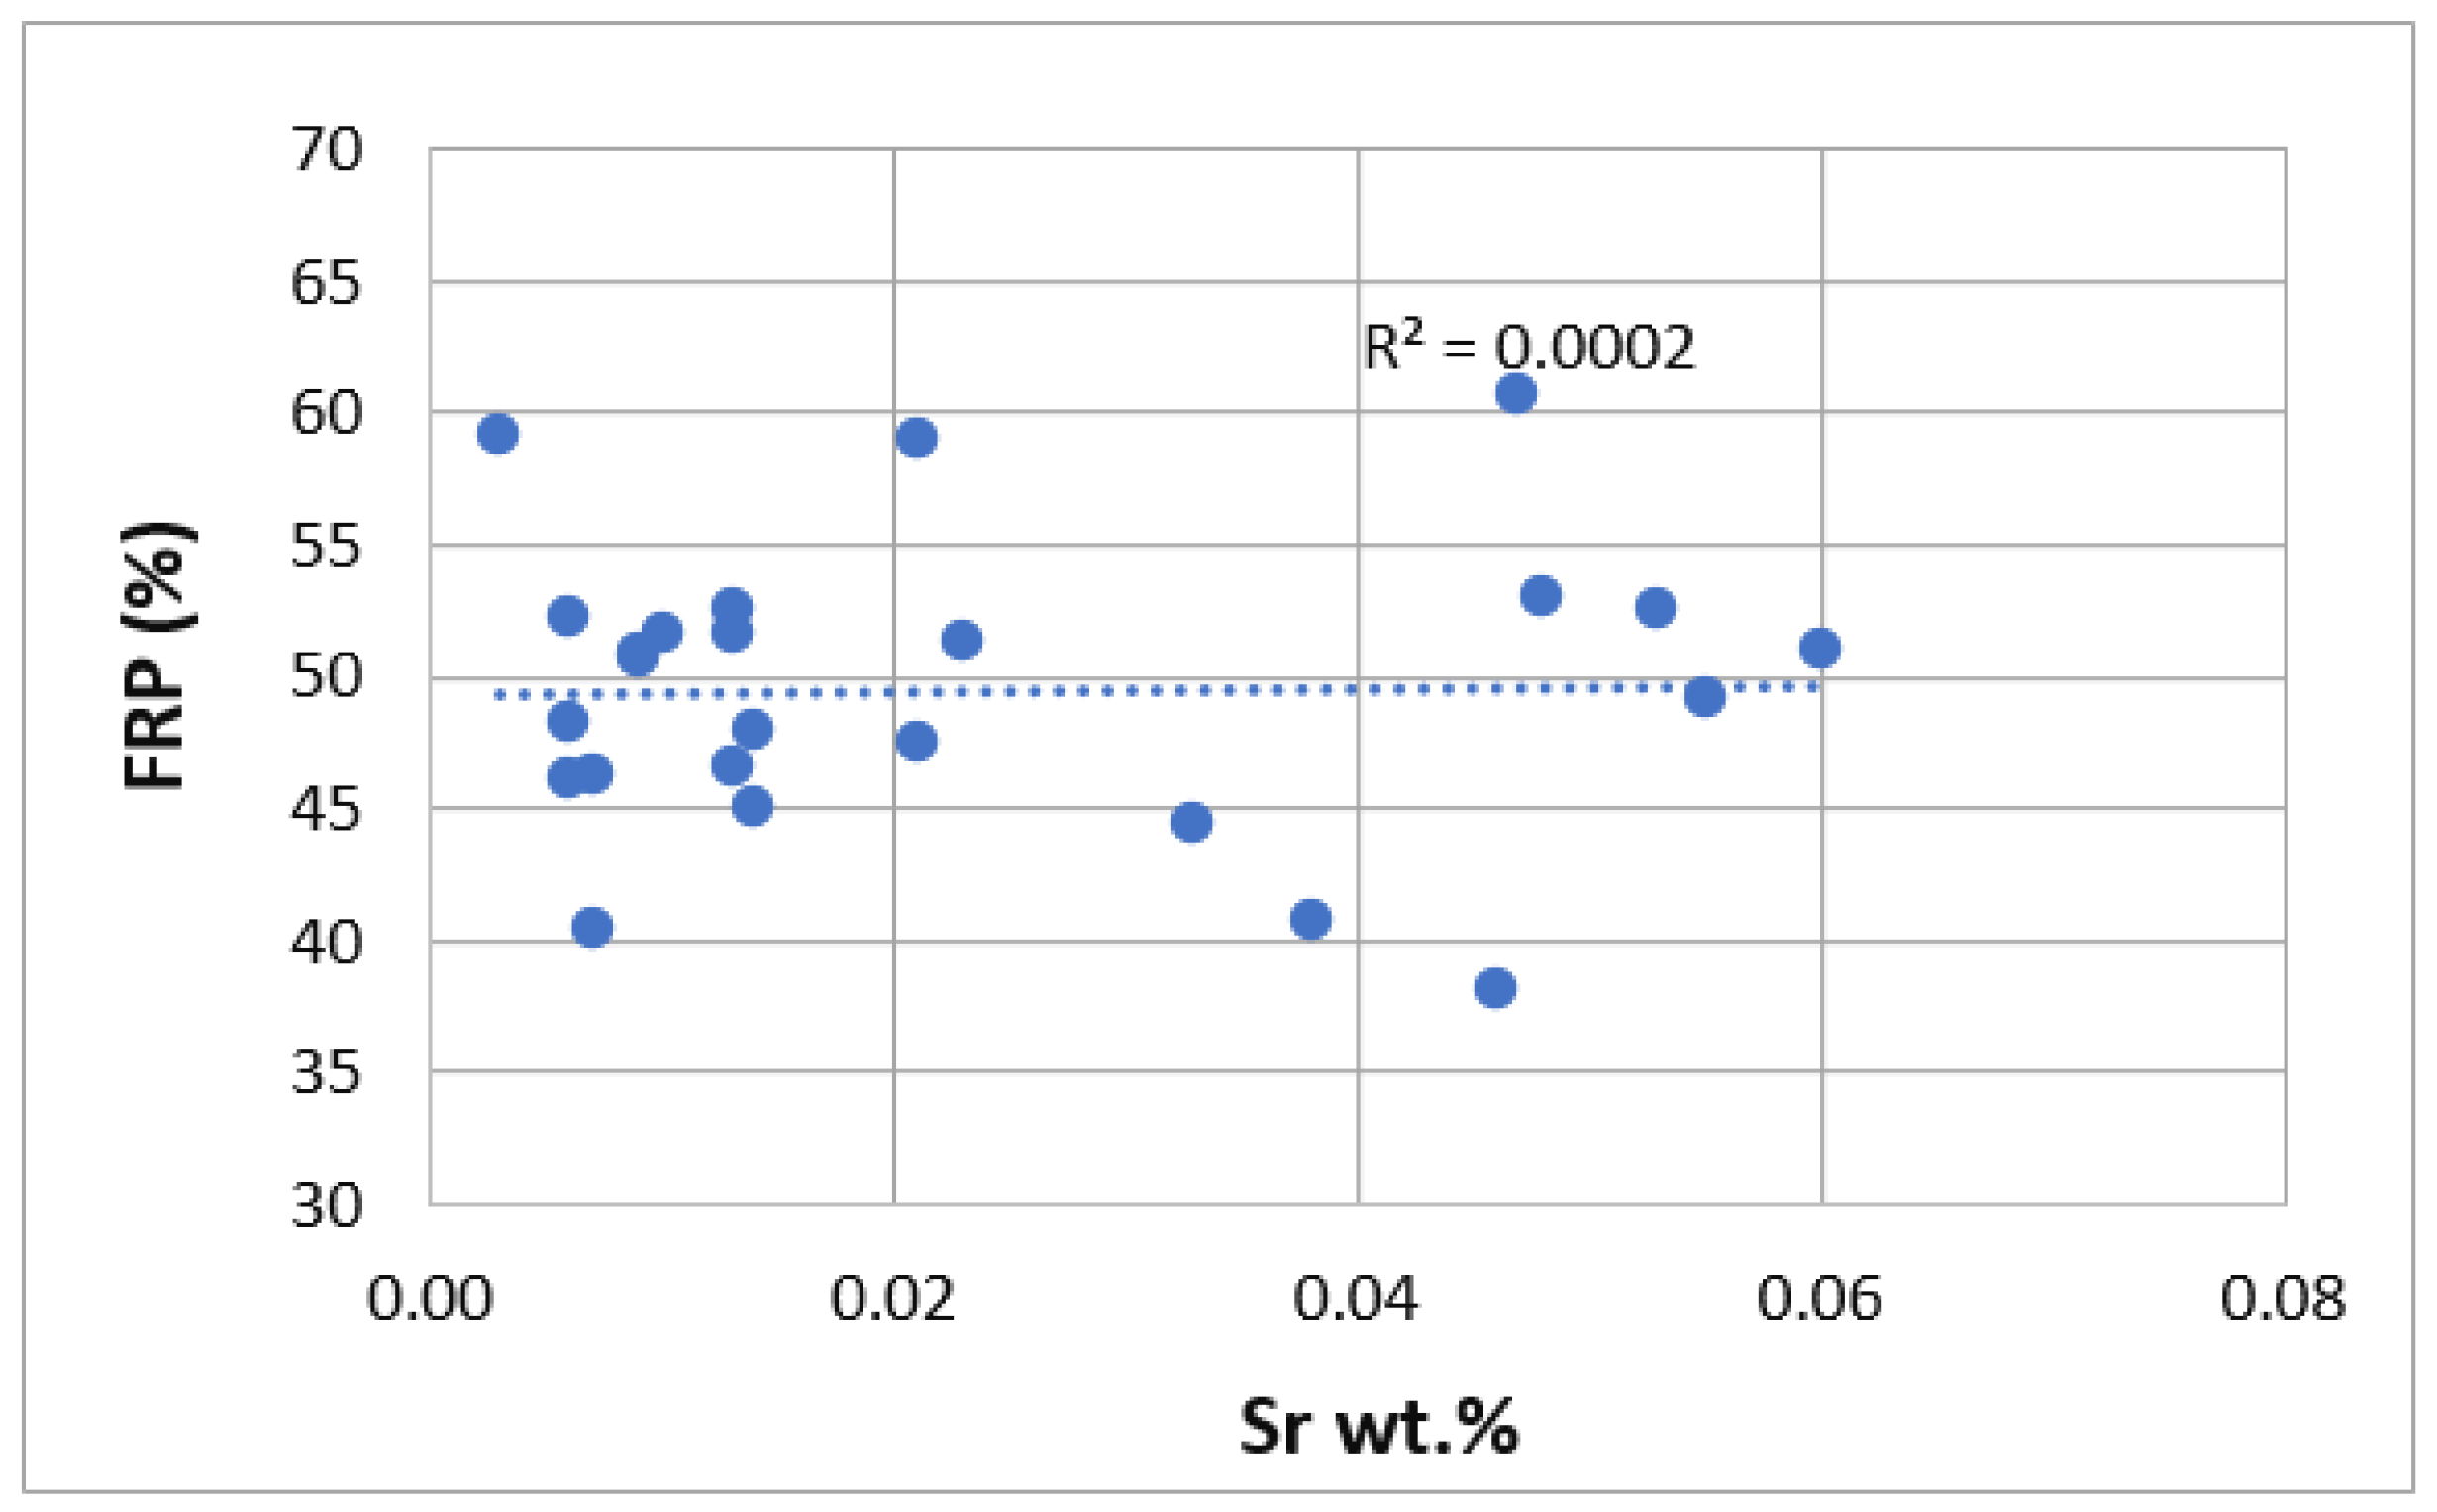
We can observe how the formula obtained has a quite high correlation coefficient value (0.81) and small standard deviation (3.41), showing a good correlation between the predicted and obtained FRP values. Therefore, Si, Cu, Mn, Ti, Zn, Pb and Sn promote a reduction of FRP values, postponing the moment when the stiffening phenomenon occurs. This negative effect of Si can be seen in Figure 3 in weight percentage ranges between 7.5 and 12.5%, and in Figure 4 in the case of manganese up to 1 wt.%. On the other hand, Mg, Fe, Ni, Cr and Sr have the opposite effect, promoting the stiffened network to form faster. In the case of Sr, its positive effect on FRP in ranges from 0% to 0.08% by weight can be seen in Figure 5. Statistical t-values (t) were evaluated to define whether there is a statistically significant influence of a certain alloying element on the studied property. When the t-value is over 2.17, the corresponding alloying element studied has a statistically significant influence. The values obtained are summarized as follows in Table 2.

4. Discussion

We can observe that some of the alloying elements have a statistical significance for the FRP calculation. In general, an increase in the percentage of one alloying element promotes a decrease of FRP value, because there is a decrease of the solidification and related temperatures up to a minimum solidification temperature in the eutectic composition.
Analyzing the results obtained, we can observe that Si, Cu, Mn, Ti, Zn, Pb and Sn promote a reduction in FRP values, postponing the moment when the stiffening phenomenon occurs and increasing the solidification time. In the case of the alloying elements Mg, Fe, Ni, Cr and Sr, the FRP values increase, obtaining a stiffened network in less time.
As indicating by Mahfoud [40] some elements in low percentages such as Sn, Sc, Zr, Ti, Sr and Sb are added to improve the properties of aluminum alloys. In some cases, they can appear as traces or as impurities, but because of their effect on the final properties it is important to have a control of alloy composition before casting. For example, the addition level of only a 0.064% Ti resulted in a smaller grain size microstructure and only a 0.009% B promoted a change to a coarser-equiaxed structure [41].
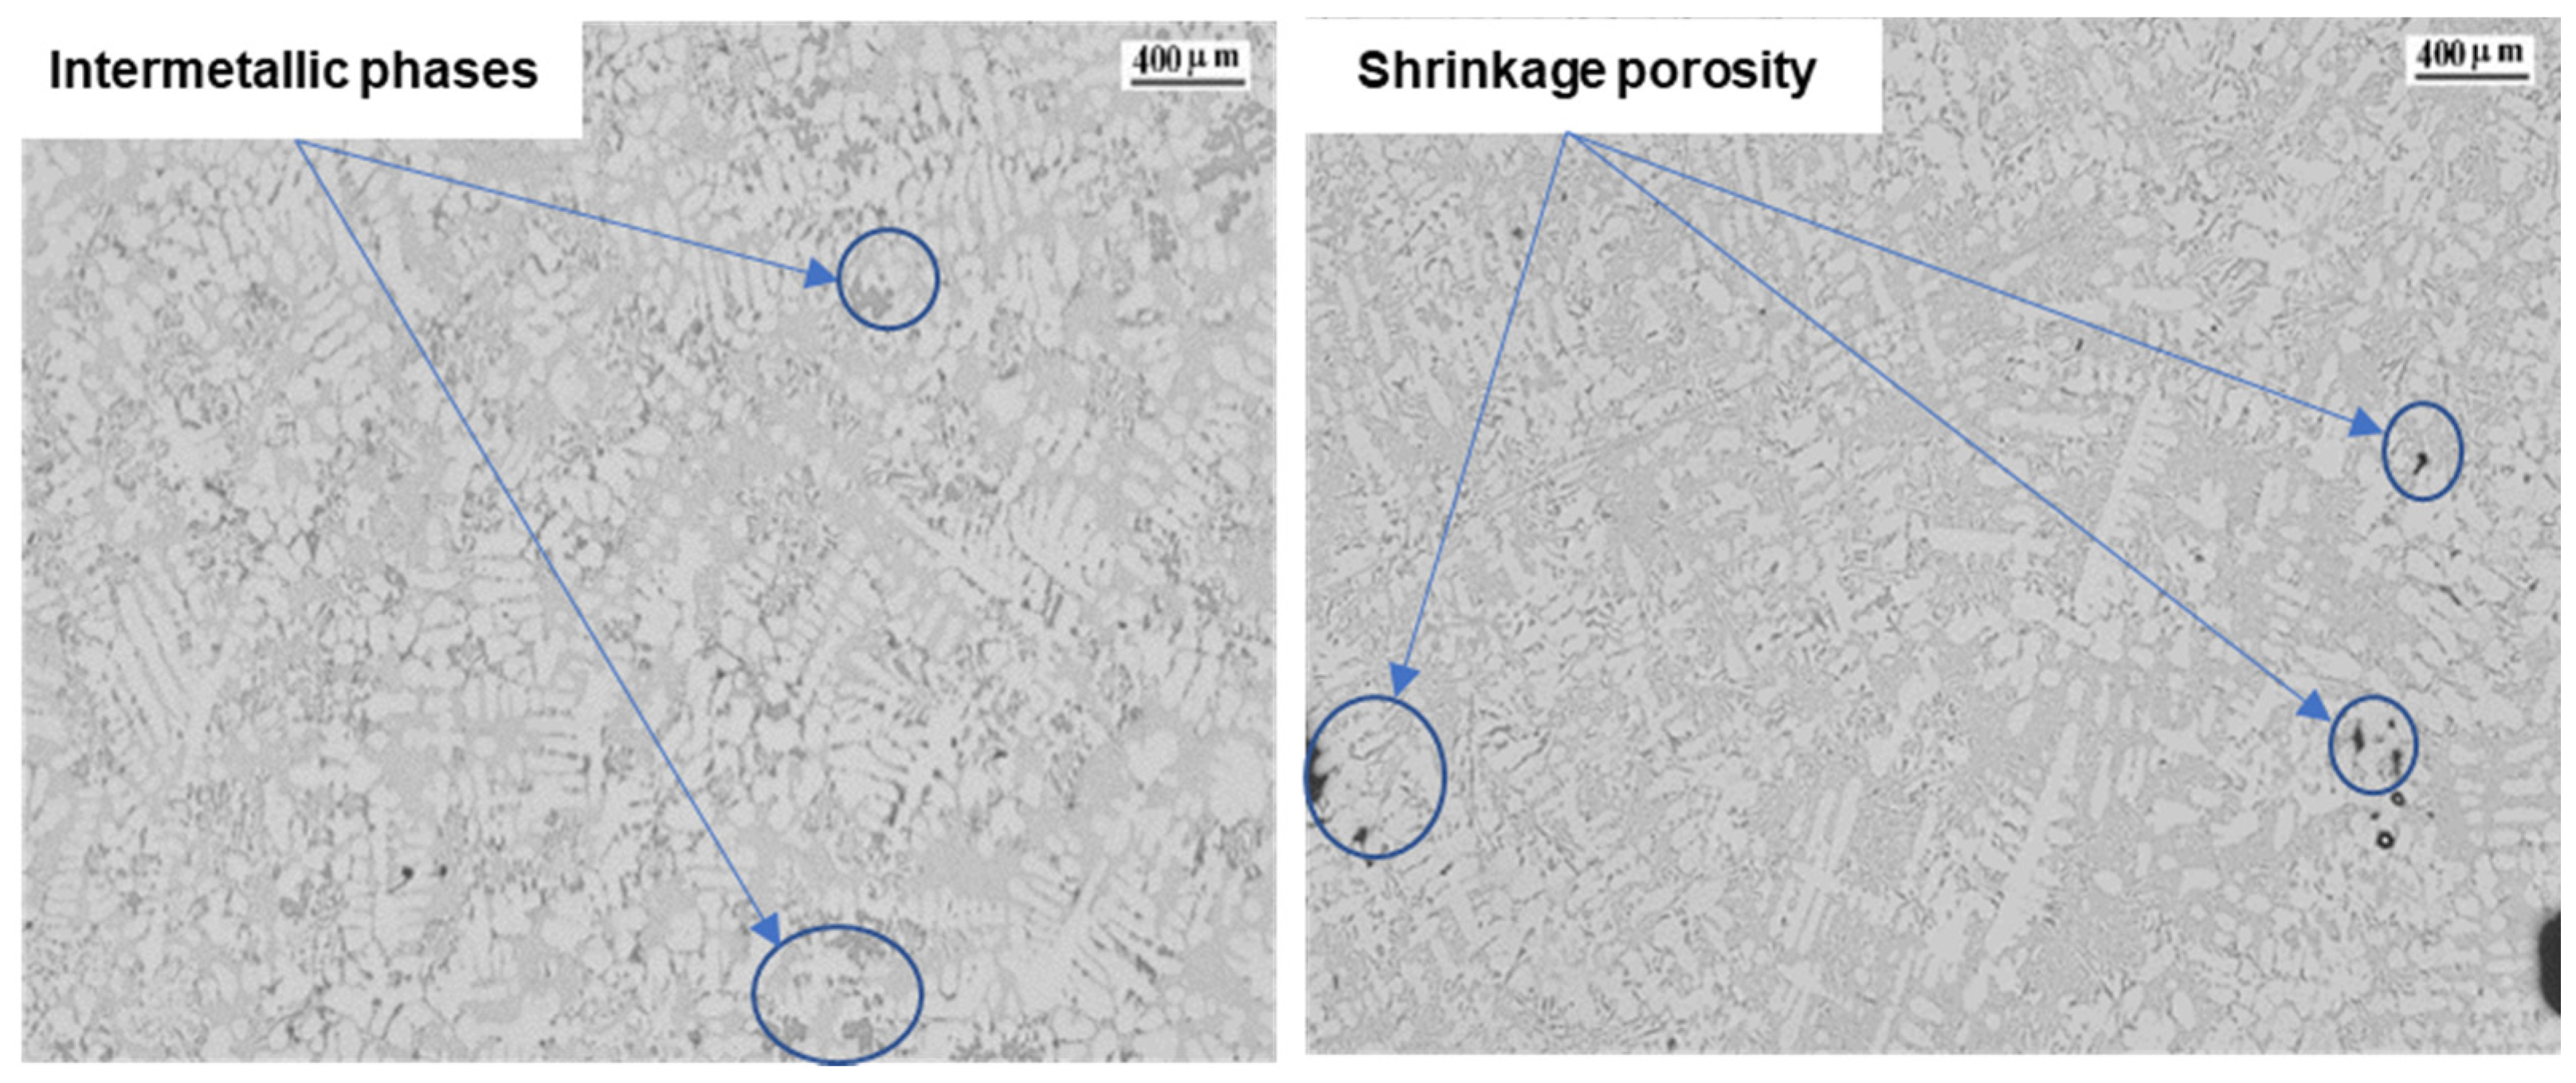
We can compare in Figure 6 the microstructures of alloys 7 and 12, which have respectively the highest and lowest FRP values of the alloys studied. We can observe how the sample with the higher FRP values shows more intermetallic phases, with larger dimensions that promote a more difficult feeding in the interdendritic space [42]. The intermetallic phases obtained in the sample with the lowest FRP value are smaller and less numerous, with some small shrinkage porosity. This is in agreement with a study showing that shrinkage porosity nucleates and grows in regions of a casting where the solid fraction is the lowest [43].
The studied alloy 7 is less eutectic than alloy 12, which is almost eutectic. A near-eutectic alloy has a very short freezing rate, so precipitates form almost immediately near the solidification point and do not have enough time to form coarse intermetallic particles. Additionally, in near-eutectic alloys, the shrinkage porosity is usually small compared with hypoeutectic alloys. The observed percentage of interdendritic shrinkage porosity in sample 12 is small.
The largest positive effect with statistical significance is obtained with Si. It is well known that as the Si content increases, the solidification time increases and a decrease in the liquidus temperature of up to 12% is also observed [44]. Si precipitates in different phases, but in the presence of Mg, Si reacts with Mg to form Mg2Si, which is the preferred precipitation phase for Mg. However, almost all the Si in this alloy remains as pure Si in the eutectic area. We can see in Figure 7 how a Sr-modified alloy with a high level of alloying elements and Si has very fine polyhedral particles, with small precipitates and some isolated black particles. There are only a few acicular precipitates, but they do not block the liquid feed from the interdendritic space. Due to the low proportion of Mg in the alloy, no Mg2Si phases have been detected in the SEM+EDS analysis, with the Mg dissolved within the aluminum matrix.
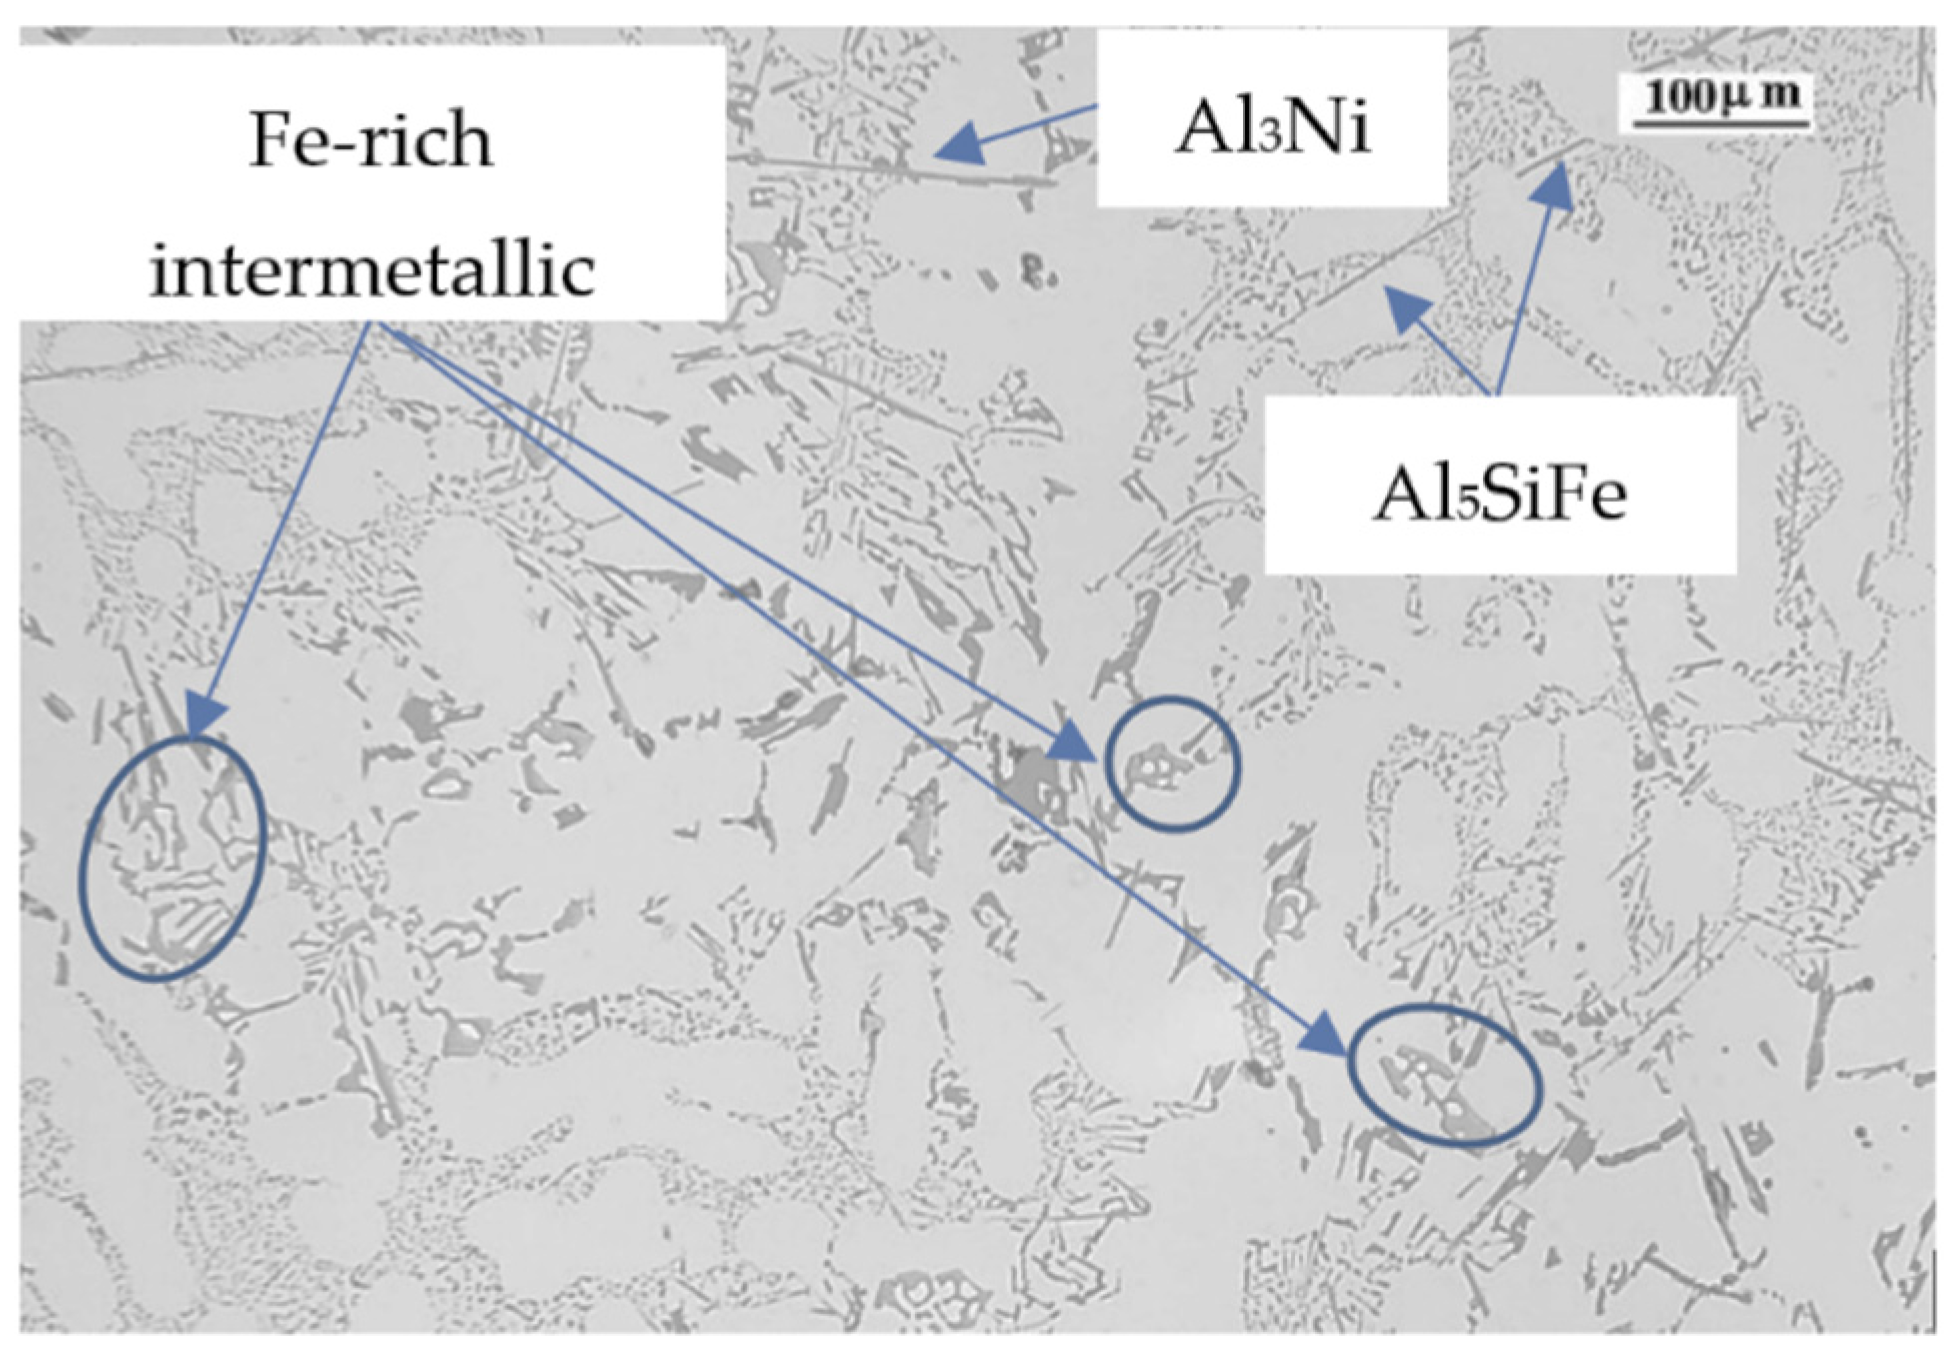
SEM+EDS determination of the different observed phases shows that the polyhedral and skeleton-like particles correspond to Fe-based precipitates with Cr and Mn. The acicular precipitates correspond to the thinner β-Al5FeSi phase and the thicker and shorter Al3Ni phase, as shown in Figure 8 by the electro image with the analysis of chemical composition in weight performed.
The Fe-rich phases with Cr and Mn and specially Al3Ni phases are created at temperatures higher than the liquidus temperature of the alloy and are embedded in the aluminum matrix.
As the Cu content in an alloy increases, the solidification time increases its value and the liquidus temperature decreases, mainly changing the alloy towards a more eutectic alloy. Cu precipitates mainly as Al2Cu in the final stage of the solidification process, at temperatures very close to the solidus temperature, with an enrichment of Cu in the remaining eutectic liquid. Thus, the Cu precipitates do not decrease the ability of the solid particles to move in the remaining liquid (fluidity) [45], nor thermal conductivity, because as the particles precipitates at the final stage, there are few solid particles in the remaining liquid until the end of the solidification process. Cu also has another preferred way of precipitating, which it is in combination with Fe, modifying the structure of β-Al5FeSi phase from acicular or plate-like to skeleton structures, such as in the Q-Al5Mg8Cu2Si6 phase [46,47,48,49], increasing the fluidity. In Figure 9 we can observe the microstructure of alloy 6, where Cu is present as Al2Cu in the interdendritic space. The high percentage of Cr and Mn modify the β-Al5FeSi to a skeleton-like structure. Many of them can be detected and also some remaining β-Al5FeSi. Ni is presented as Al3Ni acicular phase. The FRP value of this alloy is 48.23%, a value close to the average of all the samples studied. In this case, the increase in fluidity linked to the presence of Cu is partially limited by the presence of acicular phases.
Mn changes the morphology of the iron-rich β-Al5FeSi phase from its typical acicular shape to a more cubic and compact Al15(MnFe)3Si2 shape [49,50]. The shape change allows easier movement of the compact phases over the remaining liquid in the interdendritic space, increasing the solidification time and reducing the stiffness of the melt. The α-Al15 (Fe,Mn)3Si2 phase precipitates at high temperatures, reducing the coarsening ability of the possible remaining β-Al5FeSi phase and thus increasing the fluidity of the alloy. It also promotes a very fine eutectic structure, as shown in Figure 10.
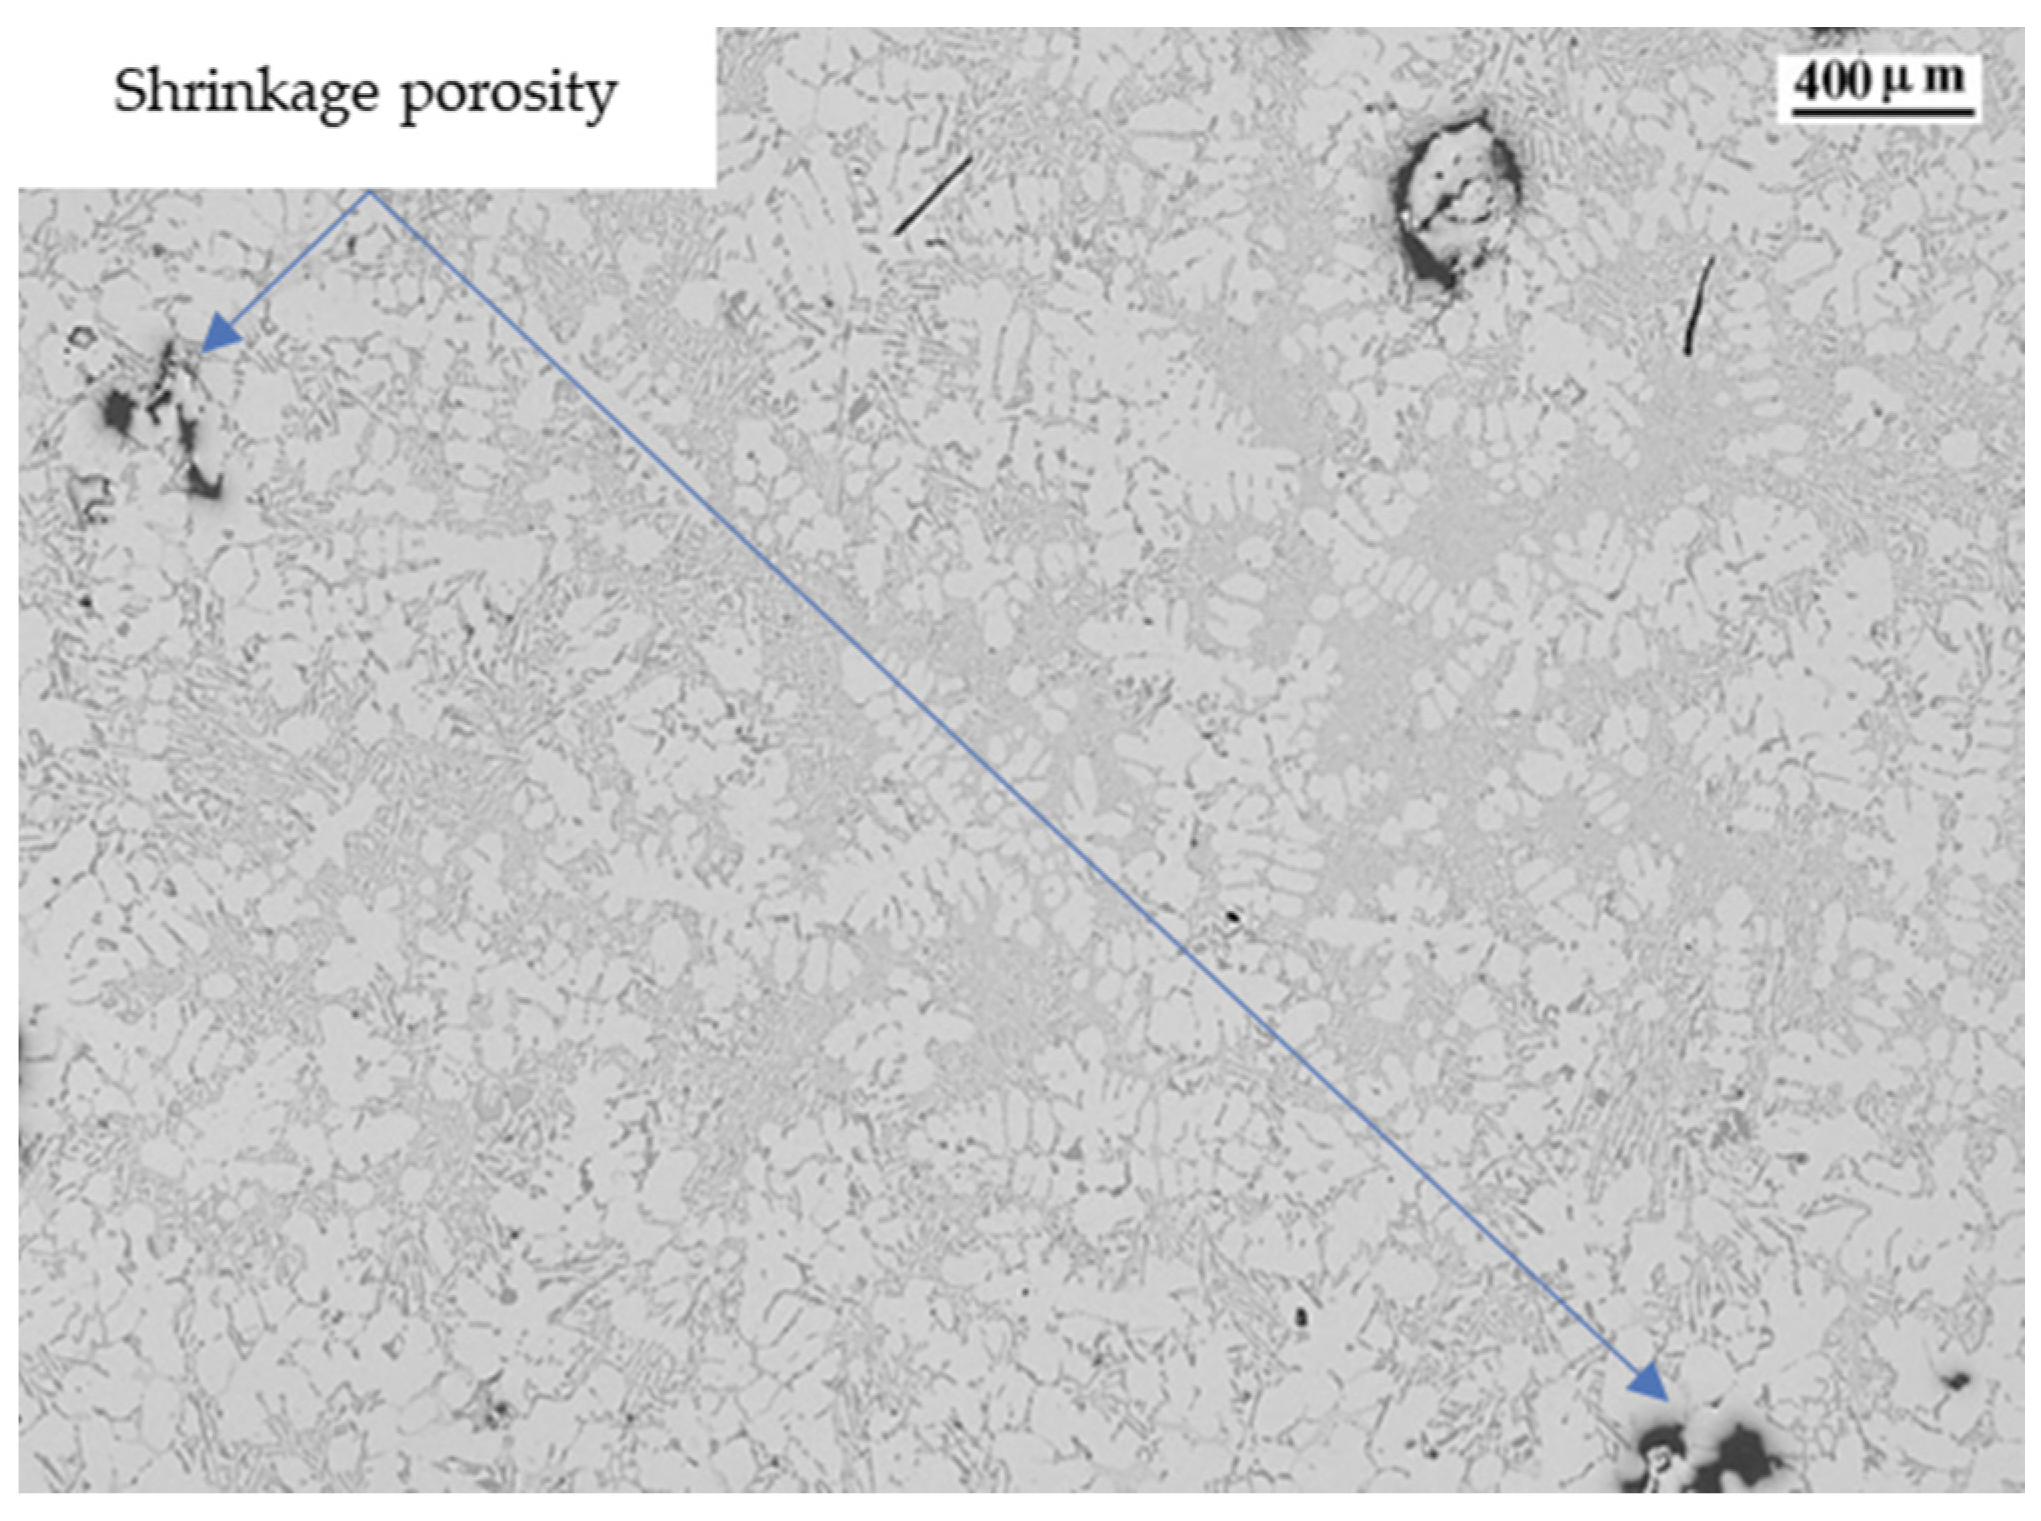
Ti is a refining element that promotes grain size reduction. Grain size reduction increases the fluidity of the alloy and the solidification time. It also increases the heat transfer from the solidifying alloy to the surroundings. We can observe in Figure 10 a well-refined structure, with small aluminum dendrites and the presence of shrinkage porosity.
Zn and Sn at the concentrations studied in this work tend to be dissolved in the alloy, solidifying within the aluminum dendrites in the aluminum matrix. An increase in the percentage of Zn and Sn promotes a more eutectic alloy, with a reduction in FRP values.
Pb appears as isolated dots at the grain border, being the element that is one of the last to precipitate in the final interdendritic space. It promotes a more eutectic alloy, increasing the solidification time and decreasing FRP values.
In the case of the rest of the alloying elements studied in this work, we can observe how Mg, Fe, Ni, Cr and Sr promote the increase of FRP values, pushing the stiffened lattice to form faster.
Mg precipitates as Mg2Si in the inter-grain space, mainly from the remaining eutectic liquid within the interdendritic space. It promotes faster rigidity, because it reduces the solidification time and because it hinders the movement of the remaining eutectic liquid. It has also been observed that Mg has an effect on increasing the coalescence of solid fraction, because a solid skeleton can develop earlier in Mg-rich alloys, such as the π-Al8Mg3FeSi6 phase [51], preventing free movement of the remaining liquid. Mg2Si has a typical bone structure that restricts the movement of the remaining liquid.
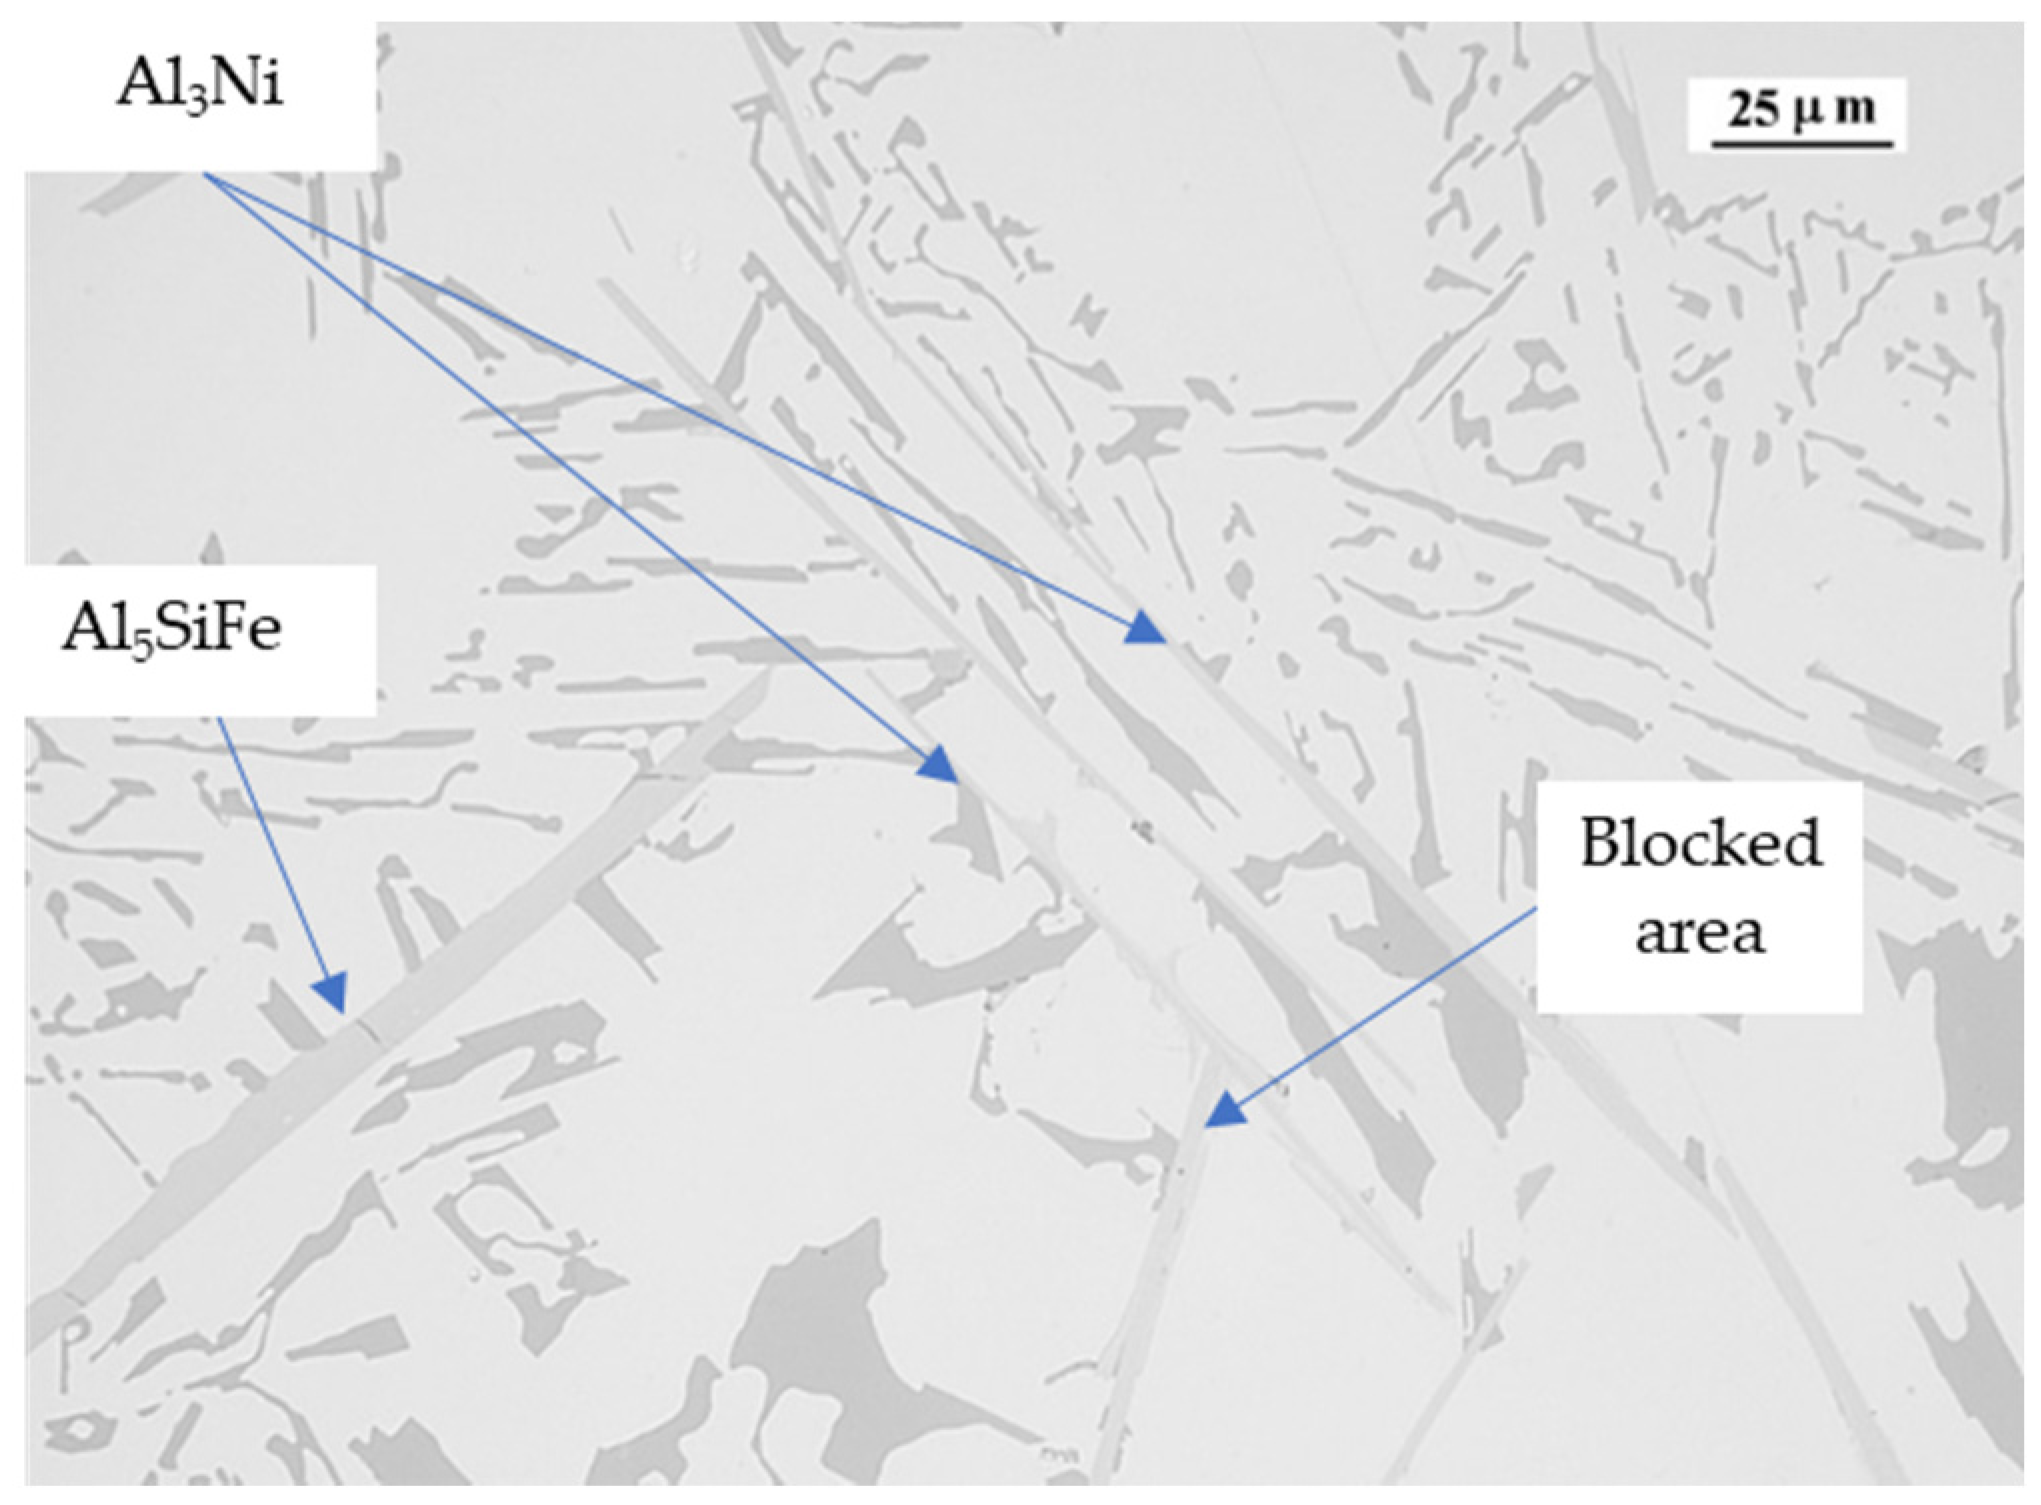
Fe and Ni tend to form acicular or plate-like phases, β-Al5SiFe for Fe and Al3Ni for Ni. These needle or plate-like structures reduce the movement between the solid particles in the remaining liquid, reducing the fluidity and feed of the remaining liquid, due to the impeachment of the acicular or plate-like phases. In Figure 11 we can see how the acicular phases tend to impede the feeding of the interdendritic space.
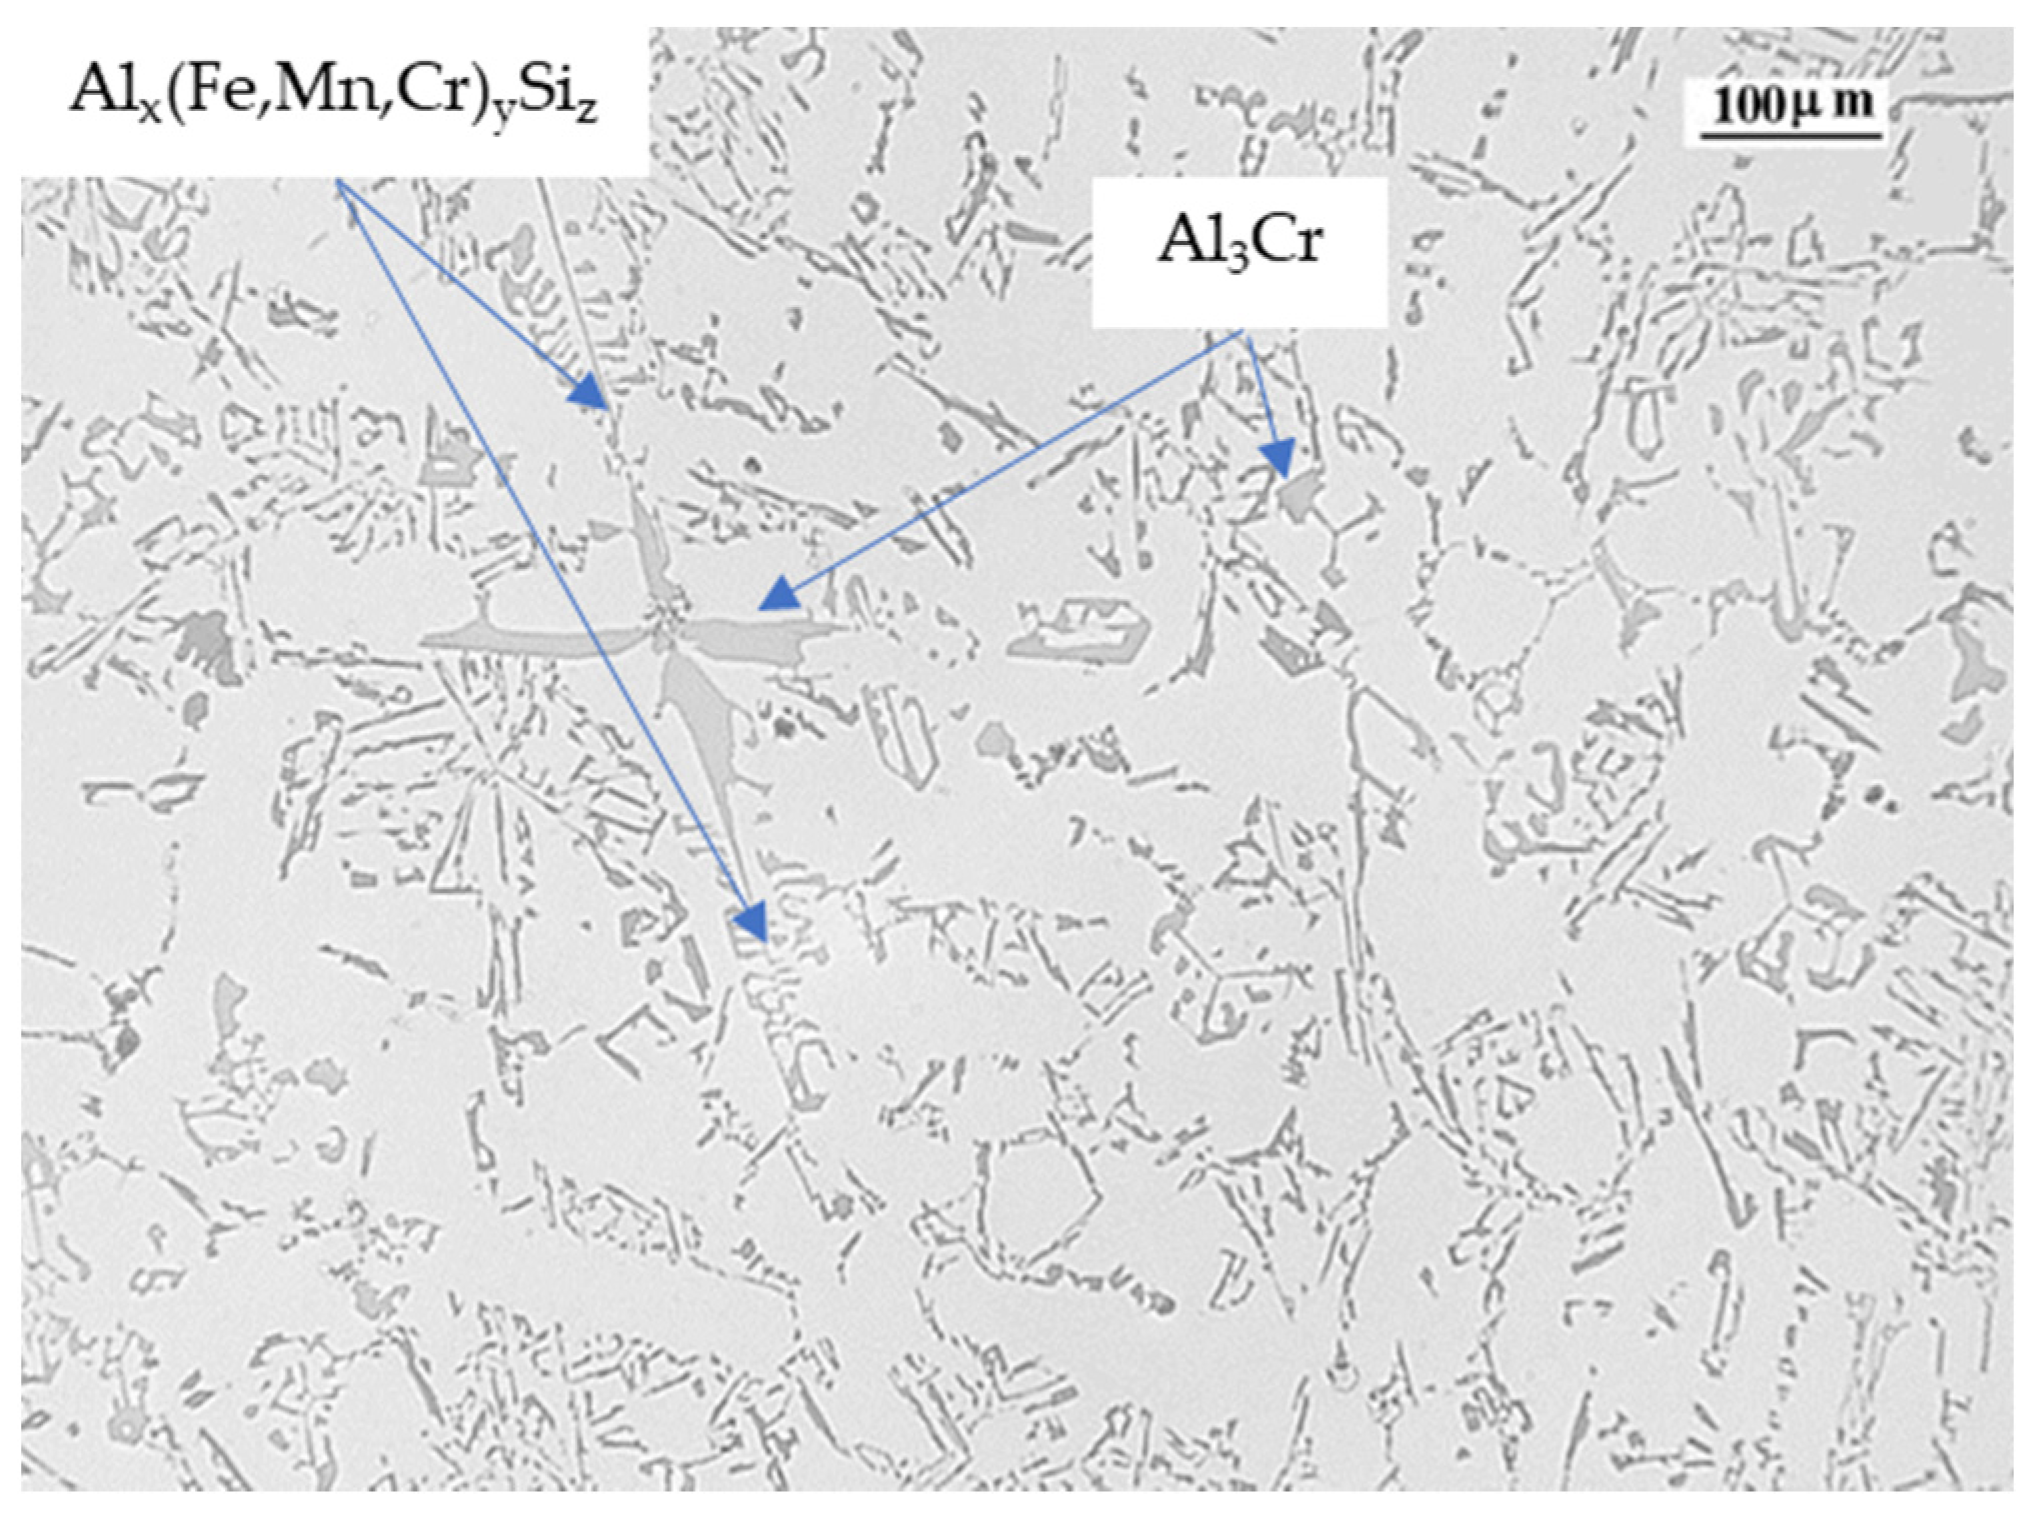
Cr in combination with manganese (Mn) also changes the morphology of the iron-rich β-Al5FeSi phase from its typical platelet/acicular form to a more cubic Al15(MnFe)3Si2 form, with a reduction of the blocking effect from platelet/acicular phases to solid particles in the remaining eutectic fluid [52,53]. Although Cr favors the formation of primary slurry particles and pro-eutectic α-Alx(Fe,Mn,Cr)ySiz intermetallic compounds, any increase in the amount of Fe-rich particles is coupled with an increase in the size of Alx(Fe,Mn,Cr)ySiz intermetallic compounds. As the Cr level increases, the modification of the sludge morphology from a more or less well-formed hexagon tends to change to a more branched or star shape [54]. In both cases and depending on the alloy composition, the movement of the remaining liquid metal within the interdendritic space may be restricted, reducing the movement of the solid particles towards each other. In Figure 12 we can observe the presence of script-like Alx(Fe,Mn,Cr)ySiz phases as well as Al3Cr phases, which precipitate before the precipitation of the aluminum dendrites begins.
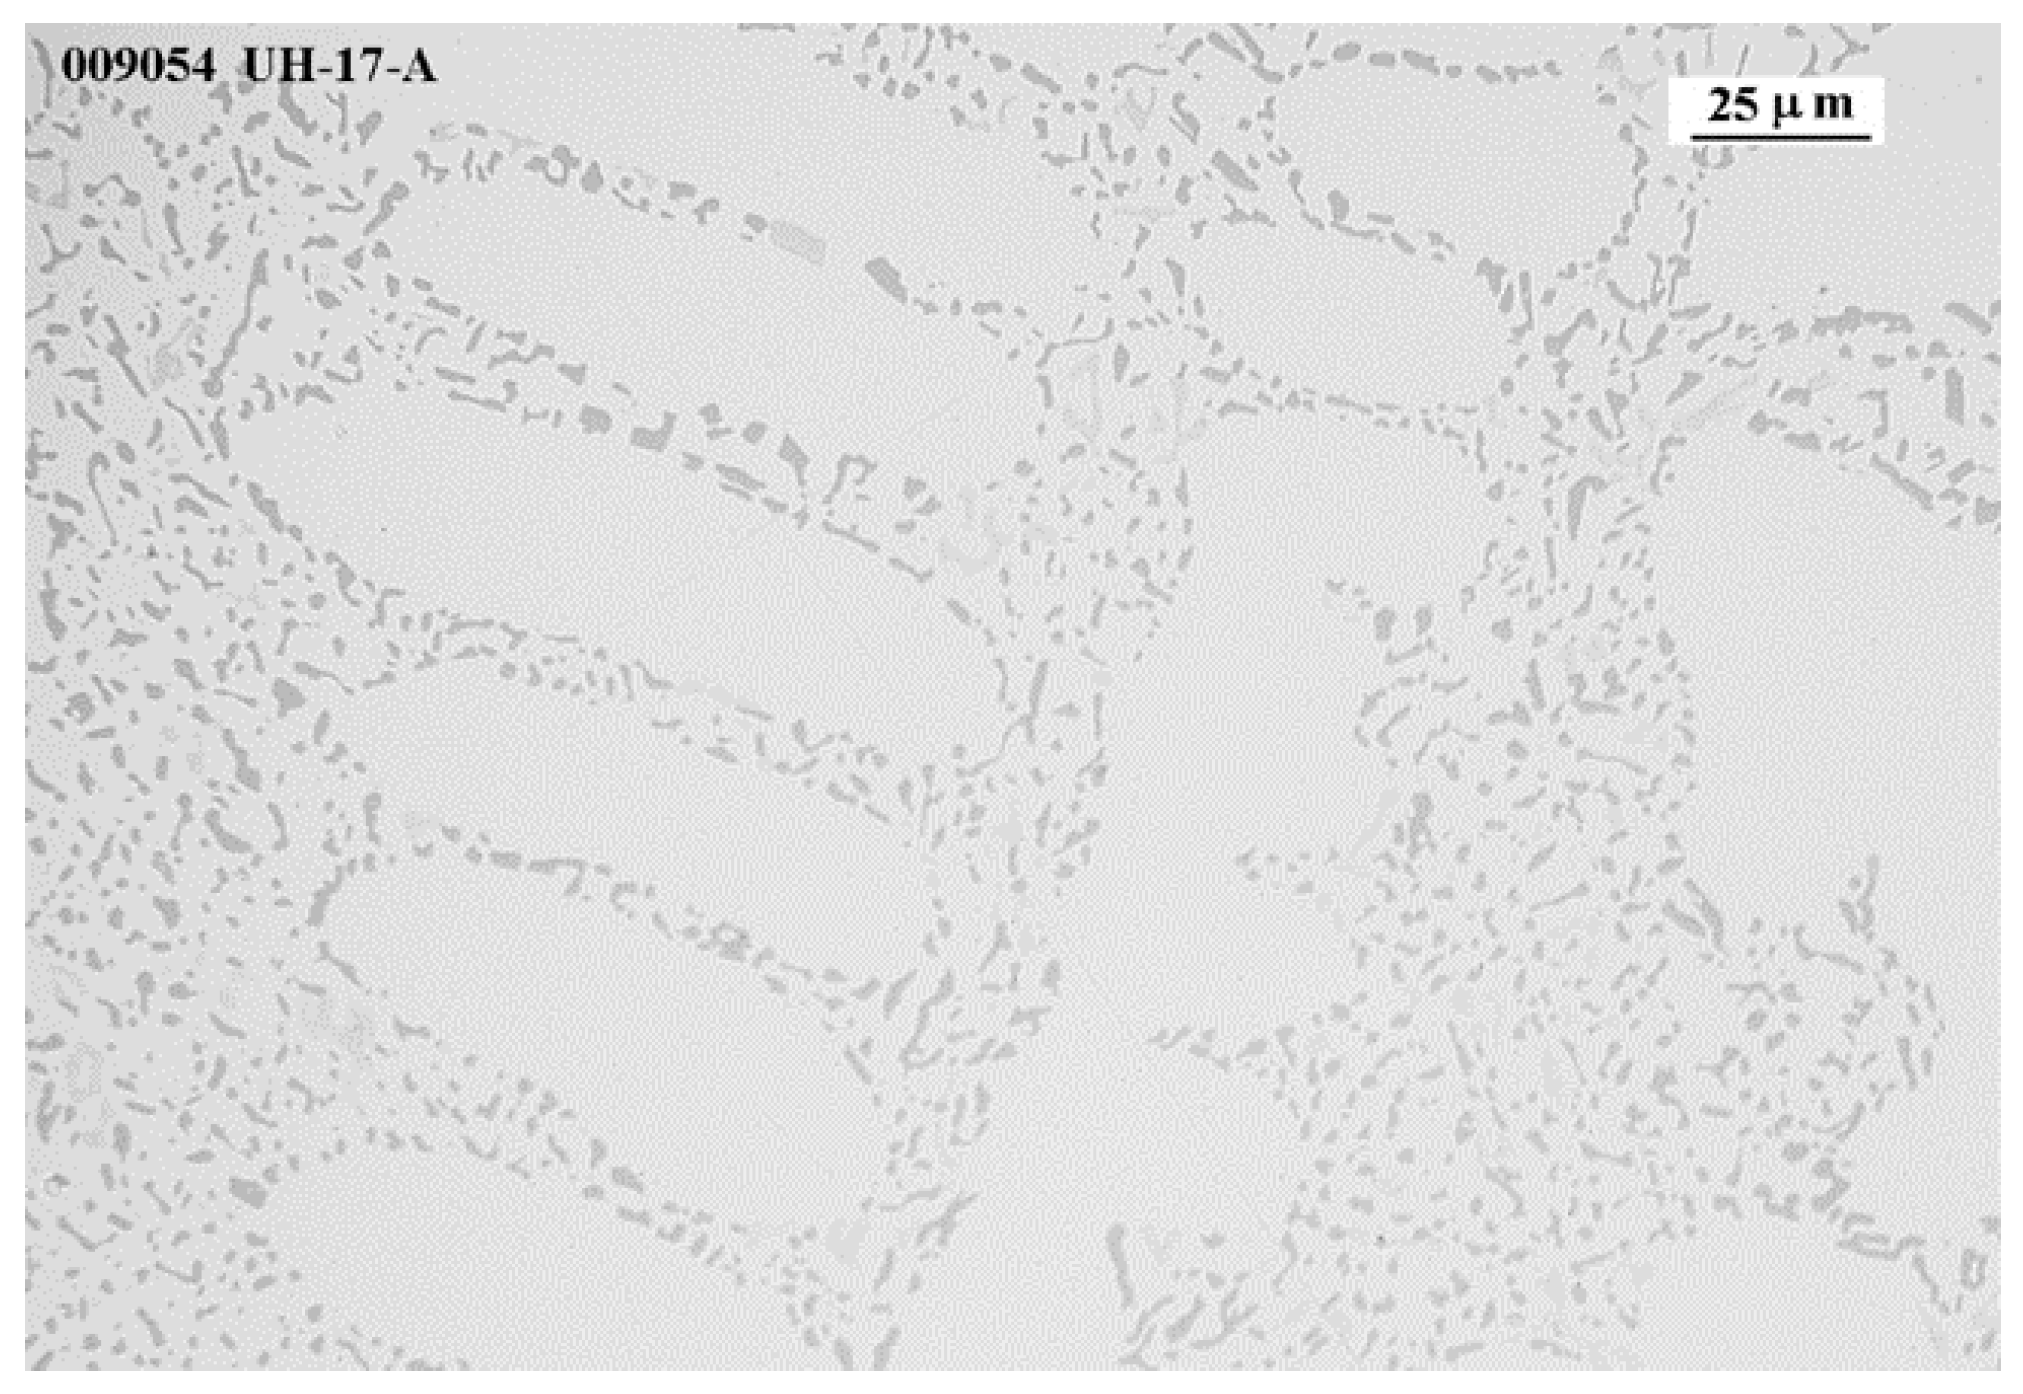
Sr modifies the eutectic phase from a plate-like phase to a smaller [55] and rounded eutectic phase, increasing the fluidity of the melt. However, when the amount of Sr is high enough, an over-modification of the eutectic structure is observed, with a thickening effect of the eutectic particles, reducing the melt fluidity and solidification time. Figure 13 shows a well-modified eutectic structure, with very fine, rounded eutectic particles around the aluminum dendrites, which facilitates the movement of the remaining eutectic liquid. It is well known that a modified alloy increases the solidification time and decreases the solidification temperature.

5. Conclusions

A new formula has been developed using the Taguchi methodology to determine the FRP value of the AlSi10Mg alloy with a defined alloy composition. The statistical values obtained show that the FRP values can be calculated with high accuracy, regardless of the exact composition of the AlSi10Mg alloy.
Mg, Fe, Ni, Cr and Sr are the elements that have a negative influence on FRP values, but only Sr has a statistical significance. The remaining alloying elements have a positive influence on FRP values, but only Mn and Si are statistically significant. The greater or lesser influence of every alloying element has been correlated with the different phases and microstructures formed by the addition of an alloying element.
The increase in FRP values is related to the restriction on the free interdendritic liquid feed, which is reduced by the acicular phases and unmodified eutectic particles. On the contrary, the absence of these acicular phases and the modification of the eutectic ones increases the interdendritic feed during the solidification stage.
Determining FRP values using the point where the RPT coincides with the point of intersection with the zero of the second and third derivatives after the maximum liquidus temperature, using the dFs/dT vs. T curve could increase the accuracy of automated solidification parameter determination equipment and simulation software.
Further work will be developed to determine FRP values using the torque method and using Calphad based simulation software.

Author Contributions

E.V.: Methodology, conceptualization, investigation and writing—original draft. I.V.: Methodology, conceptualization, investigation, writing, project administration, resources. J.M.S.: Writing and review. J.A.: Writing and review. J.M.: Review. All authors have read and agreed to the published version of the manuscript.

Funding

This work has been partially funded by the Basque Government through the HAZITEK Programme ZE-2018/00018 (FACOEE) and ELKARTEK KK-2020_00047 (CEMAP).

Institutional Review Board Statement

Not applicable.

Informed Consent Statement

Not applicable.

Data Availability Statement

Not applicable.

Conflicts of Interest

The authors declare that they have no known competing financial interests or personal relationships that could have appeared to influence the work reported in this paper.

References

  1. Cornacchia, G.; Dioni, D.; Faccoli, M.; Gislon, C.; Solazzi, L.; Panvini, A.; Cecchel, S. Experimental and numerical study of an automotive component produced with innovative ceramic core in high pressure die casting (HPDC). Metals 2019, 9, 217. [Google Scholar] [CrossRef] [Green Version]
  2. Jolly, M.; Katgerman, L. Modelling of defects in aluminium cast products. Prog. Mater. Sci. 2022, 123, 1–39. [Google Scholar] [CrossRef]
  3. Bonollo, F.; Gramegna, N.; Timelli, G. High temperature behaviour of high pressure diecast. J. Miner. Met. Mater. Soc. 2015, 67, 901–908. [Google Scholar] [CrossRef]
  4. Bogagui, F.; Movahedi, M.; Kokabi, A.H.; Tavakoli, R. Effect of solid fraction, grain misorientation and grain boundary energy on solidification cracking in weld of Al–Cu aluminum alloys. Mater. Res. Express 2019, 6, 8. [Google Scholar]
  5. Voncina, M.; Mrvar, P.; Medved, J. Thermodynamic analysis of AlSi10Mg alloy. RMZ-Mater. Geoenviron. 2006, 52, 621–633. [Google Scholar]
  6. Chai, G.; Backerud, L.; Rolland, T.; Arnberg, L. Dendrite coherency during equiaxed solidification in binary aluminum alloys. Metall. Mater. Trans. A 1995, 26A, 965–970. [Google Scholar] [CrossRef]
  7. Hamadellah, A.; Bouayad, A. Study of hot tear of AlCu5MgTi by restraining casting shrinkage in green-sand mold. JMES 2017, 8, 3099–3105. [Google Scholar]
  8. Santhi, S. Calculation of shrinkage of sand cast aluminium alloys. Int. J. Appl. Eng. Res. 2018, 13, 8889–8893. [Google Scholar]
  9. Hamadellaha, A.; Bouayada, A.; Geromettaba, C. Hot tear characterization of AlCu5MgTi and AlSi9 casting alloys using an instrumented constrained six rods casting method. J. Mater. Process. Technol. 2017, 244, 282–288. [Google Scholar] [CrossRef]
  10. Chai, G.; Backerud, L.; Avnberg, L. Study of dendrite coherency in Al-Si alloys during equiaxed dendritic solidification. Int. J. Mat. Res. 1995, 86, 54–59. [Google Scholar] [CrossRef]
  11. Anglada, E.; Meléndez, A.; Vicario, I.; Arratibel, E.; Aguillo, I. Adjustment of a high pressure die casting simulation model against experimental data. Procedia Eng. 2015, 132, 966–973. [Google Scholar] [CrossRef] [Green Version]
  12. Li, G.; Lu, H.; Hu, X.; Lin, F.; Li, X.; Zhu, Q. Current progress in rheoforming of wrought aluminum alloys: A review. Metals 2020, 10, 238. [Google Scholar] [CrossRef] [Green Version]
  13. Peti, F.; Strnad, G. The effect of squeeze pin dimension and operational parameters on material homogenity of aluminium high pressure die cast parts. Acta Marisiensis Ser. Technol. 2019, 16, 7–12. [Google Scholar] [CrossRef] [Green Version]
  14. Djurdjevic, M.B.; Stockwell, T.; Sokolowski, J. The effect of strontium on the microstructure of the aluminium-silicon and aluminium-copper eutectics in the 319 aluminium alloy. Int. J. Cast Met. Res. 1999, 12, 67–73. [Google Scholar] [CrossRef]
  15. Vicario, I.; Villanueva, E.; Montero, J.; Djurdjevic, M.; Huber, G. The determination of dendrite coherency point characteristics using three new methods for aluminum alloys. Appl. Sci. 2018, 8, 1236. [Google Scholar] [CrossRef] [Green Version]
  16. Vicario, I.; Djurdjevic, G.; Villanueva, E.; Meléndez, A. Description of Al-Si10-Mg1 alloys by advanced thermal analysis based on their known chemical compositions. In Proceedings of the 72nd World Foundry Congress, Nagoya, Japan, 21–25 May 2016. [Google Scholar]
  17. Pelayo, G.; Sokolowski, J.H.; Lashkari, R.A. A case based reasoning aluminium thermal analysis platform for the prediction of W319 Al cast component characteristics. J. Achiev. Mater. Manuf. Eng. 2009, 36, 7–17. [Google Scholar]
  18. Djurdjevic, M.B.; Huber, G. Determination of rigidity point/temperature using thermal analysis method and mechanical technique. J. Alloys Compd. 2014, 590, 500–506. [Google Scholar] [CrossRef]
  19. Drezet, J.M.; Mireux, B.; Szaraz, Z.; Pirling, T. Determination of coherency and rigidity temperatures in Al-Cu alloys using in situ neutron diffraction during casting. JOM 2014, 66, 1425–1430. [Google Scholar] [CrossRef] [Green Version]
  20. Iron Thermal Analysis Thermal Arrests—Exothermic and Endothermic a More or Less Complete Guide to Arrests and Inflection Points in Iron. Available online: https://www.linkedin.com/pulse/iron-thermal-analysis-arrests-exothermic-endothermic-more-sparkman (accessed on 3 November 2021).
  21. Djurdjevic, M.B.; Vicario, I. Description of hypoeutectic Al-Si-Cu alloys based on their known chemical compositions. Rev. De Metal. 2013, 49, 340–350. [Google Scholar] [CrossRef] [Green Version]
  22. Villanueva, E.; Vicario, I.; Sánchez, J.M.; Crespo, I. Determination of solidification of rigidity point temperature using a new method. Appl. Sci. 2020, 10, 2472. [Google Scholar] [CrossRef] [Green Version]
  23. Gottardi, A.; Pola, A. Solid fraction determination via DSC analysis. Metall. Ital. 2015, 5, 11–16. [Google Scholar]
  24. Marchwica, P.; Sokolowski, J.H.; Kierkus, W.T. Fraction solid evolution characteristics of AlSiCu alloys—Dynamic baseline approach. J. Achiev. Mater. Manuf. Eng. 2011, 47, 115–136. [Google Scholar]
  25. Emadi, D. Comparison of Newtonian and Fourier thermal analysis techniques for calculation of latent heat and solid fraction of aluminum alloys. J. Metall. 2004, 10, 91–106. [Google Scholar] [CrossRef] [Green Version]
  26. Djurdjevic, M.B. Impact of major alloying elements on the solidification parameters of cast hypoeutectic AlSi6Cu (1–4 wt.%) and AlSi8Cu (1−4 wt.%) alloys. Metall. Mater. Eng. 2014, 20, 235–246. [Google Scholar] [CrossRef] [Green Version]
  27. Brùna, M.; Kucharík, L. A progressive method of porosity prediction for aluminium castings. Mater. Tehnol. 2014, 48, 949–952. [Google Scholar]
  28. Djurdjevic, M.B.; Manasijevic, S.; Odanovic, Z.; Radis, R. Analysis of the solidification path of Al-Si9-Cu(1–4) alloys using thermal analysis technique. Metall. Ital. 2014, 106, 23–28. [Google Scholar]
  29. Djurdjevic, M.B.; Sokolowski, J.H.; Odanovic, Z. Determination of dendrite coherency point characteristics using first derivative curve versus temperature. J. Therm. Anal. Calorim. 2012, 109, 875–882. [Google Scholar] [CrossRef]
  30. Richard, M. Atlas Métallographique des Alliages D´Aluminium de Fonderie; Centre Technique des Industries de la Fonderie: Paris, France, 1975. [Google Scholar]
  31. Atlas Métallographique de l´A-S5 U3, Éditions Techniques des industries de la Fonderie; Centre Technique des Industries de la Fonderie: Paris, France, 1980.
  32. Atlas Métallographique de L´A-S13, Éditions Techniques des industries de la Fonderie; Centre Technique des Industries de la Fonderie: Paris, France, 1980.
  33. Vander, G. Metallography and Microstructures. In Metals Handbook, 9th ed.; ASM International: Novelty, OH, USA, 1999; Volume 9. [Google Scholar]
  34. Fabrizi, A.; Capuzzi, S.; Timelli, G. The influence of Sr, Mg and Cu addition on the microstructural properties of a secondary AlSi9Cu3(Fe) die casting alloy. Mater. Charact. 2013, 85, 13–25. [Google Scholar] [CrossRef]
  35. Timelli, G.; Bonollo, F. The influence of Cr content on the microstructure and mechanical properties of AlSi9Cu3(Fe) die-casting alloys. Mater. Sci. Eng. 2010, 528, 273–282. [Google Scholar] [CrossRef]
  36. Camicia, G.; Timelli, G. Grain refinement of gravity die cast AlSi7Cu3Mg alloys for automotoive cylinder heads. Trans. Nonferrous Met. Soc. China 2016, 26, 1211–1221. [Google Scholar] [CrossRef]
  37. Rakhmonov, J.; Timelli, G.; Fabrizi, A.; Bonollo, F. Effect of V and Zr microalloying, and heat treatment on microstructure and mechanical properties of secondary Al7Si3Cu0.3Mg alloy. Int. J. Mater. Res. 2018, 109, 1099–2018. [Google Scholar] [CrossRef]
  38. Huber, G.; Djurdjevic, M.B.; Manasijevic, S. Quantification of feeding regions of hypoeutectic Al-(5, 7, 9)Si-(0-4)Cu (wt.%) alloys using cooling curve analysis. In Mass Production Processes; IntechOpen: London, UK, 2019. [Google Scholar] [CrossRef] [Green Version]
  39. Djurdjevic, M.B.; Mnasijevic, S.; Odanovic, Z.; Radisa, R. Influence of different contents of Si and Cu on the solidification pathways of cast hypoeutecticAl-(5–9)Si-(1–4)Cu (wt.%) alloy. Int. J. Mater. Res. 2013, 104, 865–873. [Google Scholar] [CrossRef]
  40. Mahfoud, M.; Prasada, A.K.; Emadi, D. The role of thermal analysis in detecting impurity levels during aluminum recycling. J. Therm. Anal. Calorim. 2010, 100, 847–851. [Google Scholar] [CrossRef]
  41. Reddy, N.S.; Prasada, A.K.; Chakraborty, M.; Murty, B.S. Prediction of grain size of Al–7Si Alloy by neural network. Mater. Sci. Eng. 2005, 391, 131–140. [Google Scholar] [CrossRef]
  42. Seifeddine, S.; Svensson, I.L. The influence of Fe and Mn content and cooling rate on the microstructure and mechanical properties of A380-die casting alloys. Metall. Sci. Technol. 2009, 27, 11–20. [Google Scholar]
  43. Khalajzadeh, V.; Beckerman, C. Simulation of shrinkage porosity formation during alloy solidification. Metall. Mater. Trans. 2020, 51, 2239–2254. [Google Scholar] [CrossRef] [Green Version]
  44. Rana, R.S.; Purohit, R.; Das, S. Reviews on the influences of alloying elements on the microstructure and mechanical properties of aluminum alloys and aluminum alloy composites. Int. J. Sci. Res. Publ. 2012, 2, 1–7. [Google Scholar]
  45. Caliari, D.; Timelli, G.; Bonollo, F. Fluidity of aluminiun foundry alloys: Development of a testing procedure. Metall. Ital. 2015, 5, 17–24. [Google Scholar]
  46. Timelli, G.; Capuzzi, S.; Fabrizi, A. Precipitation of primary Fe-rich compounds in secondary AlSi9Cu3(Fe) alloys. J. Therm. Anal. Calorim. 2016, 123, 249–262. [Google Scholar] [CrossRef]
  47. Rakhmonov, J.; Timelli, G.; Bonollo, F.; Arnberg, L. Influence of grain refiner addition on the precipitation of Fe-rich phases in secondary AlSi7Cu3Mg alloys. Int. J. Met. 2017, 11, 294–304. [Google Scholar] [CrossRef]
  48. Fabrizi, A.; Timelli, G. The influence of cooling rate and Fe/Cr content on AlSiCu diecasting alloy. Conf. Ser. Mater. Sci. Eng. 2016, 117, 1–6. [Google Scholar]
  49. Fabrizi, A.; Timelli, G.; Ferrano, S.; Bonollo, F. Evolution of Fe-rich compounds in a secondary AlSiCu alloy: Influence of cooling rate. Int. J. Mater. Res. 2015, 106, 719–724. [Google Scholar] [CrossRef]
  50. Timelli, G.; Fabrizi, A.; Vezzu, S.; Mori, A.D. Design of wear resistant diecast AlSi9Cu3(Fe) for high temperature components. Metals 2020, 10, 55. [Google Scholar] [CrossRef] [Green Version]
  51. Girad, E.; Suéry, M.; Adrien, J.; Maire, E.; Corest, M. Hot tearing sensitivity of Al-Mg-Si alloys evaluated by X-ray microtomography after constrained solidification at high cooling rate. In Hot Cracking Phenomena in Welds III; Böllinghaus, T., Lippold, J., Cross, C., Eds.; Springer: Berlin/Heidelberg, Germany, 2011. [Google Scholar] [CrossRef] [Green Version]
  52. Pavlovic-Krstic, J. Impact of Casting Parameters and Chemical Composition on the Solidification Behaviour of Al-Si-Cu Hypoeutectic Alloy. Ph.D. Thesis, Fakultät für Maschinenbau, Universität Magdeburg, Magdeburg, Germany, 2010. [Google Scholar]
  53. Timelli, G.; Fabrizi, A.; Capuzzi, S.; Bonollo, F.; Ferraro, S. The role of Cr additions and Fe-rich compounds on microstructural features and impact toughness of AlSi9Cu3(Fe) diecasting alloys. Mater. Sci. Eng. A 2014, 603, 58–68. [Google Scholar] [CrossRef]
  54. Li, M.; Li, Y.; Zhou, H. Effects of pouring temperature on microstructure and mechanical properties of the A356 aluminum alloy die castings. Mater. Res. 2020, 23, 1–11. [Google Scholar] [CrossRef]
  55. Sanna, A.F.; Fabrizi, S.; Ferraro, G.; Timelli, P.; Bonollo, F. Multiscale characterisation of AlSi9Cu3(Fe) die casting alloys after Cu, Mg, Zn and Sr addition. Metall. Ital. 2013, 4, 13–24. [Google Scholar]
Figure 1. Determination of RPT and FRP at the crossing point of the second and third derivative of the curve dT/dt vs. T.
Applsci 12 00237 g001
Figure 2. Variation of the FRP value in function of the composition of the alloys.
Applsci 12 00237 g002
Figure 3. Comparison of FRP (%) as a function of Si (wt.%).
Applsci 12 00237 g003
Figure 4. Comparison of FRP (%) as a function of Mn wt.%.
Applsci 12 00237 g004
Figure 5. Comparison of FRP (%) as a function of Sr wt.%.
Applsci 12 00237 g005
Figure 6. Microstructures of the alloy 7 and 12.
Applsci 12 00237 g006
Figure 7. Microstructure of alloy 16.
Applsci 12 00237 g007
Figure 8. SEM+EDS analysis of alloy 16.
Applsci 12 00237 g008
Figure 9. Microstructure of alloy 6.
Applsci 12 00237 g009
Figure 10. Microstructure of alloy 10.
Applsci 12 00237 g010
Figure 11. Alloy 6 micrography showing the Al5SiFe and Al3Ni phases and a blocked area.
Applsci 12 00237 g011
Figure 12. Alloy 3 micrography showing the Al3Cr and Alx(Fe,Mn,Cr)ySiz phases.
Applsci 12 00237 g012
Figure 13. Alloy 17 micrography showing the modified Si-eutectic.
Applsci 12 00237 g013
Table 1. Composition of studied alloys (wt.%).
Ref.SiMgFeCuNiCrMnTiZnPbSnSr
19.000.300.380.030.000.010.340.020.010.000.0020.021
28.020.190.290.020.000.010.210.010.000.000.0030.003
38.660.140.30.020.000.010.210.20.290.270.0390.014
410.010.690.340.020.230.150.670.020.010.000.0020.060
59.750.680.340.020.230.150.720.120.350.140.0640.055
68.770.150.850.190.210.160.210.120.160.210.0730.006
78.430.110.910.190.190.140.180.190.180.190.0660.047
89.020.381.050.290.210.070.810.170.060.210.0190.048
99.260.560.730.090.000.070.530.020.210.010.0020.007
1011.650.580.340.200.200.020.30.240.030.070.0320.021
1110.540.520.340.160.150.020.310.170.230.260.0260.053
1211.490.400.910.420.000.140.670.230.150.180.0400.046
1311.60.460.830.180.000.180.740.020.190.230.0030.007
1411.640.530.960.080.080.160.080.270.130.080.0330.010
1511.820.520.960.110.110.140.110.110.180.110.0460.023
1611.410.350.950.270.300.090.690.250.090.250.0260.038
1712.070.280.830.130.170.030.490.080.020.160.0550.033
1810.210.280.430.050.000.070.330.020.080.000.0020.013
1910.370.280.500.110.000.140.440.020.010.000.0020.009
2010.640.630.410.050.000.070.330.020.100.000.0010.013
2110.310.290.540.090.000.110.350.010.010.000.0020.006
2210.80.520.480.050.000.060.340.030.100.000.0020.014
2310.90.430.510.100.000.110.470.010.020.000.0050.006
2411.710.440.570.070.000.080.440.020.040.000.0020.013
2510.730.360.600.100.000.090.380.020.100.000.0020.009
Table 2. Statistical Student “t” coefficients for FRP.
SiMgFeCuNiCrMnTiZnPbSnSr
2.950.191.030.770.120.103.190.410.70.20.812.52
Publisher’s Note: MDPI stays neutral with regard to jurisdictional claims in published maps and institutional affiliations.