Article

Long Term Effects of Reduced Track Tamping Works

1
Institute of Railway Engineering and Transport Economy, Graz University of Technology, 8010 Graz, Austria
2
ÖBB-Infrastruktur AG, 1020 Vienna, Austria
3
Plasser & Theurer Austria, 1010 Vienna, Austria
*
Author to whom correspondence should be addressed.
Appl. Sci. 2022, 12(1), 368; https://doi.org/10.3390/app12010368
Submission received: 29 November 2021 / Revised: 16 December 2021 / Accepted: 20 December 2021 / Published: 31 December 2021

Abstract

:

Featured Application

Maintenance planning, especially the planning of railway track tamping, is mostly limit value driven and thus concentrates on repairing failures rather than keeping the track at a sustainable quality level. The procedure published in this paper can be easily applied by railway infrastructure managers in order to ensure a high-quality infrastructure and to guarantee sufficient budgets.

Abstract

Tamping needs to guarantee safety in limiting geometric failures in isolated points, reduce dynamic forces by a smooth through-going longitudinal level, and provide a certain riding comfort for passengers. Although different methods are applied to describe geometry deterioration, the amount of tamping needed is seldomly addressed. In this work, we evaluated and compared different tamping regimes and their long-term consequences by extrapolating the longitudinal level of track. Forecasting beyond one tamping action needs a precise positioning of measurement data and a solid methodology. We found that tracks can be operated by repairing isolated defects for more than ten years without running into technical and operational trouble, and even reducing budgets in this period. However, the long-term perspective financially shows the contrary: continuous through-going maintenance keeps track quality at a high level and provides the basis for a long service life.

1. Introduction

Tamping is the most important and most costly maintenance action in ballasted railway track. Since maintenance budgets are seldomly sufficient, tamping, despite its dominating share, has to be minimized. This often starts with reduced tamping length, accompanied by shorter track closures, an effect that is also welcomed by the operation departments in order to keep availability of track high and thus supporting the punctuality goals of the infrastructure managers. At its highest degree, the reduction of tamping leads to an almost total abandoning of line-tamping by establishing a spot tamping only regime. Single failures in track geometry are safety relevant, thus subject to normative limit values (see EN13848-3) and consequently need to be tamped in any case. This strategy change leads to relevant short term savings in the maintenance budgets but also to a reduction of through-going track quality. This induces a loss in service life in the long term, a fact to be shown in this paper based on measuring data. As service life triggers renewal, the budgets for necessary reinvestment increase in the long term perspective. Depreciation is the dominating cost position in the life cycle cost of track. It turns out that the short term savings are by far lower than the long term costs. This is common knowledge but as there is no data-based evidence, strategies frequently change between a short-term savings goal and a sustainability focused one. This paper provides a data-based model depicting the effects of different tamping regimes and their cost effects in order to identify the best strategy to be followed.
Spot tamping in the evaluation which follows means correction in single failures of track geometry, more precisely in longitudinal level (LL). This reactive maintenance is driven by (immediate) action limits. The European Standard EN13848-3 provides three different, speed dependent limit values: the alert limit (AL), the intervention limit (IL), and the immediate intervention limit (IAL). Reaching the IAL necessitates an immediate measure ensuring safe train operation. As maintenance cannot be executed immediately after measuring the car run, infrastructure managers have only one option: setting a speed restriction (lower speed comes with a lower IAL) until the point in time of maintenance action. Reactive maintenance can be subject to a certain optimization in focusing on the AL and IL, though increasing maintenance demand. Another possibility is to predict the time-to-IAL. This needs a precisely positioned longitudinal level as the confidence interval of prediction again triggers the maintenance amount. Line-tamping ensures through-going quality assessed by (mainly) standard deviation (SD) of LL [1,2]. As investigations show [3], this parameter is very well suited to fulfil this task. EN13848-3 defines an IAL only at a very high level of 5 mm, where AL and IL do not exist. Line tamping needs to ensure both low dynamic forces applied to track and a certain riding comfort for passenger trains. Intervention levels are thus defined by infrastructure managers according to their boundary conditions, if they are defined at all. Assessing both single failures and through-going track quality is unfortunately not possible in using more holistic indices describing track quality [4,5,6], so these assessment needs to be separated.
Assessing track geometry, its behavior over time and the recovery of track quality after track tamping requires intensive data analysis. Firstly, especially when looking at the raw signal “longitudinal level”, measuring signals of different car runs need to be precisely positioned. A precise and efficient approach is one subject to the CoMPAcT-algorithm developed by Fellinger [7]. The deterioration of geometrical quality over time was analyzed by several authors and many different models have been published over the years [8,9]. Neuhold summarized and extended the knowledge based on data of more than 4000 track kilometers over 10 years in his paper on data preparation for maintenance planning [3]. In his book [10], Neuhold came up with a solution integrating the threshold value for the tamping action in the description of track quality. In previous studies, this recovery process of track quality after tamping was only considered in a very simplified way [11,12,13,14,15,16]. In most cases, the recovery rate and thus the track quality after a tamping action is modelled using recovery factors. These factors depend on the quality at the time of intervention and thus the intervention level, but do not consider track behavior before the tamping. Neuhold shows that absolute track quality, deterioration, and intervention level trigger the achievable quality, once again absolute value and deterioration, after tamping.
Of course, track loading is a main trigger of track deterioration [17,18,19]. Descriptive modelling does not support the prediction of changes if traffic loading changes. Using the first term of the Swiss Wear Factor, it is possible to extrapolate track tamping needs to different loading scenarios [20]. For the given analysis, loading is constant and thus not to be handled separately.
Final planning of tamping action is the day-to-day work of infrastructure mangers and is not often subject to scientific investigations. Delivering tamping schedules based on the knowledge gathered of track geometry degradation seems to be too far away from track work reality. Some authors, mainly in close cooperation with infrastructure managers, have published approaches to estimate tamping needs due to overridden limits, but the tamping schedules neither consider realistic section lengths, nor machinery use, track closures, or other influencing parameters [21,22,23]. The 4tamping-algorithm [10] at least covers the technical aspects and the long term effects.

2. Methodology

2.1. Pre-Work and Applied Algorithms

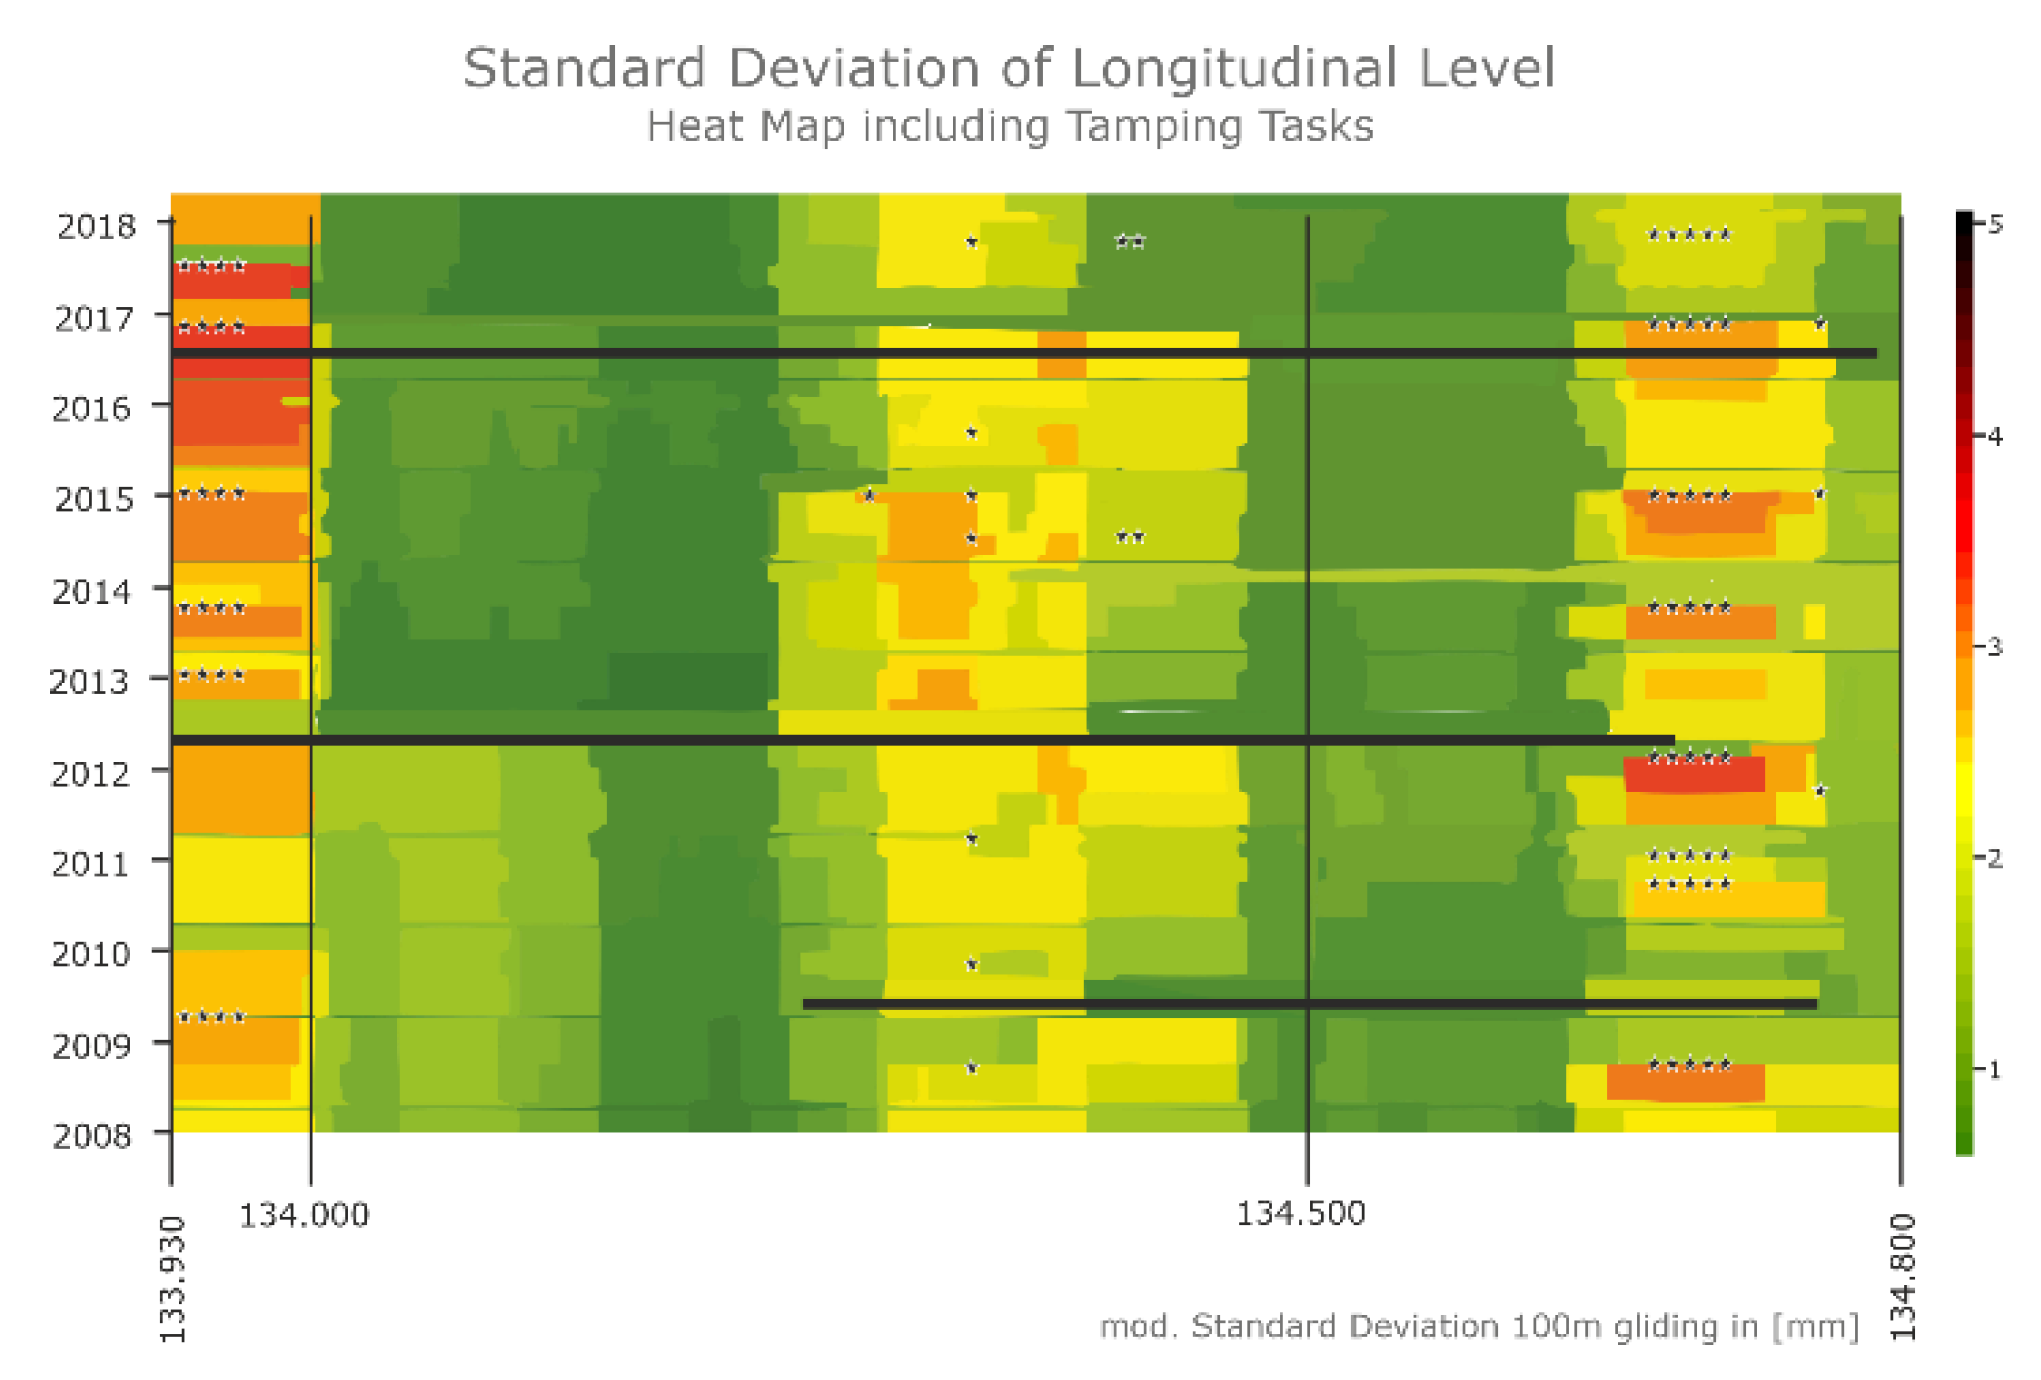
2.1.1. Precision-Positioning of Longitudinal Level Measurement Signal

Even though measuring data nowadays are well positioned, with a mean positioning deviation established by looking at two consecutive measurement runs between 0.5 m and 10 m, a solid predication is rarely possible with these data. The CoMPAcT-algorithm, originally set up for assessing the condition of S&Cs [7] also provides a precision-positioning at longitudinal level in open track and thus forms a precondition for the current evaluation.
The necessary property of two measurement signals to be able to generate functional knowledge through time series analyses is synchronicity. If this feature is defined as the minimum of the Euclidean distance between two measurement points d_(P_1|P_2) Equation (1), an automated signal positioning process can be realized based on this criterion.
d P 1 | P 2 = ( x 2 x 1 ) 2 + ( y 2 y 1 ) 2
This value can also be regarded as a correlation parameter between the considered measurement signals. Currently used measurement data positioning methods focus on extreme values and on a peak-to-peak shift without taking into account the local variability of the extreme values that may occur. The methodology behind CoMPAcT allows the measurement signal characteristics to be considered and enables the synchronization of two measurement signals to be ensured by means of reproducible mathematical operations. For this purpose, the Euclidean distance is calculated as a first step within the comparison of two measurement signals (Figure 1a). Subsequently, one measurement signal is locally fixed and the second is shifted by one measurement point. Based on this, the Euclidean distance is calculated again. If the calculated parameters are now plotted over the respective measurement signal shifts, a distance function (Figure 1b) can be generated. As a result of an extreme value search within this function, its x-value can be used to decide whether the two measurement signals are synchronous or not and, in the latter case, the necessary displacement to ensure synchronicity can be derived. The final point of the developed positioning logic is symbolized by the application of the calculated displacement to one of the measurement signals. The result obtained in this way is shown in Figure 1c for an example of two longitudinal level measurement signals.

2.1.2. Defining the Interaction between Track Quality and Tamping Measures

Track tamping, more precisely levelling, lining, lifting, and tamping, improves the geometrical position of the track grid (rails and sleepers). However, the improvement and the sustainability of the established track geometry depends on some preconditions. For through-going tamping actions, we look at the standard deviation of the longitudinal level (SDLL or σLL). We learn that there is a trade-off between intervention level and reachable quality level after tamping. Track quality behavior between two tamping tasks can be described by the initial quality (Qn = SDLL) the deterioration rate (b), and the end quality after tamping is executed (Qult). Generally, the absolute level of SDLL (Qn) after tamping is lower than the starting quality in the deterioration period earlier (Qn-1). This is not due to poor working quality, as the track geometry delivered by the tamping machine is very precise. Qn includes the initial settlements directly after tamping and due to train operation. It is an artificial quality that is not calculated from a measurement signal, but the result of the calculated regression function at the point in time of tamping. The deterioration rate (bn), the loss of quality over time, generally increases compared to bn-1. Evaluations of thousands of track sections show that the stricter the intervention level (the higher the quality at the time of intervention), the higher the quality level after tamping. In more detail, the interaction of tamping and track geometry level depends on existing track quality (Qn and bn), the intervention level (Qult), and, of course, on the working quality. The 4tamping-algorithm [8] aims at a long-term optimization of line tamping actions, taking into account those parameters and seeking for the optimal intervention level for the given track quality. This algorithm is applied when evaluating the long-term effects of different tamping strategies within this study.
However, beside the prediction of the next tamping task, it is important to know about the track quality behavior after the upcoming tamping work in order to develop tamping strategies for future periods. In general, track quality improves significantly after tamping and a new initial quality (Qn2) is achieved. The deterioration process starts again described by the new degradation rate (b2). If we know these two parameters, we can also describe track quality behavior after tamping and the next intervention. Hence, it is possible to calculate the point in time when quality improvement should be executed to reach the highest effectiveness. Forecasting the next intervention underlies the same procedure. Figure 2 summarizes the notation and processes.
Within a comprehensive network-wide investigation [10], special attention is paid to the evolution of the track quality parameters after tamping. Results show that b2 and Qn2 are mainly triggered by the intervention level Qult1 and b1. Qn1, cumulated tonnage, and type of superstructure (sleepers) are also influences. Sophisticated analyses enable the clustering of results and determination of the relevant track quality parameters after tamping as functions of the influencing parameters.
Using this knowledge, we can derive the optimal intervention level for any specific situation in the network and the sustainable tamping strategy for specific boundary conditions. We underline that track quality itself is not the criterion for optimization but much more a fundamental input parameter. The 4tamping-algorithm [10] aims for a long-term optimization of line tamping actions considering the entire service life of track. The optimized intervention levels deliver the longest possible time (service life) with ten tamping actions. This approach is the second tool used for the given assessment.

2.2. Track Quality Assessment for Different Scenarios

In order to assess different tamping strategies, we chose a discrete track section consisting of open track, loaded with mixed traffic and some 20 mio. gross-tons per year with freight trains, regional trains, and intercity trains. The maximum line speed is 140 km/h. Superstructure consists mainly of concrete sleepers and 60E1 rails on medium quality ballast (granite-like, metamorphic material). Track geometry shows some single failures of longitudinal level resulting from soft, wed sections, and most likely varying stiffness. These failures have been tamped frequently (black stars in Figure 3), while more or less the entire track section has been tamped through-going three times within the time window evaluated (2009, 2012, and 2016).

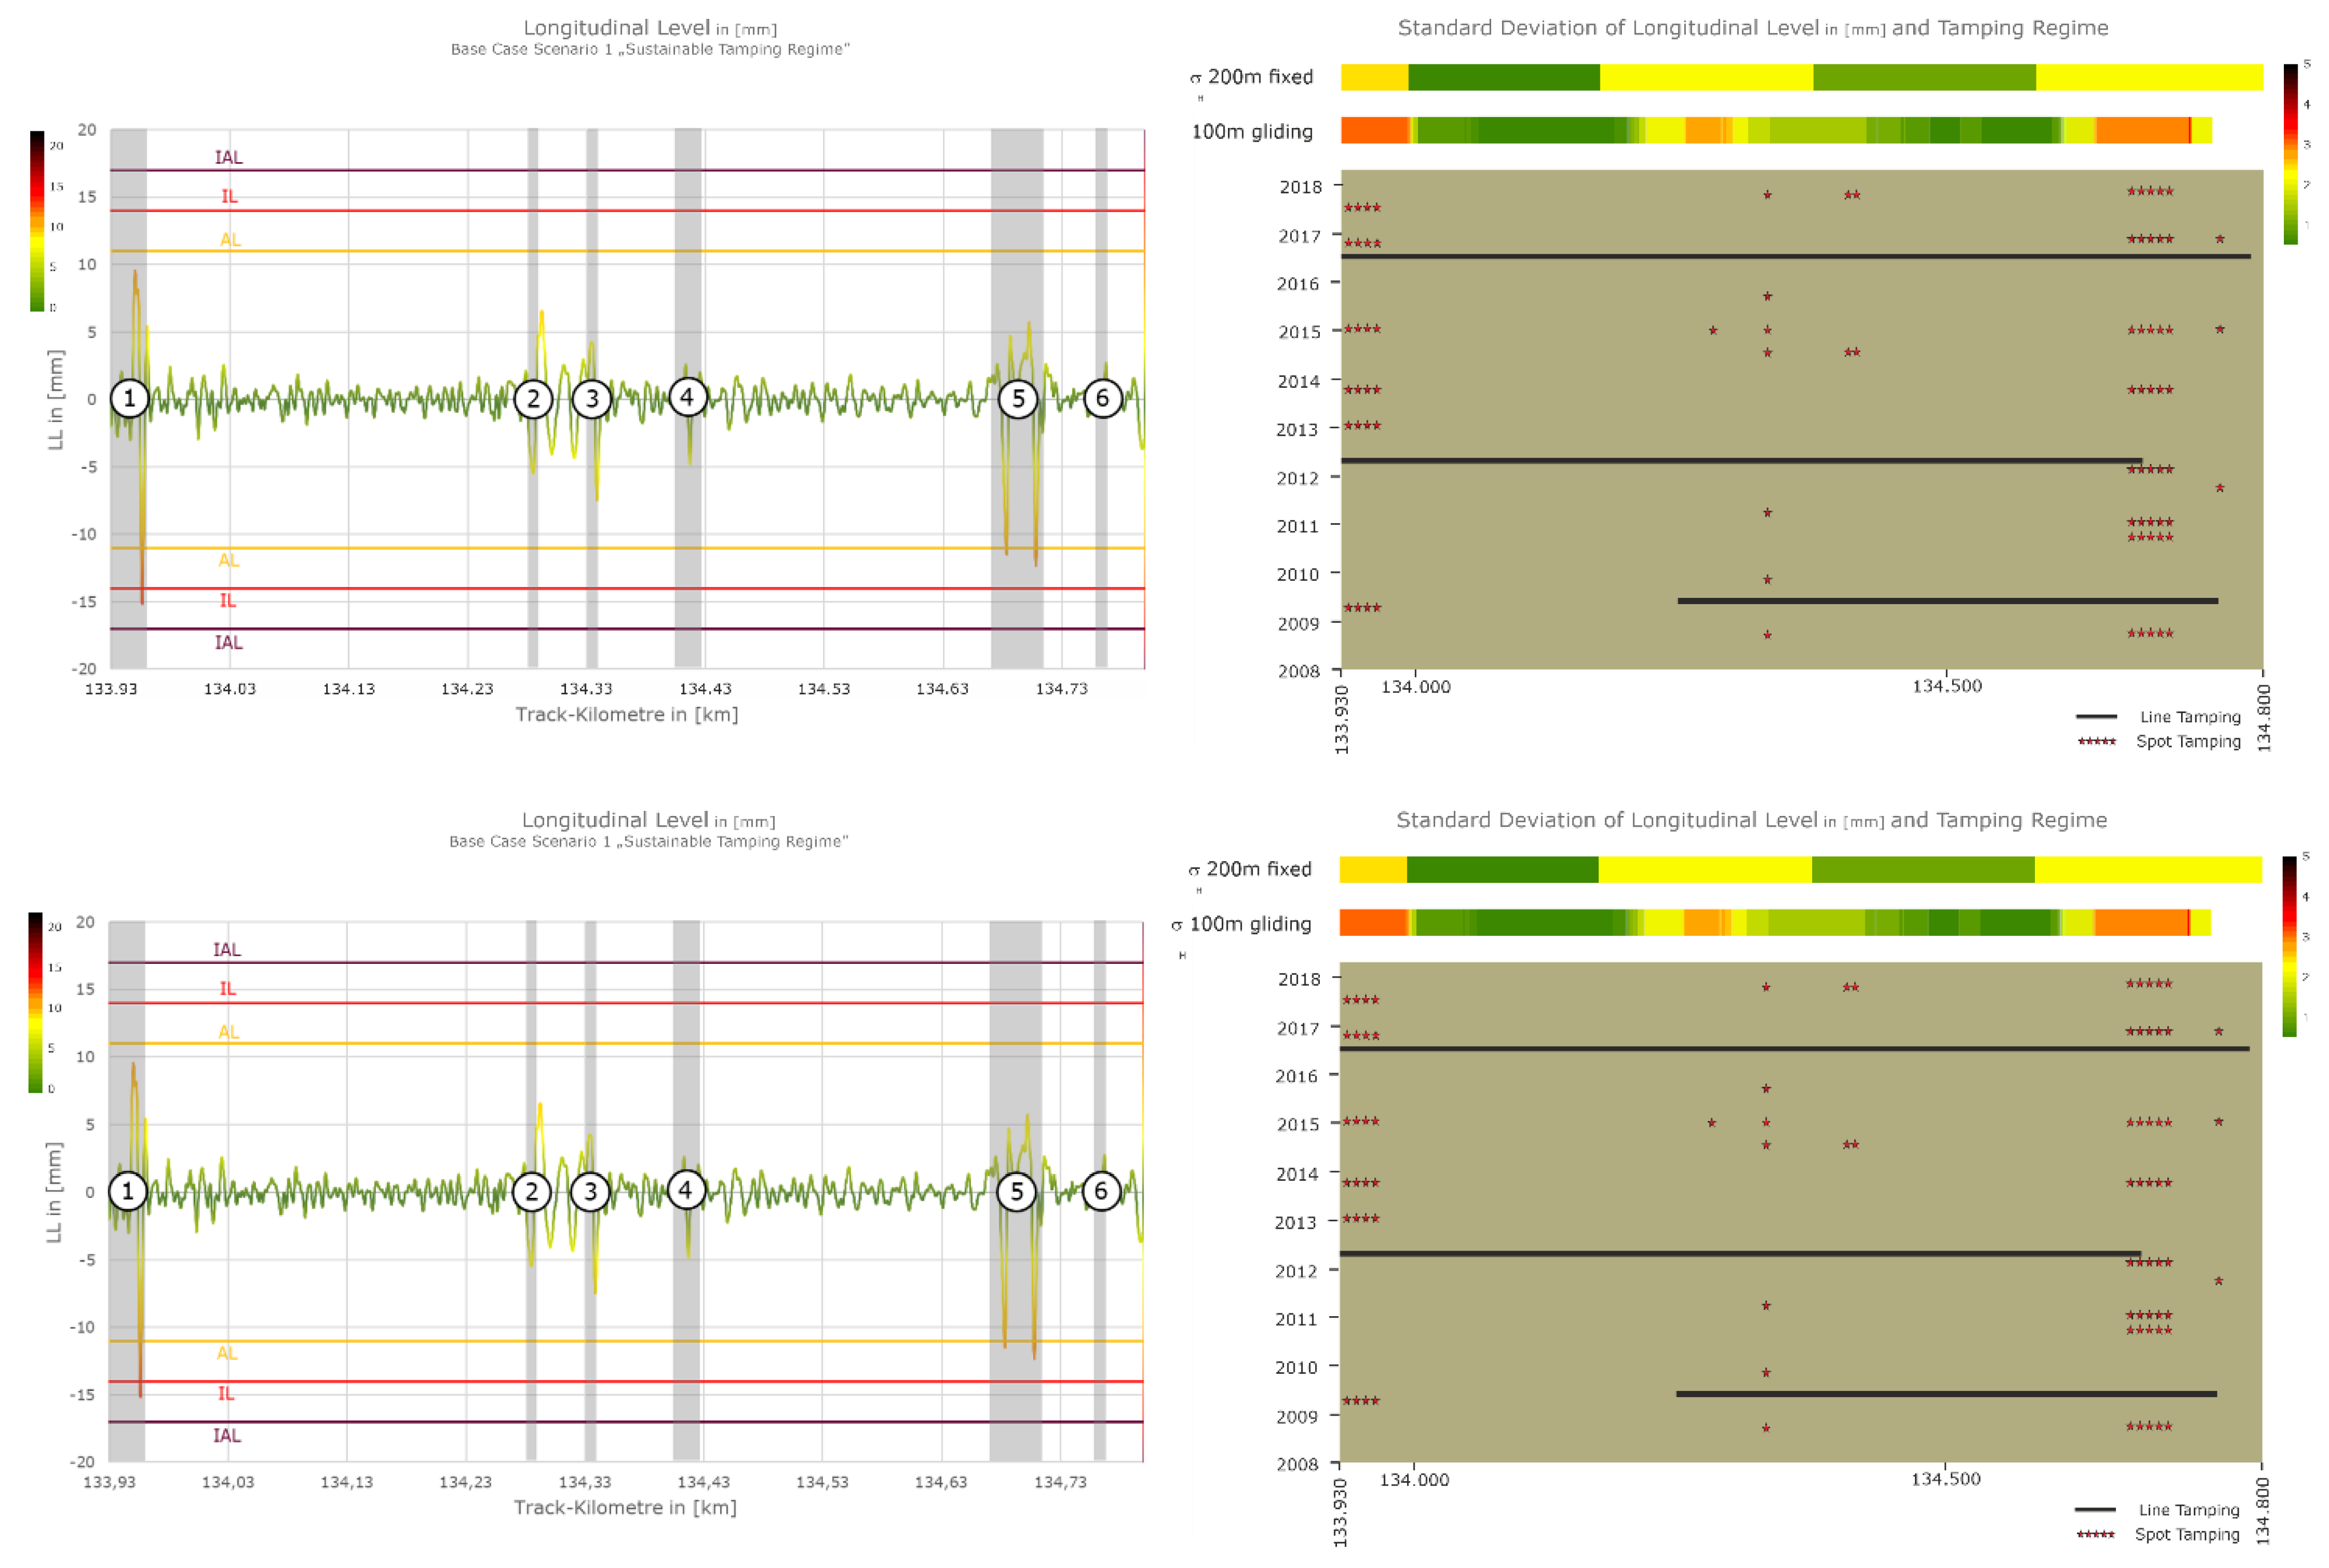
2.2.1. Base Case Scenario (Scenario 1)

The tamping regime applied in reality forms the base-case scenario and is not changed within the evaluation. Analyzing the long-term effects, we use standard deviation and deterioration rates in 2018 as base-line for the tamping prediction with the 4tamping-algorithm.
Figure 4 gives a more holistic view of the section at the point in time of the last measuring run. The track is in good condition with an average SDLL of 1.38 mm (SDLL, 100 m of the last measuring at the end of the first quarter of 2018, addressed as Q12018 subsequently; SDLL, 200 m, fixed base provided additionally). It took three line-tamping actions with a total length of 2120 m and 27 spot tamping interventions with a total length of 705 m to keep the track at this level. Longitudinal level shows isolated track irregularities at six points, some of them shorter, some of them a little longer. Points 1, 3, and 5 needed more frequent spot tamping.

2.2.2. Scenario “Spot Tamping Only” (Scenario 2)

This second scenario limits the tamping actions only to the isolated defects that need to be maintained due to the intervention limit. Thus, the scenario operates with a part of the actions executed in reality only. For the purpose of comparison, it is necessary to extrapolate the longitudinal level from the point of the first measuring run of the data set to the end of the forecast horizon in 2018.
While regression-based forecasts of SDLL are subject to many research activities, well published in many scientific papers, and also partly in use by different infrastructure managers, the extrapolation of the raw signal of the longitudinal level is not common. The reason for this is the positioning of sequential measuring signals. A standard deviation over 100 or 200 m does not require a high positioning quality, as averaging delivers robust values. These values increase over time as long as a section is not tamped (or renewed). Analysis of the necessity of spot tamping needs to compare the longitudinal level with the intervention level. Modelling scenario 2 requires this approach consequently.
For this task, we use the CoMPAcT algorithm for precise re-positioning of the raw signal of longitudinal level as a first step. This algorithm guarantees a position quality of plus/minus one data-break (25 cm). Based on this process, the longitudinal level of each cross-section was extrapolated using a linear regression to the values of 2008–2012 (for the first part of the section from km 133.930 to 134.265, respectively, the values for 2008 and 2009 for the second part of the section from 134.265 to 134.800, from the first measuring to the first line-tamping executed in reality). The linear regression is proven to be a proper approach to describe track quality loss for SDLL as long as the described time-frame between two tamping actions is technically reasonable. For through-going track quality, an over-linear behavior also occurs in case of low Qn and thus long tamping cycles. Looking at single failures, we face sections with generally high deterioration rates and subsequent poor track quality. The linear regression might therefore under-estimate the loss of quality over time. However, keeping complexity low, we still use the linear approach. Results interpretation and discussion treat possible effects of this simplification. The section-wise forecasted LL values are re-combined to a through-going longitudinal level at the forecast horizon in Q12018 (Figure 5).
The existing single failures (with spot tamping actions) are used according to their original behaviour and thus their real longitudinal level. Through-going line tamping actions are replaced by spot tamping actions at these special points.

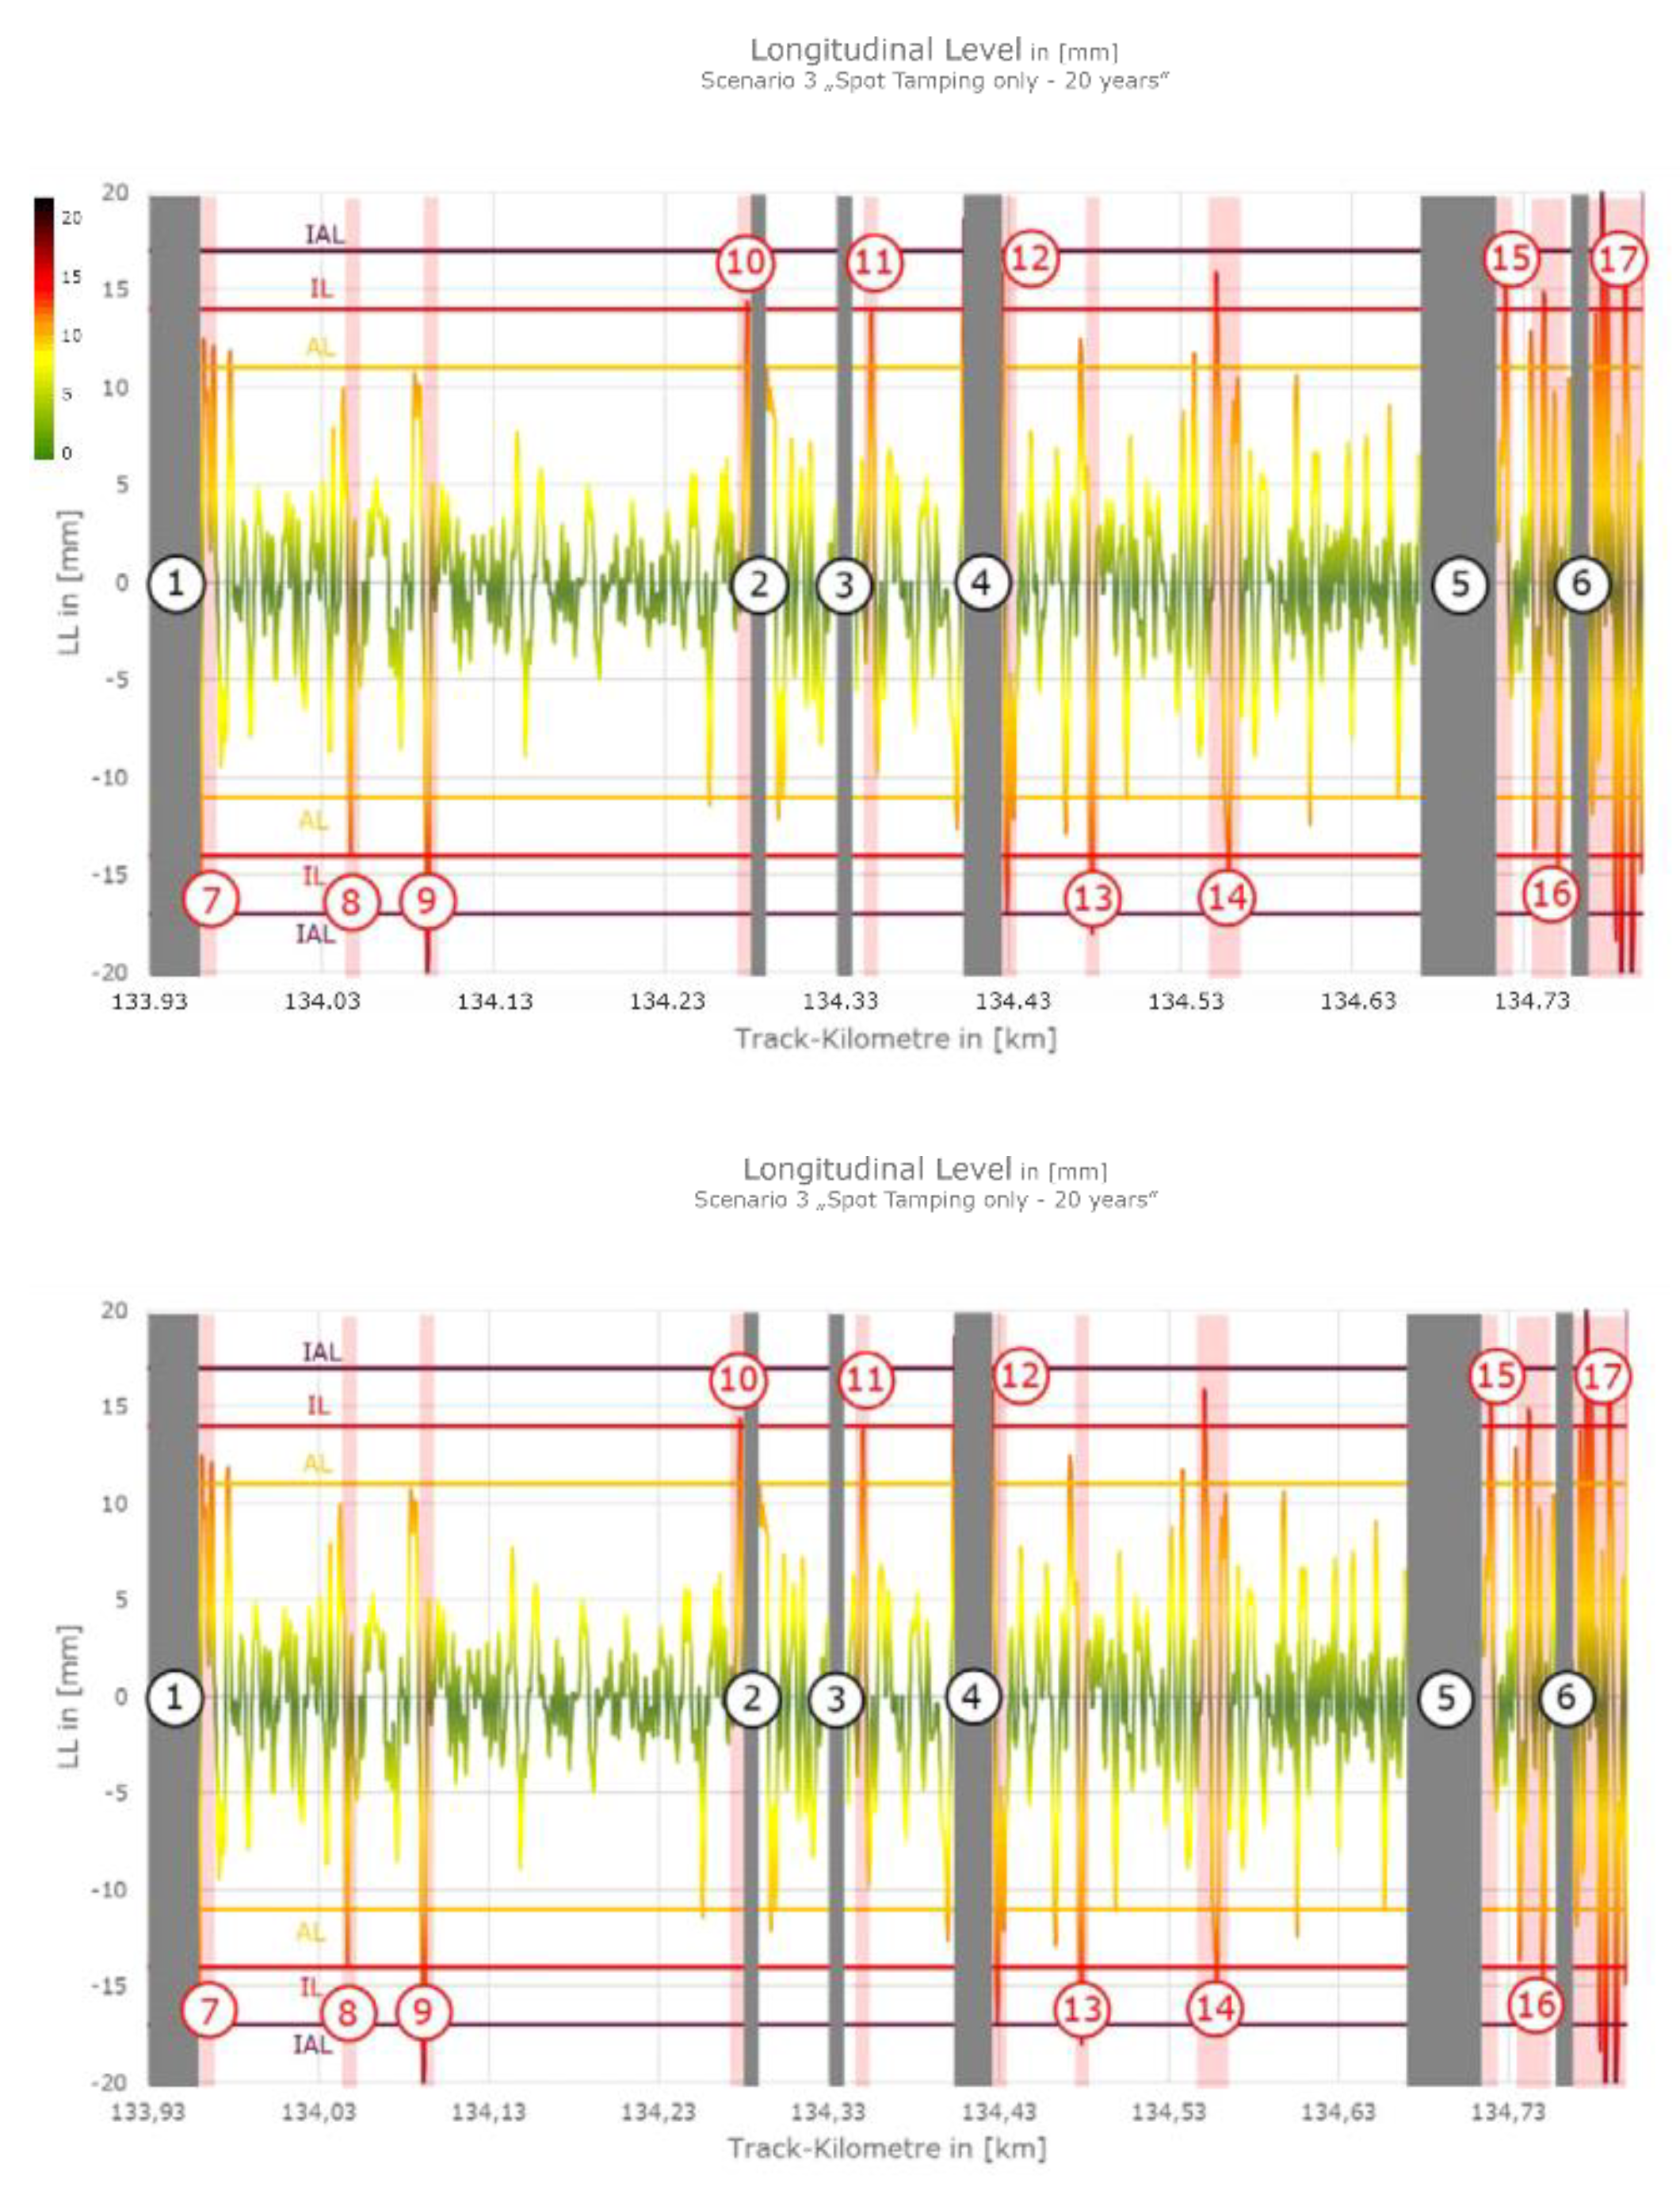
2.2.3. Scenario “Spot Tamping Only–20 Years” (Scenario 2a)

For the third scenario, we forecast track quality based on the regression for another ten years (2028). The existing single failures remain as they are. The aim of this analysis is only to predict the longitudinal level of the surrounding sections. Figure 6 shows the increased roughness of the longitudinal level and the additional points of exceeded limits.

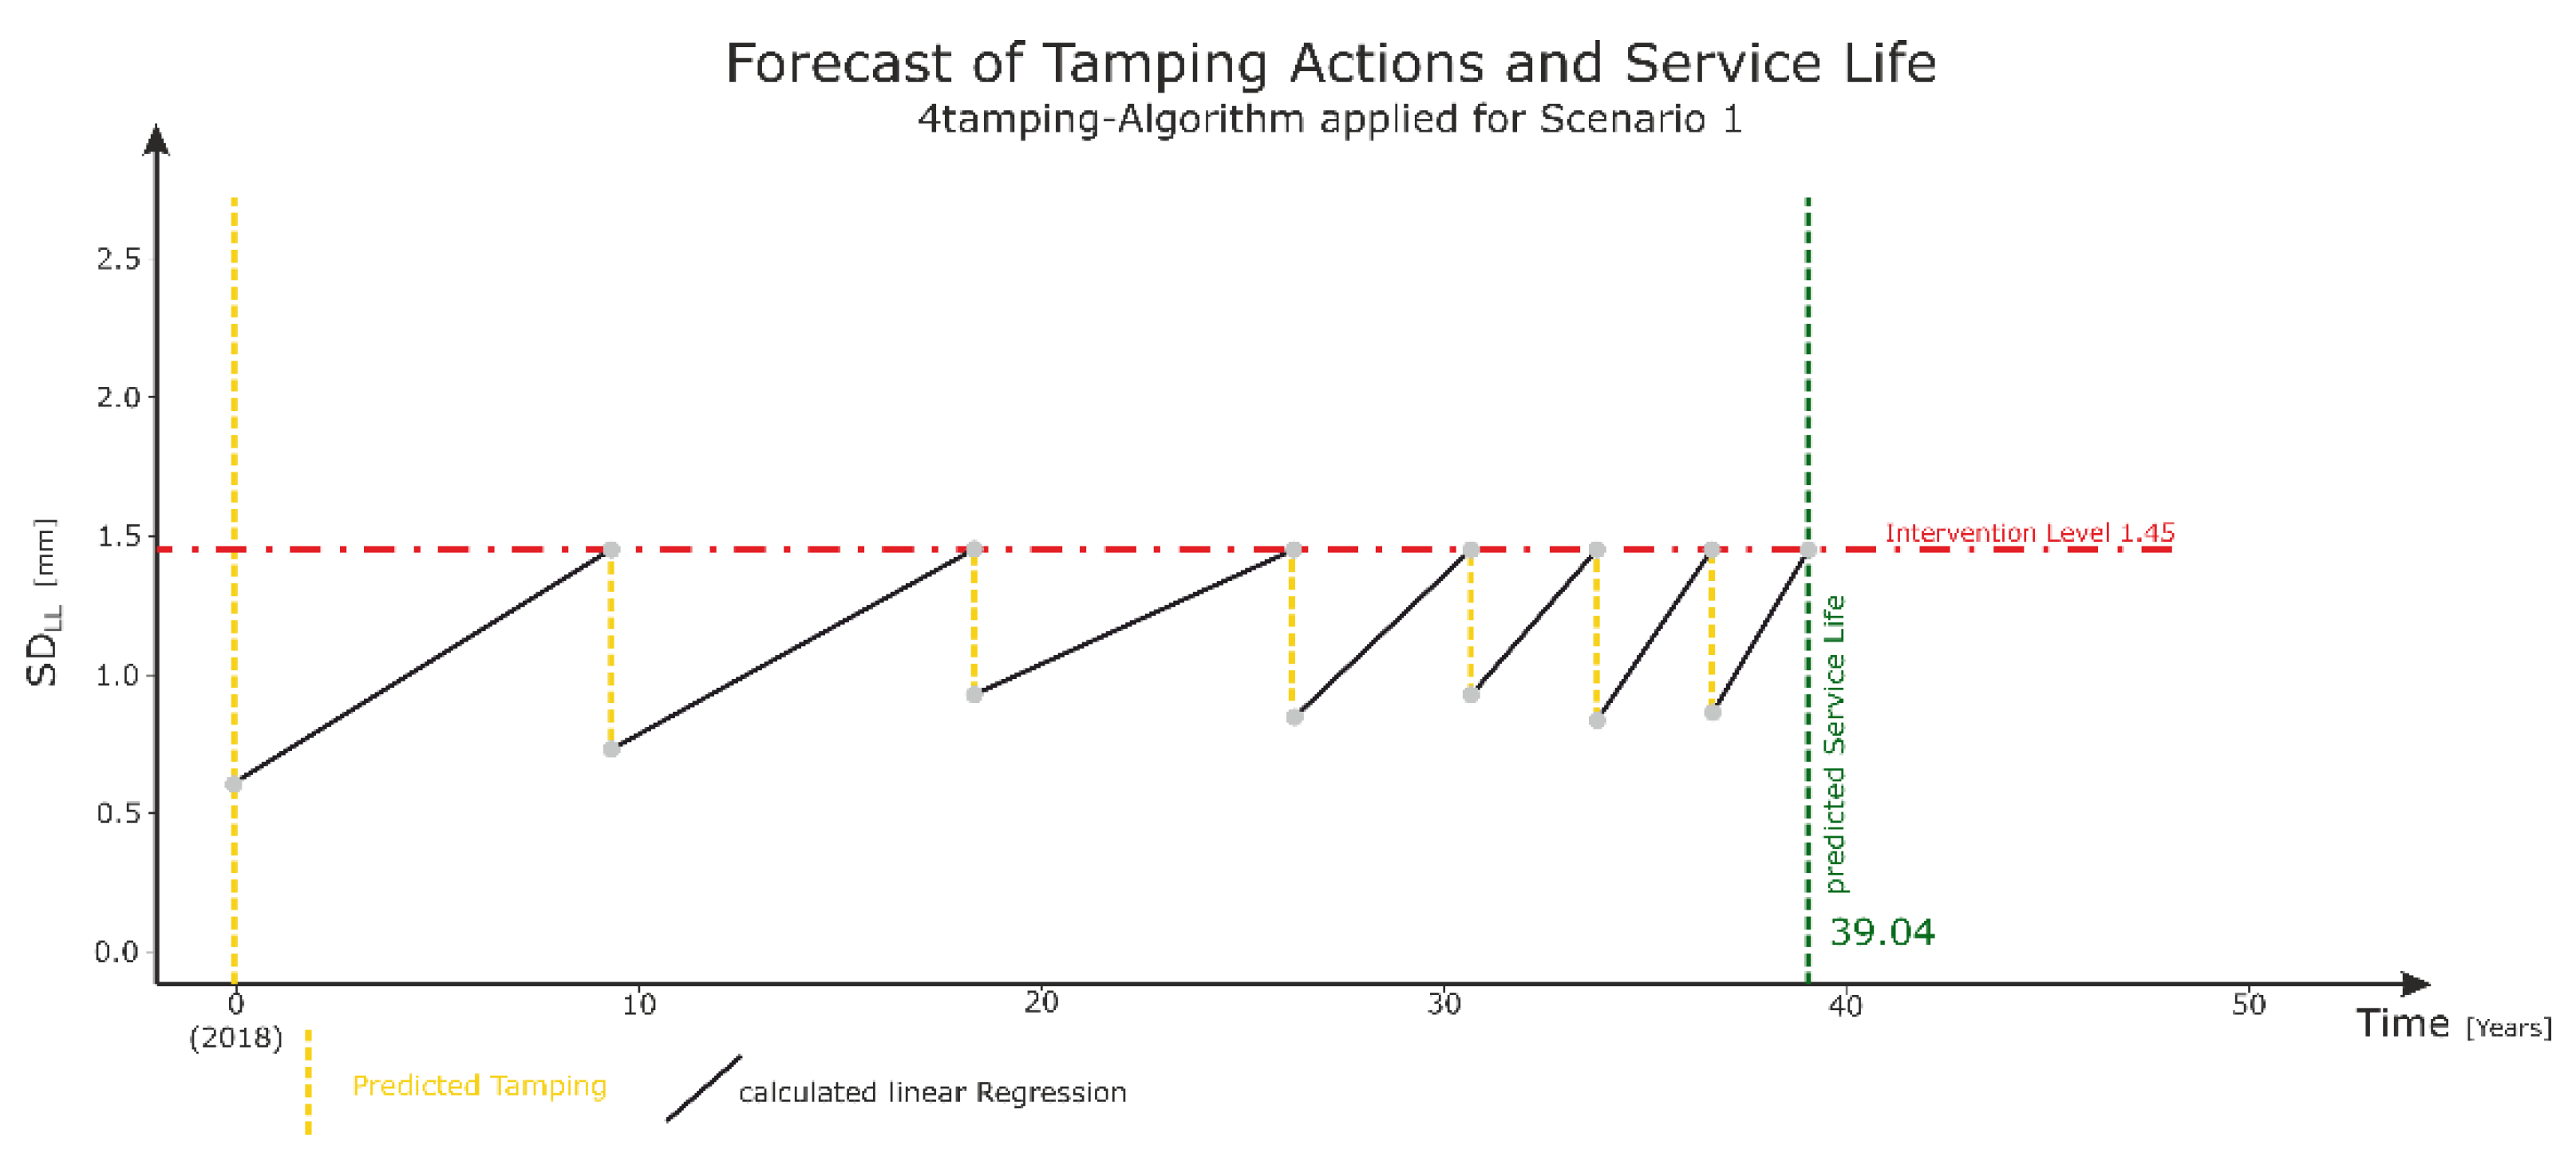
2.3. Prediction of Tamping Demands and Service Lives

This paper wants to show long-term effects of different maintenance approaches. An analysis of ten years only does not provide holistic answers as track service life reaches 30 years and more. The consecutive step of the evaluation is thus a prediction of tamping actions beyond 2018, and thus after the ten year period analyzed for two different tamping strategies.
Here, we use the 4tamping-algorithm, starting with the track quality in Q12018. Hence, we assume that the track section is treated in the optimal way from 2018 onwards. This means through-going line tamping for both scenarios. According to the 4tamping-algorithm, the tamping action is always set at the optimal point in time achieving the best quality behaviour for the entire service life. The algorithm cuts the service life of track after ten (through-going) tamping interventions. For this analysis, scenario 1 starts with three already executed tamping actions and the accordingly good track quality, while scenario 2 starts with a low track quality, but still ten tamping actions are possible. Both scenarios start with a through-going tamping action in 2018. Scenario 2a is not evaluated, as a track of this quality and with this amount of singles failures cannot be maintained to a sufficient level anymore. Technically, track can be tamped to any (high) quality in repeating tamping actions, but an economically dense tamping frequency and short achievable service life lead to a poor value-for-money ratio, so track relaying is the option with the higher economic efficiency.
Figure 7 and Figure 8 show the optimized tamping regime according to the 4tamping-algorithm. As track quality is higher in the case of scenario 1, the algorithm identifies a stricter intervention limit in order to keep quality high, while for scenario 2 the threshold value is lower. Quality levels and deterioration rates after tamping are statistical values. The 4tamping-algorithm works with a database covering achievable quality levels and deterioration rates after tamping (mean values) depending on quality level and deterioration rate before tamping and the intervention level. Looking at Figure 3, we see an increase in track quality for the first two tamping actions, for example, while in most cases track quality after tamping is poorer than in the cycle before. Also considering the deterioration rate, it turns out that less absolute improvement and low(er) deterioration rate can be more favorable than high absolute improvement accompanied by a high loss of quality.

3. Results and Discussion

The evaluation of the different scenarios is executed with an economic comparison. All options provide a safe track as limits are always met so that a purely technical comparison can be done looking at the different quality levels, the quantity of maintenance actions and similar topics, but does not answer the question as to which of the maintenance regimes should be followed. The economic assessment based on total life cycle costs delivers an integral view of maintenance, service life and the involved costs. In this way, the long-term effects cannot only be depicted, but also monetarized. Doing so provides a sound basis for decision making in track asset management.
We compare the scenarios at the point in time Q12018, technically as a first step in order to discuss the short-term effects of reduced track tamping: replacing the through-going tamping actions with spot tamping works as the single failure does not lead to additional single failures within a 10 year time period. Track maintenance costs decrease accordingly, but track quality also drops to a very poor level (SDLL 3.08 mm) compared to scenario 1 (SDLL 1.38 mm). Technical limitations due to track quality (speed restrictions or similar) do not occur, and the short term savings are equal to 2120 m of tamping minus the additional spot tamping length of roughly 240 m. Assuming some 20€ per metre for the line tamping and five times higher metre costs for the single failure tamping, ballast maintenance delivers short-term savings of 16.3% or 18,400€ in the 10 years analyzed.
Scenario 2a shows that the “spot tamping only” strategy does not work in the long run: the growing number of single failures lead to both increasing costs in maintenance and massively reduced track availability, as track closures for the frequent maintenance interventions need to be provided. Additionally, through-going track quality runs beyond the safety limits. A standard deviation of more than 5 mm does not allow for safe train operation anymore, implying that the scenario 2a result in 2028 needs a line tamping action anyhow. This analysis also indicates that the short-term savings can only be achieved for a limited period of time.
We show the long-term effects in applying the 4tamping-algorithm. In both scenarios, the line tamping in 2018 provides a sound quality level, a SDLL of 0.61 mm in case of scenario 1 and of 0.825 mm for scenario 2. Looking at Figure 7 and Figure 8, we can easily see that track quality deteriorated much faster in scenario 2, leading to shorter tamping intervals even though the intervention level is lower. Service life reaches 43 years (33.42 years forecasted by 4tamping plus 10 years from 2008 to 2018) for scenario 2 and 49 years for scenario 1. Comparing ballast maintenance, ten line tamping actions are executed in both cases, so that the additional spot tamping of some 240 m between 2008 and 2018 in scenario 2 is the only difference. Scenario 1 ends up with 8210 m of line tamping equal to 164,200€ for 49 years, scenario 2 needs 8700 m line tamping and the 240 m of spot tamping summing up to 198,000€ for 43 years. Note: the costs of spot tamping that occur in both scenarios are not considered as they disappear in the comparison. Per year, the maintenance costs therefore amount to 3351€ (scenario 1) and 4605€ (scenario 2). It turns out that the short-term savings of 16.3% in the 10 year period turn into additional maintenance costs in the long run of 37.4% (average annual maintenance costs). The maintenance cost delta of 1254€ per year for 43 years totals 53,906€. Compared to the short-term savings (18,400€) this means that every “saved” Euro in the short term is paid back with three Euros in the long term.
Still, this is not the entire economic truth. As track service life is significantly shorter in scenario 2, additional extra costs occur: calculated depreciation (track re-investment costs divided by the service life) also increases for scenario 2 by 14%. Taking some 1000€ per metre of track as renewal costs, this effect monetarizes to 2477€/year and thus affects the economic situation much more strongly (Figure 9).

4. Conclusions

Summarizing the results of this investigation, we can state that reducing track tamping to only removing overridden limits can be executed easily without operational restrictions for some ten years. On the other hand, the lost track quality can only be restored partly when returning to a sustainable track maintenance regime. Again, it turns out that a high quality approach is economically more sustainable than operating track close to safety limits. Maintenance frequency and service life are tightly linked. Not executed (but necessary) maintenance leads to a reduced service life. For strategic track asset management on a netwide level means that reducing maintenance is highly inefficient. “Savings” in maintenance (too low maintenance budgets) shorten service lives and therefore increase renewal demands. If renewal budgets are not available to balance the additional reinvestments, track overages and the rising backlog asks for more and more costly maintenance that cannot be financed by small maintenance budgets. This vicious cycle should never be started, as the way back is very costly and time consuming and goes along with reduced track availability and reduced train punctuality.

Author Contributions

Conceptualization, S.M., M.F. and J.N.; methodology, S.M., M.F. and J.N.; software, M.F. and J.N.; validation, M.F., J.N., G.N. and F.H.; formal analysis, M.F. and J.N.; investigation, S.M., M.F. and J.N.; resources, S.M., G.N. and F.H.; data curation, M.F. and J.N.; writing—original draft preparation, S.M.; writing—review and editing, S.M., M.F., J.N., G.N. and F.H.; visualization, S.M.; supervision, G.N. and F.H.; project administration, S.M.; funding acquisition, S.M. and F.H. All authors have read and agreed to the published version of the manuscript.

Funding

Open Access Funding by the Graz University of Technology.

Acknowledgments

This project has received funding from the European Union’s Horizon 2020 Programme Research and Innovation action under grant agreement No. 826255.

Conflicts of Interest

The authors declare no conflict of interest.

References

  1. Wen, M.; Li, R.; Salling, K.B. Optimization of preventive condition-based tamping for railway tracks. Eur. J. Oper. Res. 2016, 252, 455–465. [Google Scholar] [CrossRef] [Green Version]
  2. Audley, M.; Andrews, J.D. The effects of tamping on railway track geometry degradation. Proc. Inst. Mech. Eng. Part F J. Rail Rapid Transit 2013, 227, 376–391. [Google Scholar] [CrossRef]
  3. Neuhold, J.; Vidovic, I.; Marschnig, S. Preparing Track Geometry Data for Automated Maintenance Planning. J. Transp. Eng. Part A Syst. 2020, 146, 04020032. [Google Scholar] [CrossRef]
  4. Offenbacher, S.; Neuhold, J.; Veit, P.; Landgraf, M. Analyzing Major Track Quality Indices and Introducing a Universally Applicable TQI. Appl. Sci. 2020, 10, 8490. [Google Scholar] [CrossRef]
  5. Sadeghi, J. Development of railway track geometry indexes based on statistical distribution of geometry data. J. Transp. Eng. 2010, 136, 693–700. [Google Scholar] [CrossRef]
  6. Liu, R.K.; Xu, P.; Sun, Z.Z.; Zou, C.; Sun, Q.X. Establishment of track quality index standard recommendations for beijing metro. Discret. Dyn. Nat. Soc. 2015, 2015, 473830. [Google Scholar] [CrossRef] [Green Version]
  7. Fellinger, M.; Neuhold, J.; Marschnig, S. Ballast Condition Monitoring for Turnouts Using Power Spectral Density. J. Transp. Eng. A 2020, 146, 04020099. [Google Scholar] [CrossRef]
  8. Dahlberg, T. Some railroad settlement models—A critical review. Proc. Inst. Mech. Eng. Part F J. Rail Rapid Transit 2001, 215, 289–300. [Google Scholar] [CrossRef]
  9. Elkhoury, N.; Hitihamillage, L.; Moridpour, S.; Robert, D. Degradation Prediction of Rail Tracks: A Review of the Existing Literature. Open Transp. J. 2018, 12, 88–104. [Google Scholar] [CrossRef] [Green Version]
  10. Neuhold, J. Tamping within Sustainable Track Asset Management; Monographic Series TU Graz/Railway Research, vol. 6; Verlag der TU Graz: Graz, Austria, 2020; p. 228. ISBN 978-3-85125-782-3. [Google Scholar]
  11. Andrews, J. A modelling approach to railway track asset management. Proc. Inst. Mech. Eng. Part F J. Rail Rapid Transit 2013, 227, 56–73. [Google Scholar] [CrossRef]
  12. Droździel, J.; Sowiński, B. Simulation of railway track deterioration influenced by ballast stiffness and dry friction. WIT Trans. Built Environ. 2008, 103, 693–702. [Google Scholar]
  13. Famurewa, S.; Xin, T.; Rantatalo, M.; Kumar, U. Optimisation of maintenance track possession time: A tamping case study. Proc. Inst. Mech. Eng. Part F J. Rail Rapid Transit 2013, 229, 12–22. [Google Scholar] [CrossRef]
  14. Caetano, L.F.; Teixeira, P.F. Predictive maintenance model for ballast tamping. J. Transp. Eng. 2016, 142, 04016006. [Google Scholar] [CrossRef]
  15. Vale, C.; Ribeiro, I.M.; Calçada, R. Integer Programming to Optimize Tamping in Railway Tracks as Preventive Maintenance. J. Transp. Eng. 2012, 138, 123–131. [Google Scholar] [CrossRef]
  16. Soleimanmeigouni, I.; Ahmadi, A.; Kumar, U. Track geometry degradation and maintenance modelling: A review. Proc. Inst. Mech. Eng. Part F J. Rail Rapid Transit 2018, 232, 73–102. [Google Scholar] [CrossRef]
  17. Nguyen, K.; José, M.G.; Gabaldon, F. Dynamic effect of high speed railway traffic loads on the ballast track settlement. In Proceedings of the Congresso de Métodos Numéricos em Engenharia, Coimbra, Portugal, 14 June 2011. [Google Scholar]
  18. Zhang, X. Zhao, C.; Zhai, W.; Shi, C.; Feng, Y. Investigation of track settlement and ballast degradation in the high-speed railway using a full-scale laboratory test. Proc. Inst. Mech. Eng. Part F J. Rail Rapid Transit 2019, 233, 869–881. [Google Scholar] [CrossRef]
  19. UIC Asset Management Working Group. Key Cost Drivers in Railway Asset Management; UIC: Paris, France, 2016. [Google Scholar]
  20. Marschnig, S.; Vidovic, I. Estimating future tamping demands using the Swiss Wear Factor. In Proceedings of the 12th World Congress on Railway Research, Tokyo, Japan, 28 October–1 November 2019. [Google Scholar]
  21. Antony, M. Modelling of the ballast maintenance expenses. In Proceedings of the 9th World Congress on Railway Research, Lille, France, 22–26 May 2011. [Google Scholar]
  22. Vale, C.; Ribeiro, I.; Calçada, R. Scheduling tamping through global optimization of maintenance costs. In Proceedings of the 9th World Congress on Railway Research, Lille, France, 22–26 May 2011. [Google Scholar]
  23. Hommes, T.O. Optimisation Model for Scheduling Preventive Tamping Maintenance. Master’s Thesis, TU Delft, Delft, The Netherlands, 2016. [Google Scholar]
Figure 1. Applying the CoMPAcT-algorithm for reliable time-rows and robust forecasting of Longitudinal Level. (a) raw longitudinal level measurements (b) Euclidean distance function (c) post-positioned longitudinal level measurements.
Applsci 12 00368 g001
Figure 2. Showing the Deterioration Process of Track Quality and Quality Improvement due to Tamping.
Applsci 12 00368 g002
Figure 3. Heat Map of SDLL (gliding 100 m) over Time including Tamping Tasks depicting Loss of Track Quality (from green to red) and especially Single Failures with fast Geometry Deterioration.
Applsci 12 00368 g003
Figure 4. Showing the Longitudinal Level at the last Measuring in Q12018 (left) including the Single Failures (1 to 6), SDLL for 100 m gliding and 200 m fixed Base at Q12018 and the executed Line-Tamping and Spot Tamping Tasks over Time (right) for the Base Case Scenario (Scenario 1).
Applsci 12 00368 g004
Figure 5. Showing the forecasted Longitudinal Level in Q12018 (left) including the Single Failures (1 to 6), SDLL for 100 m gliding and 200 m fixed Base at Q12018 and the executed Spot Tamping tasks over Time (right) for the predicted Scenario 2 (“Spot Tamping only”).
Applsci 12 00368 g005
Figure 6. Showing the forecasted Longitudinal Level in 2028 including the already existing Single Failures (1 to 6) and the additional ones (7 to 17) for the predicted Scenario 2a.
Applsci 12 00368 g006
Figure 7. Showing the predicted through-going Tamping Actions and Service Life for the Track Section according to Scenario 1 based on the 4tamping-Algorithm.
Applsci 12 00368 g007
Figure 8. Showing the predicted through-going Tamping Actions and Service Life for the Track Section according to Scenario 2 based on the 4tamping-Algorithm.
Applsci 12 00368 g008
Figure 9. Depicting Life Cycle Costs in the form of average annual Costs for the two Scenarios and thus the long term economic Impact of reduced Track Tamping.
Applsci 12 00368 g009
Publisher’s Note: MDPI stays neutral with regard to jurisdictional claims in published maps and institutional affiliations.

