
Automatic Clustering of Students by Level of Situational Interest Based on Their EEG Features


Abstract
:1. Introduction
- Contribute to further efforts to integrate EEG and clustering methods on automatically clustering the students by the level of SI in real classrooms.
- The results from clustering methods were then validated for their performance efficiency using a supervised machine learning classifier, and
- The best combination EEG feature-clustering algorithm-classification model is proposed as the scheme to cluster the situational interest automatically during classroom learning without relying on questionnaires.
2. Related Work
3. Methodology
3.1. Dataset
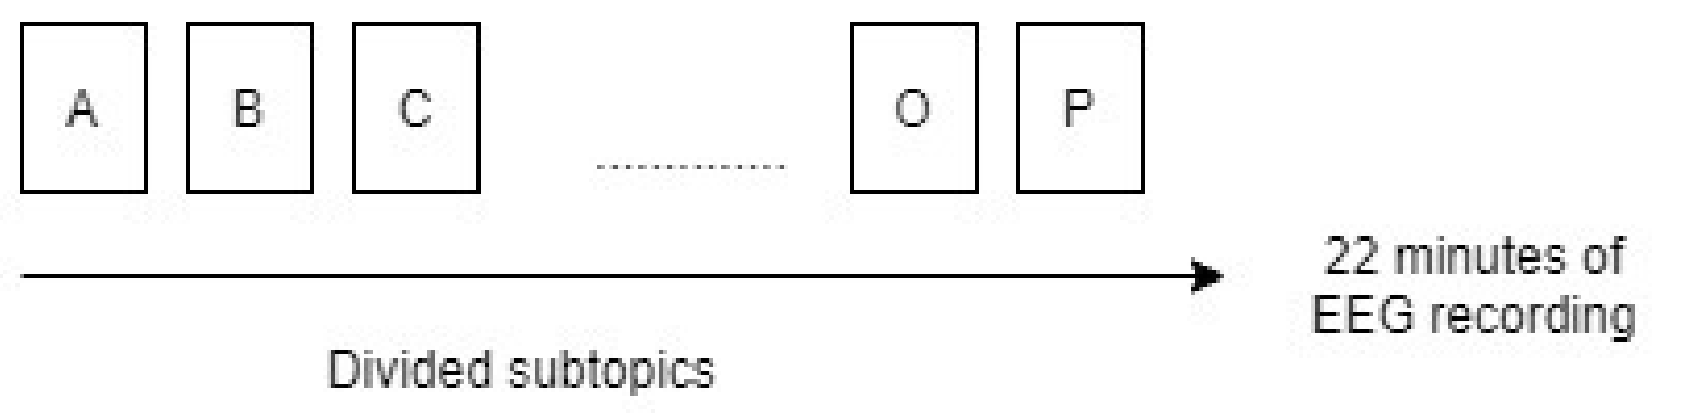
3.2. Stimuli
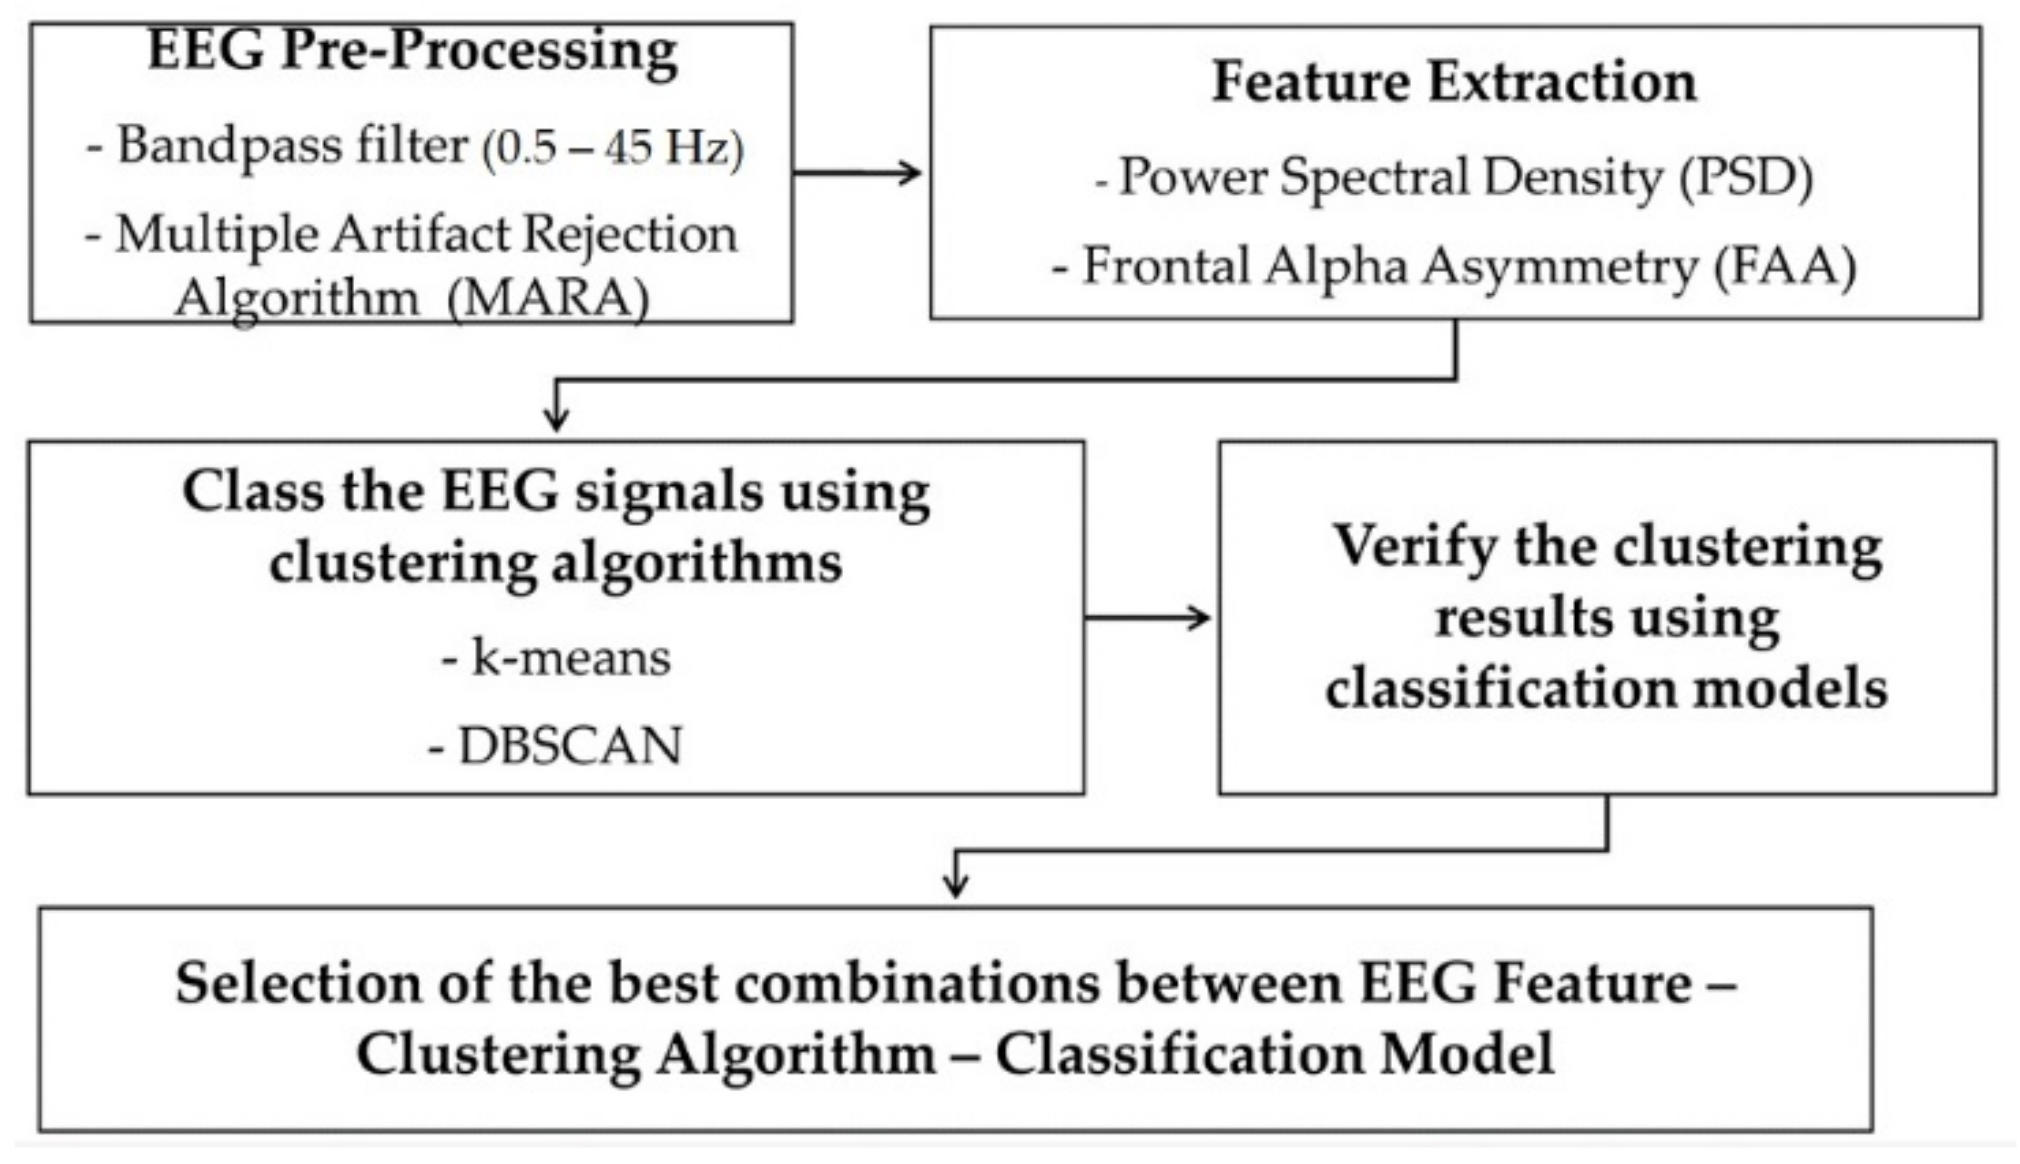
3.3. EEG Data Analysis
3.3.1. EEG Pre-Processing
3.3.2. EEG Power Spectral
3.3.3. Frontal Alpha Asymmetry Analysis
3.4. Clustering Analysis
3.5. Statistical Analysis
3.6. Classification
- the mean delta power at single channel F3,
- the mean delta power at single channel F4,
- the mean delta power at the combination of channel F3 and F4,
- the mean alpha power at single channel F3,
- the mean delta power at single channel F4,
- the mean alpha power at the combination of channel F3 and F4,
- the FAA at FP1-FP2,
- the FAA at F3-F4, and
- the FAA at overall frontal region.
3.7. Performance Assessment
- True Positive (TP): The label belongs to the class, and it is correctly predicted.
- False Positive (FP): The label does not belong to the class, but the classifier is predicted as positive.
- True Negative (TN): The label does not belong to the class, and it is correctly predicted.
- False Negative (FN): The label does belong to the class but is predicted as negative.
4. Results
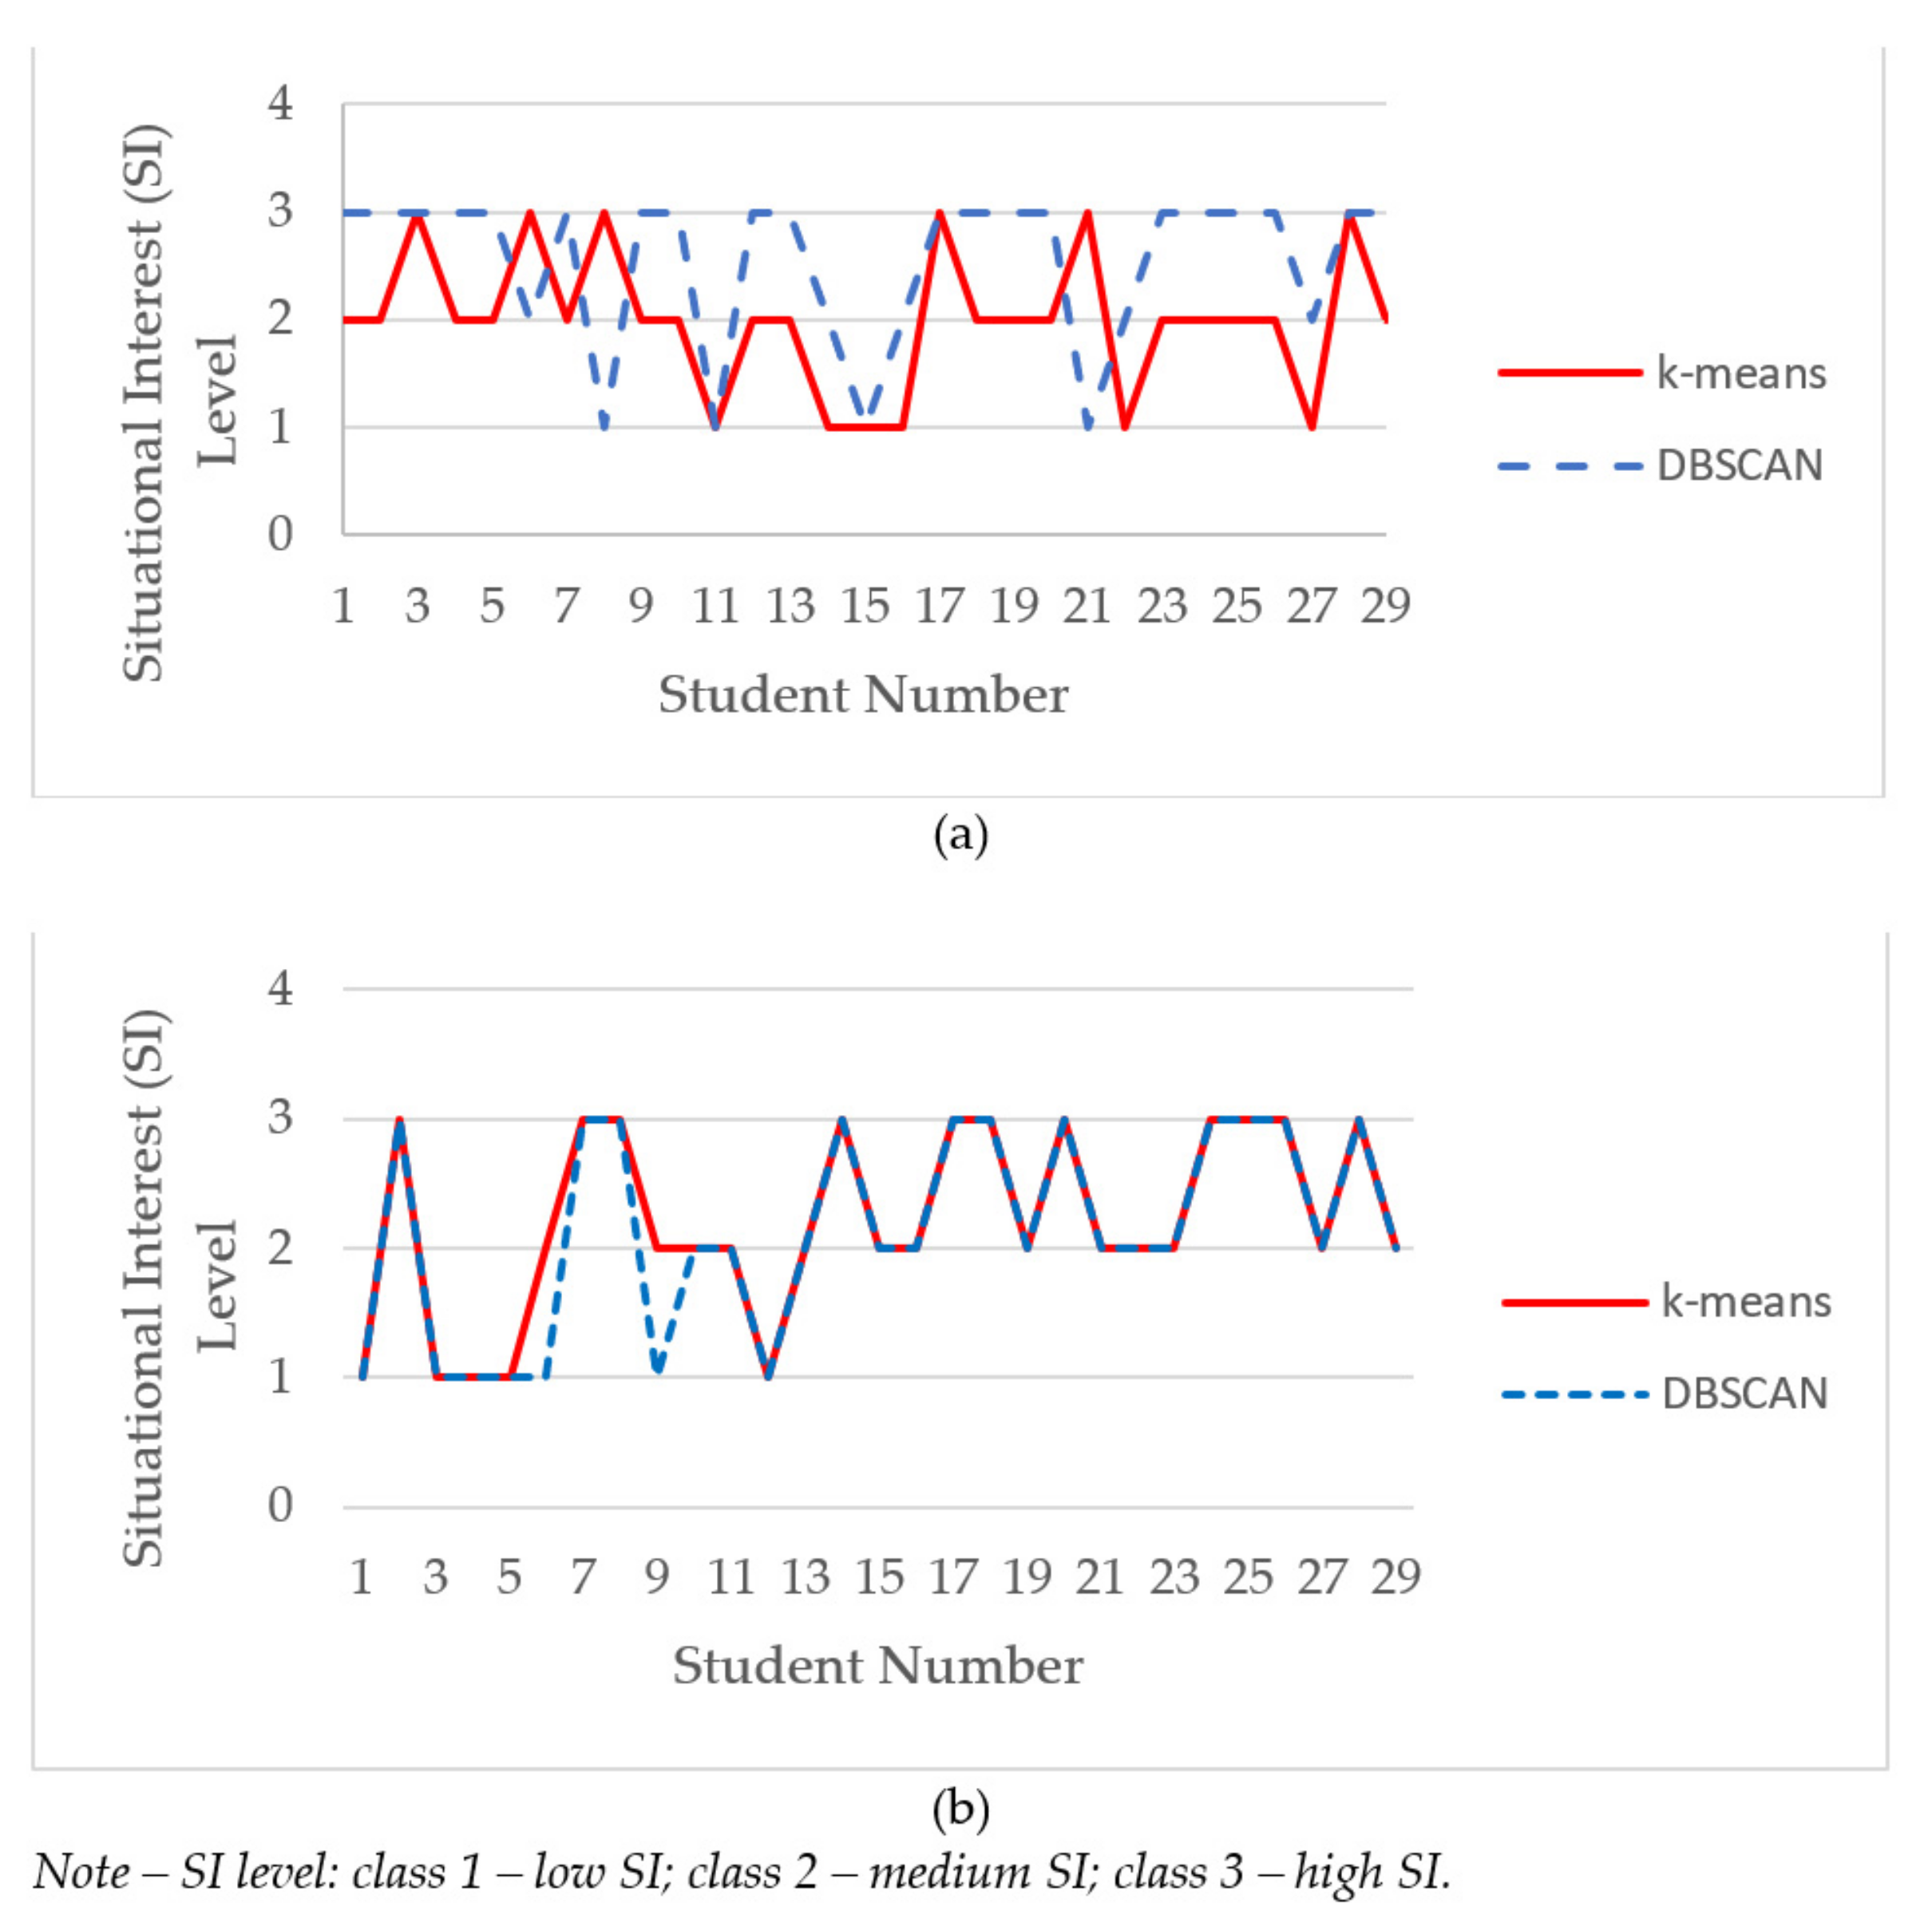
4.1. Clustering Analyses
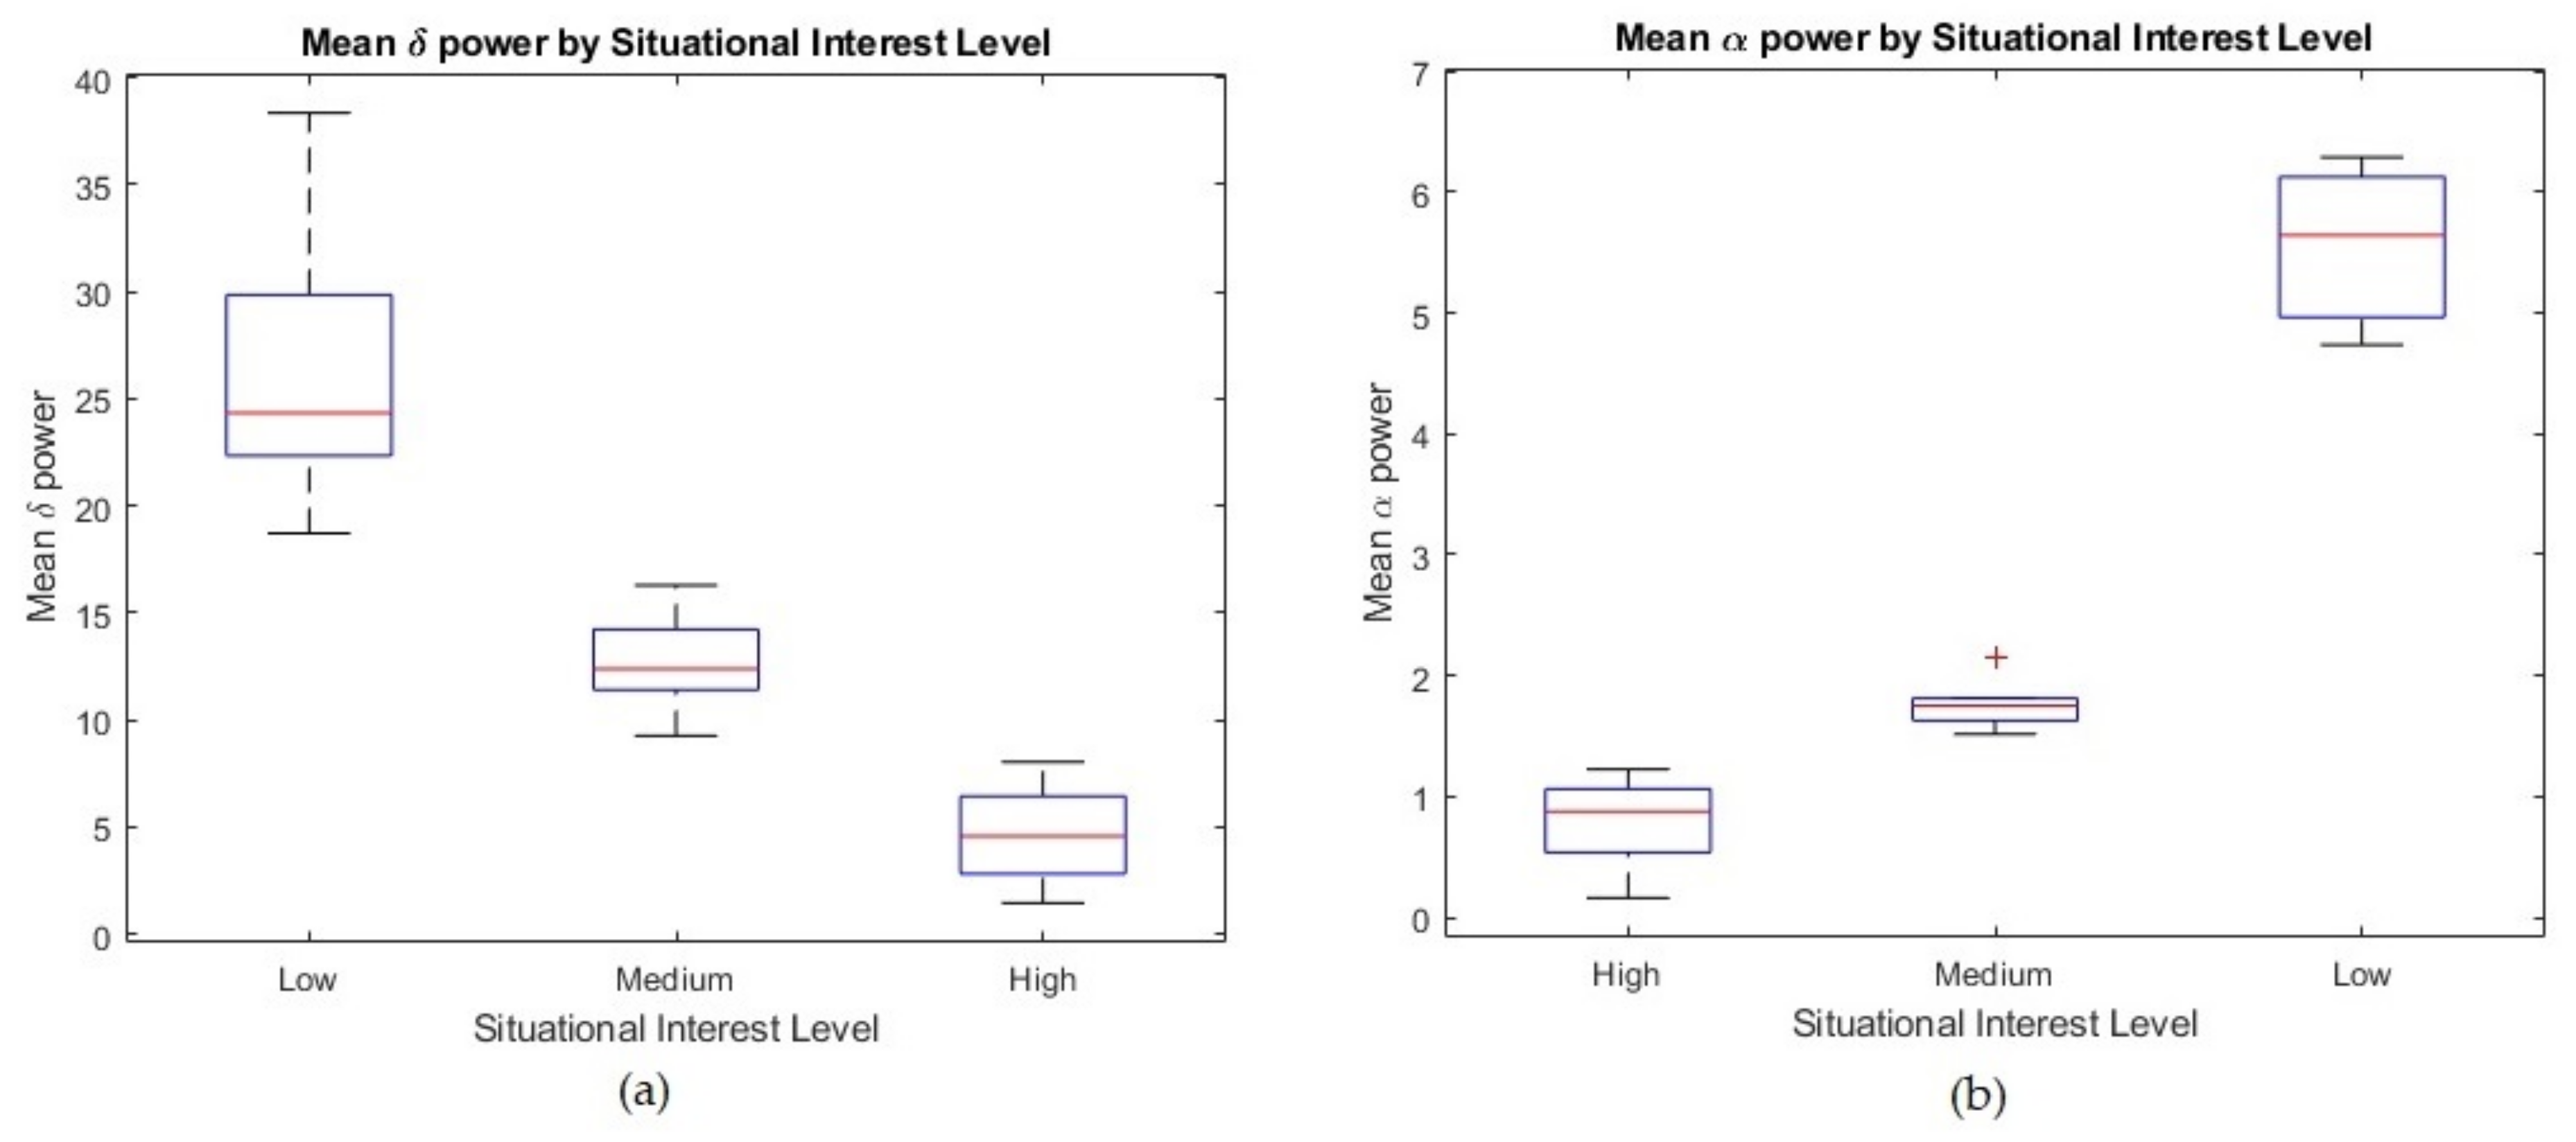
4.2. Power Spectral Analyses
4.3. Asymmetry Analyses
4.4. Performance Analyses
5. Discussion
5.1. Presence of Interest
5.2. Automatic Clustering Scheme of Situational Interest during Classroom Learning
6. Conclusions
Supplementary Materials
Author Contributions
Funding
Informed Consent Statement
Data Availability Statement
Acknowledgments
Conflicts of Interest
Abbreviations
| Physiological Measures | Confusion Matrix | ||
| EEG | Electroencephalogram | EEG | Electroencephalogram |
| ECG | Electrocardiogram | ECG | Electrocardiogram |
| EOG | Electrooculography | EOG | Electrooculography |
| EMG | Electromyography | EMG | Electromyography |
| Interest Type | Input Parameters | ||
| SI | Situational Interest | FFT | Fast Fourier Transform |
| PI | Personal Interest | PSD | Power Spectral Density |
| FAA | Frontal Alpha Asymmetry | ||
| Clustering and Classifier | |||
| DBSCAN | Density-Based Spatial Clustering of Applications with Noise | Others | |
| MLP | Multi-layer Perceptron | BCI | Brain-Computer-Interfacing |
| SVM | Support Vector Machine | UTP | Universiti Teknologi PETRONAS |
| kNN | Nearest Neighbour Classifiers | MARA | Multiple Artifact Rejection Algorithm |
References
- Hidi, S. Interest and Its Contribution as a Mental Resource for Learning. Rev. Educ. Res. 1990, 60, 549–571. [Google Scholar] [CrossRef]
- Rotgans, J.I.; Schmidt, H.G. Interest development: Arousing situational interest affects the growth trajectory of individual interest. Contemp. Educ. Psychol. 2017, 49, 175–184. [Google Scholar] [CrossRef]
- Parker, P.D.; Martin, A.; Colmar, S.; Liem, G.A. Teachers’ workplace well-being: Exploring a process model of goal orientation, coping behavior, engagement, and burnout. Teach. Teach. Educ. 2012, 28, 503–513. [Google Scholar] [CrossRef]
- Mitchell, M. Situational interest: Its multifaceted structure in the secondary school mathematics classroom. J. Educ. Psychol. 1993, 85, 424–436. [Google Scholar] [CrossRef]
- Rotgans, J.; Schmidt, H.G. Situational interest and learning: Thirst for knowledge. Learn. Instr. 2014, 32, 37–50. [Google Scholar] [CrossRef]
- Fuller, K.A.; Karunaratne, N.S.; Naidu, S.; Exintaris, B.; Short, J.L.; Wolcott, M.D.; Singleton, S.; White, P.J. Development of a self-report instrument for measuring in-class student engagement reveals that pretending to engage is a significant unrecognized problem. PLoS ONE 2018, 13, e0205828. [Google Scholar] [CrossRef] [PubMed] [Green Version]
- Borgianni, Y.; Maccioni, L. Review of the use of neurophysiological and biometric measures in experimental design research. Artif. Intell. Eng. Des. Anal. Manuf. 2020, 34, 248–285. [Google Scholar] [CrossRef] [Green Version]
- Cernea, D.; Olech, P.-S.; Ebert, A.; Kerren, A. EEG-Based Measurement of Subjective Parameters in Evaluations. Commun. Comput. Inf. Sci. 2011, 174, 279–283. [Google Scholar] [CrossRef] [Green Version]
- Poulsen, A.T.; Kamronn, S.D.; Dmochowski, J.; Parra, L.C.; Hansen, L.K. EEG in the classroom: Synchronised neural recordings during video presentation. Sci. Rep. 2017, 7, 43916. [Google Scholar] [CrossRef] [Green Version]
- Ang, H.; Sanchez, G.; Pascual, J. Detecting Interest in Video Advertisements Using EEG Data Analysis. Philipp. Inf. Technol. J. 2014, 7, 4–12. [Google Scholar] [CrossRef]
- Wei, Z.; Wu, C.; Wang, X.; Supratak, A.; Wang, P.; Guo, Y. Using Support Vector Machine on EEG for Advertisement Impact Assessment. Front. Neurosci. 2018, 12, 1–12. [Google Scholar] [CrossRef] [Green Version]
- Nor, N.M.; Bar, A.W.; Salleh, S.H.S. Correlation of Student’s Precursor Emotion towards Learning Science Interest using EEG. TELKOMNIKA Telecommun. Comput. Electron. Control. 2015, 13, 1162–1169. [Google Scholar] [CrossRef] [Green Version]
- Hidi, S.; Harackiewicz, J.M. Motivating the Academically Unmotivated: A Critical Issue for the 21st Century. Rev. Educ. Res. 2000, 70, 151–179. [Google Scholar] [CrossRef]
- Sharma, A. Attention & Relaxation Enhancement using Meditation as an Intervention: A Psychological and Physiological Study. Master’s Thesis, Thapar University, Patalia, India, 15 July 2015. [Google Scholar]
- Womelsdorf, T.; Fries, P. The role of neuronal synchronization in selective attention. Curr. Opin. Neurobiol. 2007, 17, 154–160. [Google Scholar] [CrossRef]
- Moldovan, A.-N.; Ghergulescu, I.; Muntean, C.H. Analysis of Learner Interest, QoE and EEG-Based Affective States in Multimedia Mobile Learning. In Proceedings of the 2017 IEEE 17th International Conference on Advanced Learning Technologies (ICALT), Timisoara, Romania, 3–7 July 2017; pp. 398–402. [Google Scholar] [CrossRef]
- Gazzaniga, M.S.; Ivry, R.B.; Mangun, G.R. Cognitive Neuroscience The Biology of the Mind, 4th ed.; W.W. Norton & Company: New York, NY, USA, 2014. [Google Scholar]
- Azcarraga, J.; Suarez, M.T. Recognizing Student Emotions using Brainwaves and Mouse Behavior Data. Int. J. Distance Educ. Technol. 2013, 11, 1–15. [Google Scholar] [CrossRef]
- Oyelade, O.J.; Oladipupo, O.O.; Obagbuwa, I.C. Application of k Means Clustering algorithm for prediction of Students Academic Performance. Int. J. Comput. Sci. Inf. Secur. 2010, 7, 292–295. [Google Scholar]
- Henderi; Sunarya, A.; Zakaria; Nurmika, S.L.; Asmainah, N. Evaluation model of students learning outcome using k-means algorithm. J. Physics Conf. Ser. 2020, 1477. [Google Scholar] [CrossRef]
- Al-deen, A.K. Usage of Cms Database & Dbscan Algorithm in The Management of Learning And Knowledge Electronic at Applying on The Institute of Qualifying Women Teachers. Int. J. Adv. Eng. Technol. 2015, 8, 689–711. [Google Scholar]
- Sheth, J.; Patel, B. Fuzzy K-Means Clustering in Measuring Course Outcome Attainment System for Higher Educational Institutes. In Advances in Intelligent Systems and Computing; Springer: Singapore, 2020; Volume 1187, pp. 27–33. [Google Scholar]
- Dinh, D.T.; Fujinami, T.; Huynh, V.N. Estimating the Optimal Number of Clusters in Categorical Data Clustering by Silhouette Coefficient; Springer: Singapore, 2019. [Google Scholar]
- Jia, H.; Cheung, Y.-M. Subspace Clustering of Categorical and Numerical Data With an Unknown Number of Clusters. IEEE Trans. Neural Networks Learn. Syst. 2018, 29, 3308–3325. [Google Scholar] [CrossRef]
- Ko, L.-W.; Komarov, O.; Hairston, W.D.; Jung, T.-P.; Lin, C.-T. Sustained Attention in Real Classroom Settings: An EEG Study. Front. Hum. Neurosci. 2017, 11, 388. [Google Scholar] [CrossRef] [PubMed]
- Palva, S.; Palva, J.M. New vistas for α-frequency band oscillations. Trends Neurosci. 2007, 30, 150–158. [Google Scholar] [CrossRef] [PubMed]
- Babiker, A.; Faye, I. A Hybrid EMD-Wavelet EEG Feature Extraction Method for the Classification of Students’ Interest in the Mathematics Classroom. Comput. Intell. Neurosci. 2021, 2021, 6617462. [Google Scholar] [CrossRef]
- Mohamed, Z.; El Halaby, M.; Said, T.; Shawky, D.; Badawi, A. Characterizing Focused Attention and Working Memory Using EEG. Sensors 2018, 18, 3743. [Google Scholar] [CrossRef] [PubMed] [Green Version]
- Friedrich, R.M.; Friederici, A.D. Mathematical Logic in the Human Brain: Semantics. PLoS ONE 2013, 8, e53699. [Google Scholar] [CrossRef] [Green Version]
- Arsalidou, M.; Pawliw-Levac, M.; Sadeghi, M.; Pascual-Leone, J. Brain areas associated with numbers and calculations in children: Meta-analyses of fMRI studies. Dev. Cogn. Neurosci. 2018, 30, 239–250. [Google Scholar] [CrossRef]
- Gullick, M.M.; Wolford, G. Brain systems involved in arithmetic with positive versus negative numbers. Hum. Brain Mapp. 2014, 35, 539–551. [Google Scholar] [CrossRef]
- Yaomanee, K.; Pan-Ngum, S.; Na Ayuthaya, P.I. Brain signal detection methodology for attention training using minimal EEG channels. In Proceedings of the 2012 Tenth International Conference on ICT and Knowledge Engineering, Bangkok, Thailand, 21–23 November 2012; pp. 84–89. [Google Scholar] [CrossRef]
- Bono, V.; Das, S.; Jamal, W.; Maharatna, K. Hybrid wavelet and EMD/ICA approach for artifact suppression in pervasive EEG. J. Neurosci. Methods 2016, 267, 89–107. [Google Scholar] [CrossRef] [Green Version]
- Davidson, R.J.; Ekman, P.; Saron, C.D.; Senulis, J.A.; Friesen, W.V. Approach-withdrawal and cerebral asymmetry: Emotional expression and brain physiology: I. J. Pers. Soc. Psychol. 1990, 58, 330–341. [Google Scholar] [CrossRef]
- Briesemeister, B.B.; Tamm, S.; Heine, A.; Jacobs, A.M. Approach the Good, Withdraw from the Bad—A Review on Frontal Alpha Asymmetry Measures in Applied Psychological Research. Psychology 2013, 04, 261–267. [Google Scholar] [CrossRef] [Green Version]
- Rajanen, D.; Salminen, M.; Ravaja, N. Psychophysiological responses to digital media. In Proceedings of the 19th International Academic Mindtrek Conference, Tampere, Finland, 22–24 September 2015; ACM Press: New York, NY, USA, 2015; pp. 155–162. [Google Scholar] [CrossRef]
- Soni, P. The Emotional Life of Your Brain by Richard J. Davidson and Sharon Begley. Am. J. Clin. Hypn. 2014, 56, 303–304. [Google Scholar] [CrossRef]
- Babiker, A.; Faye, I.; Mumtaz, W.; Malik, A.S.; Sato, H. EEG in classroom: EMD features to detect situational interest of students during learning. Multimed. Tools Appl. 2019, 78, 16261–16281. [Google Scholar] [CrossRef]
- Winkler, I.; Haufe, S.; Tangermann, M. Automatic Classification of Artifactual ICA-Components for Artifact Removal in EEG Signals. Behav. Brain Funct. 2011, 7, 30. [Google Scholar] [CrossRef] [PubMed] [Green Version]
- Brunner, C.; Delorme, A.; Makeig, S. Eeglab—An Open Source Matlab Toolbox for Electrophysiological Research. Biomed. Tech. Eng. 2013, 58, 13–14. [Google Scholar] [CrossRef] [PubMed] [Green Version]
- Winkler, I.; Brandl, S.; Horn, F.; Waldburger, E.; Allefeld, C.; Tangermann, M. Robust artifactual independent component classification for BCI practitioners. J. Neural Eng. 2014, 11, 035013. [Google Scholar] [CrossRef] [Green Version]
- Welch, P.D. The Use of Fast Fourier Transform for the Estimation of Power Spectra. Digit. Signal Process. 1975, 2, 532–574. [Google Scholar]
- Heinzel, G.; Rüdiger, A.; Schilling, R. Spectrum and spectral density estimation by the Discrete Fourier transform (DFT). MPG Publ. Repos. 2002, 15, 1–84. [Google Scholar]
- Allen, J.J.; Coan, J.A.; Nazarian, M. Issues and assumptions on the road from raw signals to metrics of frontal EEG asymmetry in emotion. Biol. Psychol. 2004, 67, 183–218. [Google Scholar] [CrossRef]
- Arthur, D.; Vassilvitskii, S. K-means++: The advantages of careful seeding. In Proceedings of the Annual ACM-SIAM Symposium on Discrete Algorithms, New Orleans, LA, USA, 7–9 January 2007; pp. 1027–1035. [Google Scholar]
- Jain, A.K. Data clustering: 50 years beyond K-means. Pattern Recognit. Lett. 2010, 31, 651–666. [Google Scholar] [CrossRef]
- Asanza, V.; Ochoa, K.; Sacarelo, C.; Salazar, C.; Loayza, F.; Vaca, C.; Pelaez, E. Clustering of EEG occipital signals using k-means. In Proceedings of the IEEE Ecuador Technical Chapters Meeting (ETCM), Guayaquil, Ecuador, 12–14 October 2016. [Google Scholar] [CrossRef]
- Orhan, U.; Hekim, M.; Ozer, M. EEG signals classification using the K-means clustering and a multilayer perceptron neural network model. Expert Syst. Appl. 2011, 38, 13475–13481. [Google Scholar] [CrossRef]
- Ester, M.; Kriegel, H.P.; Sander, J.; Xu, X. A Density-Based Algorithm for Discovering Clusters in Large Spatial Databases with Noise. In Proceedings of the 2nd International Conference on Knowledge Discovery and Data Mining KDD-96, Portland, OR, USA, 2–4 August 1996; pp. 226–231. Available online: www.aaai.org (accessed on 3 March 2021).
- Ghasemi, A.; Zahediasl, S. Normality Tests for Statistical Analysis: A Guide for Non-Statisticians. Int. J. Endocrinol. Metab. 2012, 10, 486–489. [Google Scholar] [CrossRef] [Green Version]
- Harmony, T. The functional significance of delta oscillations in cognitive processing. Front. Integr. Neurosci. 2013, 7, 1–10. [Google Scholar] [CrossRef] [Green Version]
- Klimesch, W.; Doppelmayr, M.; Wimmer, H.; Gruber, W.; Röhm, D.; Schwaiger, J.; Hutzler, F. Alpha and beta band power changes in normal and dyslexic children. Clin. Neurophysiol. 2001, 112, 1186–1195. [Google Scholar] [CrossRef]
- Pfurtscheller, G. Induced Oscillations in the Alpha Band: Functional Meaning. Epilepsia 2003, 44, 2–8. [Google Scholar] [CrossRef] [Green Version]
- Reznik, S.J.; Allen, J.J.B. Frontal asymmetry as a mediator and moderator of emotion: An updated review. Psychophysiology 2018, 55, e12965. [Google Scholar] [CrossRef]
- Lin, C.-H.; Hsu, K.-C.; Johnson, K.R.; Luby, M.; Fann, Y.C. Applying density-based outlier identifications using multiple datasets for validation of stroke clinical outcomes. Int. J. Med Inform. 2019, 132, 103988. [Google Scholar] [CrossRef] [PubMed]
- Lara, J.A.; Lizcano, D.; Ramperez, V.; Soriano, J. A method for outlier detection based on cluster analysis and visual expert criteria. Expert Syst. 2020, 37, e12473. [Google Scholar] [CrossRef]
- Sai, C.Y.; Mokhtar, N.; Iwahashi, M.; Cumming, P.; Arof, H. Fully automated unsupervised artefact removal in multichannel electroencephalogram using wavelet-independent component analysis with density-based spatial clustering of application with noise. IET Signal Process. 2021, 15, 535–542. [Google Scholar] [CrossRef]
- Schmid, P.; Hackel, L.M.; Jasperse, L.; Amodio, D.M. Frontal cortical effects on feedback processing and reinforcement learning: Relation of EEG asymmetry with the feedback-related negativity and behavior. Psychophysiology 2018, 55, e12911. [Google Scholar] [CrossRef] [PubMed]


| Subtopic | Details | Length (s) |
|---|---|---|
| D | Definition of Laplace | 124 |
| F | History of Laplace Transform | 142 |
| H | Unit step function | 68 |
| I | Challenge question | 68 |
| Label | Domain | Name of Classification Model | Label | Domain | Name of Classification Model |
|---|---|---|---|---|---|
| 1 | Decision Tree | Fine Tree | 16 | kNN | Coarse kNN |
| 2 | Medium Tree | 17 | Cosine kNN | ||
| 3 | Coarse Tree | 18 | Cubic kNN | ||
| 4 | Discriminant Analysis | Linear Discriminant | 19 | Weighted kNN | |
| 5 | Quadratic Discriminant | 20 | Ensemble Classifiers | Boosted Tree | |
| 6 | Naïve Bayes | Gaussian Naïve Bayes | 21 | Bagged Tree | |
| 7 | Kernel Naïve Bayes | 22 | Subspace Discriminant | ||
| 8 | SVM | Linear SVM | 23 | Subspace kNN | |
| 9 | Quadratic SVM | 24 | RUSBoosted Tree | ||
| 10 | Cubic SVM | 25 | Neural Network | Narrow Neural Network | |
| 11 | Fine Gaussian SVM | 26 | Medium Neural Network | ||
| 12 | Medium Gaussian SVM | 27 | Wide Neural Network | ||
| 13 | Coarse Gaussian SVM | 28 | Bilayered Neural Network | ||
| 14 | kNN | Fine kNN | 29 | Trilayered Neural Network | |
| 15 | Medium kNN | ||||
| Actual Value | Predicted Value | ||
|---|---|---|---|
| High SI (1) | Medium SI (2) | Low SI (3) | |
| High SI (1) | L | M | N |
| Medium SI (2) | O | P | Q |
| Low SI (3) | R | S | T |
 True positives
  True negatives
  Misclassified class.
| EEG Features | Subtopics | k-Means | DBSCAN | ||||
|---|---|---|---|---|---|---|---|
| Low SI | Medium SI | High SI | Low SI | Medium SI | High SI | ||
| Mean δ power at F3 | D | 7 | 17 | 5 | 4 | 5 | 20 |
| F | 5 | 12 | 12 | 12 | 8 | 9 | |
| H | 7 | 15 | 7 | 6 | 3 | 20 | |
| I | 7 | 13 | 9 | 13 | 9 | 7 | |
| Mean δ power at F4 | D | 1 | 16 | 12 | 3 | 9 | 17 |
| F | 1 | 8 | 20 | 3 | 6 | 20 | |
| H | 3 | 14 | 12 | 3 | 15 | 11 | |
| I | 3 | 8 | 18 | 12 | 8 | 9 | |
| Mean δ power at F3 and F4 | D | 1 | 7 | 21 | 9 | 14 | 6 |
| F | 5 | 13 | 11 | 7 | 10 | 12 | |
| H | 7 | 8 | 14 | 9 | 3 | 17 | |
| I | 3 | 11 | 15 | 11 | 7 | 11 | |
| Mean α power at F3 | D | 3 | 9 | 17 | 6 | 7 | 16 |
| F | 2 | 9 | 17 | 3 | 8 | 18 | |
| H | 2 | 10 | 17 | 9 | 4 | 16 | |
| I | 1 | 13 | 15 | 8 | 9 | 12 | |
| Mean α power at F4 | D | 1 | 8 | 20 | 5 | 6 | 18 |
| F | 1 | 5 | 13 | 8 | 8 | 13 | |
| H | 1 | 13 | 15 | 8 | 13 | 8 | |
| I | 1 | 7 | 21 | 3 | 5 | 11 | |
| Mean α power at F3 and F4 | D | 1 | 13 | 15 | 6 | 6 | 17 |
| F | 2 | 12 | 15 | 5 | 10 | 14 | |
| H | 2 | 5 | 22 | 8 | 9 | 12 | |
| I | 3 | 7 | 19 | 4 | 6 | 19 | |
| FAA at FP1-FP2 | D | 3 | 21 | 5 | 10 | 14 | 5 |
| F | 4 | 7 | 18 | 15 | 9 | 5 | |
| H | 16 | 11 | 2 | 9 | 7 | 13 | |
| I | 18 | 3 | 8 | 6 | 4 | 19 | |
| FAA at F3-F4 | D | 4 | 12 | 13 | 8 | 14 | 7 |
| F | 5 | 12 | 12 | 8 | 12 | 9 | |
| H | 4 | 11 | 14 | 10 | 8 | 11 | |
| I | 14 | 2 | 13 | 21 | 4 | 4 | |
| FAA at Combined Pairs | D | 7 | 9 | 13 | 12 | 10 | 8 |
| F | 8 | 15 | 6 | 21 | 4 | 4 | |
| H | 17 | 9 | 3 | 20 | 5 | 4 | |
| I | 12 | 16 | 1 | 20 | 5 | 4 | |
| EEG Features | EEG Channel | Clustering Algorithm | |
|---|---|---|---|
| k-Means | DBSCAN | ||
| Mean δ power | F3 | 1.28 s | 1.28 s |
| F4 | 1.22 s | 1.22 s | |
| F3 and F4 | 1.21 s | 1.21 s | |
| Mean α power | F3 | 1.23 s | 1.23 s |
| F4 | 1.25 s | 1.25 s | |
| F3 and F4 | 1.28 s | 1.28 s | |
| FAA | FP1-FP2 | 1.30 s | 1.30 s |
| F3-F4 | 1.22 s | 1.22 s | |
| Combine Pairs | 1.17 s | 1.72 s | |
| Average time | 1.24 s | 1.73 s | |
| Electrode Position | Delta | Alpha | ||
|---|---|---|---|---|
| k-Means | DBSCAN | k-Means | DBSCAN | |
| F3 | 0.1583 | 0.2895 | 0.0160 * | 0.0073 * |
| F4 | 0.0383 * | 0.1401 | 0.0026 * | 0.0021 * |
| Combination of F3 and F4 | 0.0029 * | 0.0285 * | 0.0175 * | 0.0178 * |
| Electrode Pair | FAA | |
|---|---|---|
| k-Means | DBSCAN | |
| FP1-FP2 | 0.1087 | 0.0536 |
| F3-F4 | 0.1741 | 0.1075 |
| Combination of pair FP1-FP2 and F3-F4 | 0.0353 * | 0.2086 |
| EEG Features | EEG Channel | Clustering Algorithm | Classification Model Label | Total Model | Acc | Sn | Sp | P | R | FM | GM |
|---|---|---|---|---|---|---|---|---|---|---|---|
| Mean δ power | F3 | k-means | 2, 14, 22 | 3 | 1.000 ± 0 | 1.000 ± 0 | 1.000 ± 0 | 1.000 ± 0 | 1.000 ± 0 | 1.000 ± 0 | 1.000 ± 0 |
| F4 | 10 | 1 | 1.000 ± 0 | 1.000 ± 0 | 1.000 ± 0 | 1.000 ± 0 | 1.000 ± 0 | 1.000 ± 0 | 1.000 ± 0 | ||
| F3 and F4 | 11, 14, 21, 23 | 4 | 1.000 ± 0 | 1.000 ± 0 | 1.000 ± 0 | 1.000 ± 0 | 1.000 ± 0 | 1.000 ± 0 | 1.000 ± 0 | ||
| Mean δ power | F3 | DBSCAN | None | 0 | 0.969 ± 0.063 | 1.000 ± 0 | 0.938 ± 0.125 | 0.958 ± 0.083 | 1.000 ± 0 | 0.977 ± 0.046 | 0.967 ± 0.067 |
| F4 | None | 0 | 1.000 ± 0 | 1.000 ± 0 | 1.000 ± 0 | 1.000 ± 0 | 1.000 ± 0 | 1.000 ± 0 | 1.000 ± 0 | ||
| F3 and F4 | None | 0 | 0.969 ± 0.063 | 1.000 ± 0 | 1.000 ± 0 | 1.000 ± 0 | 1.000 ± 0 | 0.875 ± 0.250 | 0.978 ± 0.147 | ||
| Mean α power | F3 | k-means | 1–12, 17,19, 20, 21, 23–27 | 21 | 0.969 ± 0.063 | 1.000 ± 0 | 0.917 ± 0.125 | 0.958 ± 0.083 | 1.000 ± 0 | 0.977 ± 0.046 | 0.954 ± 0.092 |
| F4 | None | 0 | 0.906 ± 0.120 | 1.000 ± 0 | 0.750 ± 0.500 | 0.929 ± 0.143 | 1.000 ± 0 | 0.948 ± 0.068 | 0.750 ± 0.500 | ||
| F3 and F4 | 5, 23 | 2 | 1.000 ± 0 | 1.000 ± 0 | 1.000 ± 0 | 1.000 ± 0 | 1.000 ± 0 | 1.000 ± 0 | 1.000 ± 0 | ||
| Mean α power | F3 | DBSCAN | 5, 6, 7, 9, 10. 12, 19, 26 | 8 | 1.000 ± 0 | 1.000 ± 0 | 1.000 ± 0 | 1.000 ± 0 | 1.000 ± 0 | 1.000 ± 0 | 1.000 ± 0 |
| F4 | None | 0 | 0.906 ± 0.120 | 1.000 ± 0 | 0.792 ± 0.250 | 0.938 ± 0.125 | 1.000 ± 0 | 0.914 ± 0.102 | 0.839 ± 0.150 | ||
| F3 and F4 | None | 0 | 0.969 ± 0.063 | 1.000 ± 0 | 0.917 ± 0.167 | 0.958 ± 0.083 | 1.000 ± 0 | 0.977 ± 0.046 | 0.954 ± 0.092 | ||
| FAA | FP1-FP2 | k-means | 29 | 1 | 1.000 ± 0 | 1.000 ± 0 | 1.000 ± 0 | 1.000 ± 0 | 1.000 ± 0 | 1.000 ± 0 | 1.000 ± 0 |
| F3-F4 | 14, 25, 26, 28 | 4 | 1.000 ± 0 | 1.000 ± 0 | 1.000 ± 0 | 1.000 ± 0 | 1.000 ± 0 | 1.000 ± 0 | 1.000 ± 0 | ||
| Combine Pairs | 10, 19, 22, 25, 28 | 5 | 1.000 ± 0 | 1.000 ± 0 | 1.000 ± 0 | 1.000 ± 0 | 1.000 ± 0 | 1.000 ± 0 | 1.000 ± 0 | ||
| FAA | FP1-FP2 | DBSCAN | 25 | 1 | 1.000 ± 0 | 1.000 ± 0 | 1.000 ± 0 | 1.000 ± 0 | 1.000 ± 0 | 1.000 ± 0 | 1.000 ± 0 |
| F3-F4 | 27, 28 | 2 | 1.000 ± 0 | 1.000 ± 0 | 1.000 ± 0 | 1.000 ± 0 | 1.000 ± 0 | 1.000 ± 0 | 1.000 ± 0 | ||
| Combine Pairs | None | 0 | 0.875 ± 0.144 | 1.000 ± 0 | 0.917 ± 0.167 | 0.667 ± 0.577 | 1.000 ± 0 | 1.000 ± 0 | 1.000 ± 0 |
| EEG Feature | Clustering Algorithm | Classification Model |
|---|---|---|
| Mean δ power at F3 and F4 | k-means | Subspace kNN |
| Mean α power at F3 and F4 | k-means | Subspace kNN |
| Average FAA at FP1-FP2 and F3-F4 | k-means | Cubic SVM Weighted kNN Subspace Discriminant Narrow Neural Network Bilayered Neural Network |
Publisher’s Note: MDPI stays neutral with regard to jurisdictional claims in published maps and institutional affiliations. |
© 2021 by the authors. Licensee MDPI, Basel, Switzerland. This article is an open access article distributed under the terms and conditions of the Creative Commons Attribution (CC BY) license (https://creativecommons.org/licenses/by/4.0/).
Share and Cite
Othman, E.S.; Faye, I.; Hussaan, A.M. Automatic Clustering of Students by Level of Situational Interest Based on Their EEG Features. Appl. Sci. 2022, 12, 389. https://doi.org/10.3390/app12010389
Othman ES, Faye I, Hussaan AM. Automatic Clustering of Students by Level of Situational Interest Based on Their EEG Features. Applied Sciences. 2022; 12(1):389. https://doi.org/10.3390/app12010389
Chicago/Turabian StyleOthman, Ernee Sazlinayati, Ibrahima Faye, and Aarij Mahmood Hussaan. 2022. "Automatic Clustering of Students by Level of Situational Interest Based on Their EEG Features" Applied Sciences 12, no. 1: 389. https://doi.org/10.3390/app12010389
APA StyleOthman, E. S., Faye, I., & Hussaan, A. M. (2022). Automatic Clustering of Students by Level of Situational Interest Based on Their EEG Features. Applied Sciences, 12(1), 389. https://doi.org/10.3390/app12010389