Abstract
Automatic segmentation and centerline extraction of blood vessels from retinal fundus images is an essential step to measure the state of retinal blood vessels and achieve the goal of auxiliary diagnosis. Combining the information of blood vessel segments and centerline can help improve the continuity of results and performance. However, previous studies have usually treated these two tasks as separate research topics. Therefore, we propose a novel multitask learning network (MSC-Net) for retinal vessel segmentation and centerline extraction. The network uses a multibranch design to combine information between two tasks. Channel and atrous spatial fusion block (CAS-FB) is designed to fuse and correct the features of different branches and different scales. The clDice loss function is also used to constrain the topological continuity of blood vessel segments and centerline. Experimental results on different fundus blood vessel datasets (DRIVE, STARE, and CHASE) show that our method can obtain better segmentation and centerline extraction results at different scales and has better topological continuity than state-of-the-art methods.
1. Introduction
The morphological transformation of the retinal vascular system is closely related to various ophthalmological and cardiovascular diseases, such as glaucoma, hypertension, diabetes, and arteriosclerosis [1]. Therefore, the morphology of retinal vessels is considered as an important evaluation standard for many diseases. Retinal blood vessels can be imaged through color fundus images [2], and clinicians can realize disease diagnosis, screening, treatment, and evaluation by analyzing retinal image blood vessels [3]. Automatic methods are desired because current methods for the labeling of retinal blood vessels require professional doctors and manpower [4]. The automatic segmentation and centerline extraction of retinal blood vessels is still a challenging task because of the small size of blood vessels, overlapping branches, distortion, and severe stenosis in retinal images, as well as varying image quality caused by low contrast, noise, and artifacts [5].
The development of computer vision has led to the emergence of many methods for retinal blood vessel segmentation. These methods can usually be organized into traditional image processing methods and machine learning methods. Traditional blood vessel segmentation methods include matched filters [6,7], morphological methods [8], blood vessel tracking [9,10], and so on. In recent years, many machine learning methods, especially deep learning methods, have been used for retinal vascular segmentation and achieved good results. Machine learning methods can be further divided into supervised and unsupervised methods. Unsupervised methods, such as the Gaussian mixture model [11], fuzzy techniques [12], and k-means clustering [13], do not require labeled data for blood vessel segmentation. Supervised retinal vessel segmentation methods use the image data of labeled vessels to train the classifier and classify the vessels and background at the pixel level. The supervised methods for retinal blood vessel segmentation are based on traditional machine learning methods and some deep learning methods. For example, Orlando et al. [14] used support vector machines for vessel segmentation, and Fraz et al. [15] designed an integrated system based on decision tree to achieve the segmentation of blood vessels from retinal images.
Among the many machine learning methods, deep learning is currently the state-of-the-art method [16]. Ronneberger et al. [17] proposed a U-Net architecture that requires only a few annotated images to achieve high-precision blood vessel segmentation. Alom et al. [18] presented a recurrent residual convolutional neural network named R2U-Net based on U-Net models and residual network models. Guo et al. [19] proposed a network named Spatial Attention U-Net by introducing a spatial attention module that inferred the attention map along the spatial dimension and multiplied the attention map by the input feature map for adaptive feature refinement. Mou et al. [20] designed a segmentation network, CS-Net, which added an attention module in the encoder layer and decoder layer to segment the tubular structure. These methods are better than classical methods.
There are also some state-of-art methods, such as generative adversarial networks (GAN), transfer learning, multitask learning, and so on. GAN has superior data classification capabilities [21]. Park et al. [22] used a conditional generation confrontation network to achieve accurate segmentation of fundus blood vessels. Transfer learning is a neural architecture trained in other fields first, then fine-tuned and applied to new tasks [23]. Jiang et al. [24] used the transfer learning method to pre-train the full convolutional network to realize the segmentation of multiple fundus datasets. The method based on multitask learning can associate different tasks, realize the sharing and mutual complement of features, and realize the improvement of performance between tasks. Ma et al. [25] proposed a multitask learning method that simultaneously performs two tasks of blood vessel segmentation and arteriovenous classification, which enhances the performance of arteriovenous classification. Xu et al. [26] designed a network framework to perform the task of extracting blood vessels and centerlines at the same time.
Vessel segmentation is closely related to centerline extraction [27]. However, many studies have divided these two tasks into independent tasks, which may lead to discontinuities in the small part when only the blood vessel segmentation task is performed, and the single centerline extraction will cause a higher false-positive rate because of the lack of constraint of the segmentation result. In the work of single centerline extraction, the centerline can be obtained after the skeletonization process of pre-segmented blood vessels [28]. The main disadvantage of this method is that inaccurate blood vessel segmentation may lead to skeletonization errors. Morales et al. [29] proposed the method of determining the retinal skeleton in a direct way through random watershed transformation. In this method, the division area has no limit, which may generate wrong branches. Therefore, some methods combine segmentation and centerline extraction. Shit et al. [30] proposed a clDice loss function to realize the constraint of the centerline on blood vessels, but they only focus on the segmentation task, and the centerline is only an intermediate result. Tetteh et al. [31] used the Inception architecture without a pooling layer to classify each pixel in the image block and extract the blood vessel centerline. Kromm et al. [5] performed blood vessel segmentation and centerline generation based on the Capsule Network combined with the Inception architecture. However, these methods usually do not take into account the direct constraint relationship between the two tasks.
This paper proposes a multitask learning network to combine the two tasks, blood vessel segmentation and centerline extraction. We specially design the network and loss function to better discover the topological relationship between these two tasks and realize their complementary features. In summary, the main contributions of this article are as follows:
- We propose a multitask learning network for retinal vessel segmentation and centerline extraction, named MSC-Net. The multitask learning with the dual-branch design can complete two tasks at the same time, and the fusion path can effectively aggregate features.
- We design a channel and atrous spatial fusion block (CAS-FB) to solve the feature calibration and fusion of different tasks in different sizes in the fusion path. The channel attention module can effectively calibrate the features of different tasks, and the spatial attention module can aggregate the features of different scales of blood vessels.
- Unlike the original clDice loss, which is only applied to the optimization of segmentation tasks, we apply clDice to segmentation and centerline extraction at the same time. Therefore, the vessel segmentation and centerline result can be mutually constrained to ensure the consistency of the topology.
2. Materials and Methods
In this section, we explain the materials and introduce the proposed multitask learning network in detail. First, the datasets, namely, DRIVE, STARE, and CHASE, are introduced. Then, the multitask learning network structure of MSC-Net, including the two branches of blood vessel segmentation and centerline extraction, as well as the fusion path, is elaborated. Next, the design of CAS-FB that composes the fusion path is described. Finally, the loss functions for network segmentation, centerline extraction, and the mutual constraint of the two tasks are introduced.
2.1. Materials
Three publicly available, mainstream datasets of retinal images are used to evaluate the properties of the proposed method. The details of these datasets are provided as follows.
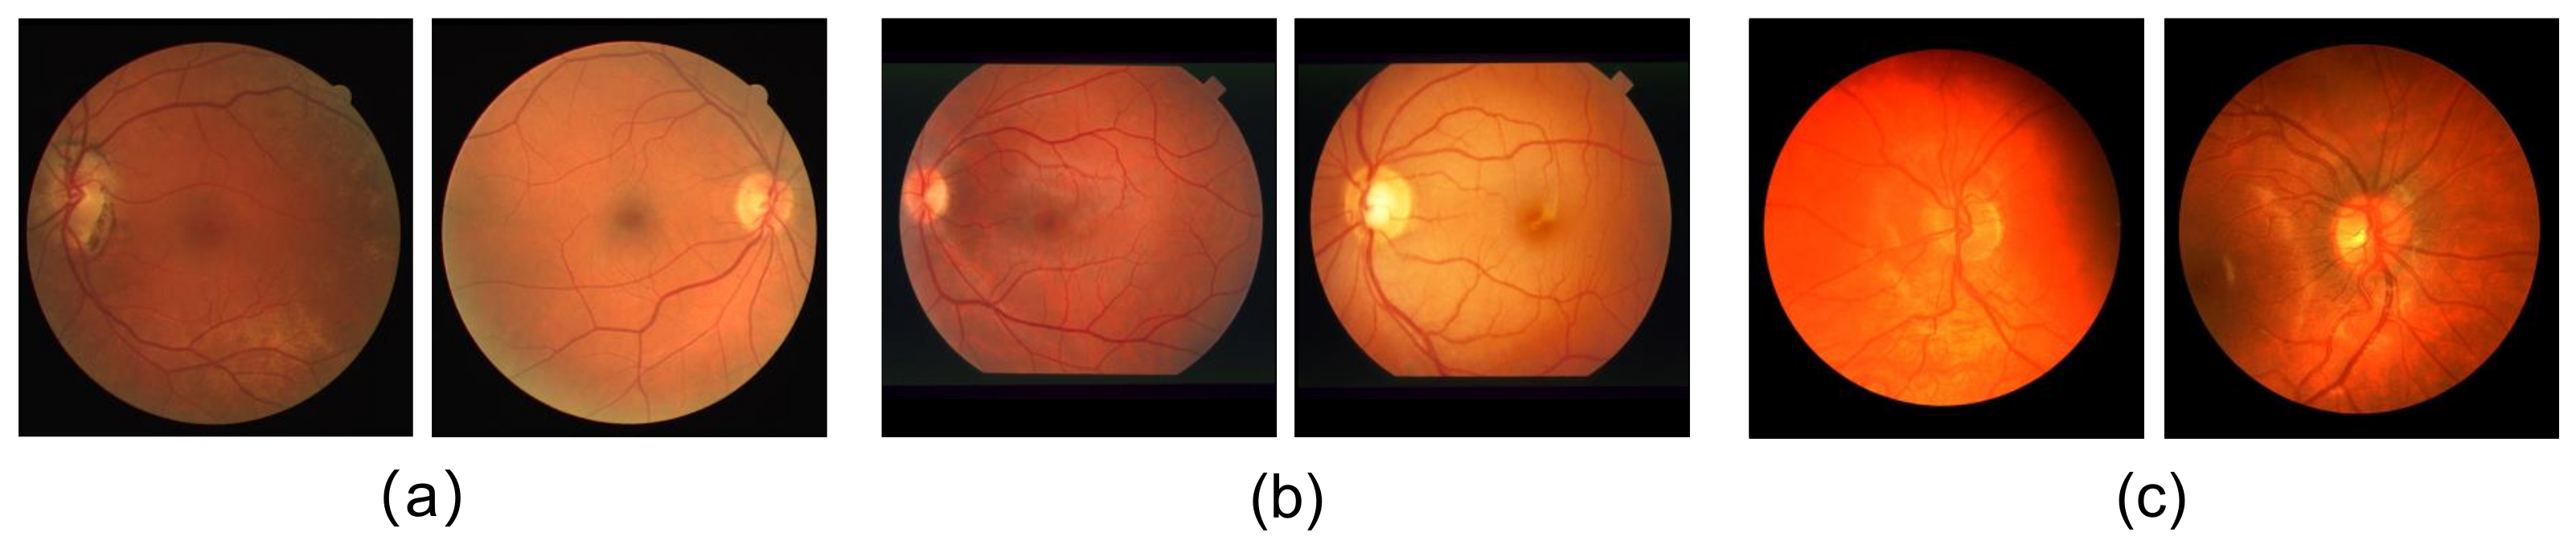
DRIVE dataset [8] includes 40 hand-labeled retinal vessel images with 565 × 584 pixel resolution. The images are equally divided into training and testing datasets. In our training and testing, we follow the same image division. Figure 1a shows two of the images in the DRIVE dataset.

Figure 1.
Examples of some images in the three datasets; (a) is the DRIVE dataset, (b) is the STARE dataset, and (c) is the CHASE dataset.
STARE dataset [32] consists of 20 images, which are digitalized to 700 × 605 pixels. Figure 1b shows images in the STARE dataset. The training and test images are not clearly defined in the STARE dataset; therefore, k-fold (k = 4) cross-validation is used in performance evaluation. Model training is performed four times. Fifteen images are used for training each time, and the remaining five images are used for testing. The average value of the metrics for the four test results are calculated.
CHASE dataset [15] comprises 28 retinal images from 14 different children in the Child Hear and Health Study in England. Each image has a 999 × 960 pixel resolution. Similarly, we also conduct k-fold cross-training and testing on this dataset. As shown in Figure 1c, the images in the CHASE dataset have worse contrast.
Table 1 summarizes the information of the DRVIE, STARE, and CHASE datasets. In addition, we use the skeletonization method mentioned in the literature [28] to skeletonize the blood vessel annotations of the three datasets as the ground truth of the centerline.

Table 1.
An overview of the three public fundus datasets used: total number of images, image resolution (width × height), training and testing split, and whether to perform cross-validation.
2.2. Multitask Learning Network
The proposed multitask learning network, MSC-Net, performs the two tasks of vessel segmentation and centerline extraction. The segmentation task can focus on the overall shape and edge information of the blood vessel. However, the segmentation result usually loses small features because of the imbalance of the scale of the blood vessel. The centerline has uniform voxel points at each scale of the blood vessel; therefore, the centerline extraction branch can avoid the imbalance of the scale and pay more attention to the continuity and topological characteristics of the blood vessel. The overall shape and edge information can constrain the centerline and reduce the influence of noise on the centerline extraction result. The information of continuity and topological structure can repair broken blood vessels and lengthen small blood vessels. Therefore, the information of the two branches in the MSC-Net can be merged and mutually restricted to improve the results of segmentation and centerline extraction.
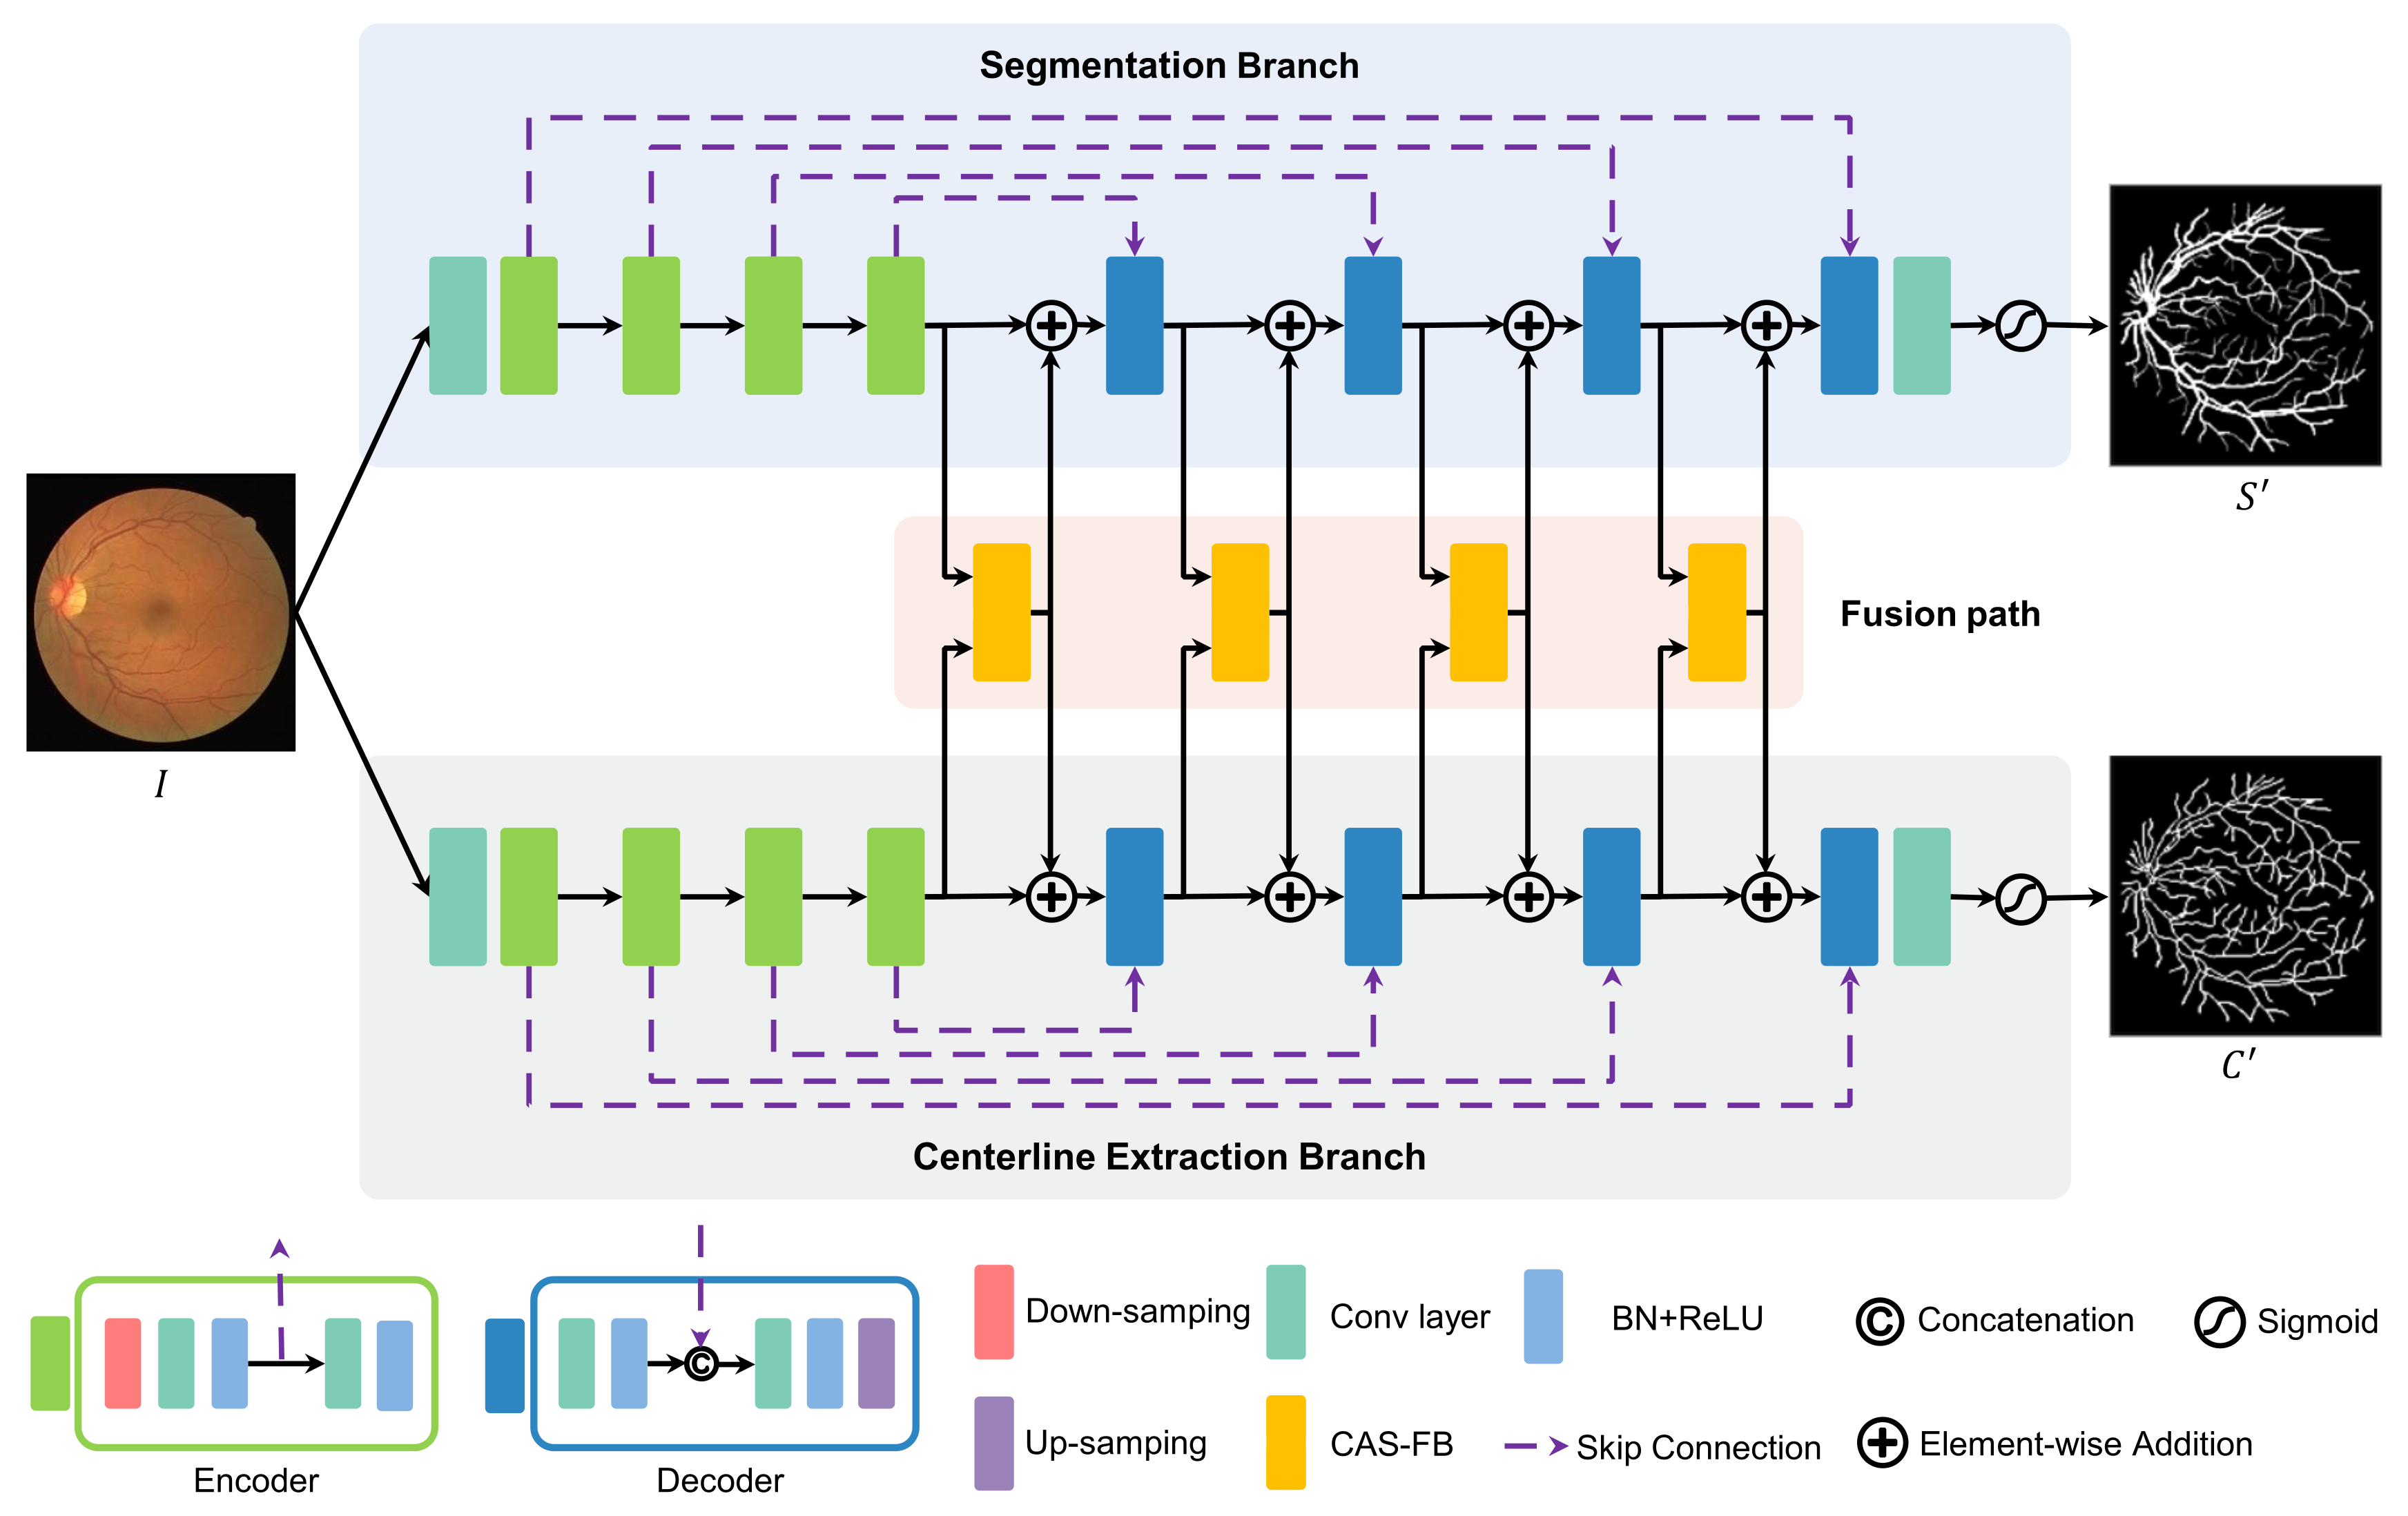
As shown in Figure 2, the proposed multitask learning network, MSC-Net, consists of two branches for vascular segmentation and centerline extraction, respectively, and a feature fusion path. The two branches perform feature extraction and output the prediction results of blood vessel segments and centerline. Similar to U-Net [17], segmentation and centerline extraction branch have a down-sampling path, an up-sampling path, and skip connections. A fusion path is added between the down-sampling paths of the two branches to fuse the features and achieve the mutual constraints of the two tasks.

Figure 2.
The network architecture of MSC-Net consists of a blood vessel segmentation branch, a centerline extraction branch, and a fusion path. The fusion path aggregates the features of the two branches to effectively correct and supplement the features of the two branches.
Take the segmentation branch as an example from Figure 2, and the input I is the retinal image after data processing. First, a feature map is obtained through a 2D convolution and then input into the down-sampling path. The down-sampling path is composed of four encoders for feature extraction. Each encoder includes a down-sampling layer and two layers of convolution, BatchNorm, and rectified linear activation unit (Conv+BN+ReLU). Considering the low-level and different scale image features, MSC-Net uses skip connections to input the features after the first Conv+BN+ReLU layer of each encoder into the upper-level up-sampling path. The input of each encoder is the output of the previous module. In the up-sampling path of the segmentation branch, feature restoration and up-sampling are carried out through four decoders. A decode block is composed of two groups of Conv+BN+ReLU layers and one up-sampling layer. In each decoder, skip connection is used to concatenate the feature map output by the first Conv+BN+ReLU layer, and the features obtained from the down-sampling path are concatenated and input to the next Conv+BN+ReLU layer. The input of each decoder is the output from CAS-FB (see Section 2.3 for details). After passing the up-sampling path, the feature map size is restored to the same size as the original image. Finally, a convolutional layer and a sigmoid activation layer are used to predict the probability of the vessel segmentation result .
The centerline extraction branch has the same structure as the blood vessel segmentation branch. The blood vessel segmentation and centerline extraction branches perform the blood vessel segmentation and centerline extraction tasks, respectively. The features of the up-sampling paths on the two branches are input to the fusion path formed by the CAS-FB cascade to complement the features of the two tasks. After the prediction result of the vessel segmentation and centerline extraction are obtained, the loss function calculation is performed with the ground truth (S and C), and the two results are mutually restricted through the clDice loss function (see Section 2.4 for details) to suppress the fracture and erroneous results.
2.3. Channel and Atrous Spatial Fusion Block
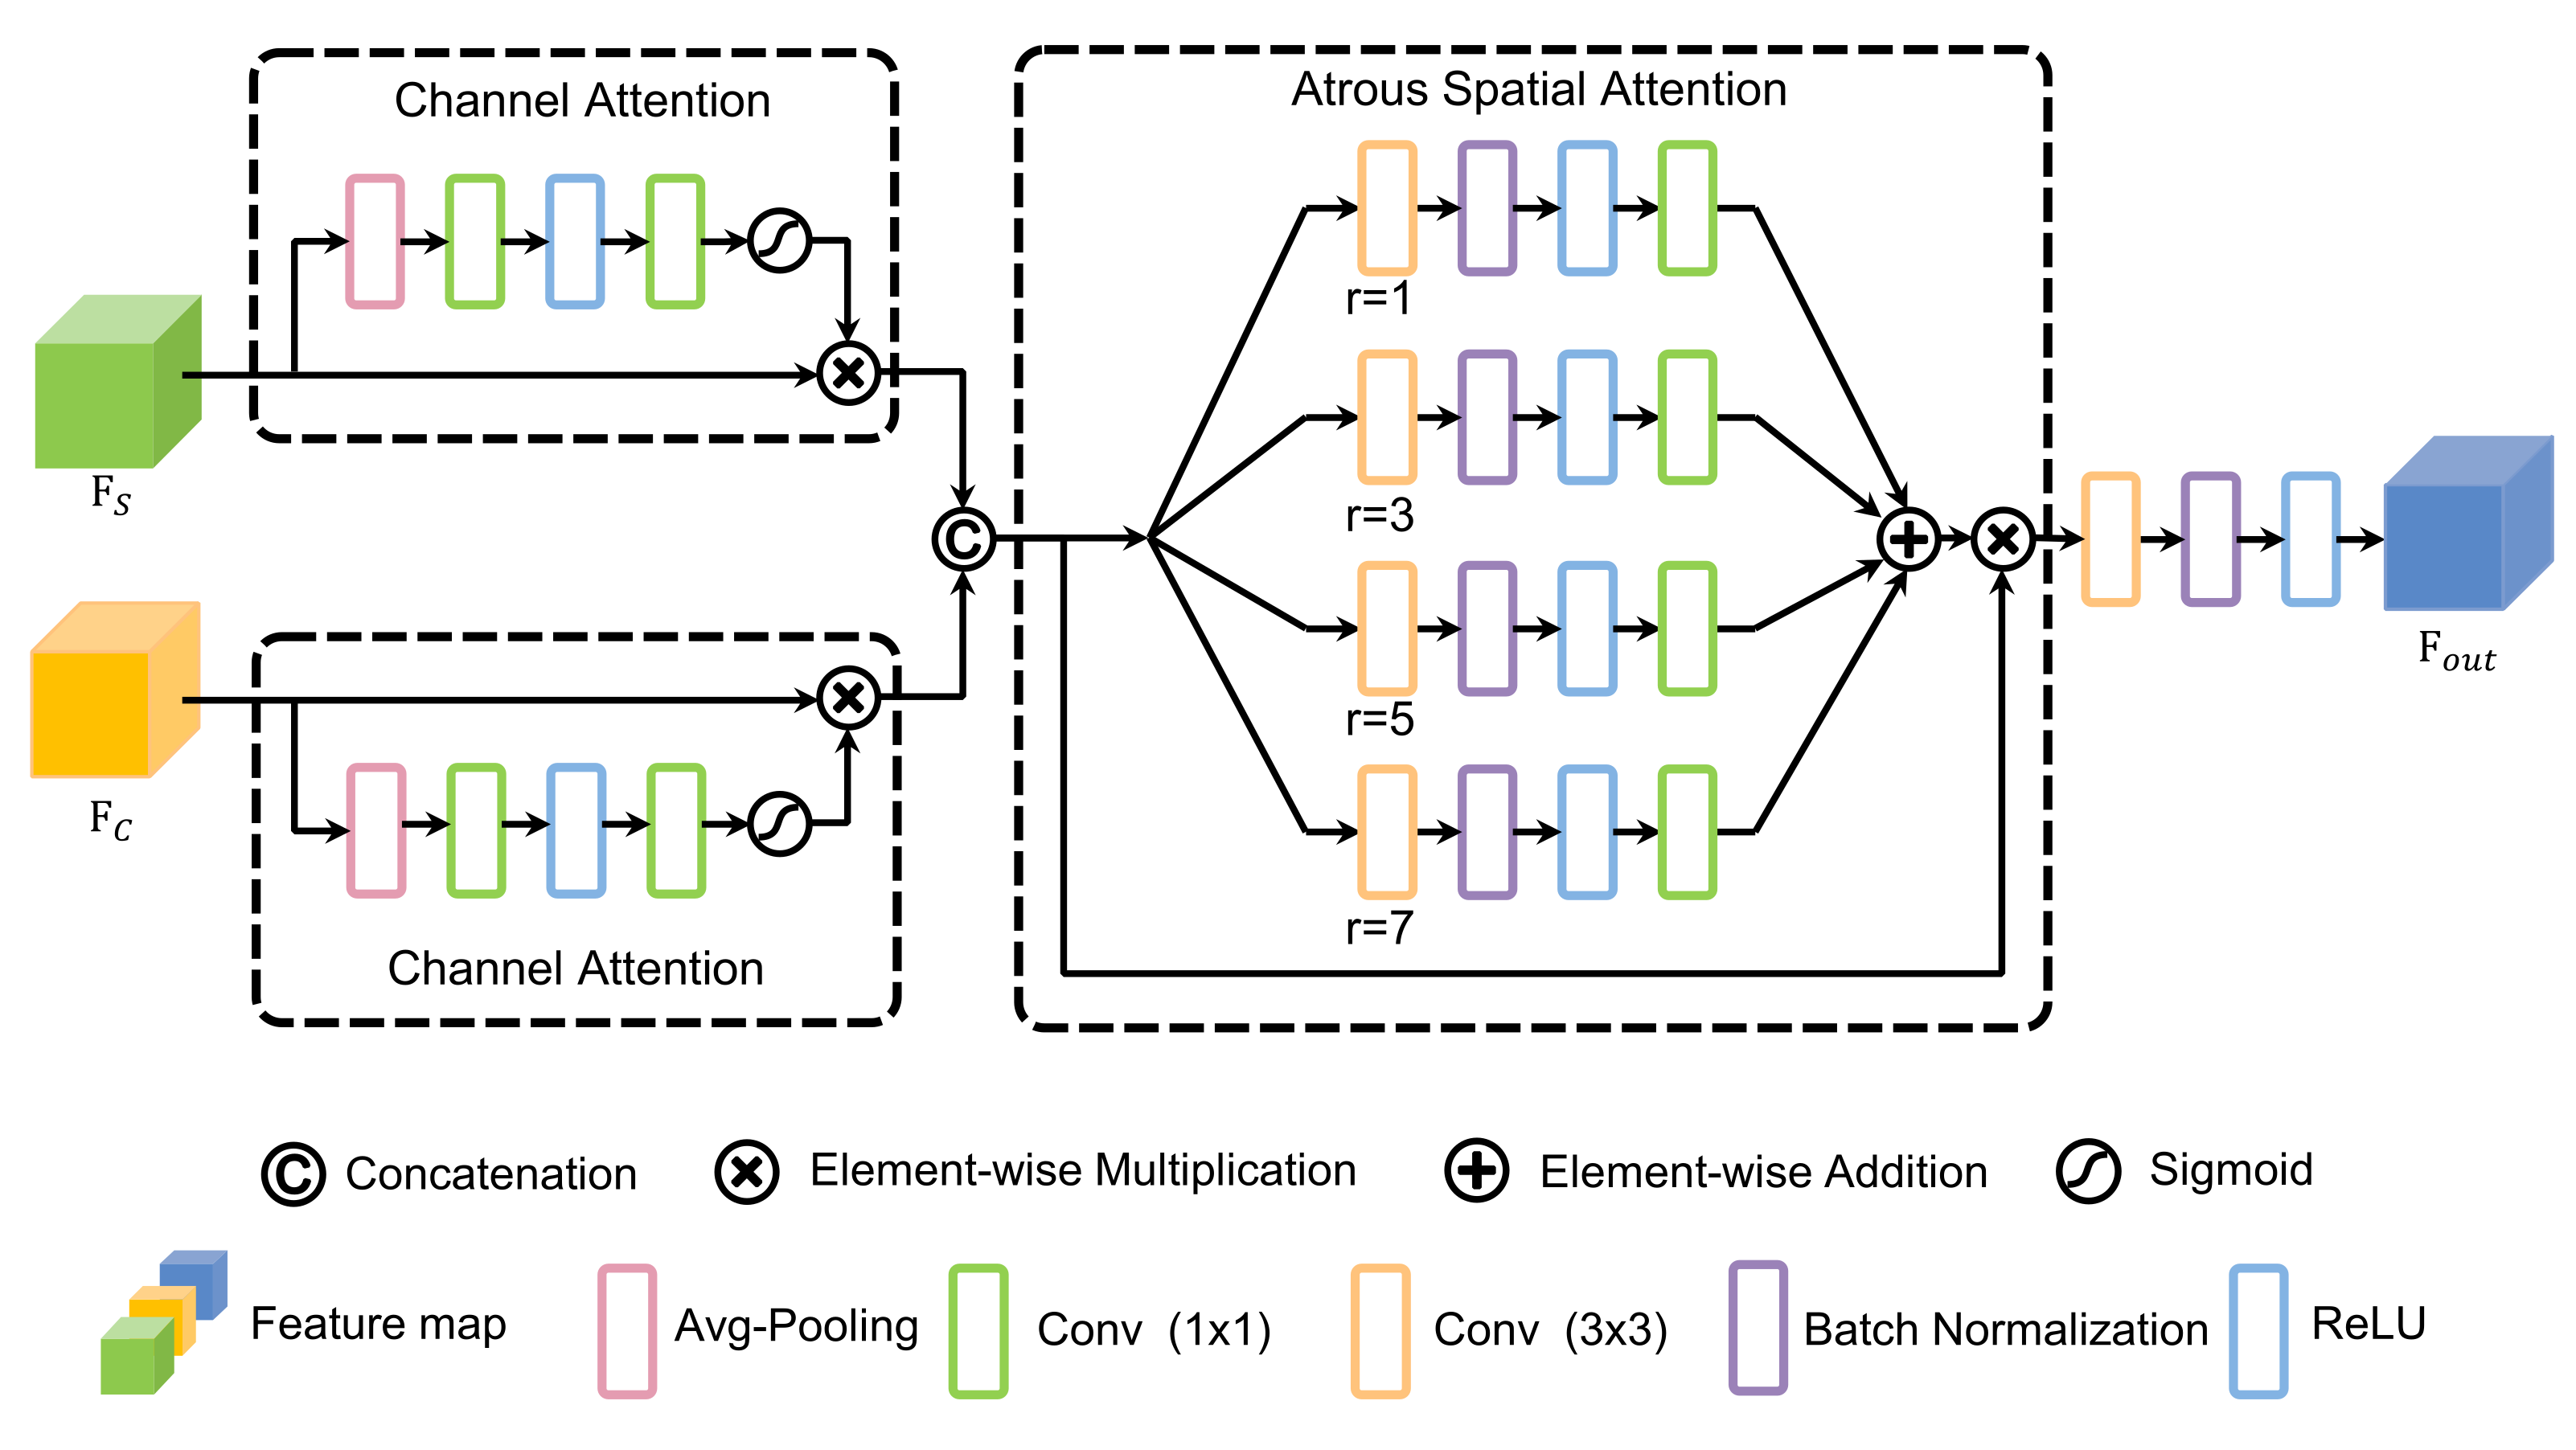
Inspired by [33,34], CAS-FB is designed to fuse and calibrate the features from the two branches, enhance the useful features for segmentation and centerline extraction, and suppress noise. As shown in Figure 3, CAS-FB includes a dual-channel attention module [35] and an atrous spatial attention module, which can realize attention to the channel and the spatial context of different scales, and the fused feature map is obtained by convolution and ReLU.

Figure 3.
The design of the channel and atrous spatial fusion block (CAS-FB). The dual-channel attention modules correct the features of different tasks, and the atrous spatial attention module can aggregate the blood vessel features of different scales.
Assume that we have two feature maps, and , from two branches as input to CAS-FB. and are first input to the dual-channel attention modules to achieve the adaptive correction of features. The channel of interest can be emphasized, and useless channel features can be suppressed through channel attention. The outputs of the dual-channel attention modules are
where and are the output feature maps of the dual-channel attention modules, and are the channel-wise attention weights, and ⊗ is the element-wise multiplication, while refers to a convolutional layer with a kernel size of , and and is a ReLU layer and Sigmoid activation, respectively. Then, concatenate and , and the result is
With reference to the design of the ASPP [36] module, we design the spatial attention module using atrous convolution with different dilation factors. This atrous spatial design enables CAS-FB to pay more attention to the morphological characteristics of retinal blood vessels at different scales (from thick to thin) in the spatial context. The output of the atrous spatial module is as follows:
where is the output feature map of the atrous spatial module, is the element-wise spatial weight, is defined as the atrous convolution with an expansion rate of r and a kernel size of , and refers to a BN layer. Finally, the output of CAS-FB is
2.4. Loss Function
Our network implements two tasks: segmentation and centerline extraction. We use dice loss as the loss function for the prediction results of the branch of the vessel segmentation. Dice loss is calculated as:
where S is the ground truth of vessels, and is the prediction result of the vessel segmentation.
We regard the task of centerline extraction as the classification of each pixel of the image. The categories of centerline voxels and background are not balanced; hence, we calculate the focal loss for the prediction results of the centerline extraction branch as follows:
where indicates a pixel in the ground truth of centerline C, is the predicted probability of a pixel in the prediction result of centerline , N is the number of pixels in an image, and is a parameter that balances the weight of the positive and negative categories.
We use the clDice loss function to constrain the blood vessel segmentation and centerline extraction results and ensure the continuity of the segmentation and centerline extraction. The clDice [30] loss function is calculated as:
where is used to measure topology precision, and is the topology sensitivity (recall). is defined as the harmonic mean of both measures to maximize accuracy (ACC) and sensitivity (SE). The loss function proposed by MSC-Net is
where , , and are hyper-parameters that balances different loss orders.
3. Results
In this section, we will introduce the evaluation metrics, implementation details, and experimental results. The performance of the proposed MSC-Net on vessel segmentation and centerline extraction is verified by comparing the numerical and visual results of MSC-Net with those of other methods.
3.1. Evaluation Metrics
Accuracy (ACC), sensitivity (SE), and specificity (SP) are calculated using Equations (15)–(17), respectively, to quantitatively evaluate the proposed method:
where , , , and denote true positive, false negative, true negative, and false positive, respectively. In addition, the area under the ROC curve (AUC) is calculated, as it is an important evaluation metric that reflects the trade-off between SE and SP, thereby more reliably assessing the quality of our results.
3.2. Implementation Details
Our software is developed and implemented on a computer equipped with an Intel Core i7 CPU and NVIDIA GeForce RTX-2080Ti 11 GB GPU, and the operating system is Ubuntu 16.04. We use Python 3.6 for programming, and Pytorch 1.2 to implement the deep learning framework.
In the preprocessing stage, the green channel of each color fundus image is extracted, and histogram equalization and standardization techniques are implemented. MSC-Net training and testing are performed on the three datasets. Before inputting to the network, the image sizes in the three datasets of DRIVE, STARE, and CHASE are resized to 572 × 572, 624 × 624, and 960 × 960, respectively. In the training process, random cropping and contrast enhancement are used for data augmentation. In the training stage, the batchsize, learning rate, epoch, and other parameter values are shown in Table 2.
Table 2.
This table describes the detailed setting values of different parameters during implementation. The is the parameter in (see Equation (10)), and , , and are hyper-parameters in (see Equation (14)). The settings of batchsize, learning rate, and epoch during training stage are also shown in the table.
3.3. Results
The vessel segmentation results of MSC-Net and five state-of-the-art methods on three retinal datasets are compared to evaluate the effectiveness of MSC-Net. The methods for comparison, including traditional segmentation methods, are based on matched filters, namely Combination of Shifted Filter Responses (B-COSFIRE) [6] and Weighted Symmetry Filter (WSF) [7], as well as deep learning methods, namely U-Net [17], R2U-net [18], and CS-Net [20]. Table 3 shows the vessel segmentation metrics of different methods on the DRIVE, STARE, and CHASE databases. The results of B-COSFIRE and WSF are quoted from their papers.
Table 3.
SE, SP, ACC, and AUC scores of MSC-Net and other baseline methods for vessel segmentation task on the test set.
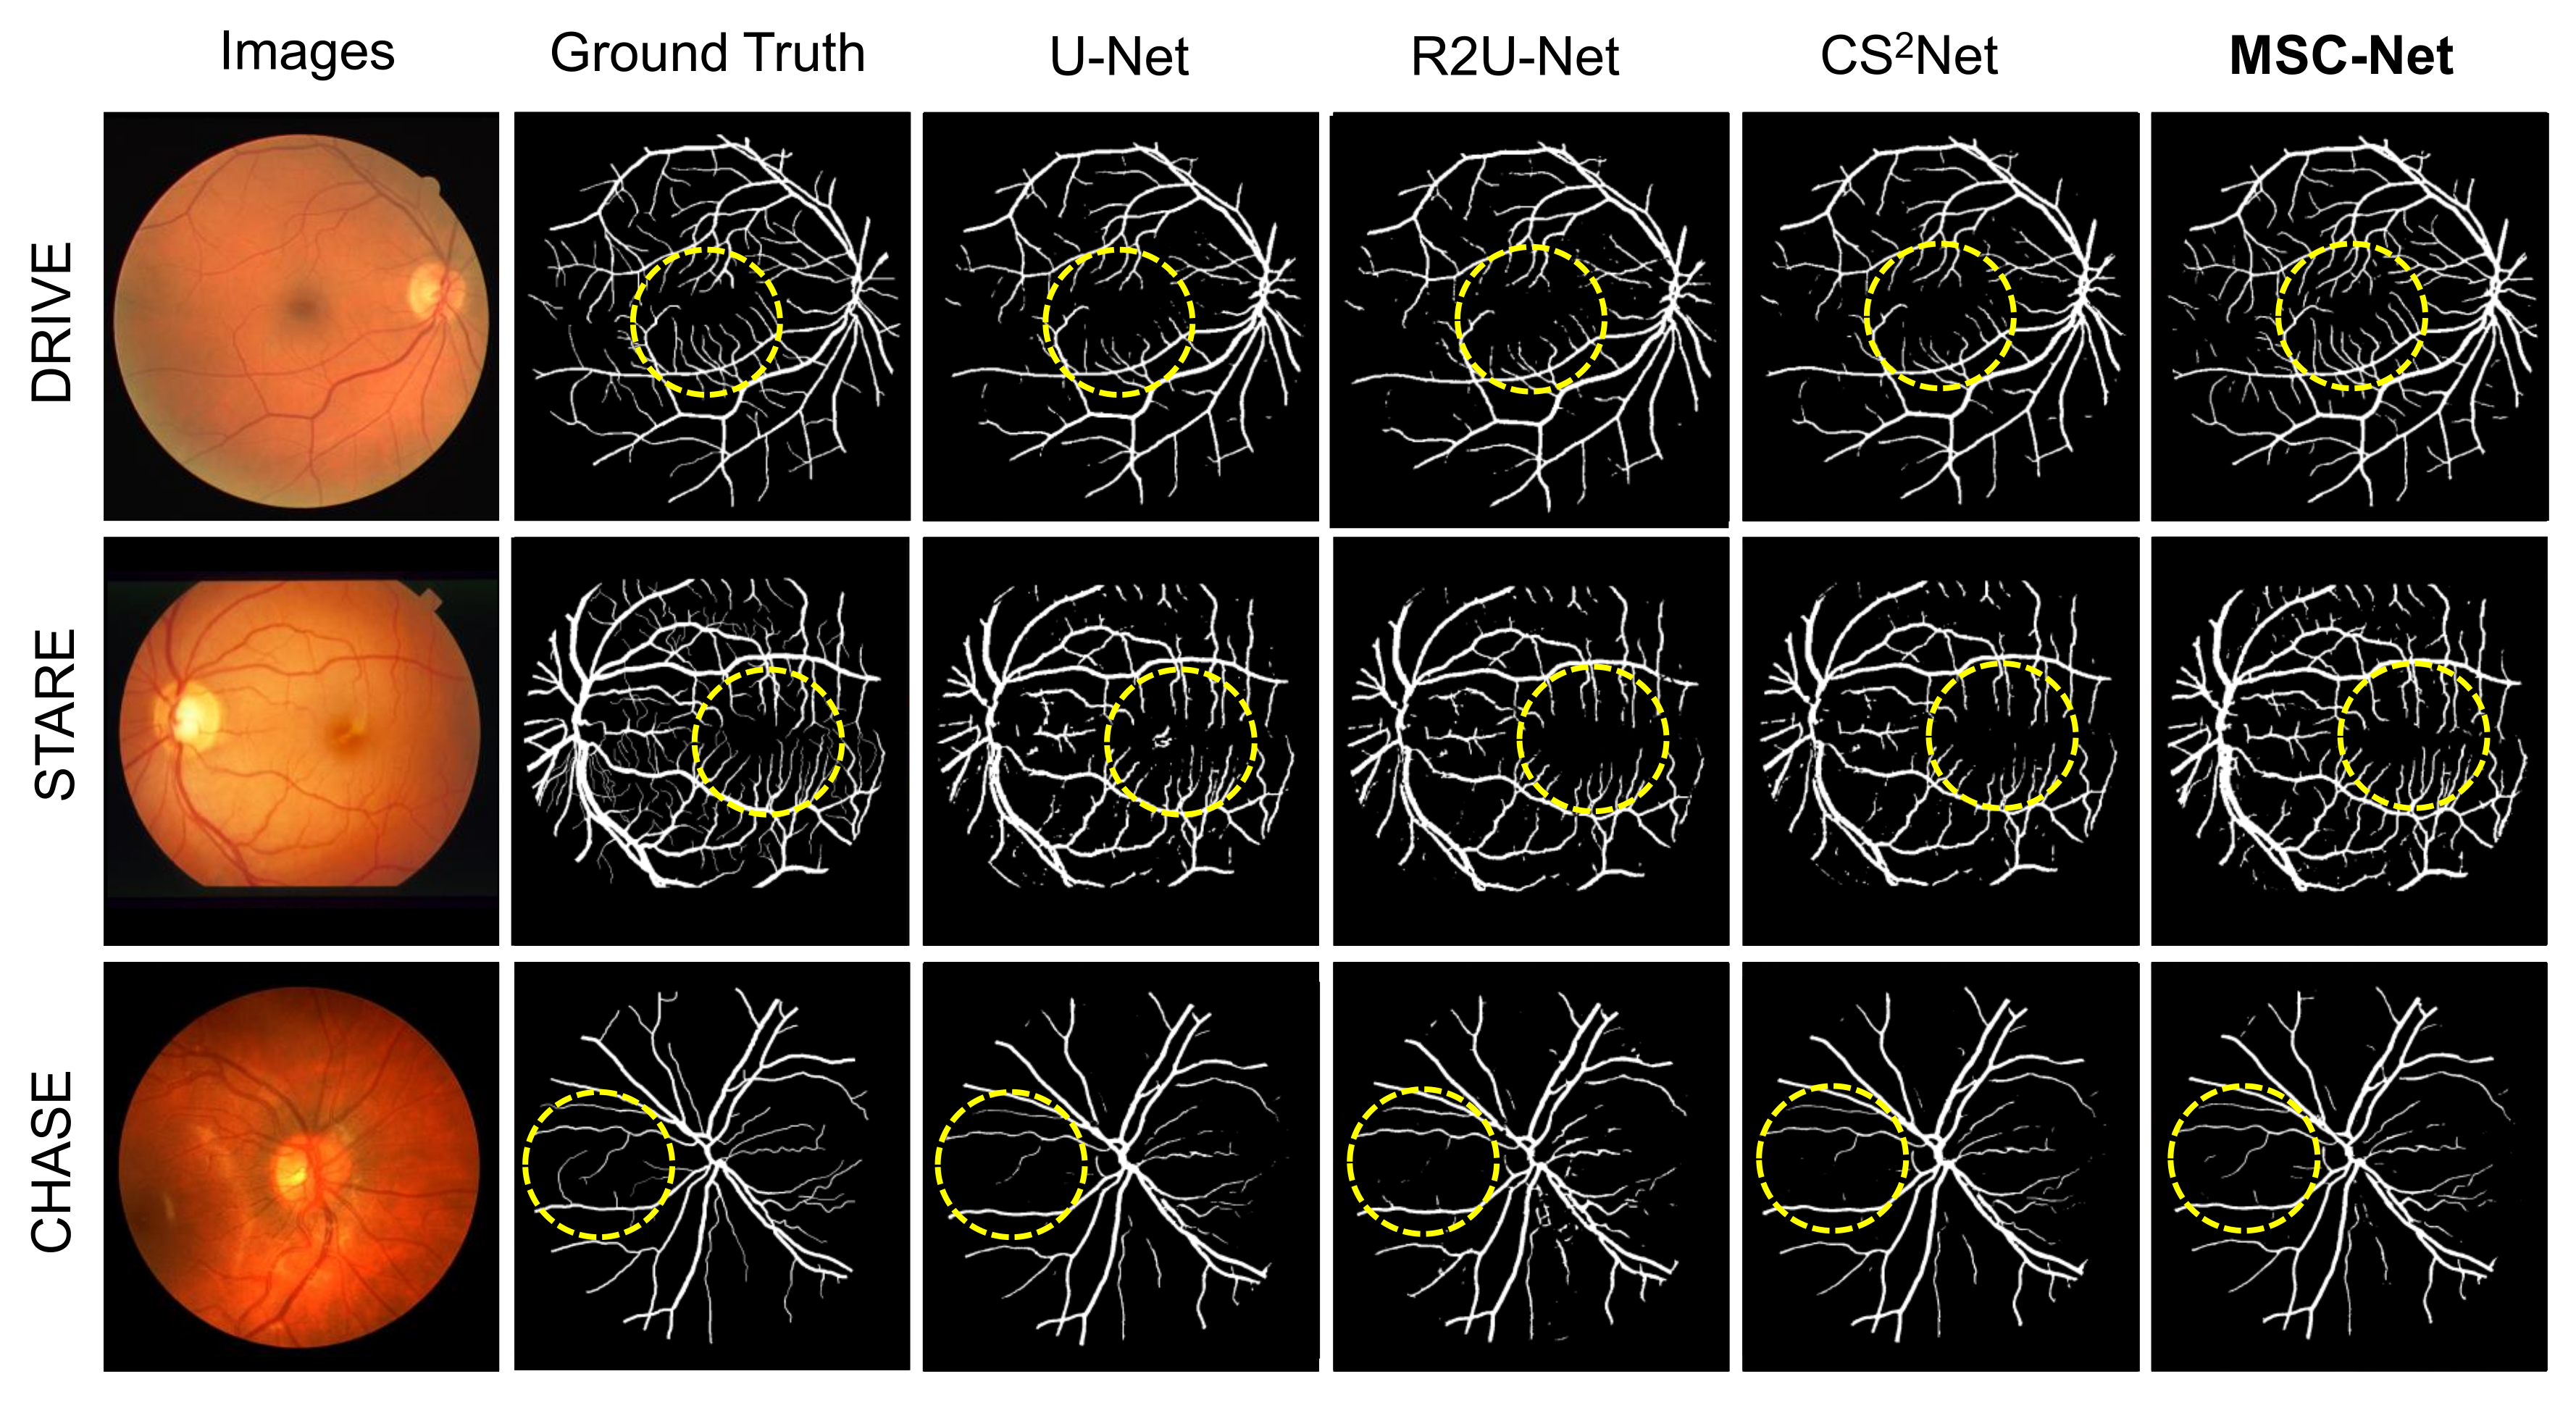
Based on Table 3, our proposed MSC-Net outperform COSFIRE, WSF, U-Net, and R2U-Net in terms of ACC and AUC scores, and also has competitive SE and SP scores. In addition, Figure 4 shows the visualization results of different methods. Image instances are randomly selected in the three datasets. Figure 4 shows the retinal image, ground truth, and segmentation results of various methods for each image instance. The displayed segmentation results include U-Net, R2U-Net, CS-Net, and our proposed MSC-Net. Figure 4 shows that our method has better continuity and fewer branch breaks compared with other methods. MSC-Net also obtains segmentation results that are closer to the ground truth in some details because of poor contrast or noise.

Figure 4.
Visualization results of different blood vessel segmentation methods. The segmentation contained in the yellow dashed circle is our concern. Our method has better results in small parts.
We also compare the centerline results with other methods on the three retinal fundus datasets. The comparison methods include skeletonization (Skeleton) [28] and U-Net [17]. The skeletonization method directly generates the centerline from the segmentation result of MSC-Net. The processing method is the same as the method used to generate the centerline label from the ground truth of the vessel. Table 4 shows the centerline scores of different methods. The scores of different methods in Table 4 prove that our method has the best performance in various indicators.
Table 4.
SE, SP, ACC, and AUC scores of MSC-Net and other methods for centerline extraction on the test set.
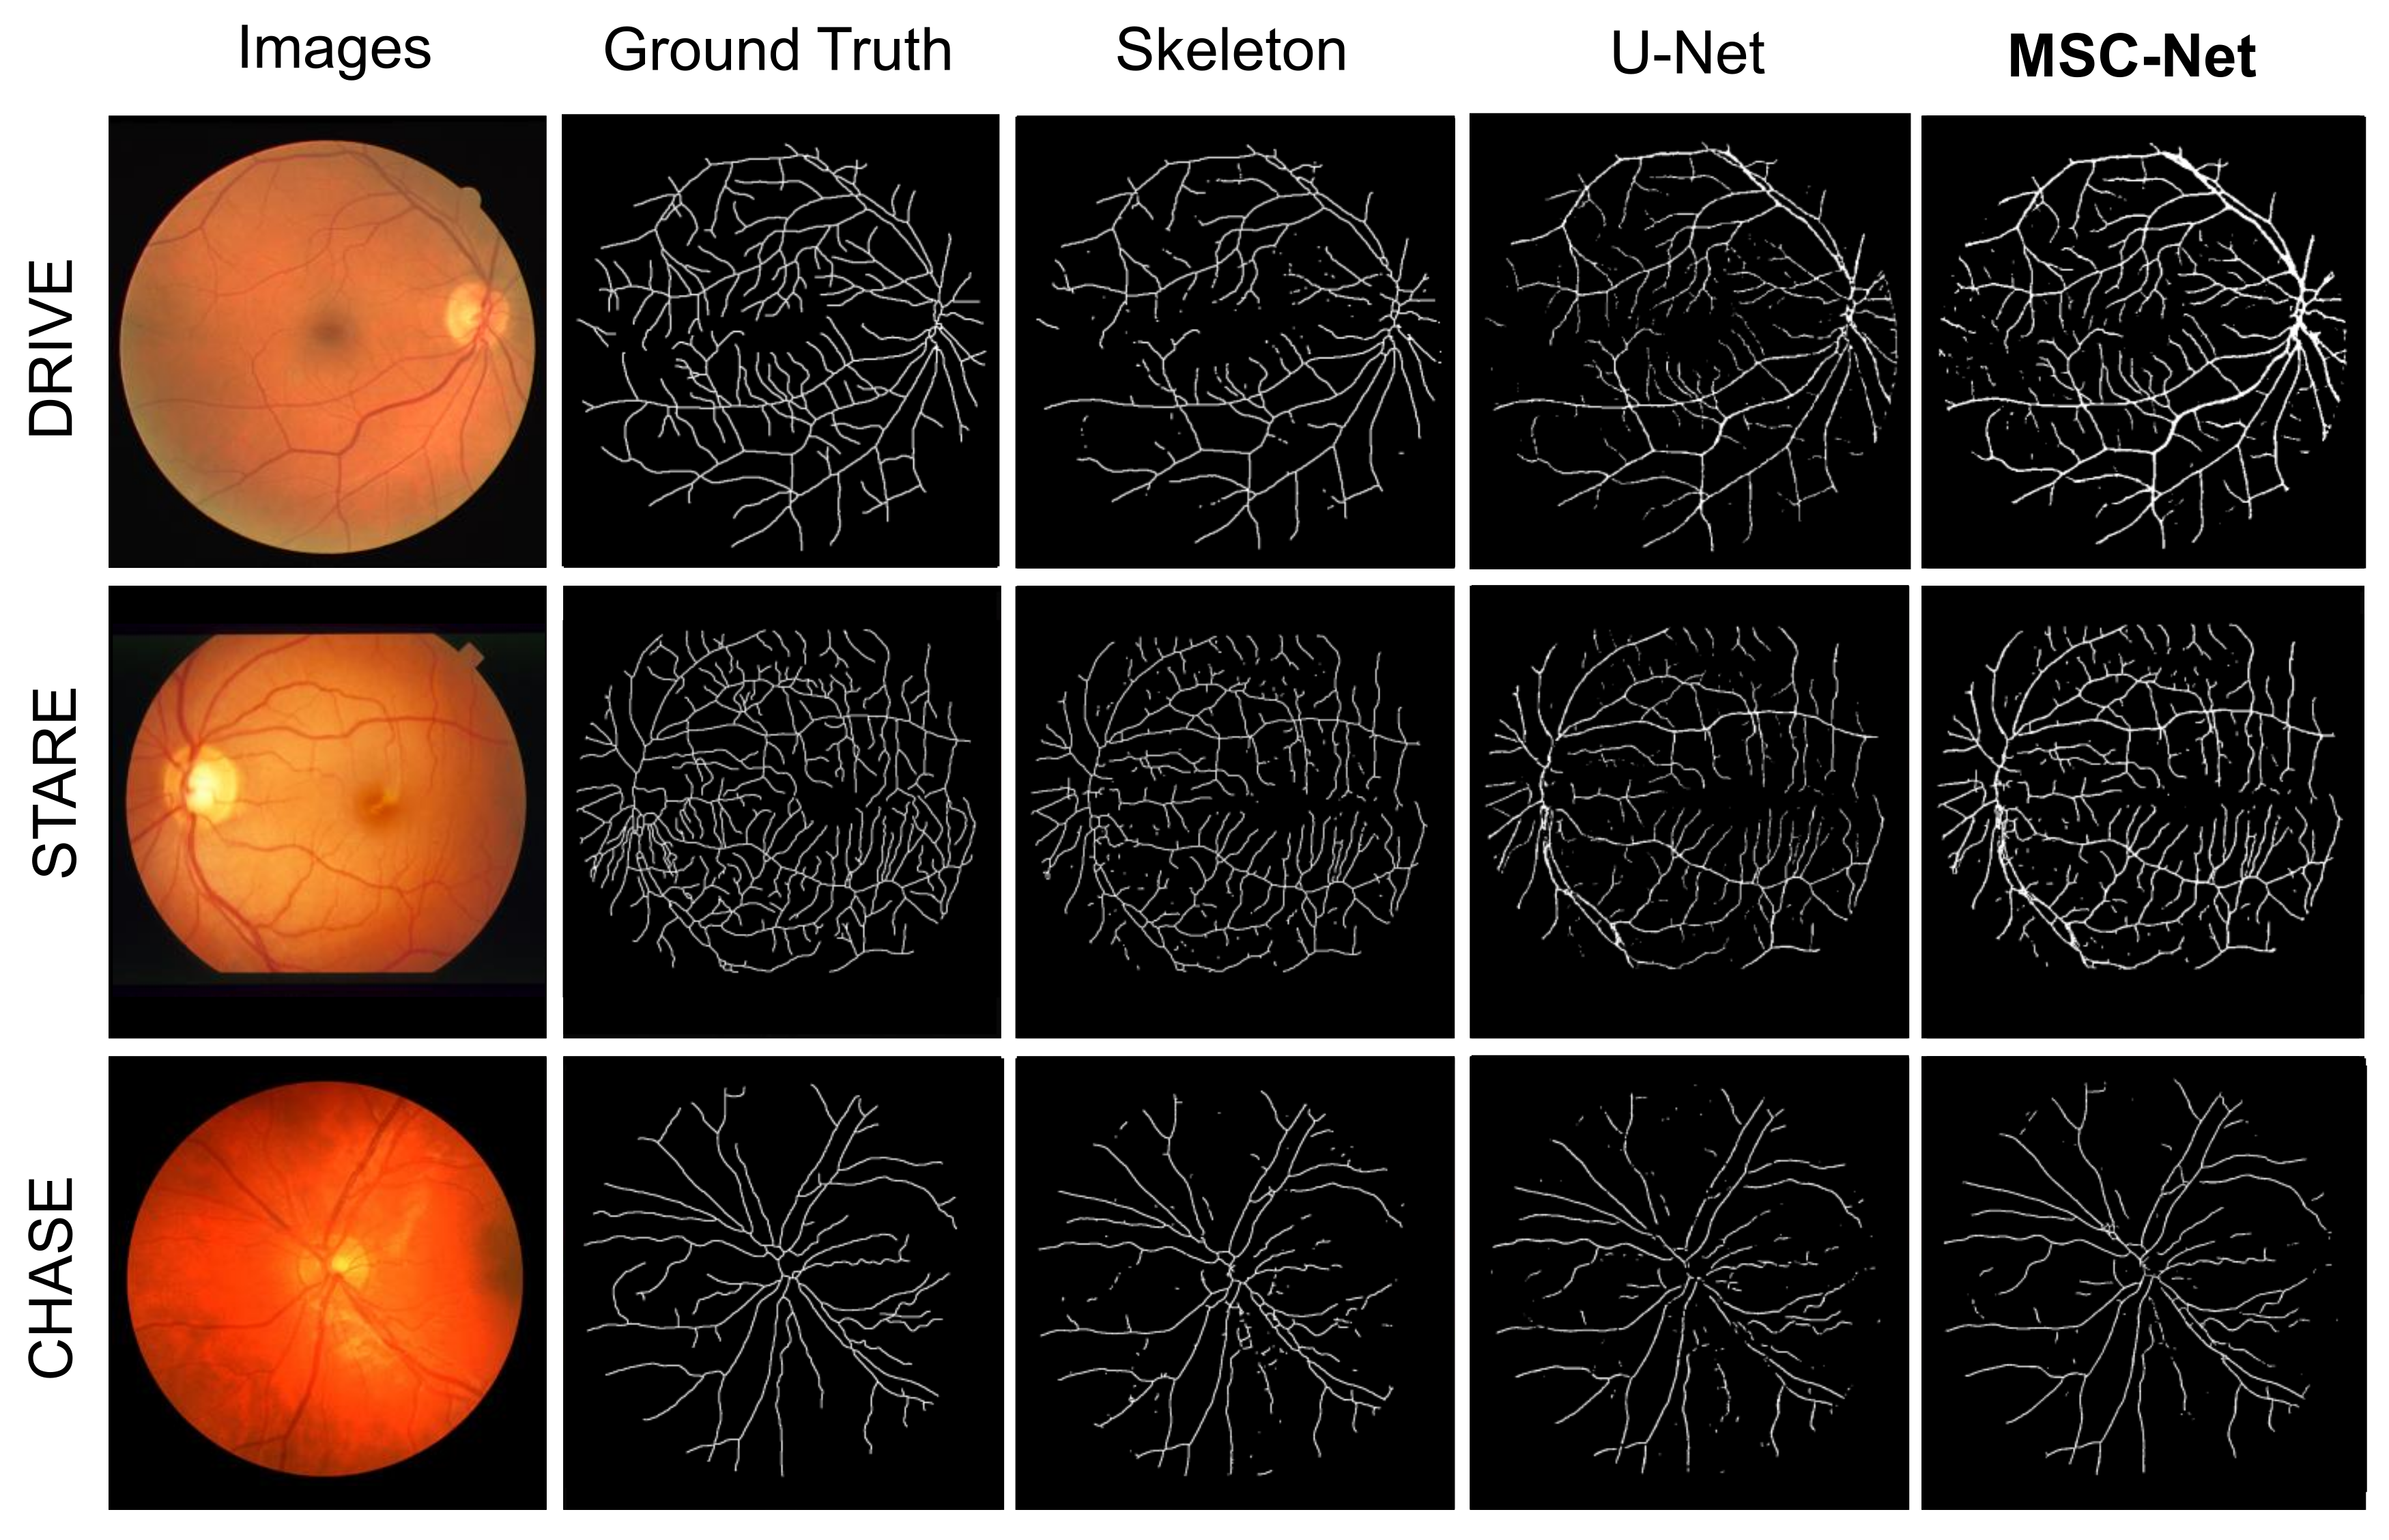
In addition, Figure 5 shows the visualization results of the centerlines. Figure 5 shows the fundus image, ground truth, and centerline results of various methods for each image instance. The displayed results include those of Skeleton, U-Net, and our proposed MSC-Net. Figure 5 shows that our method obtains centerline results with better topological continuity and fracture situation than other methods.

Figure 5.
Visualization results of different centerline extraction methods. The centerline extracted by our method will have better continuity.
4. Discussion
MSC-Net is designed from the following aspects to achieve accurate retinal vessel segmentation and centerline extraction at the same time. (1) The tasks of blood vessel segmentation and centerline extraction are related to each other; thus, blood vessels can limit the region of the centerline, and the centerline can supplement the small parts of the blood vessels. Therefore, a multitask learning framework is proposed, which can simultaneously perform retinal vessel segmentation and centerline extraction. (2) CAS-FB is designed for feature fusion and calibration. Channel attention can perform feature correction between different tasks, and the feature fusion block of multiscale spatial attention can effectively fuse the features of different sizes of blood vessels. (3) The framework is trained with clDice loss function, which can achieve mutual constraint on the segmentation and centerline extraction results to ensure topological consistency.
The indicators of different ablation methods are further calculated on three fundus datasets (DRIVE, STARE, and CHASE), to prove the effectiveness of these three designs (Table 5 and Table 6). The specific methods are as follows:
Table 5.
Ablation experiments of the influence of different modules on vessel segmentation.
Table 6.
Ablation experiments of the effects of different modules on centerline extraction.
- S-Branch/C-Branch: The segmentation (S)/centerline (C) branch in MSC-Net is trained separately. This method is equivalent to performing only one task to achieve blood vessel segmentation or centerline extraction.
- MSC-Net ( CAS-FB): The CAS-FB module in MSC-Net is replaced with a fusion block. The fusion block only concatenates the features of the two branches and uses a convolutional layer, BN, and ReLU layer for feature fusion.
- MSC-Net ( clDice): When training MSC-Net, the clDice loss function is not added to the loss function (equivalent to the = 0 in Equation (14)).
- MSC-Net: The result of training on our proposed MSC-Net.
Table 5 and Table 6 compare the S-Branch/C-Branch and the other methods using multitask learning. The results showed that the use of multitask methods can achieve better performance in blood vessel segmentation and centerline extraction. Compared with MSC-Net ( CAS-FB), MSC-Net with CAS-FB for feature fusion has the best performance in all indicators. This finding proves that the use of channel and multiscale spatial attention is very effective for feature fusion and is more suitable for a target with large changes in feature morphology, such as blood vessels. Compared with the result of MSC-Net ( clDice), the use of clDice loss function improved the performance of MSC-Net.
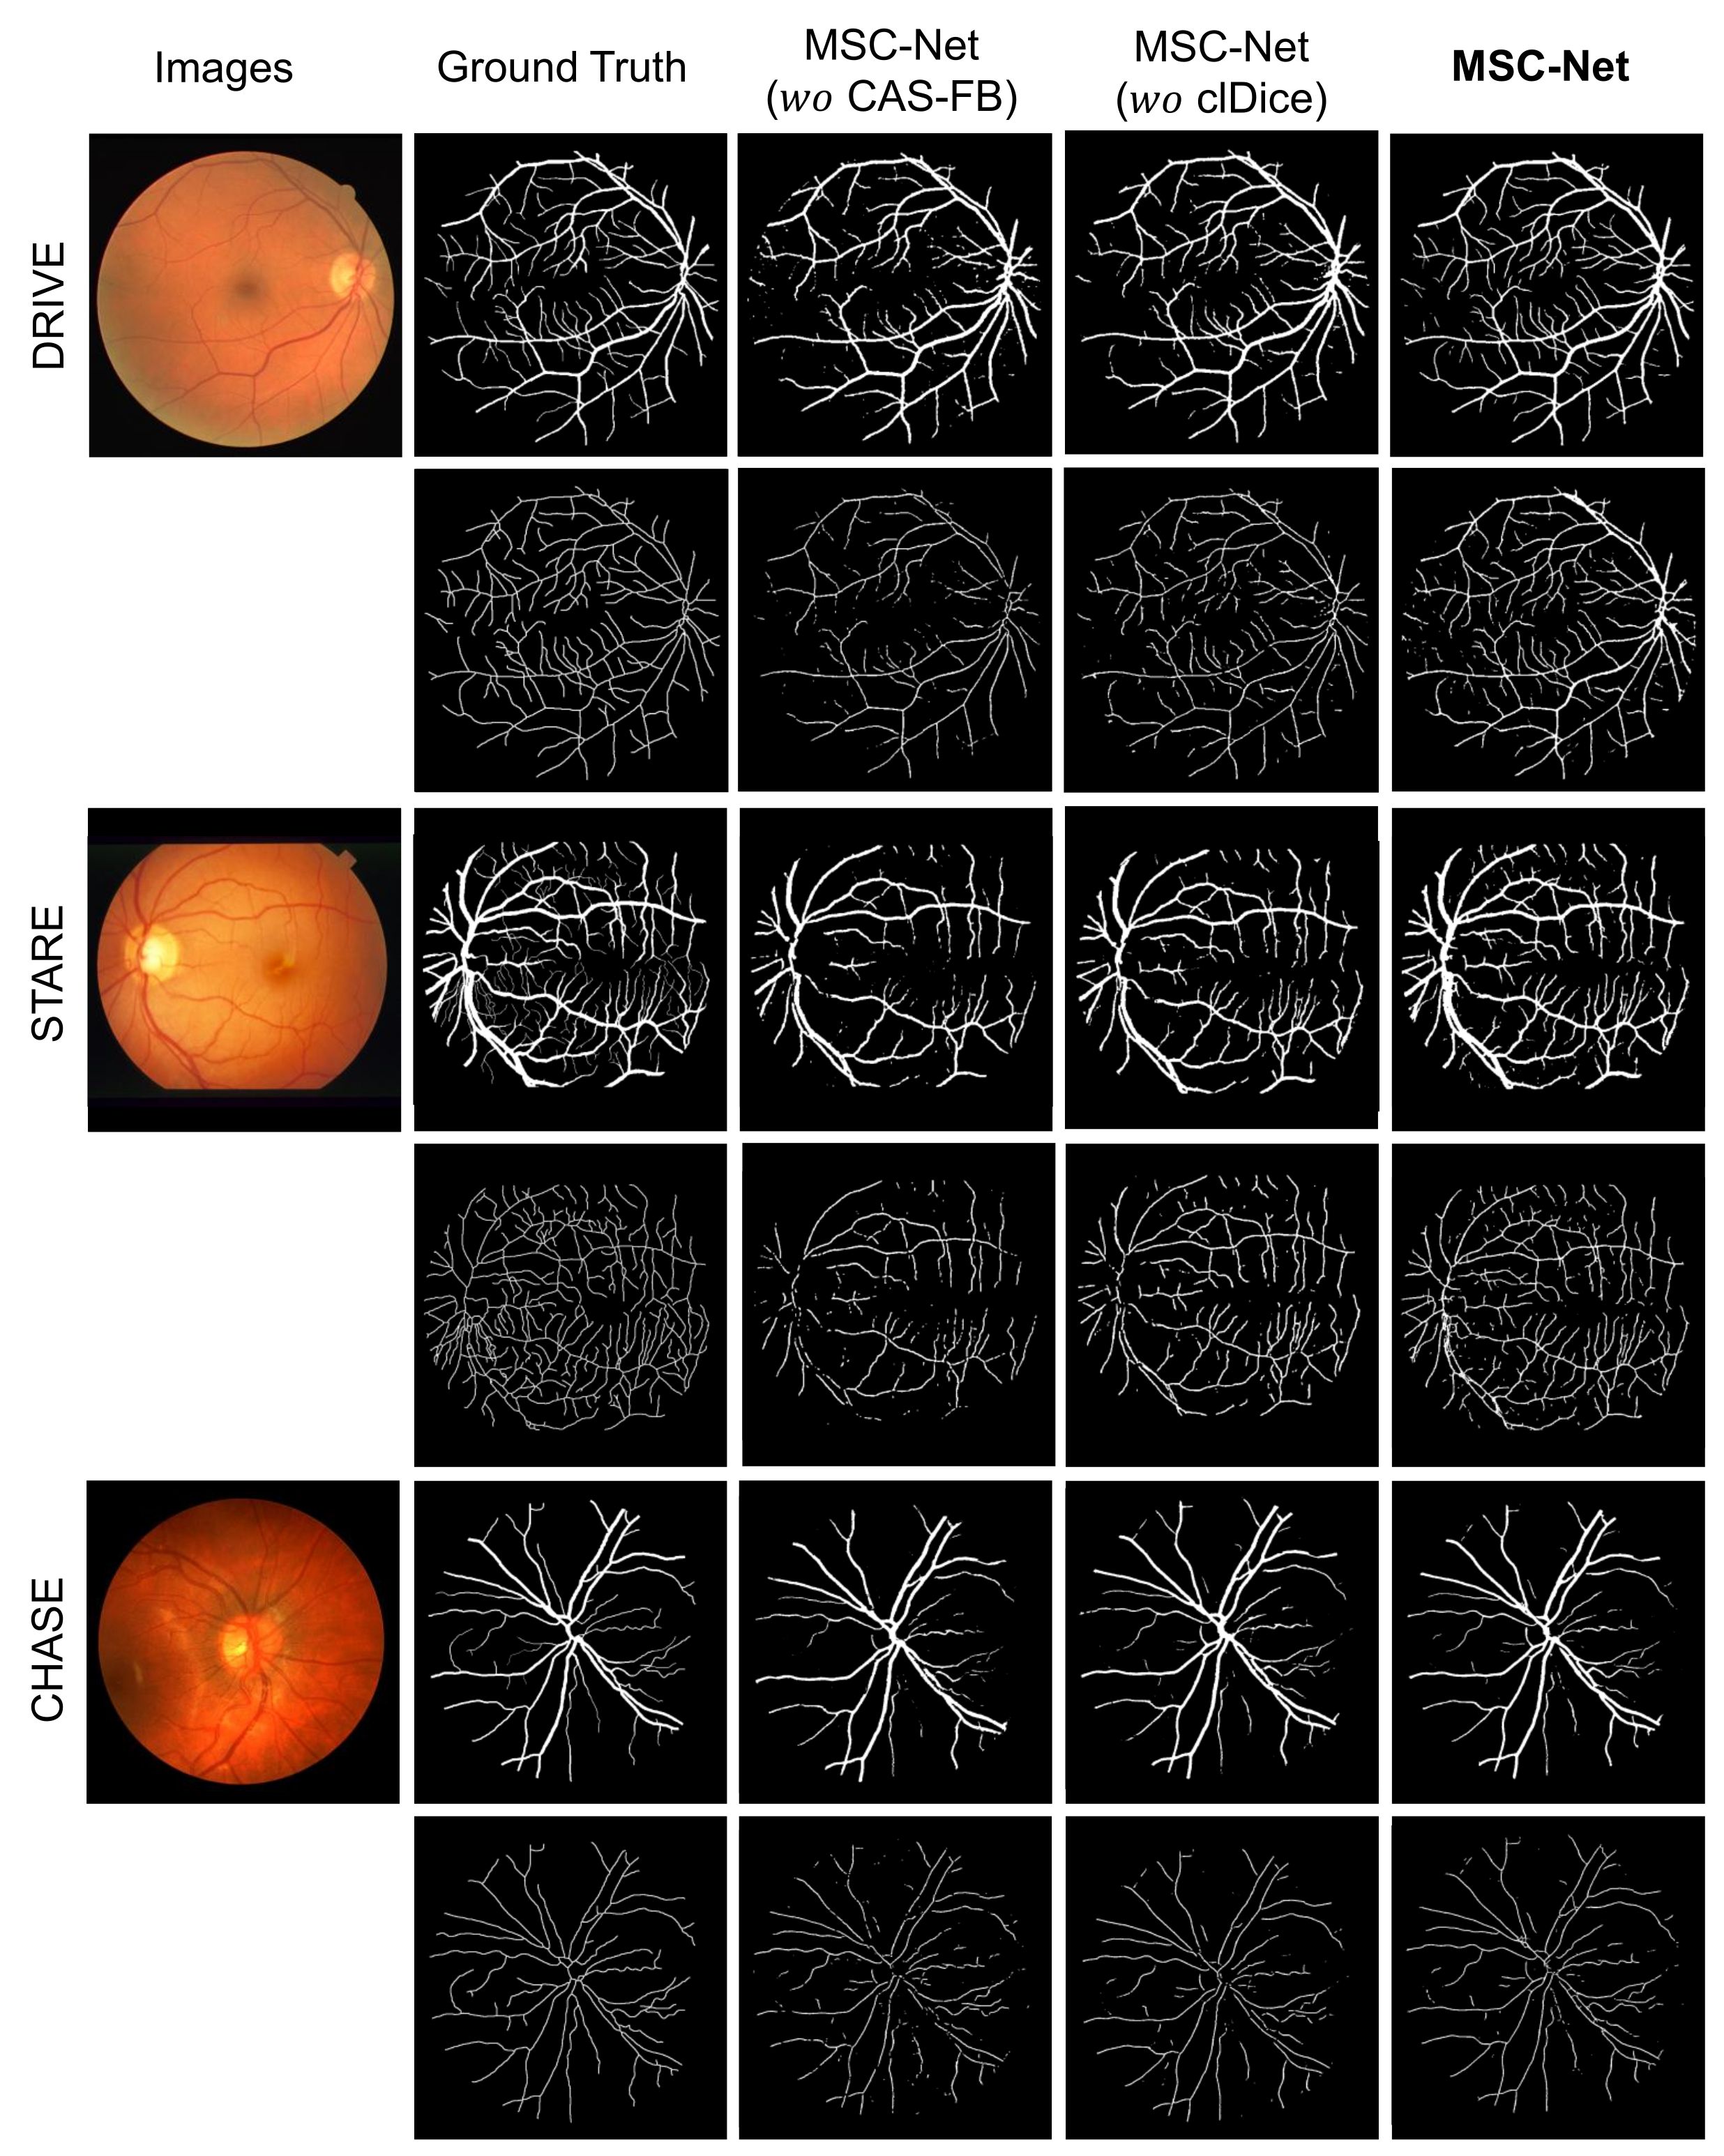
Figure 6 shows the visualization results of the influence of CAS-FB and clDice on the topological continuity of blood vessel segmentation and centerline extraction. The figure shows that MSC-Net with CAS-FB and clDice has better topological continuity and less interruption than MSC-Net ( CAS-FB) and MSC-Net ( clDice) in predicting vessel segmentation and centerline extraction.

Figure 6.
Visualization results after ablation of different modules. The first line of each case is the retinal image and vessel segmentation result, and the second line is the centerline result. The figure shows that the complete MSC-Net has better visualization results.
In short, MSC-Net combines blood vessel segmentation and centerline extraction by using a multitask learning method, which can achieve better results than a single task. The feature fusion path composed of channels and spatial attention modules can solve the calibration and fusion of multitask and multiscale features. Using clDice loss function to constrain blood vessels and centerlines can effectively improve the accuracy of blood vessel segmentation and centerline extraction and ensure that the results are more in line with ground truth and topological consistency.
To further explore the influence of different modules on the number of parameters and the speed of inference, we have counted the number of parameters of different methods and calculated the average inference time required for each image. It can be seen from Table 7 that the design of multitask learning and CAS-FB will increase the number of parameters and inference time, thereby increasing the space and time complexity. It can also be seen from Table 7 that since the loss function is not calculated during the inference process, the use of clDice loss training does not affect the parameter number and inference time of the model (the subtle differences in the Table 7 are due to different experiments). Images of different sizes will also affect the network inference time: images with larger resolutions require more inference time. From the results of the inference time, it can be seen that MSC-Net has certain real-time performance and can be used for disease diagnosis, screening, treatment, and evaluation.
Table 7.
The parameters and reasoning time when ablating different modules of the network.
5. Conclusions
In this paper, we propose a new multitask learning network, MSC-Net, to simultaneously accomplish retinal vessel segmentation and centerline extraction. We design a channel multiscale spatial attention fusion module, CAS-FB, which is used to fuse and correct the features of different tasks and different scales. In addition, we use the clDice loss function to perform constraints between different tasks and improve the topological continuity of the results of blood vessel segmentation and centerline extraction. Comparison with other methods on three retinal datasets (DRIVE, STARE, and CHASE) and the ablation of each module prove the superiority and effectiveness of our proposed method. In the future, our work will focus on how to reduce the amount of network parameters and calculations and extend the proposed method to other 3D medical imaging datasets.
Author Contributions
Conceptualization, L.P. and L.H.; methodology, Z.Z. and S.Z.; software, Z.Z.; validation, Z.Z. and S.Z.; formal analysis, S.Z.; investigation, L.P.; resources, S.Z. and L.H.; data curation, S.Z. and L.H.; writing—original draft preparation, L.P. and Z.Z.; writing—review and editing, L.P., Z.Z., S.Z., and L.H.; visualization, L.P.; supervision, S.Z. and L.H.; project administration, S.Z. and L.H.; funding acquisition, S.Z. and L.H. All authors have read and agreed to the published version of the manuscript.
Funding
This research was funded by the Fujian Provincial Natural Science Foundation project (2021J02019, 2021J01578, 2019Y9070), and Fuzhou Science and Technology Project (2020-GX-17).
Institutional Review Board Statement
Not applicable.
Informed Consent Statement
Not applicable.
Data Availability Statement
DRIVE dataset can be found at https://drive.grand-challenge.org/ (accessed on 16 November 2021). STARE dataset can be found at https://cecas.clemson.edu/~ahoover/stare/ (accessed on 16 November 2021). CHASE dataset can be found at https://blogs.kingston.ac.uk/retinal/chasedb1/ (accessed on 16 November 2021).
Conflicts of Interest
The authors declare no conflict of interest.
References
- Annunziata, R.; Kheirkhah, A.; Aggarwal, S.; Hamrah, P.; Trucco, E. A fully automated tortuosity quantification system with application to corneal nerve fibres in confocal microscopy images. Med. Image Anal. 2016, 32, 216–232. [Google Scholar] [CrossRef] [PubMed] [Green Version]
- Franklin, S.W.; Rajan, S.E. Computerized screening of diabetic retinopathy employing blood vessel segmentation in retinal images. Biocybern. Biomed. Eng. 2014, 34, 117–124. [Google Scholar] [CrossRef]
- Ikram, M.K.; Ong, Y.T.; Cheung, C.Y.; Wong, T.Y. Retinal vascular caliber measurements: Clinical significance, current knowledge and future perspectives. Ophthalmologica 2013, 229, 125–136. [Google Scholar] [CrossRef] [PubMed]
- Lee, S.J.; McCarty, C.A.; Taylor, H.R.; Keeffe, J.E. Costs of mobile screening for diabetic retinopathy: A practical framework for rural populations. Aust. J. Rural Health 2001, 9, 186–192. [Google Scholar] [CrossRef]
- Kromm, C.; Rohr, K. Inception capsule network for retinal blood vessel segmentation and centerline extraction. In Proceedings of the 2020 IEEE 17th International Symposium on Biomedical Imaging (ISBI), Iowa City, IA, USA, 3–7 April 2020; pp. 1223–1226. [Google Scholar]
- Azzopardi, G.; Strisciuglio, N.; Vento, M.; Petkov, N. Trainable COSFIRE filters for vessel delineation with application to retinal images. Med. Image Anal. 2015, 19, 46–57. [Google Scholar] [CrossRef] [Green Version]
- Zhao, Y.; Zheng, Y.; Liu, Y.; Zhao, Y.; Luo, L.; Yang, S.; Na, T.; Wang, Y.; Liu, J. Automatic 2-D/3-D vessel enhancement in multiple modality images using a weighted symmetry filter. IEEE Trans. Med. Imaging 2017, 37, 438–450. [Google Scholar] [CrossRef] [Green Version]
- Niemeijer, M.; Staal, J.; van Ginneken, B.; Loog, M.; Abramoff, M.D. Comparative study of retinal vessel segmentation methods on a new publicly available database. In Proceedings of the Medical Imaging 2004: Image Processing, San Diego, CA, USA, 14–19 February 2004; Volume 5370, pp. 648–656. [Google Scholar]
- Saha Tchinda, B.; Tchiotsop, D.; Tchinda, R.; Kenne, G. Automated extraction of the intestinal parasite in the microscopic images using active contours and the Hough transform. Curr. Med. Imaging 2015, 11, 233–246. [Google Scholar] [CrossRef]
- Zhao, Y.; Rada, L.; Chen, K.; Harding, S.P.; Zheng, Y. Automated vessel segmentation using infinite perimeter active contour model with hybrid region information with application to retinal images. IEEE Trans. Med. Imaging 2015, 34, 1797–1807. [Google Scholar] [CrossRef] [Green Version]
- Dai, P.; Luo, H.; Sheng, H.; Zhao, Y.; Li, L.; Wu, J.; Zhao, Y.; Suzuki, K. A new approach to segment both main and peripheral retinal vessels based on gray-voting and gaussian mixture model. PLoS ONE 2015, 10, e0127748. [Google Scholar]
- Dey, N.; Roy, A.B.; Pal, M.; Das, A. FCM based blood vessel segmentation method for retinal images. arXiv 2012, arXiv:1209.1181. [Google Scholar]
- Saffarzadeh, V.M.; Osareh, A.; Shadgar, B. Vessel segmentation in retinal images using multi-scale line operator and K-means clustering. J. Med. Signals Sens. 2014, 4, 122. [Google Scholar] [CrossRef]
- Orlando, J.I.; Prokofyeva, E.; Blaschko, M.B. A discriminatively trained fully connected conditional random field model for blood vessel segmentation in fundus images. IEEE Trans. Biomed. Eng. 2016, 64, 16–27. [Google Scholar] [CrossRef] [PubMed] [Green Version]
- Fraz, M.M.; Remagnino, P.; Hoppe, A.; Uyyanonvara, B.; Rudnicka, A.R.; Owen, C.G.; Barman, S.A. An ensemble classification-based approach applied to retinal blood vessel segmentation. IEEE Trans. Biomed. Eng. 2012, 59, 2538–2548. [Google Scholar] [CrossRef] [PubMed]
- Akbar, S.; Sharif, M.; Akram, M.U.; Saba, T.; Mahmood, T.; Kolivand, M. Automated techniques for blood vessels segmentation through fundus retinal images: A review. Microsc. Res. Tech. 2019, 82, 153–170. [Google Scholar] [CrossRef]
- Ronneberger, O.; Fischer, P.; Brox, T. U-net: Convolutional networks for biomedical image segmentation. In Proceedings of the International Conference on Medical Image Computing and Computer-Assisted Intervention, Munich, Germany, 5–9 October 2015; pp. 234–241. [Google Scholar]
- Alom, M.Z.; Yakopcic, C.; Hasan, M.; Taha, T.M.; Asari, V.K. Recurrent residual U-Net for medical image segmentation. J. Med. Imaging 2019, 6, 014006. [Google Scholar] [CrossRef]
- Guo, C.; Szemenyei, M.; Yi, Y.; Wang, W.; Chen, B.; Fan, C. Sa-unet: Spatial attention u-net for retinal vessel segmentation. In Proceedings of the 2020 25th International Conference on Pattern Recognition (ICPR), Milan, Italy, 10–15 January 2021; pp. 1236–1242. [Google Scholar]
- Mou, L.; Zhao, Y.; Fu, H.; Liu, Y.; Cheng, J.; Zheng, Y.; Su, P.; Yang, J.; Chen, L.; Frangi, A.F.; et al. CS2-Net: Deep learning segmentation of curvilinear structures in medical imaging. Med. Image Anal. 2021, 67, 101874. [Google Scholar] [CrossRef] [PubMed]
- Chen, J.; Fang, Z.; Xiao, D.; Bui, D.T.; Thung, K.H.; Li, X.; Yang, J.; Lin, W.; Li, G.; Shen, D.; et al. CNS: CycleGAN-Assisted Neonatal Segmentation Model for Cross-Datasets. In Proceedings of the International Workshop on Graph Learning in Medical Imaging, Shenzhen, China, 17 October 2019; pp. 172–179. [Google Scholar]
- Park, K.B.; Choi, S.H.; Lee, J.Y. M-gan: Retinal blood vessel segmentation by balancing losses through stacked deep fully convolutional networks. IEEE Access 2020, 8, 146308–146322. [Google Scholar] [CrossRef]
- Manzo, M.; Pellino, S. Fighting together against the pandemic: Learning multiple models on tomography images for COVID-19 diagnosis. AI 2021, 2, 261–273. [Google Scholar] [CrossRef]
- Jiang, Z.; Zhang, H.; Wang, Y.; Ko, S.B. Retinal blood vessel segmentation using fully convolutional network with transfer learning. Comput. Med. Imaging Graph. 2018, 68, 1–15. [Google Scholar] [CrossRef]
- Ma, W.; Yu, S.; Ma, K.; Wang, J.; Ding, X.; Zheng, Y. Multi-task neural networks with spatial activation for retinal vessel segmentation and artery/vein classification. In Proceedings of the International Conference on Medical Image Computing and Computer-Assisted Intervention, Shenzhen, China, 13–17 October 2019; pp. 769–778. [Google Scholar]
- Xu, R.; Liu, T.; Ye, X.; Liu, F.; Lin, L.; Li, L.; Tanaka, S.; Chen, Y.W. Joint Extraction of Retinal Vessels and Centerlines Based on Deep Semantics and Multi-Scaled Cross-Task Aggregation. IEEE J. Biomed. Health Inf. 2020, 25, 2722–2732. [Google Scholar] [CrossRef]
- Zhao, F.; Chen, Y.; Hou, Y.; He, X. Segmentation of blood vessels using rule-based and machine-learning-based methods: A review. Multimed. Syst. 2019, 25, 109–118. [Google Scholar] [CrossRef]
- Guedri, H.; Abdallah, M.B.; Nasri, F.; Belmabrouk, H. Computer method for tracking the centerline curve of the human retinal blood vessel. In Proceedings of the 2017 International Conference on Engineering & MIS (ICEMIS), Monastir, Tunisia, 8–10 May 2017; pp. 1–6. [Google Scholar]
- Morales, S.; Naranjo, V.; Angulo, J.; Legaz-Aparicio, A.G.; Verdú-Monedero, R. Retinal network characterization through fundus image processing: Significant point identification on vessel centerline. Signal Process. Image Commun. 2017, 59, 50–64. [Google Scholar] [CrossRef]
- Shit, S.; Paetzold, J.C.; Sekuboyina, A.; Ezhov, I.; Unger, A.; Zhylka, A.; Pluim, J.P.; Bauer, U.; Menze, B.H. clDice-a Novel Topology-Preserving Loss Function for Tubular Structure Segmentation. In Proceedings of the IEEE/CVF Conference on Computer Vision and Pattern Recognition, Nashville, TN, USA, 19–25 June 2021; pp. 16560–16569. [Google Scholar]
- Tetteh, G.; Rempfler, M.; Zimmer, C.; Menze, B.H. Deep-FExt: Deep feature extraction for vessel segmentation and centerline prediction. In Proceedings of the International Workshop on Machine Learning in Medical Imaging, Quebec City, QC, Canada, 10 September 2017; pp. 344–352. [Google Scholar]
- Hoover, A.; Kouznetsova, V.; Goldbaum, M. Locating blood vessels in retinal images by piecewise threshold probing of a matched filter response. IEEE Trans. Med. Imaging 2000, 19, 203–210. [Google Scholar] [CrossRef] [PubMed] [Green Version]
- Zhang, Z.; Liu, C.; Ding, W.; Wang, S.; Pei, C.; Yang, M.; Huang, L. Multi-modality Pathology Segmentation Framework: Application to Cardiac Magnetic Resonance Images. In Proceedings of the Myocardial Pathology Segmentation Combining Multi-Sequence CMR Challenge, Lima, Peru, 4 October 2020; pp. 37–48. [Google Scholar]
- Liu, C.; Ding, W.; Li, L.; Zhang, Z.; Pei, C.; Huang, L.; Zhuang, X. Brain Tumor Segmentation Network Using Attention-based Fusion and Spatial Relationship Constraint. arXiv 2020, arXiv:2010.15647. [Google Scholar]
- Hu, J.; Shen, L.; Sun, G. Squeeze-and-excitation networks. In Proceedings of the IEEE Conference on Computer Vision and Pattern Recognition, Salt Lake City, UT, USA, 18–22 June 2018; pp. 7132–7141. [Google Scholar]
- Chen, L.C.; Papandreou, G.; Kokkinos, I.; Murphy, K.; Yuille, A.L. Deeplab: Semantic image segmentation with deep convolutional nets, atrous convolution, and fully connected crfs. IEEE Trans. Pattern Anal. Mach. Intell. 2017, 40, 834–848. [Google Scholar] [CrossRef]
Publisher’s Note: MDPI stays neutral with regard to jurisdictional claims in published maps and institutional affiliations. |
© 2021 by the authors. Licensee MDPI, Basel, Switzerland. This article is an open access article distributed under the terms and conditions of the Creative Commons Attribution (CC BY) license (https://creativecommons.org/licenses/by/4.0/).