Article

Stable Isotope and Radiocarbon Analysis for Diet, Climate and Mobility Reconstruction in Agras (Early Iron Age) and Edessa (Roman Age), Northern Greece

by
Elissavet Dotsika
1,
Maria Tassi
1,*,
Petros Karalis
1,
Anastasia Chrysostomou
2,
Dimitra Ermioni Michael
1,
Anastasia Elektra Poutouki
1,
Katerina Theodorakopoulou
3 and
Georgios Diamantopoulos
1
1
Stable Isotope Unit, National Centre for Scientific Research (N.C.S.R.) “Demokritos”, Institute of Nanoscience and Nanotechnology, Patriarchou Gregoriou (End) and Neapoleos Street, 15341 Agia Paraskevi, Greece
2
Ministry of Culture, Mpoumpoulinas 20-22 Str, 10682 Athens, Greece
3
Department of Geology and Geoenvironment, National and Kapodistrian University of Athens, 15784 Athens, Greece
*
Author to whom correspondence should be addressed.
Appl. Sci. 2022, 12(1), 498; https://doi.org/10.3390/app12010498
Submission received: 29 November 2021 / Revised: 29 December 2021 / Accepted: 30 December 2021 / Published: 5 January 2022
(This article belongs to the Special Issue Material and Environmental Isotope Geochemistry)

Abstract

:
In this article we present an isotopic analysis of human bone collagen (δ13Ccol, and δ15Ncol) and bone apatite (δ13C) for diet reconstruction, as well as δ18Oap of human bone apatite for climate reconstruction, using samples from Northern Greece. Radiocarbon dating analysis was conducted on three of the Agras samples and the results (from 1000 to 800 BC) correspond to the Early Iron Age. Isotopic values for δ13Ccol range from −20.5‰ to −16‰ and for δ15Ncol from 6‰ to 11.1‰—a strong indication of a C3-based diet, with contributions by C4 and freshwater fish elements. The results were compared to the ones from Roman Edessa, and Alexandreia (a contemporary city near Edessa), as well as to other Early Iron sites in Greece and wider Europe. In general, the results from Agras are in good agreement with the results from Northern Greece, with the exception of the Makriyalos site, and are quite close to those of Croatia’s and Hungary’s sites. Additionally, from the δ18Oap results we calculated the oxygen isotopic composition of consumed water for Agras (from −9.6‰ to −10.9‰) and for Roman Edessa (from −9.6‰ to −11.2‰) for the palaeoclimate and palaeomobility reconstruction.

1. Introduction

Stable isotope methodology has been proven to be a valuable tool for archaeology as it can provide information about the dietary habits of past populations [1,2,3,4,5,6,7,8,9,10,11], as well as climatic conditions [12,13,14,15,16,17] and population mobility [18,19,20,21,22,23,24], and consequently sheds light on history [25]. Specifically, the results of a δ13C isotopic analysis of bone collagen can determine the photosynthetic pathway of plants (C3, C4 or CAM) [26,27,28] that were consumed and their proportion in the diet [8,29], which can be used as an indicator of terrestrial or marine diet [27,30], especially in the absence of C4 plant consumption. C3 plants, such as rice, wheat, barley, trees and fruit, have δ13C values that range between −35‰ and −20‰ [28]. The corresponding values of consumers are about 5‰ higher than in their diet [9]—hence, herbivores that consume only C3 plants have δ13C isotopic values of about −21‰ [31]. C4 plants, such as maize, millet, sugarcane and tropical grasses, have δ13C isotopic values that range from −14‰ to −9‰ [28], while C4 consumers have carbon isotopic values of about −10‰ [32]. Furthermore, the difference between the carbon isotopic values of bone apatite and bone collagen is an indicator of the trophic level [33], and can differentiate the C3 and C4 diets as well as detect contributions of marine input [34].
The δ15N isotopic values relate to the kind of protein that was consumed and, by extension, to the trophic level of one’s diet [35,36], i.e., the δ15N isotopic values of herbivores are ~3‰ higher than that of the plants they consume, and carnivores present ~3‰ higher values than herbivores [9,37]. Furthermore, individuals for whom the majority of dietary protein is of marine origin present nitrogen isotopic values between 12‰ and 22‰, whereas, for individuals primarily consuming terrestrial protein, their nitrogen isotopic values range between 5‰ and 12‰ [38,39]. Thus, the combination of carbon and nitrogen isotopes is a valuable tool for diet identification [7,40,41].
Oxygen isotope analysis in apatite, either from carbonates or phosphates of herbivores and mammals, is used for palaeoclimate reconstruction [42,43,44,45]. The apatite precipitates with body water near equilibrium, so the δ18O isotopic value of apatite is directly related to the isotopic composition of oxygen sources [46], mainly from ingested water (both liquid form and through food consumption [12]), and secondly from atmospheric O2. As water is absorbed by an organism, its oxygen isotope sustains fractionations through metabolism and its isotopic signature relates to the isotopic values of local water and, often, precipitation. The correlation between ingested water and precipitation is that the former is quite similar to the water that is available in an area [46]. Longinelli [12] and Luz et al. [47] were the first to find a linear relationship between human bone apatite and precipitation, while later articles demonstrated a linear relationship between the oxygen isotope of ingested water and apatite/enamel [19,48,49].
The oxygen isotopic values of ingested water are similar to those of the source (such as springs, lakes, rivers, meteoric water [19,50]), the values of which depend on climatic conditions such as temperature and humidity as well as geographical characteristics (such as distance from the sea, latitude and altitude [51,52,53,54]). Oxygen isotopic values of water are more negative in colder climates and higher altitudes and less negative in warmer climates and lower altitudes [51,52,55]. These differences in the oxygen isotopic values of water in different geographical regions enable the reconstruction of past climatic conditions via their identification in human bone apatite.
In this article we performed δ13C and δ15N isotopic analyses of human bone collagen on samples from the Early Iron Age (EIA) (10th−8th century BCE) cemetery of Agras (a town 4 km west of Edessa, Northern Greece) for diet reconstruction and compared the results to isotopic values from Roman Edessa (2nd–4th century CE) [3] and modern Alexandreia (Hmatheia) [2] as well as to other regions of Greece and Europe.
We analyzed the δ18Ow of spring water samples of North Greece in order to identify the relationship with altitude. Furthermore, we conducted a δ18O isotopic analysis of human bone apatite in order to examine the population mobility and identify the climate conditions and their evolution in the EIA in Agras and Roman Edessa. Finally, for three of the samples we performed Radiocarbon dating.

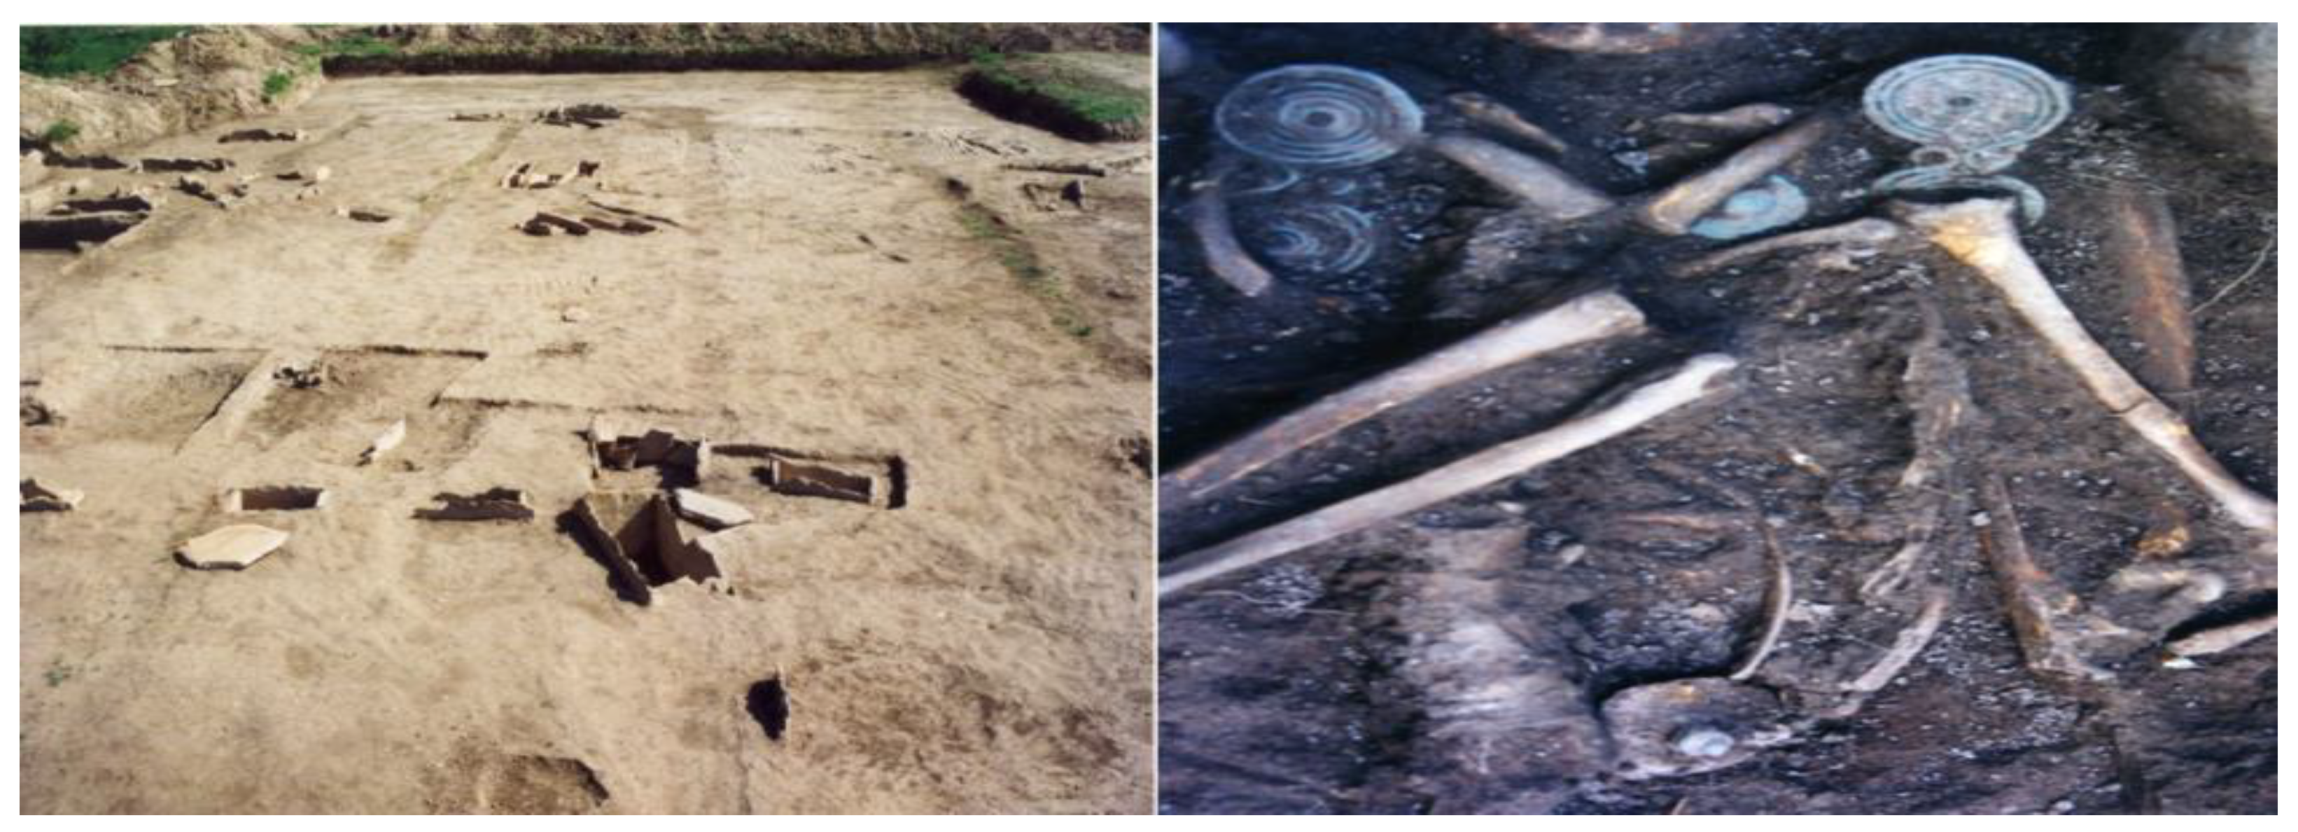
Historical Background

The EIA in Greece is known as the Geometric period and constitutes the ancient “Dark Ages” due to a lack of archaeological evidence [56]. This period followed the collapse of the Mycenaean civilization, in the Late Bronze Age (LBA), when populations were more scattered, less cultural consolidated and more mobile. Concurrently, it signalled the beginning of the development of the alphabet, colonies and a new social structure [57], all of which laid the foundation for later Greek civilization. In Central Macedonia, during the EIA, there was an increase in settlement sites, which were small and, in many cases, in the same areas as previous LBA sites [58]. They continued to cultivate plants such as wheat, barley, millet, beans and fruits and had livestock farming such as pigs and sheep. Additionally, the Macedonian style of pottery was widespread throughout the region; there was also a link with the Balkans and Central Europe, as suggested by metal ornaments and weapons found in EIA graves [58].
An ancient cemetery with 50 cist graves (Figure 1) from the Early Iron Age has been excavated in Agras, 4 km west of Edessa in Macedonia, northwest of the Edessaios River, a place where habitation traces from as far back as the Neolithic Age have been found [59]. The graves were in groups, without any other elements that could allow their identification, like a family tumulus, whereas their existence is not excluded. Some of them were empty due to the intensive arboriculture of the area since the 1950s, while others were small, as an indicator of the individual’s age. The tombs present the well-known image of the Iron Age cist graves, in which the slabs of the long sides protruded in order to securely hold in place the narrow ones. Many of the tombs included primary and secondary burials as well as older ones; usually the skulls were gathered at the same narrow side. Inside, iron weapons, bronze jewels and clay pots were also recovered.

2. Material and Methods

2.1. Materials

We present the results of an isotopic analysis of δ13Ccol and δ15Νcol in human bone collagen on 10 samples from the archaeological site of Agras (longitude 22.003 and latitude 40.806) (4 km west of Edessa) from the EIA, in comparison with samples from Roman Edessa [3] and modern Alexandreia [2]. We present δ13Cap and δ18Oap isotopic values for four samples from Agras and δ18Oap isotopic values for 16 samples from Edessa. Three samples from Agras were selected for radiocarbon dating. Finally, the δ18Ow isotopic values of eight spring waters from the wider area of Edessa are presented.
Bone collagen stable isotope data (δ13C and δ15N) were obtained from the literature [5,56,58,60,61,62,63,64,65,66] for seven archaeological sites across Greece and five from the rest of Europe.

2.2. Methods

The isotopic analysis was conducted at the Stable Isotope and Radiocarbon Unit of the Institute of Nanoscience and Nanotechnology, of N.C.S.R. Demokritos, in Athens, Greece. Collagen was extracted from the bone samples following the experimental process in [67,68]. About 250 mg of bone sample was crushed into small chunks after being treated with an ultrasound. These small pieces were immersed in 0.5 M hydrochloric acid (HCI) until the minerals were broken down. The remaining pieces were rinsed with distilled water and then immersed in 0.5 M sodium hydroxide (NaOH) for 20 h in order to remove the humic contaminants. The chunks were again rinsed with distilled water and then immersed in an aqueous solution that reached 100 °C, until the isolation of collagen was feasible. The collagen was treated by a lyophilization process (freeze-dried). The good preservation of collagen was verified by the atomic C:N ratio, which should be between 2.9 and 3.6 [10], and by collagen yields, which should be over 1 wt % [69].
For the apatite extraction, we followed the protocol of Bocherens et al. (1996) [70] with a modification by Dotsika et al. (2011) [71]. The bones were powdered and treated in NaOCl (2–3%) for 24 h on a rotator at room temperature in order to oxidize the organic residues. Afterwards, they were rinsed with distilled water and soaked in an acetic acid–Ca acetate buffer (1M) for 24 h on a rotator at room temperature in order to remove the exogenous carbonate.
The isotopic ratios are expressed for carbon as δ13C versus marine carbonate (PDB), for nitrogen as δ15N versus atmospheric N2 (AIR), and for δ18O of apatite versus PDB. The δ18O of water samples was measured versus the Vienna Standard Mean Ocean Water (VSMOW).
We use the δ notation:
δ = (Rsample − Rstandard)/Rstandard] × 1000,
with R either 13C/12C or 15N/14N or 18O/16O. The measurement precision was 0.1‰ for measured isotopes.
The values of δ13C and δ15N for contemporary hair samples collected in Alexandreia were corrected by 1.41‰ and 0.86‰, respectively, in order to correspond to the bone collagen values [72]. The corresponding bone collagen values δ13C values for Alexandreia [2] were corrected by the Suess Effect [73] (we added 1.5‰ to the δ13C values of the contemporary samples) in order to compare them with the archaeological results. Finally, for three of our samples we performed Accelerator Mass Spectrometry/Radiocarbon dating. Calibration was performed with the most recent curve data for the northern hemisphere [74].
Radiocarbon aging determinations were performed using the Liquid Scintillation Counting method (LSC) [75].
In order to determine the contribution percentages of each source in the diet, a set of mass balance equations using the stable isotope values was solved with the Bayesian statistical packages IsoSource [76] and FRUITS [77].

3. Results and Discussion

3.1. Diet Reconstruction

Table 1 presents the δ13Ccol and δ15Ncol isotopic values of human bone collagen and δ13Cap isotopic values of human bone apatite of Agras. The results of radiocarbon dating for the three selected samples are also presented in the same table. These samples dated from 1000 to 800 BC, which corresponds to the Early Iron Age. For all of our samples, the atomic C:N ratio was between 2.9 and 3.5 (Table 1), while the collagen yield was over 1 wt %; thus, the collagen was well preserved [10,69].
From Table 1 we observe that the δ13Ccol isotopic values ranged between −20.5‰ and −15.6‰, with a mean value of −17‰ (s.d. 1‰), while δ15Ncol isotopic values ranged from 6‰ to 11.1‰, with a mean value of 8.8‰ (s.d. 1‰). In Figure 2 we present our results compared with the ones from Edessa [3] and Alexandreia [2]. Additionally, we present some isotopic results of recent C3 and C4 plants (after the application of the Suess effect [2]), ancient terrestrial animals [58]), and freshwater and marine fish [11] of the Macedonia region in North Greece.
The isotopic values of δ13C for C3 plants ranged from −26.1‰ to −23.4‰, with a mean value of −24.9‰ (s.d. 0.9‰), for terrestrial animals from −21.6‰ to −17.9‰ with a mean value of −20‰ (s.d. 1‰), for freshwater fish from −20.8‰ to −18.4‰ with a mean value of −20‰ (s.d. 1‰), for C4 plants −10.6‰ to −9.2‰ with a mean value of −9.9‰ (s.d. 0.5‰), and for marine fish from −14.8‰ to 10.1‰ with a mean value of −12‰ (s.d. 2‰). The isotopic values of δ15N for C3 plants from ranged –1.1‰ to 3.9‰ with a mean value of 2‰ (s.d. 1‰), for terrestrial animals from 0.8‰ to 10.3‰ with a mean value of 5‰ (s.d. 3‰), for freshwater fishes from 7.7‰ to 10.9‰ with a mean value of 9‰ (s.d. 2‰), for C4 plants from 4‰ to 6‰ with a mean value of 5.2‰ (s.d. 0.7‰) and for marine fish from 7.1‰ to 12.9‰ with a mean value of 10‰ (s.d. 2‰). These values must be adjusted by one trophic level, 1‰ for δ13C [34,78] and 3‰ for δ15N [39], in order to represent the diet. We observed that human collagen samples are enriched in both δ13C and δ15N isotopic values in comparison to herbivores. The mean bone collagen human δ13C value is 3‰ higher than the mean faunal value, while the mean bone collagen human δ15N value is 3–4‰ higher than the mean faunal one. Thus, Figure 1 clearly shows that the vast majority of humans have bone collagen δ15N values 1–5‰ higher than those of terrestrial herbivores (3–6‰), exhibiting the trophic level effect and demonstrating the importance of terrestrial C3 sources in the diet.
In addition, we observed that the results from Agras (EIA) were in good agreement with the ones of Edessa (Roman) (t-test for δ13C: t = 0.94, p = 0.36 and for δ15N: t = 1.92, p = 0.08), as well as the ones of Alexandreia (recent) (t-test for δ13C: t = 1.62, p = 0.13 and for δ15N: t = 0.08, p = 0.93). The much enriched δ13C isotopic values, together with the enriched δ15N values, indicate a combined terrestrial diet of mainly C3 and secondary C4 diet, like millet, in combination with freshwater fish consumption. Probably, the C4 diet was mainly introduced by the consumption of animals fed with millet and secondary as a direct food source. The elevated nitrogen value, 8.8‰, indicates that legumes were not a significant part of the diet as their δ15N values range between 0‰ and 2‰ [79]. Additionally, their isotopic values do not reflect a marine diet, a result consistent with the site location, i.e., far from the sea. Moreover, the sample T24-KT, which exhibits the lowest δ15N value, 6‰, reflects a diet of C3 and C4 with a minimal animal protein contribution. On the contrary, sample T6b has a very negative δ13C isotopic value, −20.5‰, which indicates no C4 contribution to the diet. Both of these individuals were buried with their arms bent at the elbow and raised to the shoulder, which is an uncommon posture and may have had some ritual significance [59].
Taking into consideration the geographical location (close to Vegoritida Lake and Edessaios River), it is possible that the population under study consumed significant quantities of freshwater fish. In order to validate this assumption, we analyzed the δ13Cap isotope from bone apatite, which reflects the total diet [33], while the difference between δ13Ccol and δ13Cap is an indicator of the protein source [34]. In our results (Table 1), these differences ranged from 4.3‰ to 5.6‰ with a mean value of 4.9‰, which is greater than 4.4‰, the threshold above which the protein consumption is mainly derived from terrestrial sources [80,81]. The individuals T4b and T50b had ΔCap-col values of 4.5‰ and 3.8‰ (Table 1), respectively, so it seems that there was freshwater fish protein in their diet. On the contrary, individuals T6b and T33b had greater differences in ΔCap-col, 5.6‰ and 5.1‰ (Table 1), which indicates terrestrial food sources.
In Table 2 we present the results from the statistical packages IsoSource and Fruits. We considered five possible source contributions to the diet after adjusting their mean isotopic values by one trophic level, namely C3 plants (δ13C = −23.9‰, δ15N = 5‰), terrestrial animals (δ13C = −19‰, δ15N = 8‰), freshwater fish (δ13C = −18‰, δ15N = 12‰), marine fish (δ13C = −11‰, δ15N = 13‰) and C4 plants (δ13C = −8.9‰, δ15N = 8.2‰). In the first column, we present the results of the samples, excluding the outliers (T6 and T24KT), while in columns two and three we present the results for the outliers T6 and T24KT, respectively.
We observed that both package results are in good agreement on the T6 outlier’s diet source contribution, reinforcing the previous assumption that this individual had no C4 contribution. For the T24KT outlier, IsoSource did not succeed in evaluating the percentages and the results from FRUITS show a greater contribution of plants, both C3 and C4, in the diet, than of animals. For the rest of our samples, the two packages do not agree on the contribution percentages of terrestrial animals, freshwater and C4 plants. IsoSource suggested a diet based mostly on freshwater fish, with an insignificant contribution of C4, but returned almost the same probability for marine and terrestrial animal consumption. On the other hand, FRUITS suggests a more balanced diet combining all the sources.

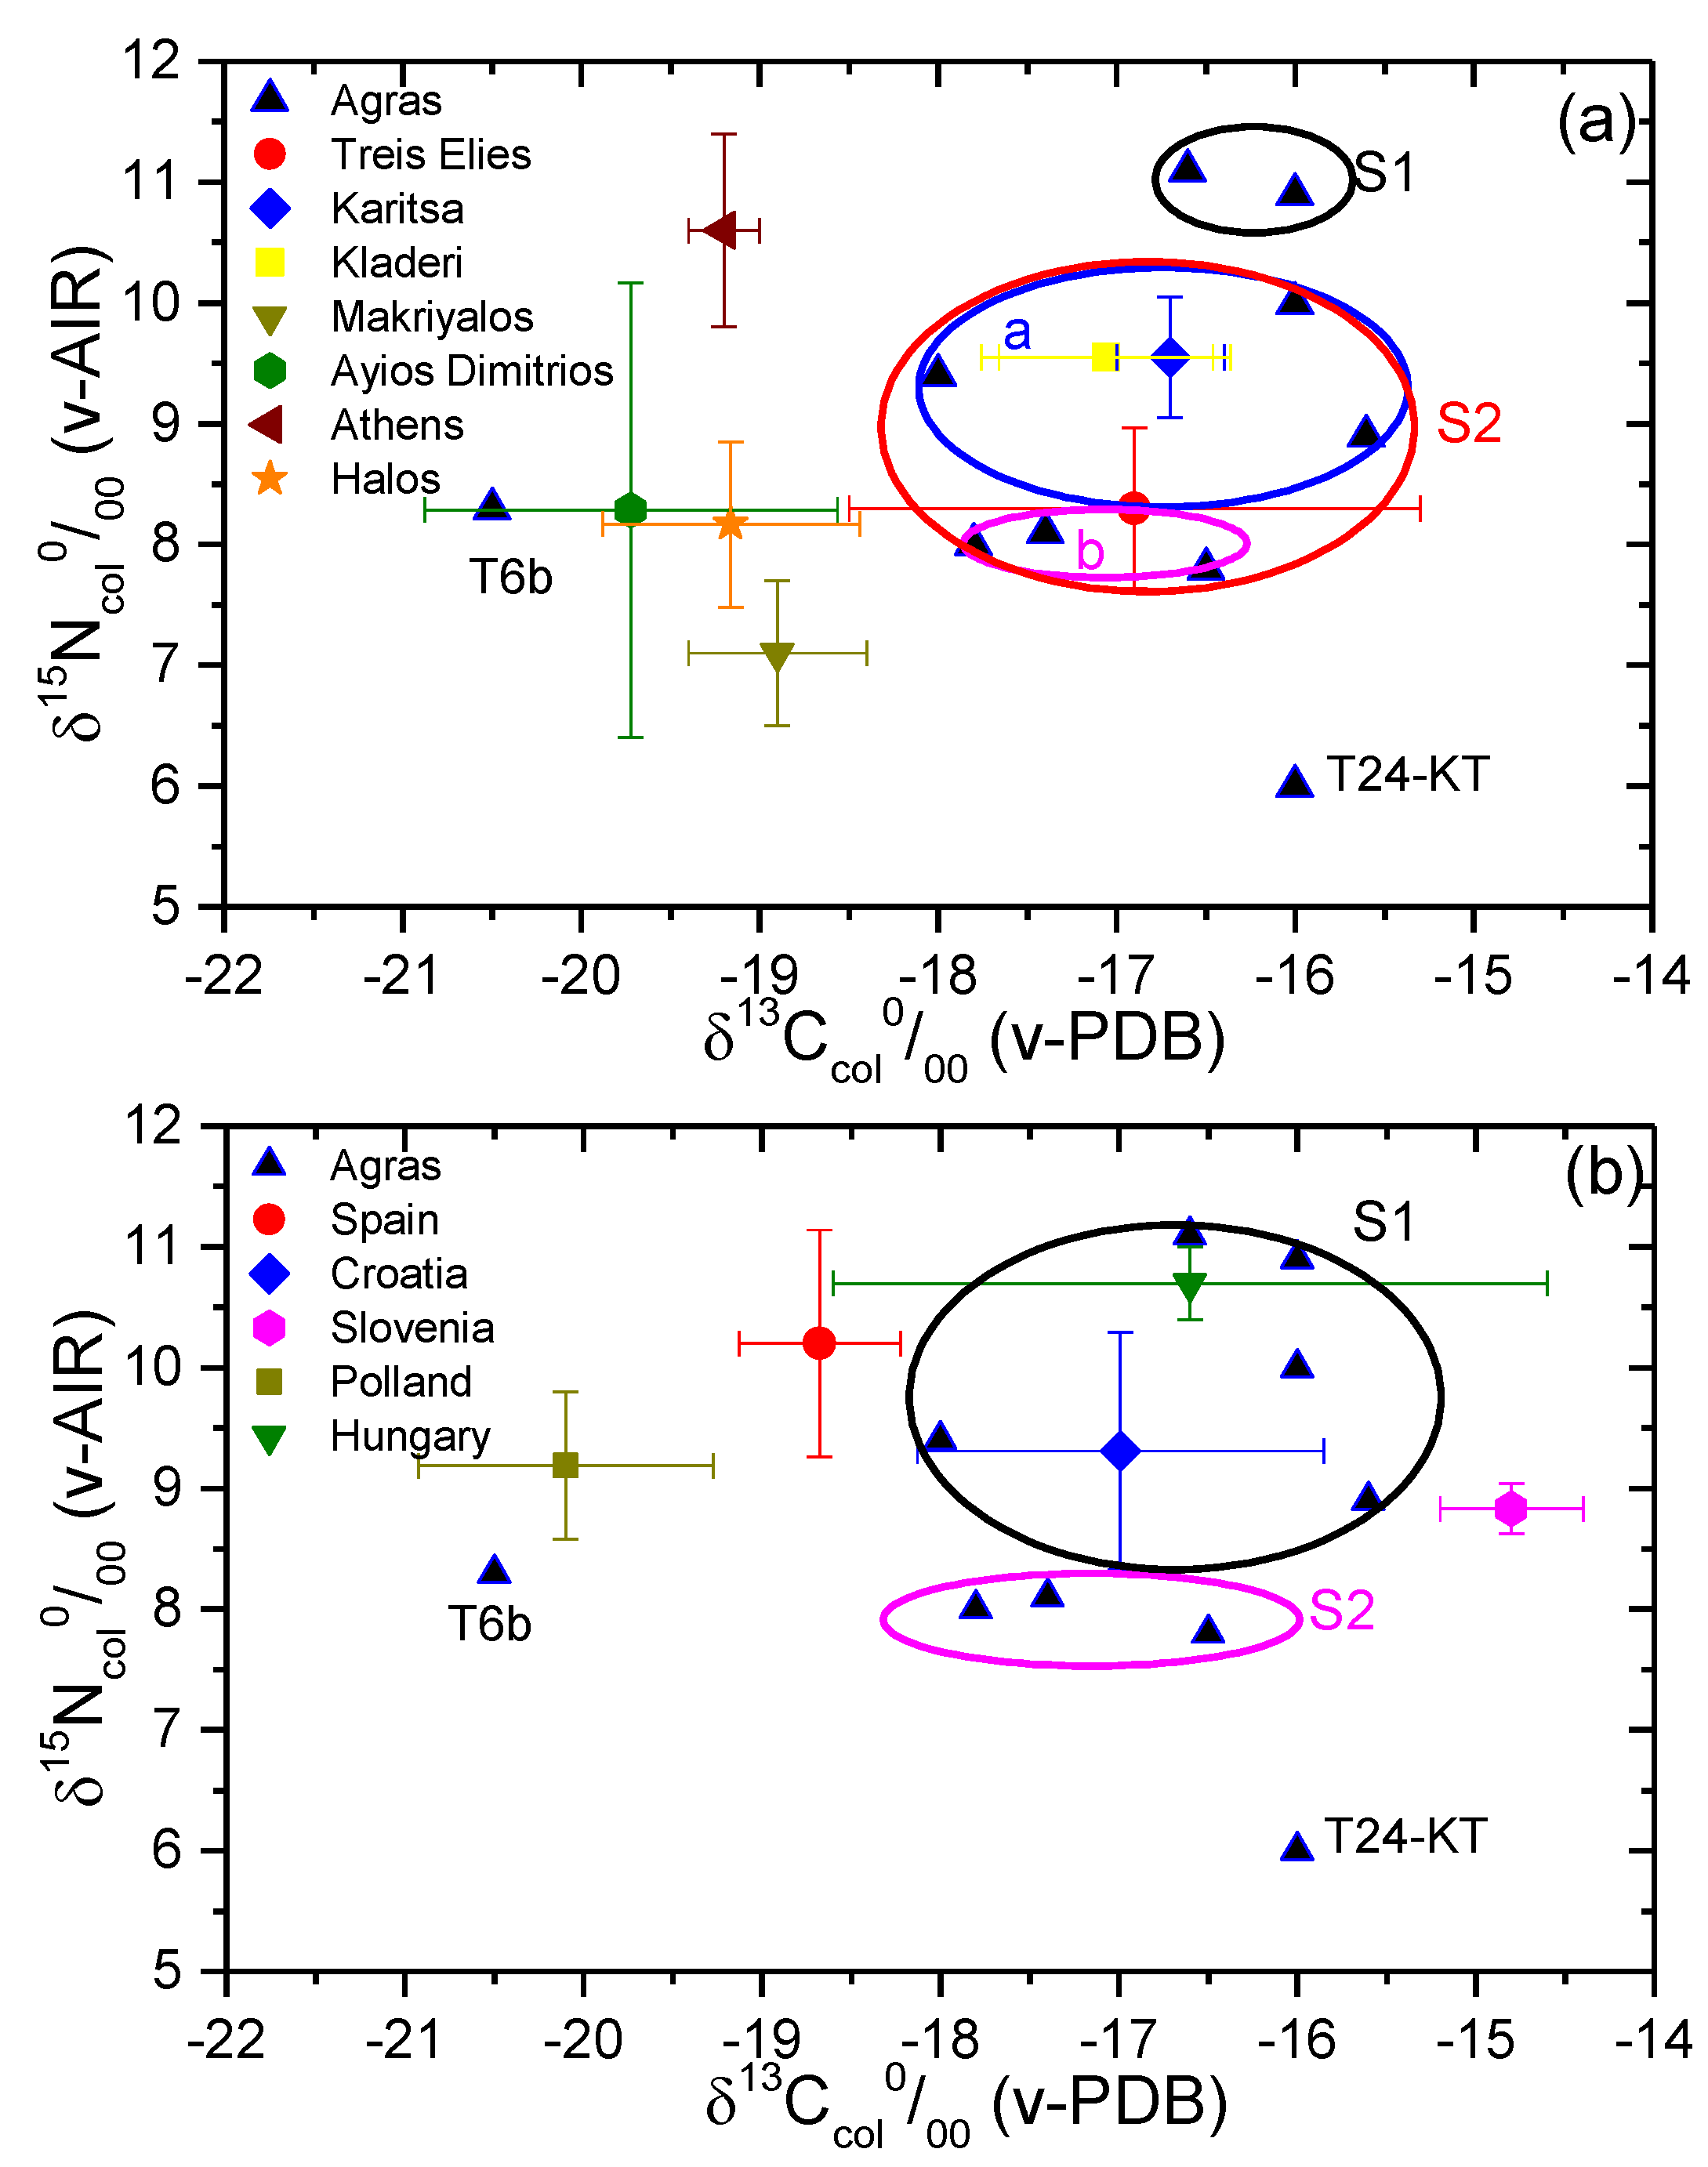
3.2. Comparison with Other Regions

In Table 3 we present the carbon and nitrogen isotopic values of bone human samples from sites in Greece and wider Europe from the same period, and in Figure 3 we compare them with the results from Agras. In Figure 3a we present the mean δ13C and δ15N isotopic values of the Greek sites, while Figure 3b gives the ones from European sites.
We performed a t-test in order to compare our results with the ones from other sites in Northern Greece (Treis Elies, Karitsa and Kladeri) and observed that the Agras samples can be separated into two groups, S1 and S2. The t-test showed that the S2 group had no significant difference from the Treis Elies, Karitsa and Kladeri sites (for δ13C: t = 0.27, p = 0.78 and for δ15N: t = 0.29, p = 0.77), while for the S1 group the difference was insignificant for δ13C (t = 2.24, p = 0.11) and significant for δ15N (t = 3.97, p = 0.02). The S2 group’s isotopic values (especially the subdivision of it, i.e., S2a) like at the sites Treis Elies, Karitsa and Kladeri, indicates a mainly terrestrial C3 and C4 diet [84] with a freshwater protein contribution, which is indicated by the elevated nitrogen values. The S2b group had lower nitrogen values, indicating a C3 and C4 diet with a lower freshwater fish contribution. Notably, the enriched carbon isotopic values in the North Greece sites reinforced the assumption that millet was introduced to North Greece from Europe [85] and afterwards to the rest of Greece. Additionally, S1 samples had enriched nitrogen values, indicating a larger freshwater fish consumption than at the other sites. For the Makriyalos site, a C3 diet was assumed, with low animal protein consumption, as indicated by the depleted δ13C and δ15N isotopic values [84] compared to Agras and other Macedonian sites. Additionally, S1 samples have enriched nitrogen values, indicating a larger freshwater fish consumption than the other sites.
The sites of Athens, Ayios Dimitrios and Halos were δ13C depleted. Specifically, the carbon and nitrogen isotopic values in Ayios Dimitrios and Halos indicate a mainly C3 diet with no C4 contribution, with a significant portion of animal protein [61,82], which is in agreement with the results of sample T6b. Finally, Athens had more negative δ13C isotopic values, while its nitrogen was more positive than Agras, indicating a C3 diet with higher animal protein consumption [83] compared to Agras.
To compare with the other European sites, we performed a t-test and our samples were separated into two groups (Figure 3b): the first was group S1, which had no significant difference for δ13C (t = 0.50 p = 0.64) and for δ15N (t = 0.07, p = 0.95), with the site in Croatia having isotopic values that indicated a mixed C3 and C4 diet [63] and the one in Hungary showing elevated nitrogen values that might be due to the incorporation of freshwater fish or to differences in agricultural techniques [66]. The second group is S2, which differed insignificantly in Croatia and Hungary for δ13C (t = 0.85 p = 0.46), but for δ15N the difference was significant (t = 3.84, p = 0.03). However, the results of both groups did not agree with the ones of Slovenia, where the C4 contribution was greater than that of C3 [65] and Poland, where, unlike in Agras, there was no evidence of C4 diet [64]. Moreover, in Spain, C3 in the diet outweighed C4, which is more significant to infants’ diet [62]; this was in contrast to Agras, where the C4 contribution was quite evident. The rest of our samples, i.e., T6b and T24-KT, had carbon and nitrogen isotopic values different from the other European sites.

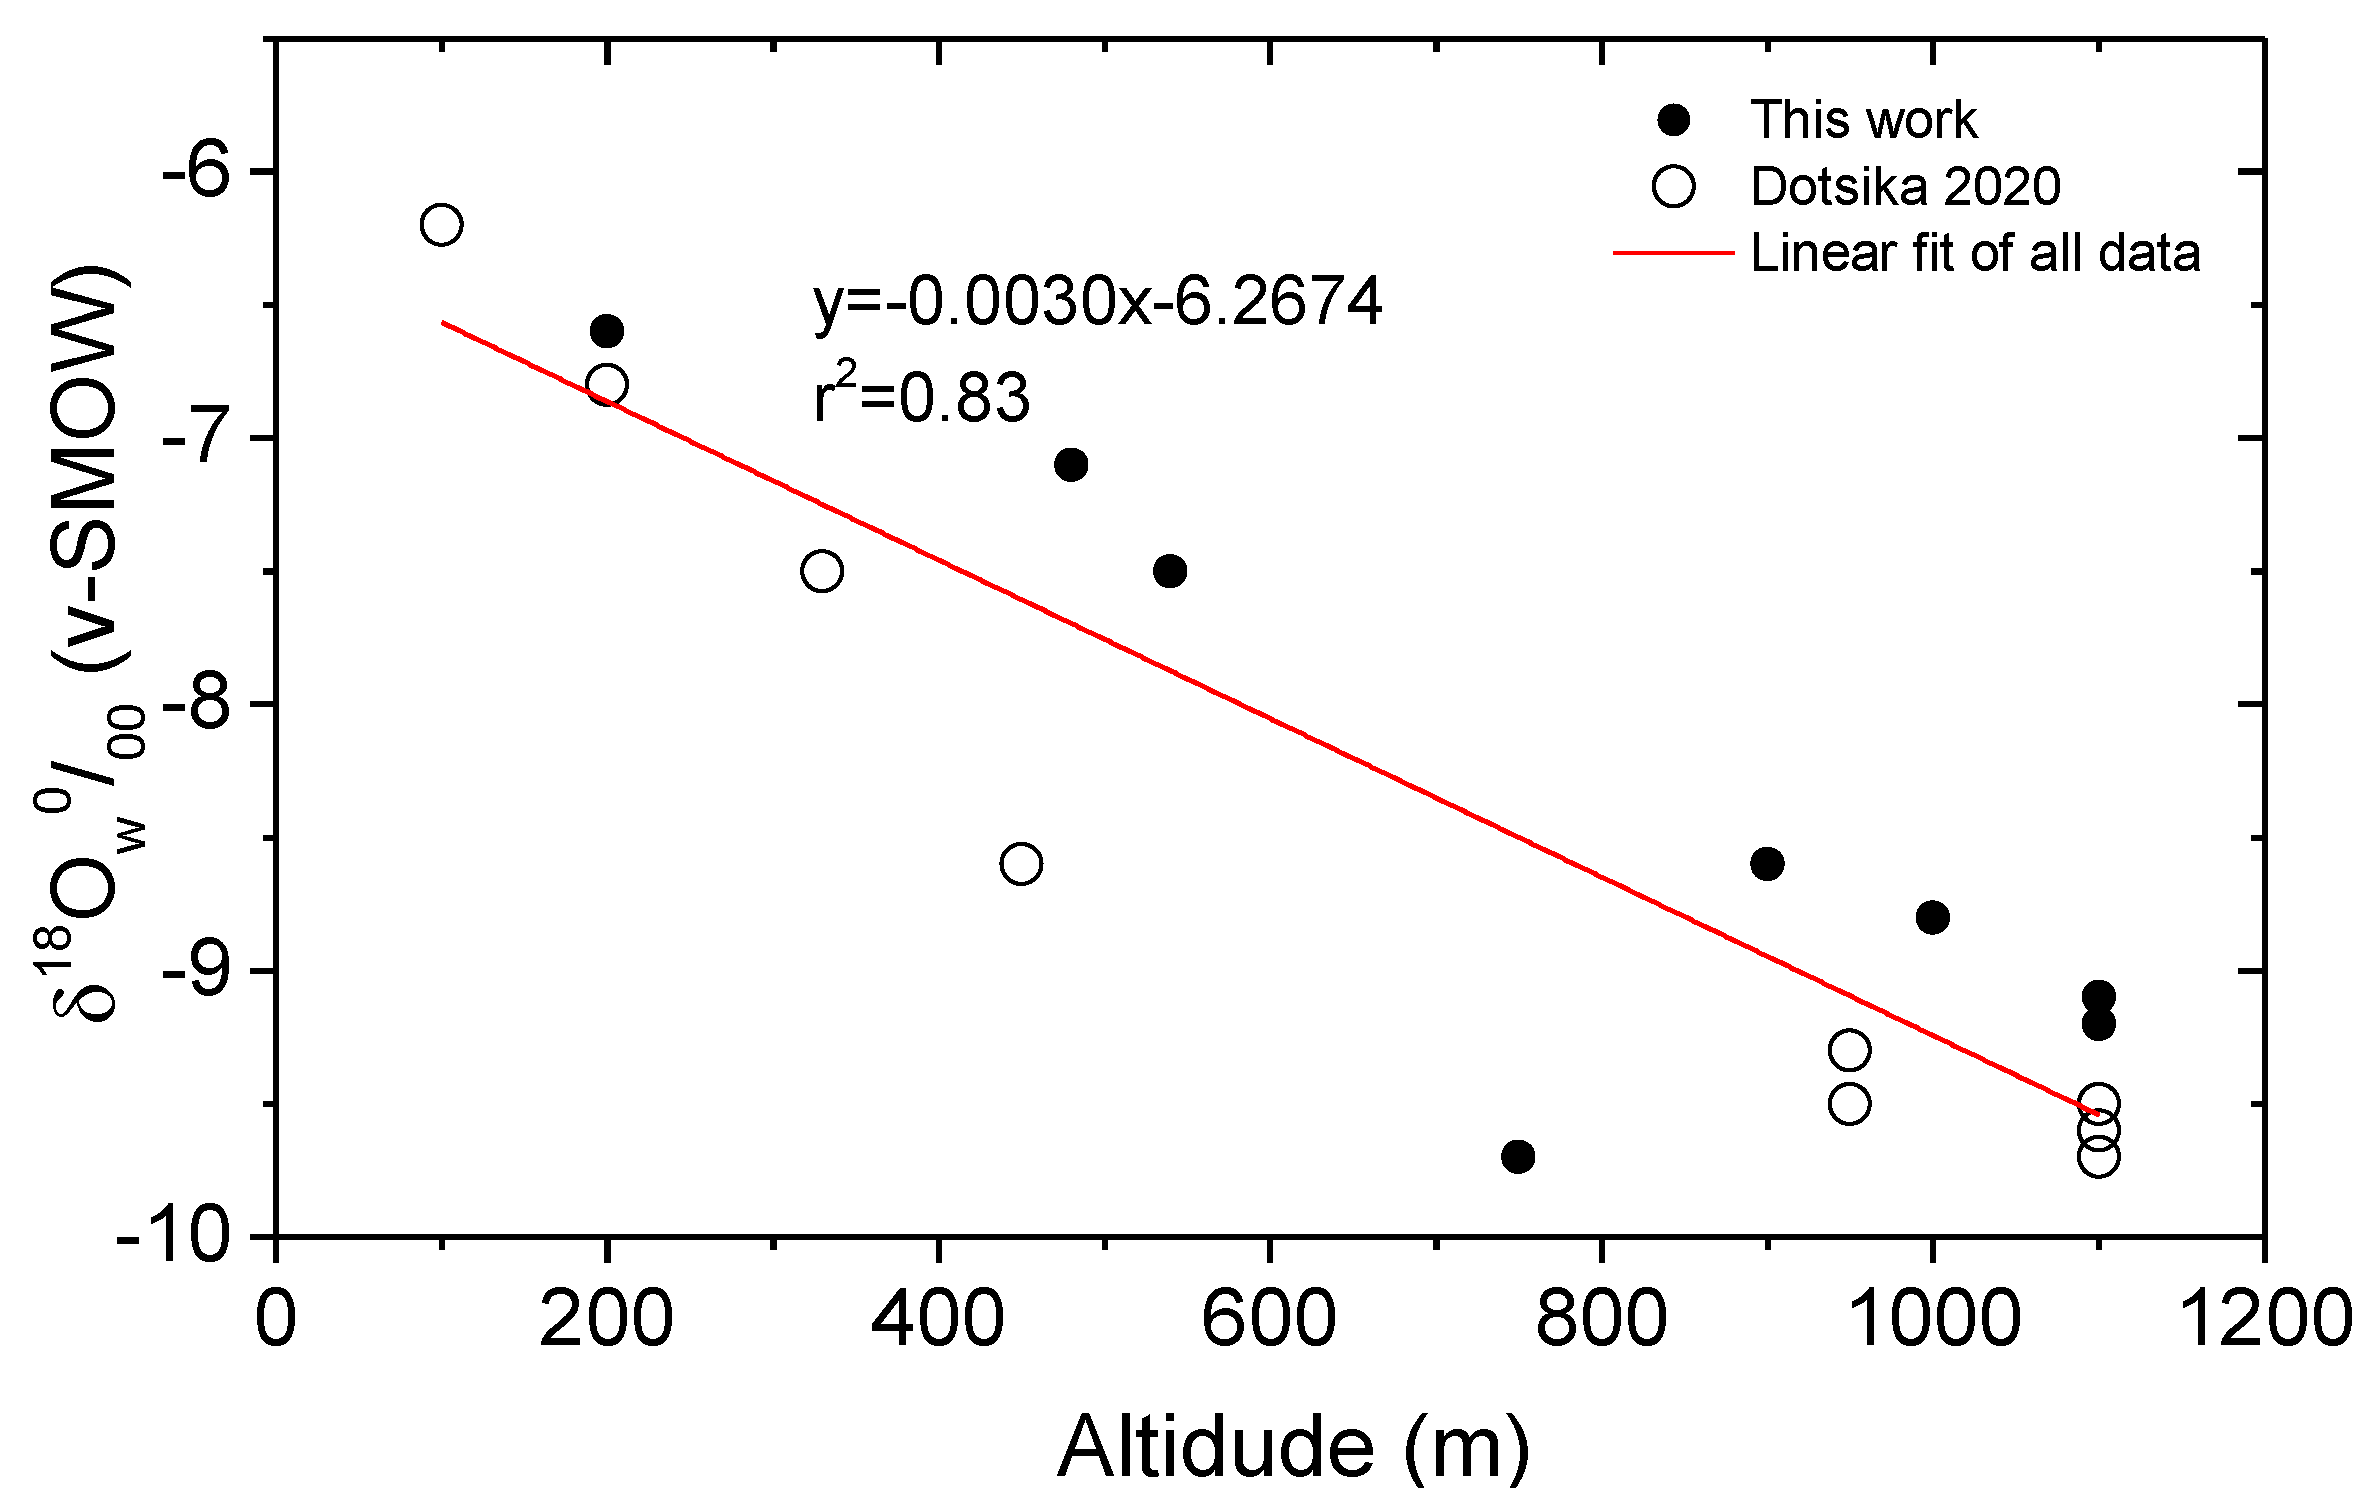
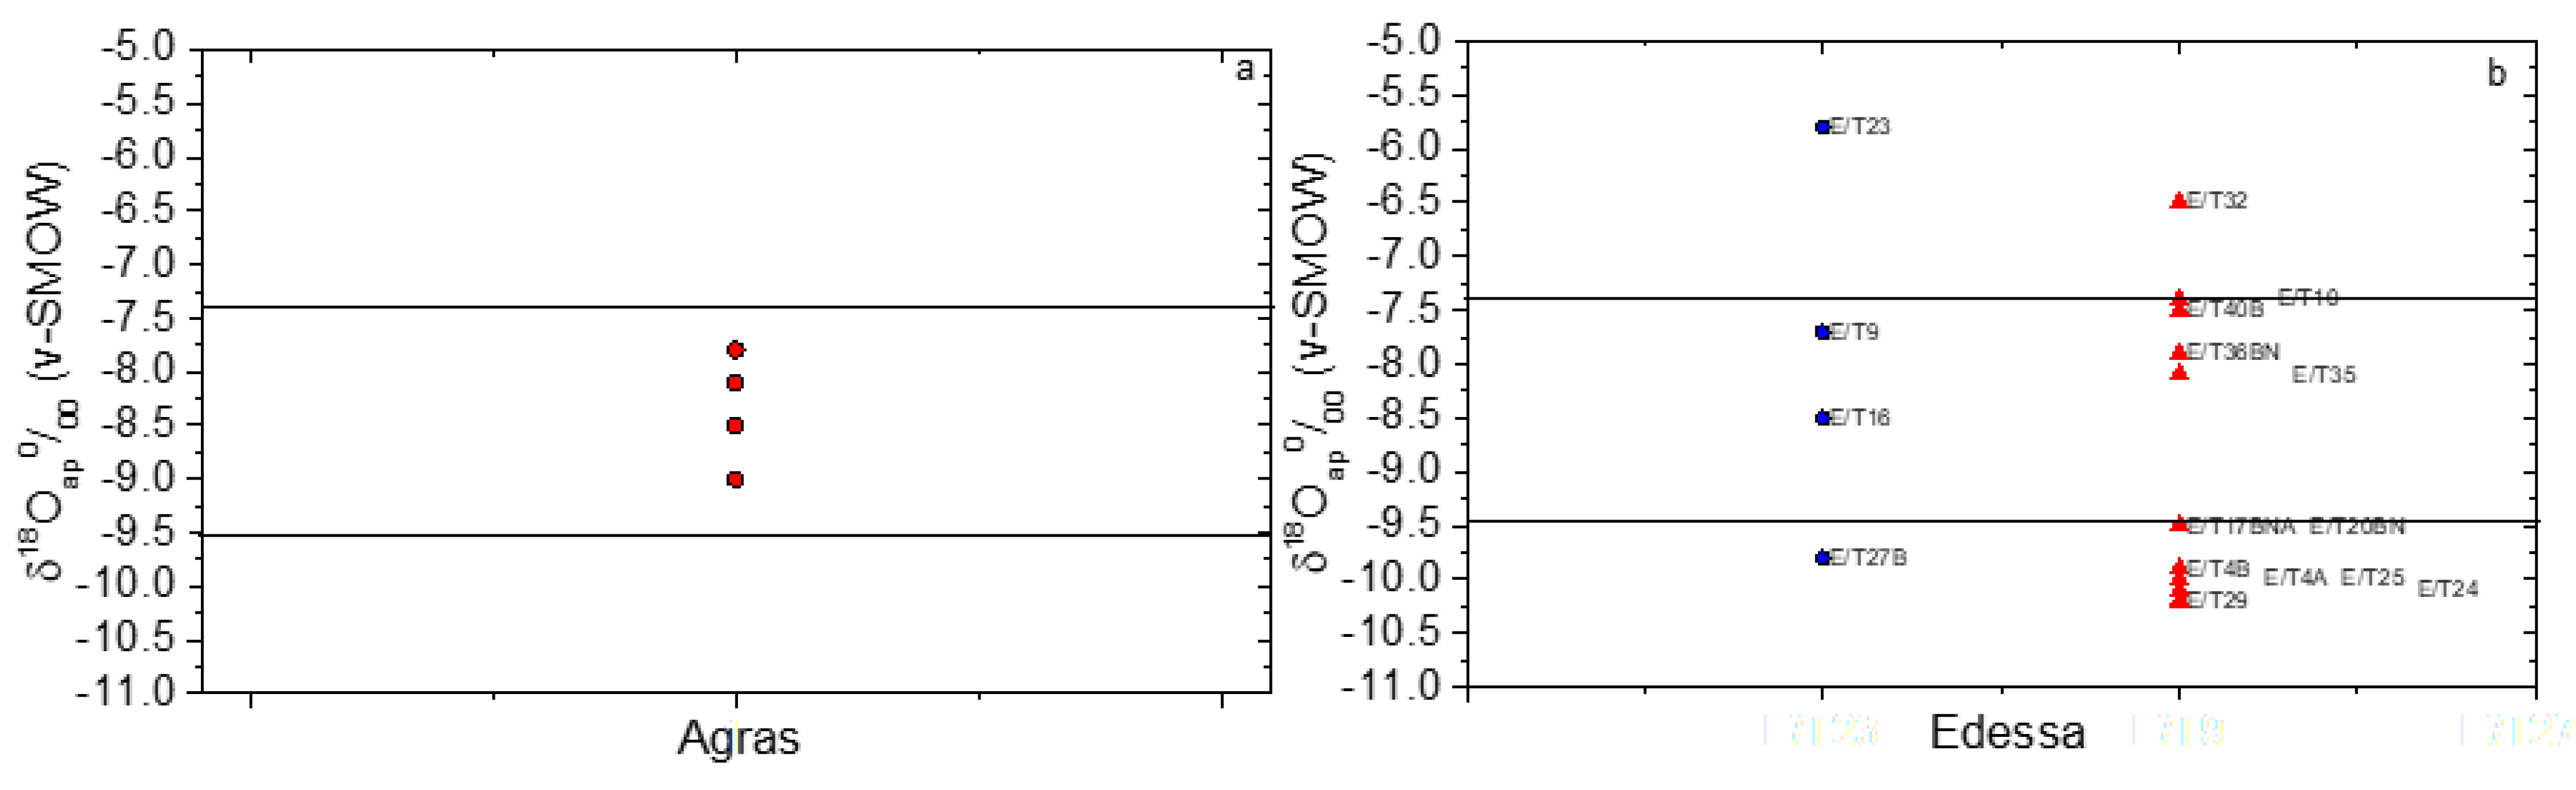
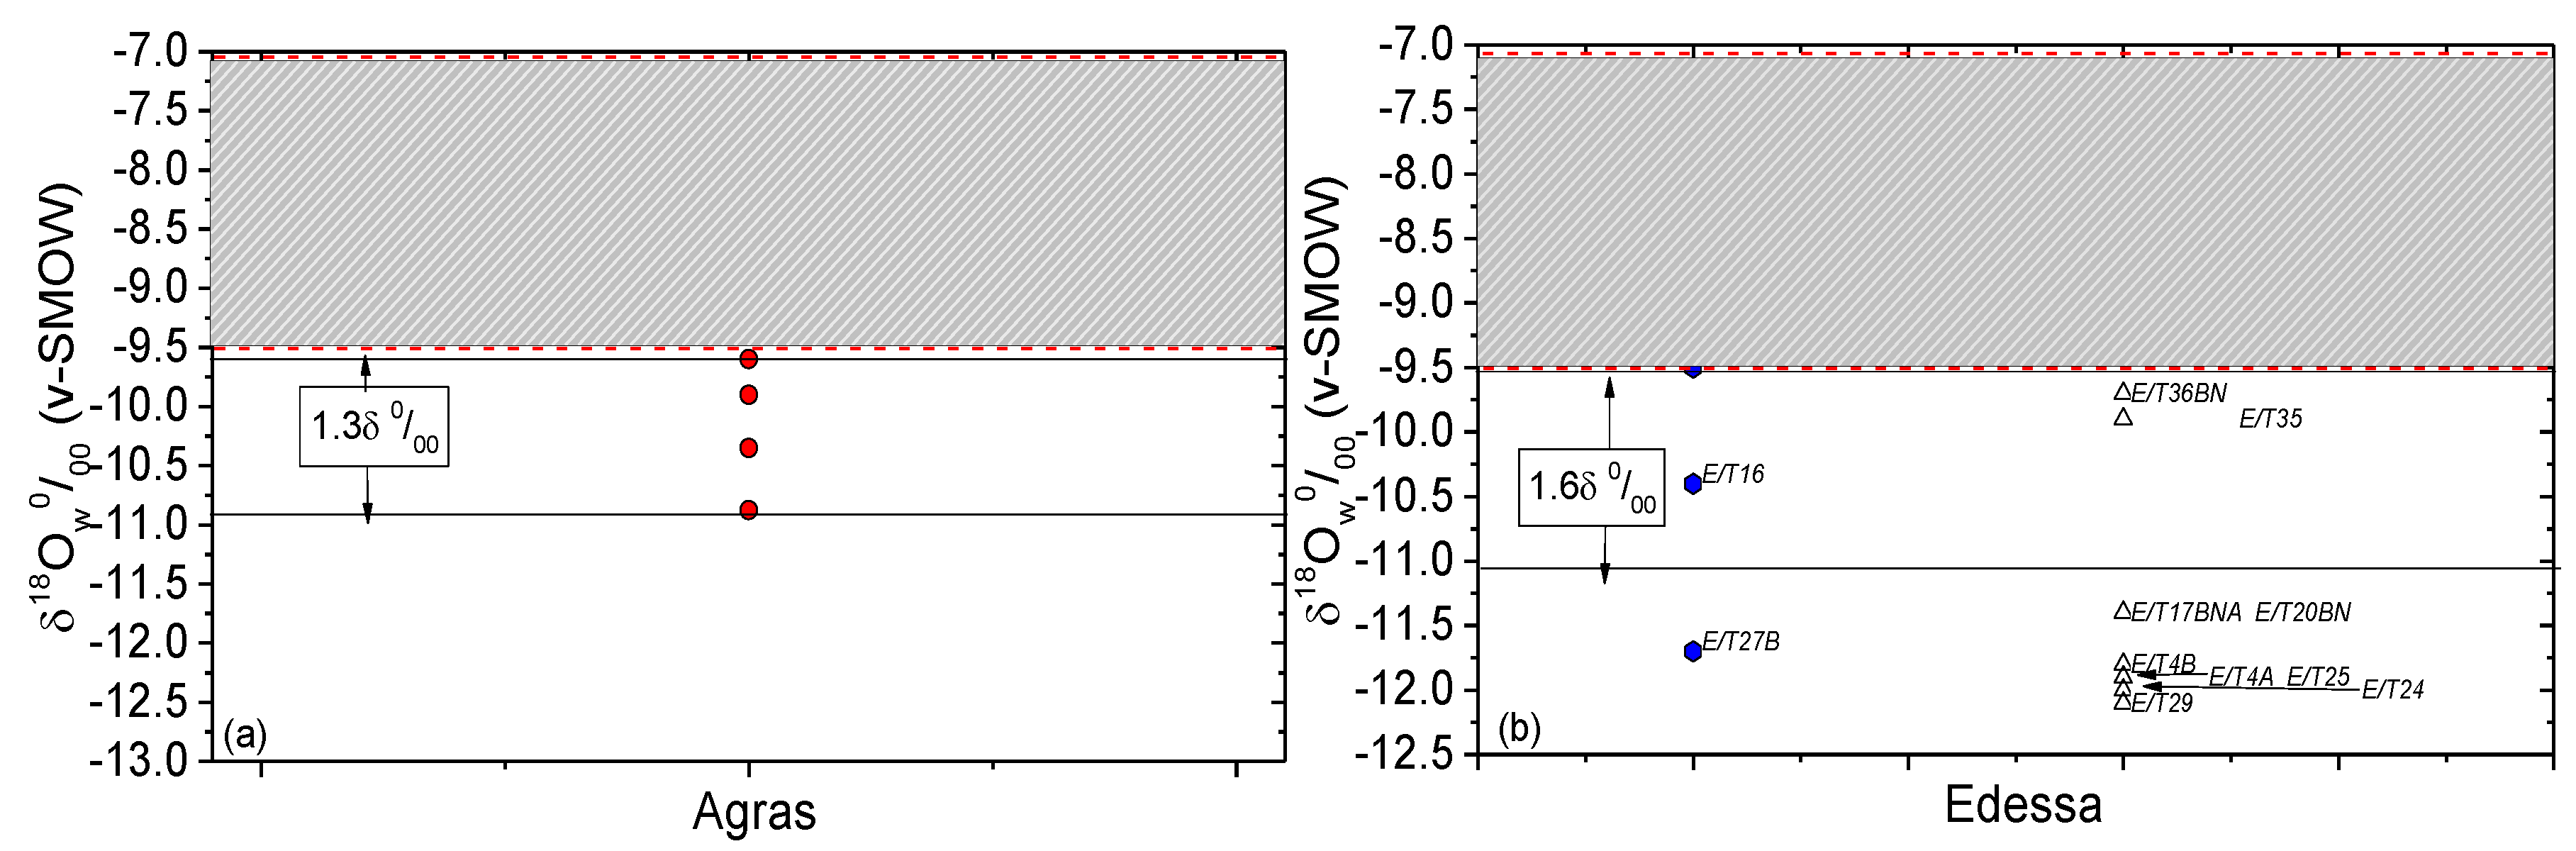
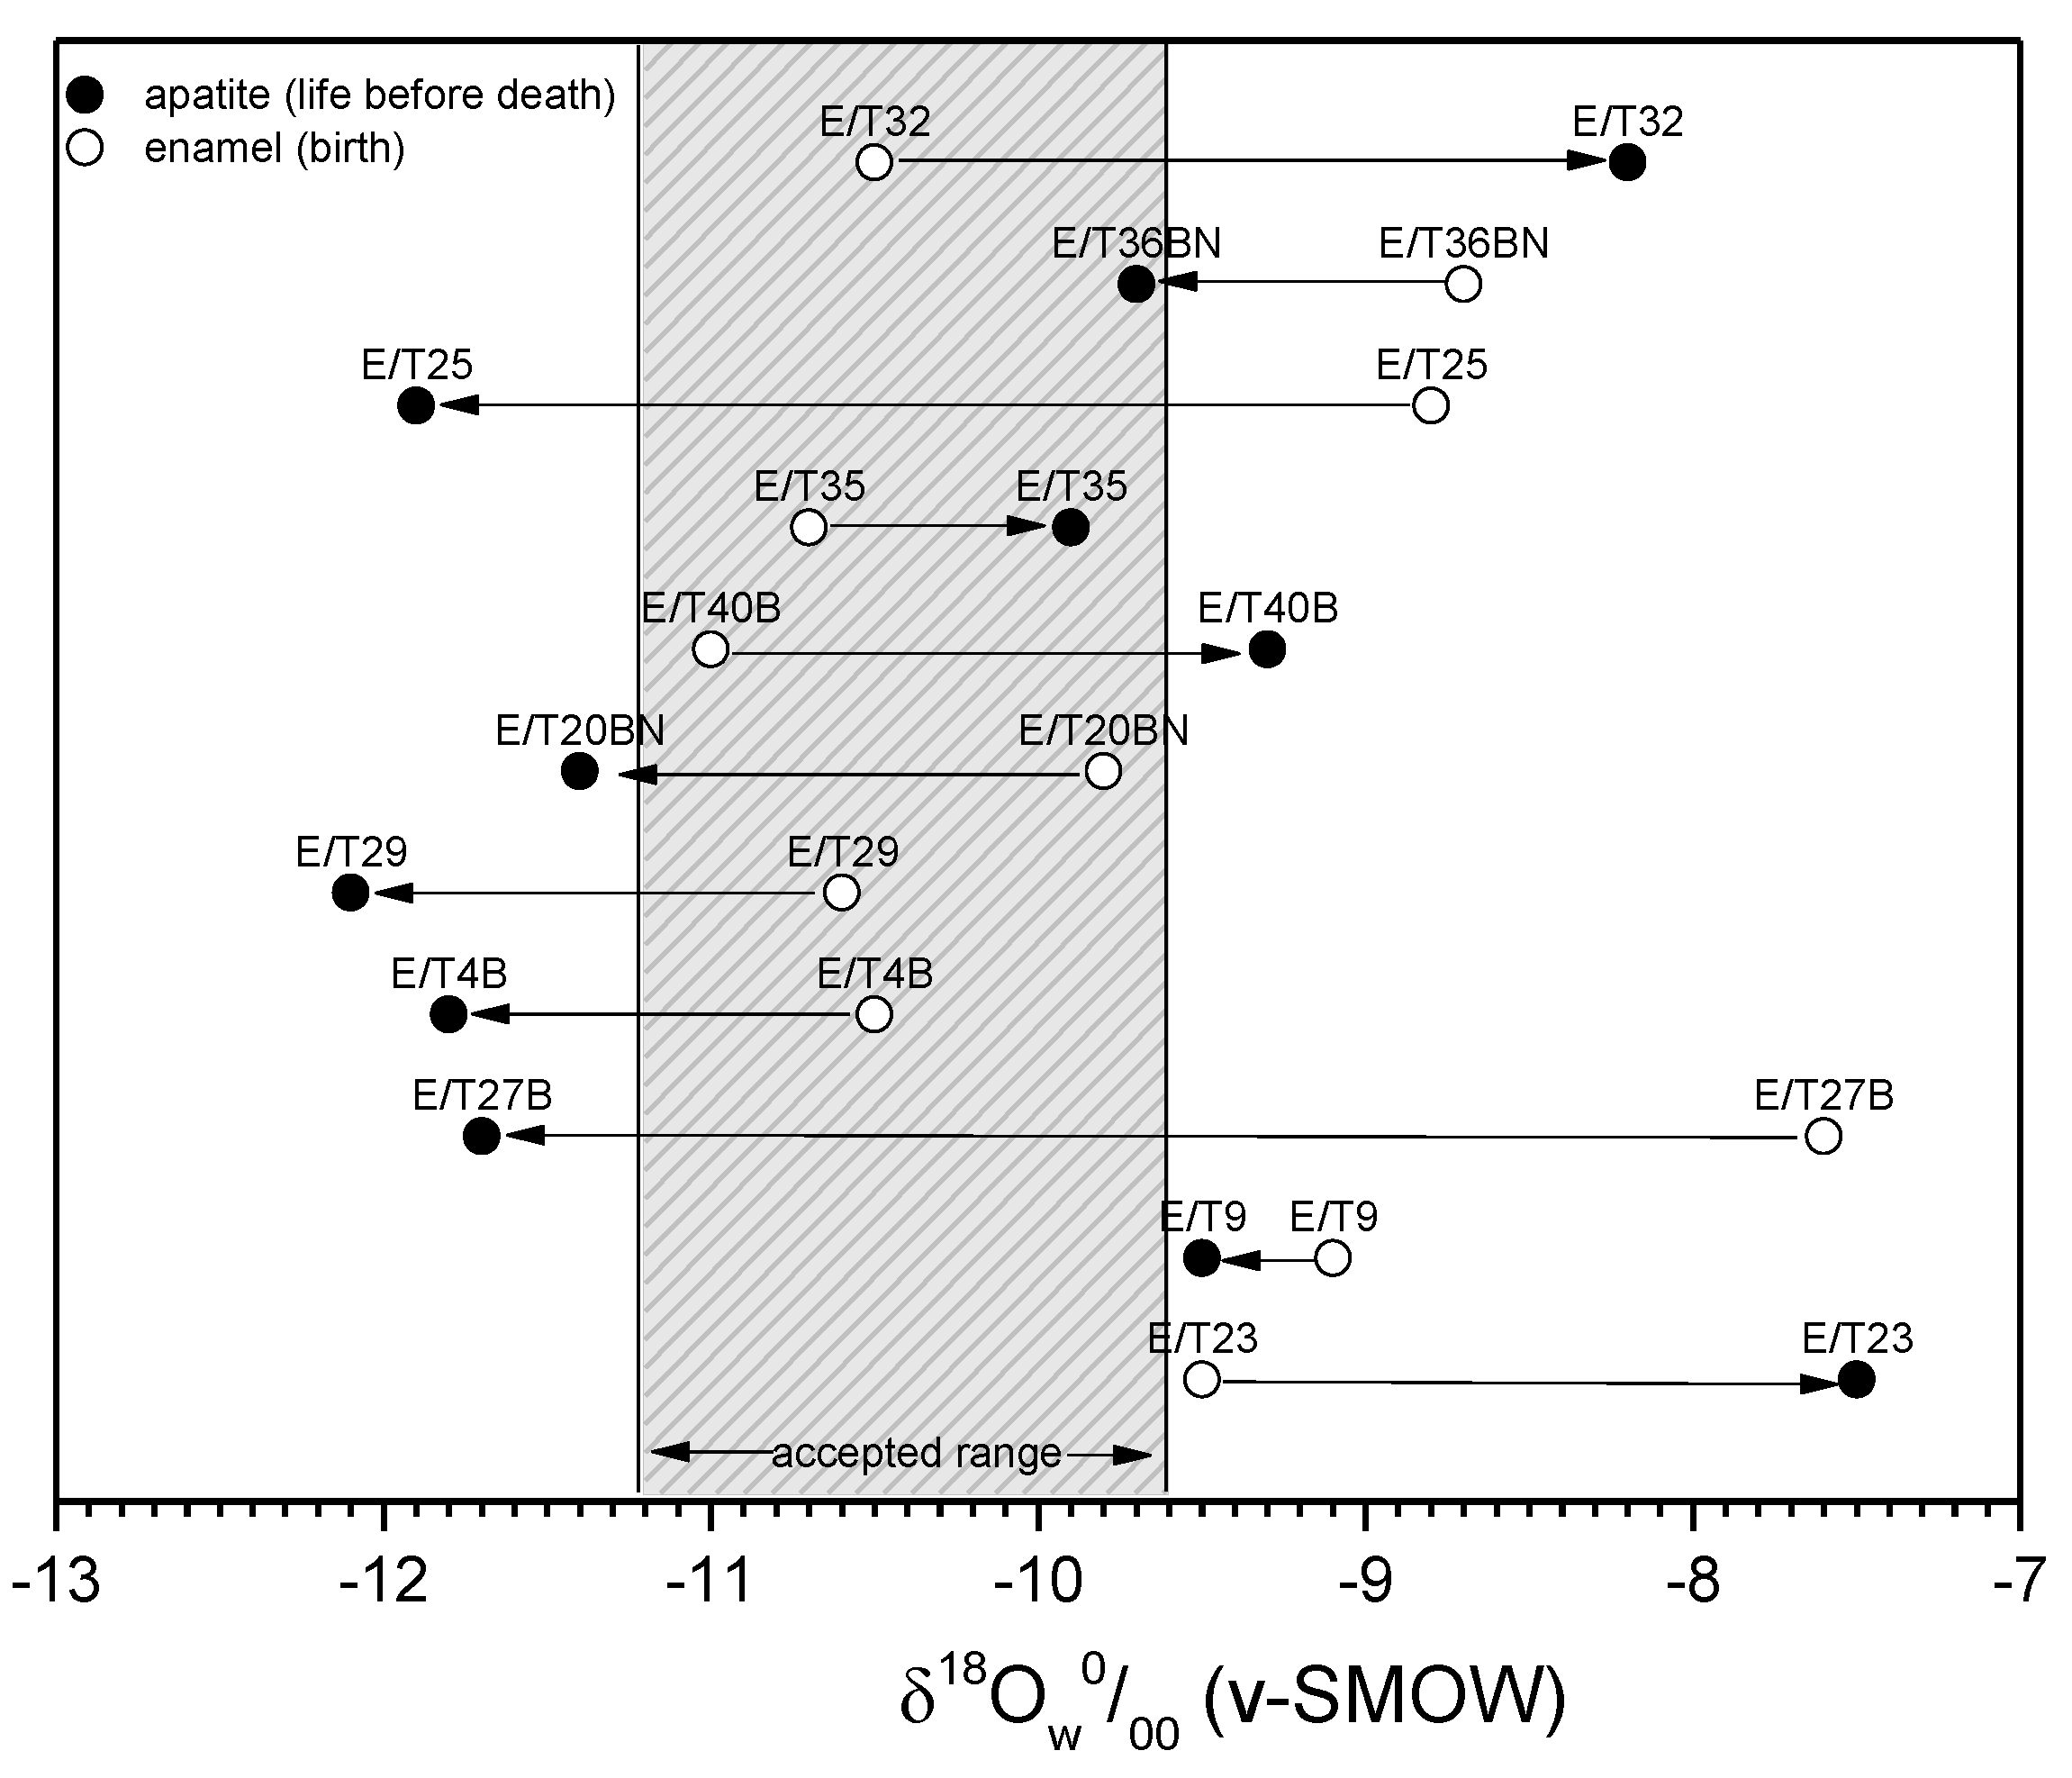
3.3. Climatic Conditions and Mobility

Considering the inhomogeneous environment of the Greek territory, we examined whether the geographical location, and consequently the climatic conditions, of the burial sites had an influence on the isotopic signatures of human bone collagen. Specifically, the 18O content in human tissues, which is much more prominent than that of 13C, could be related to environmental factors such as temperature and precipitation. The δ18O isotopic values of human samples can be determined by measuring the δ18O of either structural carbonate (CO32−) or phosphate (PO43−) in the bioapatite [Ca10(PO4,CO3)6(OH,CO3)2]. The phosphate oxygen ion is more resistant to the alterations than the structural carbonate but Chenery et al. and Dotsika et al. [71,86] demonstrated that the δ18OC isotopic values of structural carbonate in human tooth enamel and bone bioapatite can be considered accurate. Considering that the major factor that affects the oxygen isotopic composition of human tissues is related to the body’s water content and, thus, to the water consumed, any apparent variation in the isotopic composition of bones apatite samples is modulated by the local climatic conditions of each human’s place of residence.
Therefore, in order to investigate the climatic conditions in Agras from the Early Iron Age and Roman Age (Edessa) and to relate oxygen isotopes to the palaeomobility studies, we present in Table 4 the δ18Oap isotopic values of human bone apatite samples from EIA Agras and Roman Edessa. In the same table we present the δ18Oen of structural carbonate of human tooth enamel [19] from Roman Edessa, as well as the calculated δ18Ow, using the equation δ18Ow = 1.020δ18Oen − 32.941, which relates spring water in Greece to the δ18Oen(C) (v-SMOW) of tooth enamel apatite of recent humans [19].
Τhe measured δ18Oap (v-PDB) isotopic values (Table 4) of Agras range from −9.0‰ to −7.8‰ and for Roman Edessa from −10.2‰ to −5.8‰. The mean oxygen isotopic value of Agras individuals is −8.4‰ (s.d. 0.5‰), while the maximum difference between Agras human samples is 1.2δ‰. This value range (1–2‰) is what would be expected for a population living in the same region (Agras) and consuming similar foods and drinking water [87,88].
Eight samples from Roman Edessa were identified as outliers. Specifically, individuals E/T23 and E/T32 had enriched oxygen isotope ratios (−6.5‰ to −5.8‰), while individuals E/T4B, E/T4A, E/T24, E/T25, E/T27B and E/T29 had depleted oxygen isotopic values (−10.2‰ to −9.8‰) in comparison to the other individuals. When these individuals were excluded, the majority of the samples from Edessa and Agras area had δ18Oap isotopic values between −7.4‰ and −9.5‰.
The maximum difference between Edessa’s samples (excluding E/T23, E/T27b E/T32, E/T4b, E/T14A, E/T24, E/T25 and E/T29) was 2.1δ‰ for both males and females, suggesting no significant sex differences for Edessa’s individuals. Two (E/T23 and E/T32) and six (E/T4B, E/T4A, E/T24, E/T25, E/T27B and E/T29) individuals presented oxygen isotopic differences of 0.7δ‰ and 0.4δ‰, respectively, suggesting that, due to the similarity of values, they either originated from the same geographic region or from different locations with similar climatic conditions. Furthermore, these two (from −5.8‰ to −6.5‰) and six (from −9.8‰ to −10.2‰) individuals, which presented oxygen isotopic values outside of Edessa’s range (−7.4‰ to −9.5‰) probably consumed drinking water from other sources and lived in other places. One possible explanation for the high δ18Oap values (−6.5‰ to −5.8‰) is that these two individuals originated from an area characterized by a warmer climate or lived closer to the sea. The low δ18Oap values (−10.2‰ to 9.8‰) of the six individuals from Edessa probably indicate that they lived at higher altitudes or latitudes. However, the δ18Oap value of consumed water is related not only to the region where they lived, but also to the region’s altitude, which is a factor that has to be examined before concluding about the climatic conditions of the studied periods and differentiating local and nonlocal individuals.
Additionally, the population of an ancient city could get water from sources of different altitudes; therefore, the δ18Ow of water springs were correlated to the climate data and the geographic spread of ancient cities in order to define the isotopic fingerprint of the areas. The annual precipitation rate for the area of Edessa (Agras and the city of Edessa) is 500 mm, with a mean annual temperature of 12 °C; however, it exceeds 750 mm in regions of higher altitude (mountainous areas: Vermio and Voras-Kaimaktsalan Massif reach 2000 m and 2500 m, respectively). In order to take into consideration the relationship between δ18Ow and altitude, an oxygen isotopic analysis was conducted for water sources (eight springs in the area near Agras and Edessa) at different altitudes of the regions (δ18Ow) (Figure 4) and the results were combined with those presented in Dotsika [19]. The local/specific gradient of oxygen isotope value versus altitude (δ18Ow = a × Altitude + b) is:
δ18Ow = − 0.0030 × Altitude − 6.3.
This correlation can, potentially, provide a valuable explanation for the measured δ18Oap range of unknown samples both contemporary and archaeological.
Hence, if we apply the isotopic gradient (Equation (1), 0.3‰/100 m) and attribute the maximum isotopic δ18Oap difference between the samples to the different altitude of the drinking water, the difference of 1.2‰ for Agras corresponds to a hypsometrical difference of ~400 m, while for Edessa the difference is 4δ‰ and 3.7δ‰ for males and females, respectively, and the corresponding hypsometrical difference is ~1000 m. If we exclude the more positive and negative samples (E/T23, E/T27B, E/T32, E/T4B, E/T4A, E/T24, E/T25, and E/T29), the difference is 2.1δ‰ and corresponds to a hypsometrical difference of ~700 m. Considering the mountainous topography of the area, the consumed water could have originated from springs with a different recharge altitude, but this altitude difference is too high to correspond to different sources of drinking water originating from reservoirs of the local groundwater for Edessa. However, if we assume that the altitudinal distribution of population could be ±100 m, that is to say a total of 200 m, which means 480 ± 100 m for Agras city and 350 ± 100 m for Edessa city, the accepted oxygen isotopic difference between the populations of the same region is 0.6δ‰. Taking into consideration the consumption of liquids other than water could cause a variation of ~1δ‰ in oxygen isotopic values [19]; compared to the maximum variation of δ18Oap, for a population that lived in the same region it could be ~1.6δ‰ [19]. Therefore, this maximum value of 1.6δ‰ cannot fully explain the oxygen isotopic range for Edessa individuals (with oxygen apatite values ranging from −7.4‰ to 9.5‰), and and so it seems that in the same group there are individuals that seem to be foreign to each other. When the δ18Oap values are plotted (Figure 5), 50‰ of individuals fell within the range of −7.4‰ to −9.5‰, with mean values of −8.3‰ (s.d. 1.1‰).
Taking into consideration the maximum variation of oxygen isotopic values of 1.6δ‰ (due to different diet between humans and to different recharge altitudes), we can assume that the individuals whose δ18Oap values fall in this range (−7.4‰ to −9.5‰) consumed water from local sources, while individuals with values outside this range consumed water from nonlocal areas. Dotsika [19] showed that δ18Oen is highly correlated with the local δ18Ow of drinking water in Greece. Using this equation, δ18Ow = 1.020*δ18Oen − 32.941, which relates spring water in Greece with the δ18Oen (Carbonate) (v-SMOW) of tooth enamel apatite of recent humans, the isotopic values of consumed water for Agras and Edessa individuals were calculated (Table 3).
In Figure 6 we present the differences in calculated δ18Ow(ap) for each site, where the horizontal lines indicate the 1.6δ‰ acceptable deviation between individuals, whose median distance is the mean oxygen isotopic value for each site. In the same figure, the range of local water is indicated. The calculated δ18Ow(ap) (v-SMOW) isotopic values of consumed water for Agras humans ranged from −10.9‰ to −9.6‰, with a mean value of –10.2‰ (s.d = 0.6‰); for Roman Edessa, they ranged between −11.4‰ and −9.2‰ (excluding samples E/T23, E/T27B E/T32, E/T4B, E/T14A, E/T24, E/T25 and E/T29) with a mean value of −10.1‰ (s.d = 0.9‰‰), while Modern Edessa’s spring water (shaded area in Figure 6) oxygen isotope values varied from −9.5‰ to −7.0‰ [19].
Assuming that minimum and maximum δ18Ow(ap) isotopic values can differ by 1.6δ‰ (due to differences in diet and different recharge altitudes), the acceptable range of δ18Ow in ingested water is between −9.6‰ and −11.2‰. The majority of individuals in Edessa had values outside the contemporary spring waters of the area, both men and women.
These values are affected by the climatic conditions of the different areas and time periods that the individuals lived. However, the variability in δ18Ow values is too great to be attributed only to climatic fluctuations. Taking into consideration the fact that the oxygen isotopic composition of waters from lower altitudes is enriched in δ18O compared to the waters of higher origin in a drainage basin, two individuals dwelling at different altitudes within that drainage basin present differences in δ18Oap. This could be the case for the seven women of Edessa who could have consumed water from higher (300–400 m) altitudes than the men or lived in areas with a colder climate. However, it is unlikely that every individual in Edessa was drinking water from different reservoirs within the city and that the majority of the individuals drank water from very high altitudes, i.e., 1000 m (only the springs of 1100 m had oxygen isotope values of −9.5‰), given that a spring existed (at 400–500 m altitude, with an oxygen isotope value of −8‰) near the city. Probably, this observed variability in consumed water could be attributed to the existence of nonlocal individuals.
Hence, these out-of-range individuals from Edessa must be examined separately. The isotopic signature recorded in the permanent teeth reflects the water consumed early in life, while that recorded in the bones reflects the water consumed during the last 10–20 years of life. Therefore, the oxygen values of enamel show the climate in the region they were born, while the oxygen values of apatite show the climate in the region where the individual lived before his/her death. In Figure 7 we present the results of oxygen apatite and enamel for each sample.
Two of the individuals (E/T23 and E/T9) were identified as nonlocals based on both their teeth enamel and apatite values. These two individuals appear to have been born or lived in a lower-altitude region with low δ18Ow values, at least during their early childhood, after which T23 migrated from this area to an even lower-altitude and warmer area at Edessa, while T9 remained in the same place. Two individuals (E/T40b and E/T32) were identified as nonlocal based on their bone oxygen values, while their isotopic values fell within the local range based on their teeth oxygen values, indicating that they migrated from Edessa to a warmer climate as adults (Figure 6). Three individuals appear to have had different histories: E/T29, E/T4B and E/T20BN were identified as nonlocal based on their δ18Oap values, suggesting that they could have been born in Edessa, but they migrated and lived in a place with lower δ18O, colder than Edessa, and then moved to Edessa before their death. Two individuals, one male, E/T27B, and one female, E/T25, appear to have been born in warmer places than Edessa, migrated to a colder place and then returned to Edessa before their death. Finally, E/T35 appeared to be local to Edessa as both teeth and bone oxygen fell within the expected range.
Furthermore, regardless of the studied period, we observed that Agras oxygen isotopic values were similar to the values of Edessa, thus we do not expect climatic differences between these two periods. In contrast, the δ18Ow isotopic values were more negative compared with the ones measured at modern Edessa springs [19], which range between −9.5‰ and −7‰. As more negative oxygen isotope values are present in colder climates, we assume that Agras and Edessa were colder and drier in ancient years than today. We noticed that these more negative oxygen values were not seasonal as people were drinking water from local springs. Springs have a low seasonal effect on their oxygen isotope values, since mechanisms like water–rock and water–soil interactions, water flow, mixing and evaporation dominate for δ18O‰ values. Thus, the spring water consumed by individuals is different from the local meteoric water, which is highly affected by seasonality. Indeed, the oxygen isotopic values of the ingested water is in accordance with palaeoclimatic data [15] that indicate a much colder period of drier conditions. The pronounced drier and colder conditions of the region also coincide with other records from the Mediterranean that were reported by Finne [89,90] and Theothorakopoulou [91]. Our radiocarbon dating for Agras samples set them at 3000 years BP, a period that in palaeoclimatic studies belongs to marine isotope stage 1 (MIS 1 (1–11 ky BP). Edessa’s population was aged to the 2nd–4th century CE, i.e., 2000 BP, when drier and colder conditions also prevailed [15]. The studied samples belonged to 3000 to 1800 years BP, when many studies note that a neoglacial period was established [92,93,94,95,96]. Consequently, the glacier extent caused cooler conditions worldwide, as shown by the glacier retreat that coincided with warmer conditions [93]. Finally, the colder and drier climate could have affected the human diet, making agriculture difficult and therefore forcing people to pursue alternative food sources such as freshwater fish.

4. Conclusions

In this work we present a δ13C and δ15N isotopic analysis of human bone from Agras in North Greece for the period 10th–8th century BCE, which constitutes the Early Iron Age in Greece. The scope of this analysis is the identification of dietary habits for the site during this period. The isotopic values for δ13Ccol varied between −20.5‰ and −16‰ and for δ15Ncol from 6‰ to 11.1‰. The difference between δ13Ccol and δ13Cap is greater than 4.4‰. These values indicate a diet based mainly on C3 plants combined with C4 plants, with a small contribution from freshwater fish. Of the samples, there were two outliers, one with no significant C4 contribution and the other with a minimal animal protein contribution. These results were compared with some from Roman Edessa (2nd–4th century CE [3] and modern Alexandreia [2] and we observed that they were in good agreement. Additionally, they were compared with the results of other sites in Greece and wider Europe. We observed that the isotopic values were close to those from North Greece, with the exception of Makriyalos, and quite close to Croatia’s and Hungary’s isotopic values.
Furthermore, we presented a δ18O isotopic analysis of human bone apatite from Agras and Edessa and calculated the isotopic composition of ingested water [19]. The δ18Ow isotopic values for Agras ranged from −9.6‰ to −10.9‰ and for Edessa from −9.6‰ to −11.2‰. No significant differences were observed between the two sites; on the contrary, both Agras and Edessa were characterized by more negative δ18O values compared to modern Edessa spring water, which has values between −9.5‰ and −7‰, suggesting that the climate was colder in both EIA and the Roman Age. Additionally, in Edessa’s samples we studied the population mobility using the differences between the enamel’s and apatite’s oxygen isotopic values. Finally, three Agras samples were radiocarbon dated to 980−844 ± 50 BCE.

Author Contributions

E.D.: Conceptualization, writing—original draft preparation, methodology, writing—review and editing, supervision, funding; M.T.: formal analysis, visualization, project administration, writing—review and editing, data curation; P.K.: formal analysis, visualization, writing—original draft, project administration; A.C.: resources, review, investigation; D.E.M.: resources, review; A.E.P.: formal analysis, data curation; K.T.: review, investigation; G.D.: review, data curation, investigation. All authors have read and agreed to the published version of the manuscript.

Funding

This research received no external funding.

Conflicts of Interest

The authors declare no conflict of interest.

References

  1. Katzenberg, M.A. Stable isotope analysis: A tool for studying past diet, demography, and life history. In Biological Anthropology of the Human Skeleton; Katzenberg, M.A., Saunders, S.R., Eds.; Wiley-Liss: Hoboken, NJ, USA, 2008; pp. 413–441. [Google Scholar]
  2. Dotsika, E.; Diamantopoulos, G.; Lykoudis, S.; Gougoura, S.; Kranioti, E.; Karalis, P.; Michail, D.; Samartzidou, E.; Palaigeorgiou, E. Establishment of a Greek food database for palaeodiet recostruction: Case study of human and fauna remains Neolithic to Late Bronze age from Greece. Geosciences 2019, 9, 165. [Google Scholar] [CrossRef] [Green Version]
  3. Dotsika, E.; Michael, D.E. Using stable isotope technique in order to assess the dietary habits of a Roman population in Greece. J. Archaeol. Sci.-Rep. 2018, 22, 470–481. [Google Scholar] [CrossRef]
  4. Dotsika, E.; Michael, D.E.; Iliadis, E.; Karalis, P.; Diamantopoulos, G. Isotopic reconstruction of diet in Medieval Thebes (Greece). J. Archaeol. Sci.-Rep. 2018, 22, 482–491. [Google Scholar] [CrossRef]
  5. Papathanasiou, A.; Richards, M.P.; Fox, S.C. Archaeodiet in the Greek World: Dietary Reconstruction from Stable Isotope Analysis; American School of Classical Studies: Athens, Greece, 2015; Volume 49. [Google Scholar]
  6. Guede, I.; Zuluaga, M.C.; Ortega, L.A.; Alonso-Olazabal, A.; Murelaga, X.; Camino, I.G.; Iacumin, P. Social structuration in medieval rural society based on stable isotope analysis of dietary habits and mobility patterns: San Juan de Momoitio (Biscay, north Iberian Peninsula). J. Archaeol. Sci. Rep. 2020, 31, 102300. [Google Scholar] [CrossRef]
  7. Keenleyside, A.; Schwarcz, H.; Stirling, L.; Lazreg, N.B. Stable isotopic evidence for diet in a Roman and Late Roman population from Leptiminus, Tunisia. J. Archaeol. Sci. 2009, 36, 51–63. [Google Scholar] [CrossRef]
  8. DeNiro, M.J.; Epstein, S. The influence of diet on the distribution of carbon isotopes in animals. Geochim. Cosmochim. Acta 1978, 42, 495–506. [Google Scholar] [CrossRef]
  9. DeNiro, M.J.; Epstein, S. Influence of Diet on the Distribution of Nitrogen Isotopes in Animals. Geochim. Et Cosmochim. Acta 1981, 45, 341–351. [Google Scholar] [CrossRef]
  10. DeNiro, M.J. Post-mortem preservation and alteration of in vivo bone collagen isotope ratios in relation to paleodietary reconstruction. Nature 1985, 317, 806–809. [Google Scholar] [CrossRef]
  11. Vika, E.; Theothoropoulou, T. Re-investigating fish consumption in Greek antiquity: Results from d13C and d15N analysis from fish bone collagen. J. Archaeol. Sci. Rep. 2012, 39, 1618–1627. [Google Scholar] [CrossRef]
  12. Longinelli, A. Oxygen isotopes in mammal bone phosphate: A new tool for paleohydrological and paleoclimatological research? Geochim. Et Cosmochim. Acta 1984, 48, 385–390. [Google Scholar] [CrossRef]
  13. Michael, D.-E.; Dotsika, E. Using Oxygen Isotopic Values in Order to Infer Palaeoclimatic Differences between Northern and Central-Southern Greece. In Proceedings of the IOP Conference Series: Earth and Environmental Science, Prague, Czech Republic, 11–15 September 2017; p. 042056. [Google Scholar]
  14. Michael, D.-E.; Dotsika, E. Using Oxygen and Carbon Isotopic Signatures in Order to Infer Climatic and Dietary Information in Roman Edessa, Greece. In Proceedings of the IOP Conference Series: Earth and Environmental Science, Prague, Czech Republic, 11–15 September 2017; p. 042050. [Google Scholar]
  15. Psomiadis, D.; Dotsika, E.; Albanakis, K.; Ghaleb, B.; Hillaire-Marcel, C. Speleothem record of climatic changes in the northern Aegean region (Greece) from the Bronze Age to the collapse of the Roman Empire. Palaeogeogr. Palaeoclimatol. Palaeoecol. 2018, 489, 272–283. [Google Scholar] [CrossRef]
  16. Britton, K.; Pederzani, S.; Kindler, L.; Roebroeks, W.; Gaudzinski-Windheuser, S.; Richards, M.P.; Tütken, T. Oxygen isotope analysis of Equus teeth evidences early Eemian and early Weichselian palaeotemperatures at the Middle Palaeolithic site of Neumark-Nord 2, Saxony-Anhalt, Germany. Quat. Sci. Rev. 2019, 226, 106029. [Google Scholar] [CrossRef]
  17. Clauzel, T.; Richardin, P.; Ricard, J.; Le Béchennec, Y.; Amiot, R.; Fourel, F.; Phouybanhdyt, B.; Vinçon-Laugier, A.; Flandrois, J.-P.; Lécuyer, C. The Gauls experienced the Roman Warm Period: Oxygen isotope study of the Gallic site of Thézy-Glimont, Picardie, France. J. Archaeol. Sci. Rep. 2020, 34, 102595. [Google Scholar] [CrossRef]
  18. White, C.D.; Spence, M.W.; Stuart-Williams, H.L.Q.; Schwarcz, H.P. Oxygen isotopes and the identification of geographical origins: The Valley of Oaxaca versus the Valley of Mexico. J. Archaeol. Sci. 1998, 25, 643–655. [Google Scholar] [CrossRef]
  19. Dotsika, E. Correlation between δ 18 Ow and δ 18 Oen for estimating human mobility and paleomobility patterns. Sci. Rep. 2020, 10, 15439. [Google Scholar] [CrossRef]
  20. Hamre, S.S.; Daux, V. Stable oxygen isotope evidence for mobility in medieval and post-medieval Trondheim, Norway. J. Archaeol. Sci. Rep. 2016, 8, 416–425. [Google Scholar] [CrossRef] [Green Version]
  21. Maggiano, C.M.; White, C.D.; Stern, R.A.; Peralta, J.S.; Longstaffe, F.J. Focus: Oxygen isotope microanalysis across incremental layers of human bone: Exploring archaeological reconstruction of short term mobility and seasonal climate change. J. Archaeol. Sci. 2019, 111, 105028. [Google Scholar] [CrossRef]
  22. Stark, R.J.; Emery, M.V.; Schwarcz, H.; Sperduti, A.; Bondioli, L.; Craig, O.E.; Prowse, T. Imperial Roman mobility and migration at Velia (1st to 2nd c. CE) in southern Italy. J. Archaeol. Sci. Rep. 2020, 30, 102217. [Google Scholar] [CrossRef]
  23. Francisci, G.; Micarelli, I.; Iacumin, P.; Castorina, F.; Di Vincenzo, F.; Di Matteo, M.; Giostra, C.; Manzi, G.; Tafuri, M.A. Strontium and oxygen isotopes as indicators of Longobards mobility in Italy: An investigation at Povegliano Veronese. Sci. Rep. 2020, 10, 11678. [Google Scholar] [CrossRef]
  24. Symonds, L.; Price, D.T.; Keenleyside, A.; Burton, J. Medieval migrations: Isotope analysis of early Medieval Skeletons on the Isle of Man. Mediev. Archaeol. 2014, 58, 1–20. [Google Scholar] [CrossRef]
  25. White, C.D.; Spence, M.W.; Longstaffe, F.J.; Law, K.R. Testing the nature of Teotihuacan imperialism at Kaminaljuyu using phosphate oxygen-isotope ratios. J. Anthropol. Res. 2000, 56, 535–558. [Google Scholar] [CrossRef]
  26. Deines, P. The isotopic composition of reduced organic carbon. In Handbook of Environmental Isotope Geochemistry; Fritz, P., Fontes, J.C., Eds.; Elsevier: Amsterdam, The Netherlands, 1980; Volume 1, pp. 329–406. [Google Scholar]
  27. Lee-Thorp, J.A. On Isotopes and Old Bones. Archaeometry 2008, 50, 925–950. [Google Scholar] [CrossRef]
  28. Smith, B.N.; Epstein, S. Two categories of 13C/12C ratios for higher plants. Plant Physiol. 1971, 47, 380–384. [Google Scholar] [CrossRef] [Green Version]
  29. Tieszen, L.L.; Boutton, T.W.; Tesdahl, K.G.; Slade, N.A. Fractionation and turnover of stable carbon isotopes in animal tissues: Implications for δ13C analysis of diet. Oecologia 1983, 57, 32–37. [Google Scholar] [CrossRef]
  30. Ambrose, S.H. Isotopic Analysis of Paleodiets: Methodological and Interpretive Considerations. In Investigations of Ancient Human Tissue: Chemical Analyses in Anthropology; Sandford, M.K., Ed.; Gordon and Breach: Philadelphia, PA, USA, 1993; pp. 59–130. [Google Scholar]
  31. Chisholm, B.S.; Nelson, D.E.; Schwarcz, H.P. Stable-Carbon Isotope Ratios as a Measure of Marine Versus Terrestrial Protein in Ancient Diets. Science 1982, 216, 1131–1132. [Google Scholar] [CrossRef] [Green Version]
  32. Schwarcz, H.P.; Melbye, J.; Katzenberg, M.A.; Knyf, M. Stable isotopes in human skeletons of southern Ontario: Reconstructing palaeodiet. J. Archaeol. Sci. 1985, 12, 187–206. [Google Scholar] [CrossRef]
  33. Richards, M.P. Stable isotope analysis of bone and teeth as a means for reconstructing past human diets in Greece. Hesperia Suppl. 2015, 49, 15–23. [Google Scholar]
  34. Lee-Thorp, J.A.; Sealy, J.C.; Van Der Merwe, N.J. Stable carbon isotope ratio differences between bone collagen and bone apatite, and their relationship to diet. J. Archaeol. Sci. 1989, 16, 585–599. [Google Scholar] [CrossRef]
  35. Bocherens, H.; Drucker, D. Trophic level isotopic enrichment of carbon and nitrogen in bone collagen: Case studies from recent and ancient terrestrial ecosystemns. Int. J. Osteoarchaeol. 2003, 13, 46–53. [Google Scholar] [CrossRef]
  36. Hedges, R.E.M.; Reynard, L.M. Nitrogen isotopes and the trophic level of humans in archaeology. J. Archaeol. Sci. 2007, 34, 1240–1251. [Google Scholar] [CrossRef]
  37. Schwarcz, H.P.; Schoeninger, M.J. Stable isotope analyses in human nutritional ecology. Am. J. Phys. Anthropol. 1991, 34, 283–321. [Google Scholar] [CrossRef]
  38. Lubell, D.; Jackes, M.; Schwarcz, H.; Knyf, M.; Meiklejohn, C. The Mesolithic-Neolithic transition in Portugal: Isotopic and dental evidence of diet. J. Archaeol. Sci. 1994, 21, 201–216. [Google Scholar] [CrossRef]
  39. Schoeninger, M.J.; Deniro, M.J. Nitrogen and Carbon Isotopic Composition of Bone-Collagen from Marine and Terrestrial Animals. Geochim. Et Cosmochim. Acta 1984, 48, 625–639. [Google Scholar] [CrossRef]
  40. Bourbou, C.; Fuller, B.T.; Garvie-Lok, S.J.; Richards, M.P. Reconstructing the Diets of Greek Byzantine Populations (6th-15th Centuries AD) Using Carbon and Nitrogen Stable Isotope Ratios. Am. J. Phys. Anthropol. 2011, 146, 569–581. [Google Scholar] [CrossRef]
  41. Lai, L.; Tykot, R.H.; Usai, E.; Beckett, J.F.; Floris, R.; Fonzo, O.; Goddard, E.; Hollander, D.; Manunza, M.R.; Usai, A. Diet in the Sardinian Bronze Age: Models, collagen isotopic data, issues and perspectives. Préhistoires Méditerranéennes 2013, 4, 1–21. [Google Scholar]
  42. Bryant, J.D.; Froelich, P.N.; Showers, W.J.; Genna, B.J. Biologic and climatic signals in the oxygen isotopic composition of Eocene-Oligocene equid enamel phosphate. Palaeogeogr. Palaeoclimatol. Palaeoecol. 1996, 126, 75–89. [Google Scholar] [CrossRef] [Green Version]
  43. Kovács, J.; Moravcová, M.; Újvári, G.; Pintér, A.G. Reconstructing the paleoenvironment of East Central Europe in the Late Pleistocene using the oxygen and carbon isotopic signal of tooth in large mammal remains. Quat. Int. 2012, 276, 145–154. [Google Scholar] [CrossRef]
  44. Arppe, L.; Karhu, J. Oxygen isotope values of precipitation and the thermal climate in Europe during the middle to late Weichselian ice age. Quat. Sci. Rev. 2010, 29, 1263–1275. [Google Scholar] [CrossRef]
  45. Bryant, J.D.; Luz, B.; Froelich, P.N. Oxygen isotopic composition of fossil horse tooth phosphate as a record of continental paleoclimate. Palaeogeogr. Palaeoclimatol. Palaeoecol. 1994, 107, 303–316. [Google Scholar] [CrossRef]
  46. Pellegrini, M.; Pouncett, J.; Jay, M.; Pearson, M.P.; Richards, M.P. Tooth enamel oxygen “isoscapes” show a high degree of human mobility in prehistoric Britain. Sci. Rep. 2016, 6, 34986. [Google Scholar] [CrossRef] [PubMed] [Green Version]
  47. Luz, B.; Kolodny, Y.; Horowitz, M. Fractionation of oxygen isotopes between mammalian bone-phosphate and environmental drinking water. Geochim. Et Cosmochim. Acta 1984, 48, 1689–1693. [Google Scholar] [CrossRef]
  48. Daux, V.; Lécuyer, C.; Héran, M.-A.; Amiot, R.; Simon, L.; Fourel, F.; Martineau, F.; Lynnerup, N.; Reychler, H.; Escarguel, G. Oxygen isotope fractionation between human phosphate and water revisited. J. Hum. Evol. 2008, 55, 1138–1147. [Google Scholar] [CrossRef] [Green Version]
  49. Levinson, A.A.; Luz, B.; Kolodny, Y. Variations in oxygen isotopic compositions of human teeth and urinary stones. Appl. Geochem. 1987, 2, 367–371. [Google Scholar] [CrossRef]
  50. Dotsika, E.; Tsoukala, E.; Zisi, N.; Poutoukis, D.; Psomiadis, D. Palaeo-climatic information from isotopic signatures of fossil teeth in Late Pleistocene from Arkoudospilia Cave (Aridea, N. Greece). In Proceedings of the EGU General Assembly Conference Abstracts, Vienna, Austria, 2–7 May 2010; p. 12246. [Google Scholar]
  51. Dotsika, E.; Lykoudis, S.; Poutoukis, D. Spatial distribution of the isotopic composition of precipitation and spring water in Greece. Glob. Planet. Change 2010, 71, 141–149. [Google Scholar] [CrossRef]
  52. Lykoudis, S.P.; Argiriou, A.A.; Dotsika, E. Spatially interpolated time series of δ18O in Eastern Mediterranean precipitation. Glob. Planet. Change 2010, 71, 150–159. [Google Scholar] [CrossRef]
  53. Dotsika, E.; Diamantopoulos, G.; Lykoudis, S.; Poutoukis, D.; Kranioti, E. Isotopic composition of spring water in Greece: Spring waters isoscapes. Geosciences 2018, 8, 238. [Google Scholar] [CrossRef] [Green Version]
  54. Dansgaard, W. Stable isotopes in precipitation. Tellus 1964, 16, 436–468. [Google Scholar] [CrossRef]
  55. Kohn, M.J.; Welker, J.M. On the temperature correlation of δ18O in modern precipitation. Earth Planet. Sci. Lett. 2005, 231, 87–96. [Google Scholar] [CrossRef]
  56. Panagiotopoulou, E.; Papathanasiou, A. Dietary Reconstruction at the Geometric-Period Burial. Site of Ayios Dimitrios. In Archaeodiet in the Greek World. Dietary Reconstruction from Stable Isotope Analysis; Papathanasiou, A., Richards, M.P., Eds.; The American School of Classical Studies at Athens: Princeton, NJ, USA, 2015; pp. 105–117. [Google Scholar]
  57. Coldstream, J.N. Geometric Greece: 900-700 BC; Psychology Press: Hove, UK, 2003. [Google Scholar]
  58. Triantaphyllou, S. A Bioarchaeological Approach to Prehistoric Cemetery Populations from Central and Western Greek Macedonia; British Archaeological Reports Limited: Oxford, UK, 2001; Volume 976. [Google Scholar]
  59. Chrysostomou, A. Agras - Edessa in the Iron Age; Municipality of Edessa: Edessa, Greece, 2021. [Google Scholar]
  60. Lagia, A. Diet and the Polis: An Isotopic Study of Diet in Athens and Laurion during the Classical, Hellenistic, and Imperial Roman Periods. In Archaeodiet in the Greek World Dietary Reconstruction from Stable Isotope Analysis; Papathanasiou, A., Richards, M.P., Fox, S.C., Eds.; The American School of Classical Studies at Athens: Princeton, NJ, USA, 2015; pp. 119–145. [Google Scholar]
  61. Panagiotopoulou, E.; van der Plicht, J.; Papathanasiou, A.; Voutsaki, S.; Nikolaou, E.; Tsiouka, F. Isotopic (13C, 15N) investigation of diet and social structure in Early Iron Age Halos, Greece. J. Archaeol. Sci. Rep. 2016, 10, 212–220. [Google Scholar] [CrossRef]
  62. Fernández-Crespo, T.; Ordoño, J.; Bogaard, A.; Llanos, A.; Schulting, R. A snapshot of subsistence in Iron Age Iberia: The case of La Hoya village. J. Archaeol. Sci. Rep. 2019, 28, 102037. [Google Scholar] [CrossRef]
  63. Zavodny, E.; Culleton, B.J.; McClure, S.B.; Kennett, D.J.; Balen, J. Minimizing risk on the margins: Insights on Iron Age agriculture from stable isotope analyses in central Croatia. J. Anthropol. Archaeol. 2017, 48, 250–261. [Google Scholar] [CrossRef]
  64. Mnich, B.; Mueller-Bieniek, A.; Nowak, M.; Wilczyński, J.; Pospuła, S.; Szostek, K. Terrestrial diet in prehistoric human groups from southern Poland based on human, faunal and botanical stable isotope evidence. J. Archaeol. Sci. Rep. 2020, 32, 102382. [Google Scholar] [CrossRef]
  65. Nicholls, R.A.; Buckberry, J.; Črešnar, M.; Armit, I.; Mason, P.; Koon, H. Interdisciplinary study of human remains from the Early Iron Age cemetery at Zagorje ob Savi (Slovenia). Arheol. Vestn. 2020, 71, 487–498. [Google Scholar]
  66. Gamarra, B.; Howcroft, R.; McCall, A.; Dani, J.; Hajdú, Z.; Nagy, E.G.; Szabó, L.D.; Domboróczki, L.; Pap, I.; Raczky, P. 5000 years of dietary variations of prehistoric farmers in the Great Hungarian Plain. PLoS ONE 2018, 13, e0197214. [Google Scholar] [CrossRef]
  67. Longin, R. New method of collagen extraction for radiocarbon dating. Nature 1971, 230, 241–242. [Google Scholar] [CrossRef]
  68. Bocherens, H.; Drucker, D.; Fizet, M.; Mariotti, A.; Lange-Badre, B.; Vandermeersch, B.; Borel, J.P.; Bellon, G. Isotopic biogeochemistry (13C, 15N) of fossil vertebrate collagen: Application to the study of a past food web including Neandertal man. J. Hum. Evol. 1991, 20, 481–492. [Google Scholar] [CrossRef]
  69. van Klinken, G.J. Bone collagen quality indicators for palaeodietary and radiocarbon measurements. J. Archeol. Sci. 1999, 26, 687–695. [Google Scholar] [CrossRef]
  70. Bocherens, H.; Koch, P.L.; Mariotti, A.; Geraads, D.; Jaeger, J.-J. Isotopic biogeochemistry (13C, 18O) of mammalian enamel from African Pleistocene hominid sites. Palaios 1996, 306–318. [Google Scholar] [CrossRef] [Green Version]
  71. Dotsika, E.; Zisi, N.; Tsoukala, E.; Poutoukis, D.; Lykoudis, S.; Giannakopoulos, A. Palaeoclimatic information from isotopic signatures of Late Pleistocene Ursus ingressus bone and teeth apatite (Loutra Arideas Cave, Macedonia, Greece). Quat. Int. 2011, 245, 291–301. [Google Scholar] [CrossRef]
  72. O’Connell, T.C.; Hedges, R.E.; Healey, M.; Simpson, A. Isotopic comparison of hair, nail and bone: Modern analyses. J. Archaeol. Sci. 2001, 28, 1247–1255. [Google Scholar] [CrossRef] [Green Version]
  73. Suess, H.E. The radioactivity of the atmosphere and hydrosphere. Annu. Rev. Nucl. Sci. 1958, 8, 243–256. [Google Scholar] [CrossRef] [PubMed]
  74. Reimer, P.J.; Bard, E.; Bayliss, A.; Beck, J.W.; Blackwell, P.G.; Ramsey, C.B.; Buck, C.E.; Cheng, H.; Edwards, R.L.; Friedrich, M. IntCal13 and Marine13 radiocarbon age calibration curves 0–50,000 years cal BP. Radiocarbon 2013, 55, 1869–1887. [Google Scholar] [CrossRef] [Green Version]
  75. Higham, T.; Hogg, A. Evidence for late Polynesian colonization of New Zealand: University of Waikato radiocarbon measurements. Radiocarbon 1997, 39, 149–192. [Google Scholar] [CrossRef] [Green Version]
  76. Phillips, D.L.; Gregg, J.W. Source partitioning using stable isotopes: Coping with too many sources. Oecologia 2003, 136, 261–269. [Google Scholar] [CrossRef]
  77. Fernandes, R.; Millard, A.R.; Brabec, M.; Nadeau, M.-J.; Grootes, P. Food Reconstruction Using Isotopic Transferred Signals (FRUITS): A Bayesian Model for Diet Reconstruction. PLoS ONE 2014, 9, e87436. [Google Scholar] [CrossRef] [Green Version]
  78. Van der Merwe, N.J. Carbon Isotopes, Photosynthesis, and Archaeology: Different pathways of photosynthesis cause characteristic changes in carbon isotope ratios that make possible the study of prehistoric human diets. Am. Sci. 1982, 70, 596–606. [Google Scholar]
  79. Garvie-Lok, S.J. Loaves and Fishes: A Stable Isotope Reconstruction of Diet in Medieval Greece; University of Calgary: Calgary, Canada, 2001. [Google Scholar]
  80. Harrison, R.G.; Katzenberg, M.A. Paleodiet studies using stable carbon isotopes from bone apatite and collagen: Examples from Southern Ontario and San Nicolas Island, California. J. Anthropol. Archaeol. 2003, 22, 227–244. [Google Scholar] [CrossRef]
  81. Ambrose, S.H.; Norr, L. Experimental evidence for the relationship of the carbon isotope ratios of whole diet and dietary protein to those of bone collagen and carbonate. In Prehistoric Human Bone: Archaeology at the Molecular Level; Lambert, J., Grupe, G., Eds.; Springer: New York, NY, USA, 1993; pp. 1–37. [Google Scholar]
  82. Panagiotopoulou, E.; Papathanasiou, A. Dietary Reconstruction at the Geometric-Period Burial Site of Ayios Dimitrios. Hesperia Suppl. 2015, 49, 105–117. [Google Scholar]
  83. Lagia, A. Diet and the polis: An isotopic study of diet in Athens and Laurion during the classical, Hellenistic, and imperial Roman periods. Hesperia Suppl. 2015, 49, 119–145. [Google Scholar]
  84. Triantaphyllou, S. Stable isotope analysis of skeletal assemblages from prehistoric northern Greece. Hesperia Suppl. 2015, 49, 57–75. [Google Scholar]
  85. Valamoti, S.M. Food across Borders: A Consideration of the Neolithic and Bronze Age Archaeobotanical Evidence from Northern Greece; Aegeum: 2007; Volume 30. Available online: http://ikee.lib.auth.gr/record/215301/?ln=en (accessed on 30 October 2021).
  86. Chenery, C.A.; Pashley, V.; Lamb, A.L.; Sloane, H.J.; Evans, J.A. The oxygen isotope relationship between the phosphate and structural carbonate fractions of human bioapatite. Rapid Commun. Mass Spectrom. 2012, 26, 309–319. [Google Scholar] [CrossRef]
  87. d’Angela, D.; Longinelli, A. Oxygen isotopes in living mammal’s bone phosphate: Further results. Chem. Geol. Isot. Geosci. Sect. 1990, 86, 75–82. [Google Scholar] [CrossRef]
  88. Sponheimer, M.; Lee-Thorp, J.A. Oxygen isotopes in enamel carbonate and their ecological significance. J. Archaeol. Sci. 1999, 26, 723–728. [Google Scholar] [CrossRef] [Green Version]
  89. Finné, M.; Holmgren, K.; Sundqvist, H.S.; Weiberg, E.; Lindblom, M. Climate in the eastern Mediterranean, and adjacent regions, during the past 6000 years–A review. J. Archaeol. Sci. 2011, 38, 3153–3173. [Google Scholar] [CrossRef]
  90. Finné, M.; Bar-Matthews, M.; Holmgren, K.; Sundqvist, H.S.; Liakopoulos, I.; Zhang, Q. Speleothem evidence for late Holocene climate variability and floods in Southern Greece. Quat. Res. 2014, 81, 213–227. [Google Scholar] [CrossRef]
  91. Theodorakopoulou, K.; Pavlopoulos, K.; Athanassas, C.; Zacharias, N.; Bassiakos, Y. Sedimentological response to Holocene climate events in the Istron area, Gulf of Mirabello, NE Crete. Quat. Int. 2012, 266, 62–73. [Google Scholar] [CrossRef]
  92. Denton, G.H.; Karlén, W. Holocene climatic variations—their pattern and possible cause. Quat. Res. 1973, 3, 155–205. [Google Scholar] [CrossRef]
  93. Mayewski, P.A.; Rohling, E.E.; Stager, J.C.; Karlén, W.; Maasch, K.A.; Meeker, L.D.; Meyerson, E.A.; Gasse, F.; van Kreveld, S.; Holmgren, K. Holocene climate variability. Quat. Res. 2004, 62, 243–255. [Google Scholar] [CrossRef]
  94. Davis, B.A.; Brewer, S.; Stevenson, A.C.; Guiot, J. The temperature of Europe during the Holocene reconstructed from pollen data. Quat. Sci. Rev. 2003, 22, 1701–1716. [Google Scholar] [CrossRef]
  95. Rosén, P.; Segerström, U.; Eriksson, L.; Renberg, I.; Birks, H.J.B. Holocene climatic change reconstructed from diatoms, chironomids, pollen and near-infrared spectroscopy at an alpine lake (Sjuodjijaure) in northern Sweden. Holocene 2001, 11, 551–562. [Google Scholar] [CrossRef] [Green Version]
  96. Karlén, W. Scandinavian glacial and climatic fluctuations during the Holocene. Quat. Sci. Rev. 1988, 7, 199–209. [Google Scholar] [CrossRef]
Figure 1. Cist graves in EIA Cemetery of Agras.
Applsci 12 00498 g001
Figure 2. δ13Ccol (v-PDB) and δ15Ncol (v-AIR) of human bone collagen of Agras, Edessa [3] and Alexandreia [2] in comparison with domesticated animals [2,11,55] (C3 plants, terrestrial animals) and freshwater and marines fish.
Applsci 12 00498 g002
Figure 3. The mean δ13Ccol (v-PDB) and δ15Ncol (v-AIR) isotopic results of Agras compared with (a) Greek sites and (b) European sites.
Applsci 12 00498 g003
Figure 4. The δ18Ow (v-SMOW) isotopic values of spring waters from the area near Agras and Edessa versus altitude. The open circles are from [19] and the filled ones from this work. The linear regression line has a slope equal to –0.0030 and r2 = 0.83.
Applsci 12 00498 g004
Figure 5. The differences in δ18Oap isotopic values of bone apatite between individuals in (a) Agras and (b) Edessa. In (b) the blue circles indicate men and the red triangles indicate women.
Applsci 12 00498 g005
Figure 6. The differences in δ18Ow isotopic values of ingested water between individuals in (a) Agras and (b) Edessa. The red dashed lines indicate the isotopic range of the waters of the area. In (b) the filled blue circles indicate men and the open triangles indicate women.
Applsci 12 00498 g006
Figure 7. Enamel and apatite δ18O values of Edessa samples. The head of the arrow gives the enamel’s oxygen value (at birth) and the tail gives the apatite’s value (just before death).
Applsci 12 00498 g007
Table 1. δ13Ccol, δ15Ncol, and δ13Cap isotopic values and radiocarbon dating from skeletal remains of Agras in the Early Iron Age period.
Sample’s CodeSexAgeδ13Ccol
(‰)
(v-PDB)
δ13Cap
(‰)
(v-PDB)
δ15Ncol
(‰)
(v-AIR)
C:NΔ13Cap-colDate (BC)Date Error
(Years)
T4bfemale36–50−17.8−13.283.24.3-
T6bmale25–35−20.5−14.98.33.35.6942–89950
T7unknownsubadult−15.6-8.93.5--
T12bunknownsubadult−16.6-11.12.9--
Τ13unknownsubadult−18-9.43.1-881–84450
Τ14indeterminatesubadult−16-103--
T24 KTfemale17–25−16-63.1--
T24 BNfemale36–50−16.5-7.83.2--
T33Baunknownadult−17.4−12.38.135.1-
T50bfemale36–50−16−12.210.93.23.8980–92450
Table 2. IsoSource and Fruit results.
Samples Excluding OutliersT6 OutlierT24KT Outlier
SourceIsoSource ‰Fruits ‰IsoSource ‰Fruits ‰IsoSource ‰Fruits ‰
C319.620.859.459.4-28.6
Terrestrial Animals15.124.64.33.6-27.8
Freshwater43.222.830.832-3.7
Marine18.617.94.93.7-4
C43.613.70.70.9-35
Errors
Samples Excluding the OutliersT6 OutlierT24KT Outlier
SourceIsoSource ‰Fruits ‰IsoSource ‰Fruits ‰IsoSource ‰Fruits ‰
C391232-13
Terrestrial Animals101733-19
Freshwater141653-2
Marine131240.1-2
C4290.80.7-4
Table 3. The δ13C and δ15N isotopic values of various sites in Greece and Europe compared with Agras.
SiteReferencenType of Valueδ13Ccol
(‰)
(v-PDB)
δ15Ncol
(‰)
(v-AIR)
Treis Elies[58]6mean−16.98.3
s.d.1.60.7
Karitsa[58]2mean−16.79.6
s.d.0.30.5
Kladeri[58]5mean−17.19.3
s.d.0.60.7
Makriyalos[5]14mean−18.97.1
s.d.0.50.6
Ayios Dimitrios[82]36mean−19.78.3
s.d.1.21.9
Athens[83]12mean−19.210.6
s.d.0.20.8
Halos, Greece[61]20mean−19.28.2
s.d.0.70.7
Spain[62]19mean−18.710.2
s.d.0.40.9
Croatia[63]36mean−17.09.3
s.d.1.11.0
Slovenia[65]3mean−14.88.8
s.d.0.40.2
Poland[64]26mean−20.19.2
s.d.0.80.6
Hungary[66]52mean−16.610.7
s.d.2.00.3
Table 4. Isotopic values of δ18Oap, the calculated ingested δ18Ow(ap) of apatite data from the archaeological sites of Agras and Edessa, the published results of δ18Ow(en) of enamel for Edessa, and the difference between enamel’s δ18Ow and apatite’s δ18Ow.
Sample’s
Code
Sexδ18Oap (‰)
(v-PDB)
Measured
δ18Oap (‰)
(v-SMOW)
Calculated 1
δ18Ow(ap) (‰)
(v-SMOW) Calculated 2
δ18Ow(en) (‰)
(v-SMOW) 3
abs(Δen-ap) (‰)
EIA Agras
T4bfemale−921.6−10.9-
T6bmale−8.522.1−10.4-
T33Baunknown−7.822.9−9.6-
T50bfemale−8.122.6−9.9-
Roman Edessa
E/T23male−5.824.9−7.5−9.52.0
E/T9male−7.723.0−9.5−9.10.4
E/T27Bmale−9.820.8−11.7−7.64.1
E/T16male−8.522.1−10.4--
E/T4Bfemale−9.920.7−11.8−10.51.3
E/T29female−10.220.4−12.1−10.61.5
E/T20BNfemale−9.521.1−11.4−9.81.6
E/T40Bfemale−7.523.2−9.3−11.01.7
E/T35female−8.122.6−9.9−10.70.8
E/T25female−1020.6−11.9−8.83.1
E/T36BNfemale−7.922.8−9.7−8.71.0
E/T32female−6.524.2−8.2−10.52.3
E/T24female−10.120.5−12.0--
E/T10female−7.423.3−9.2--
E/T17BNAfemale−9.521.1−11.4--
E/T4Afemale−1020.6−11.9--
1 Equation (δ18Oap_VSMOW = 1.03091 δ18Oap_PDB + 30.91) from [71]. 2 Equation (1) (δ18Ow(ap or en) = 1.020δ18O(ap or en) − 32.941) from [19]. 3 Published in [19].
Publisher’s Note: MDPI stays neutral with regard to jurisdictional claims in published maps and institutional affiliations.

