Article

Medium-Energy Synthesis Gases from Waste as an Energy Source for an Internal Combustion Engine

Faculty of Mechanical Engineering, Slovak University of Technology in Bratislava, Námestie Slobody 17, 812 31 Bratislava, Slovakia
*
Author to whom correspondence should be addressed.
Appl. Sci. 2022, 12(1), 98; https://doi.org/10.3390/app12010098
Submission received: 30 November 2021 / Revised: 20 December 2021 / Accepted: 21 December 2021 / Published: 23 December 2021
(This article belongs to the Special Issue Advanced Engine Technologies and Innovative Vehicle Driving Systems)

Abstract

:
The aim of the presented article is to analyse the influence of synthesis gas composition on the power, economic, and internal parameters of an atmospheric two-cylinder spark-ignition internal combustion engine (displacement of 686 cm3) designed for a micro-cogeneration unit. Synthesis gases produced mainly from waste contain combustible components as their basic material (methane, hydrogen, and carbon monoxide), as well as inert gases (carbon dioxide and nitrogen). A total of twelve synthesis gases were analysed that fall into the category of medium-energy gases with lower heating value in the range from 8 to 12 MJ/kg. All of the resulting parameters from the operation of the combustion engine powered by synthesis gases were compared with the reference fuel methane. The results show a decrease in the performance parameters for all operating loads and an increase in hourly fuel consumption. Specifically, for the operating speed of the micro-cogeneration unit (1500 L/min), the decrease in power parameters was in the range of 7.1–23.5%; however, the increase in hourly fuel consumption was higher by 270% to 420%. The decrease in effective efficiency ranged from 0.4 to 4.6%, which in percentage terms represented a decrease from 1.3% to 14.5%. The process of fuel combustion was most strongly influenced by the proportion of hydrogen and inert gases in the mixture. It can be concluded that setting up the synthesis gas production in the waste gasification process in order to achieve optimum performance and economic parameters of the combustion engine for a micro cogeneration unit has an influential role and is of crucial importance.

1. Introduction

The growing energy demand, as well as lowering of the greenhouse gas emissions are pressing scientist to seek new cleaner energy sources. Gasification of municipal solid waste (MSW) is one of the proposed sources of such energy. This helps to cope with the greenhouse emissions in two ways. Waste at landfill sites undergo a four-stage decomposition process which can span over 50 years [1,2]. At first, surplus oxygen causes the waste to undergo aerobic decomposition, releasing carbon dioxide (CO2) and hydrogen (H2) to the atmosphere. In this stage the primary complex molecular chains decompose to simpler ones. After the initial phase, the second anaerobic stage takes place after all of the oxygen (O2) has been used up. This process is highly acidic, with acetic acid, lactic acid, and formic acid being formed in this given phase, as well as alcohols, such as methanol and ethanol. These acids, when mixed with the natural moisture present in the waste, cause decomposition of other parts of the landfill, leading to the release of nitrogen and phosphorus into the soil, which causes an increase in the diversity of anaerobic bacteria. In the third phase, the acidity of the landfill is partially neutralized. The responsibility for consumption of these acids is ascribed to the acid-forming bacteria that metabolise acids from phase two to yield acetate. This metabolic product is subsequently consumed by methanogenic bacteria. Acetate is toxic to acid-forming bacteria, and in this case, it is a symbiotic relationship between these species of bacteria. As a result of such decomposition at this stage, the rate of methane production gradually increases while CO2 production decreases. The last (fourth) phase begins at the point when the production of landfill gas, as well as its composition, is constant. This phase lasts from 20 to 50 years, depending on the composition of the landfill. The parameter that most influences the duration of decomposition is, in particular, the proportion of organic components in the waste. The landfill gas in this phase consists of 45–60% methane, 40–60% CO2, and 2–9% other gases [3,4,5,6].
For this reason, the effective gasification of municipal waste poses an interesting alternative to conventional fossil fuels such as diesel, gasoline or natural gas for production of heat and electricity in combined heat and power cycles [7,8,9]. Gasifying the MSW or biomass by means of gasification or pyrolysis, the MSW can be directly converted to gas consisting mostly of methane, ethane, hydrogen, carbon monoxide, carbon dioxide, and nitrogen [10,11,12,13,14]. The composition of the gas is strongly dependent on the feedstock and type of the process or reactor used. The syngas from the process can be converted to higher hydrocarbons which can substitute the oil-based conventional fuels [7,15]. The biodiesel is commonly made through the transesterification of biologically degradable waste. The advantage of such biodiesel fuels is the high cetane number, good lubricity, non-toxicity, and low content of cetane [16,17,18,19,20]. Vegetable oils, animal fats, and all unsaturated lipids can be used for the production of biodiesel fuel [21]. Apart from transesterification, Fischer–Tropsch (FT) synthesis historically relied on natural gas and coal to produce fuels. Today, syngas can be used as an alternative to produce a range of various synthetic fuels such as FT diesel or gasoline [7,22].
It is also possible to burn syngas in an internal combustion engine (ICE) without prior preprocessing thanks to the relatively high content of combustible compounds [15]. In current research, only representations of syngas composition premixed in pressure bottles were analysed and not actual syngas from the reactor.
As was shown by [7], the incineration energy output tends to be higher than that of a gasifier-CHP (Combined Heat and Power) system. This mainly arises from the fact that ICE requires extensive pre-treatment and cleaning of the syngas from impurities such as tars, particulate matter, alkali metals, and sulphur compounds, which is a rather energy-demanding process [23]. For internal combustion engines, the limits on particulate matter (PM) and tars are of the highest priority. Particulate matter tends to block various system nozzles, mainly those of the injectors. For this reason, the maximum concentration of PM cannot exceed the limit of 50 mg/N m3, and the maximum size is limited to 10 μm [24]. The limits on tars cannot exceed 100 mg/N m3 [25,26]. Tars are created mainly during the condensation phase and consists of three distinct stages. The primary tars are created during the pyrolysis phase at temperatures below 500 °C. The composition of these tars mainly depends on the type of feedstock or biomass used [25,27]. These begin to rearrange with sufficient oxygen supply at temperatures above 500 °C to form secondary tars. As the temperature in the reactor exceeds 800 °C, tertiary tars are formed, for which a sufficient chemical kinetics model has not yet been described. The performance of the ICE, for the given fuel mixture, depends mainly on the effective efficiency and volumetric efficiency. To achieve a higher volumetric efficiency, the syngas needs to achieve the lowest temperature possible. It is also necessary to remove the moisture created during the gasification stage. By lowering the temperature from 100 °C to ambient temperature, most of the tars are already condensed. These condensates cause clogging and fouling of the pipes and additional equipment in the combustion engine intake system [24].
As the cleaned syngas contains a relatively high amount of hydrogen, the backfire ignition is a relatively common problem with such types of engine. As the fresh charge enters the combustion chamber, the mixture ignites and propagates back through the intake manifold in the direction of the gas carburettor and can damage the mixing chamber, MAF sensor or another intake system element. By introducing a direct injection into the system, this backfire problem can be eliminated [28]. As the gasifier feedstock changes over time, two main problems arise. The direct injection would need its timing changed based on the fuel composition. Further, such systems are mostly more costly in terms of acquisition as well as upkeep prices. Therefore, such a system for eliminating backfire is not viable for heavy duty engines in CHP systems. The undesired effect of backfiring in the intake pipe can be lowered by incorporation of the EGR [29]. EGR technology is commonly used in hydrogen experiments as a way to reduce the symptoms of abnormal combustion. Besides the use of EGR, an increase in the air excess ratio is also used to suppress the manifestations of abnormal combustion. However, the EGR has a major advantage over the latter approach in that it maintains a stoichiometric mixture, which allows for the installation of a 3-way catalyst to reduce harmful emissions [30]. The implementation of EGR increases the concentration of CO2 in the fresh mixture as CO2 is sucked in from the exhaust gases. In this way, it is possible to make the mixture inert, though it reduces the effective efficiency of the engine as well as the heating value of the mixture entering the cylinder. The ignition delay and the overall burning rate also increase [31,32]. By using EGR, it is also possible to achieve partially premixed combustion (PPC). In this case, it is a combustion of a layered mixture ignited on the compression principle, with the EGR level reaching 50% [33]. In this way, the combustion of conventional fuels, such as petrol [34], diesel [35], and alcohols [33], is possible. In the combustion of these fuels, this strategy has secured a reduction of emissions while increasing the indicated efficiency. In the case of synthesis gases, such an approach to gas combustion is little studied. As mentioned above, in the case of cogeneration units, it is also necessary to evaluate both the service and operating costs of such a combustion strategy.

2. Waste Management in Slovakia

The Environmental review of Slovak Republic states that total municipal waste produced in Slovakia in 2018 reached a value of 2,325,178 t or 427 kg per capita. Landfilling is still a major issue, as 53.8% of the municipal waste is landfilled in the Slovak Republic [36]. Recycling accounted only for 38.1% of the total municipal waste management. According to the Envirostrategy 2030, recycling of municipal waste in Slovakia should reach 60% by the year 2030 and the amount of landfilling should not exceed 25% of the total waste management by the year 2035 [37].
According to the Institute of Circular Economy, municipal waste in the Slovak Republic consists predominantly of bio-degradable waste which makes up 45% [38]. Out of common recyclable waste, paper makes up 14% and plastic 11% of the total municipal waste. The textile, metals, drinking cartons, and mixed waste share 4% of the total waste mass. The mixed waste, which is an ideal candidate for gasification, accounts only for 4% of the total mass of municipal waste. Currently, there are two WtE plants in Slovakia, located in capital city Bratislava and second largest city of Košice. The landfill amount in Bratislava reaches 9% of the total waste produced and only 1% in Košice. The negative effect of incineration of the waste in these cities is mainly due to the low recycling rate. The recycling rate in Bratislava is only 33%. The recycling and collection of biodegradable waste in Košice is 36%. The landfilling situation is the worst in regional cities of Trenčín and Prešov. Landfilling in both regional cities accounts for 60% of the total waste management. The waste management disparity of various cities in Slovakia can be found in Table 1 [39].
In the case of the EU-28, 489 kg per capita of municipal waste was produced per citizen per year. However, this value is the average, with the highest waste production recorded in Denmark at 766 kg per capita. By contrast, Romania achieved production at only 272 kg per capita. Nevertheless, such statistics are somewhat inaccurate, as it is not possible to include inadequacy in the law, different or inaccurate reporting of results, as well as illegal waste disposal in the environment. Recycling in the EU-28 is reported to be 47%. As mentioned above, landfilling, which is considered to be the worst waste management activity, reached a level of 23% [40]. In the case of waste incineration, it is necessary to discriminate between the operations D10 and R1, with only R1 being taken as operation WtE. In the case of D10 incineration, i.e., incineration without energy recovery, 4 kg per capita or 2,020,000 tons/y were burned in the EU-28. This value represents 0.81%, and 136 kg per capita or 68,680,000 tons per year were used for energy recovery, which means loading into landfills at the level of 27.8%. However, it should be noted that these data are only estimated on the basis of EUROSTAT analyses [41]. According to a 2015 study, 248 WtE plants could be built in the EU, thus increasing the energy production capacity from 406 to 666 PJ [42].

3. Experimental Methods

The following are the selected compositions of synthesis gases resulting from the above analysis of the production of synthesis gases produced from waste. This article analyses twelve synthesis gases which, with their lower heating value (8–12 MJ/kg), fall into the category of medium-energy gases. The applications of low-energy synthesis gases produced by waste gasification as used in the internal combustion engine were published by the authors of this article in 2020 [43].
The following figure (Figure 1) shows the ternary diagrams representing the composition of the selected and analysed synthesis gases, numbered 1 to 12, relative to the proportion of inert gases. Synthesis gas SG3 was the only gas with the highest proportion of inert gases (60% vol.). The basic physico-chemical properties of experimentally proven synthesis gases are given in Table 2. The individual synthesis gases are in ascending order, depending on the increasing lower mass heating value of the fuel. As is well known, the power parameters of the internal combustion engine will be influenced in particular by the lower volume heating value of the fuel and air mixture (LHVmixture), as this determines how much energy is supplied in the cylinder over one cycle, assuming the same volumetric efficiency.
Other important factors affecting the overall engine performance parameters are the fuel burn-up rate and, last but not least, the volumetric amount of products generated after combustion.
All experimental measurements were performed on a Lombardini LGW702 atmospheric internal combustion engine (Table 3).
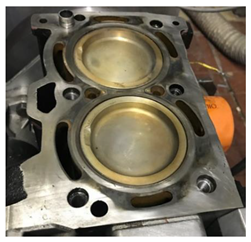
The two-cylinder ignition engine was created as a modification from the original diesel version by adjusting the head of the internal combustion engine, as well as the compression ratio, the intake manifold, and the method of preparing the mixture. The piston crowns were lathe turned and grinded to achieve a compression ratio of 12.5 from the original ratio of 22.8, [44]. This internal combustion engine was used for the experiments with the aim to reduce the operating costs of fuels for the experimental measurements.
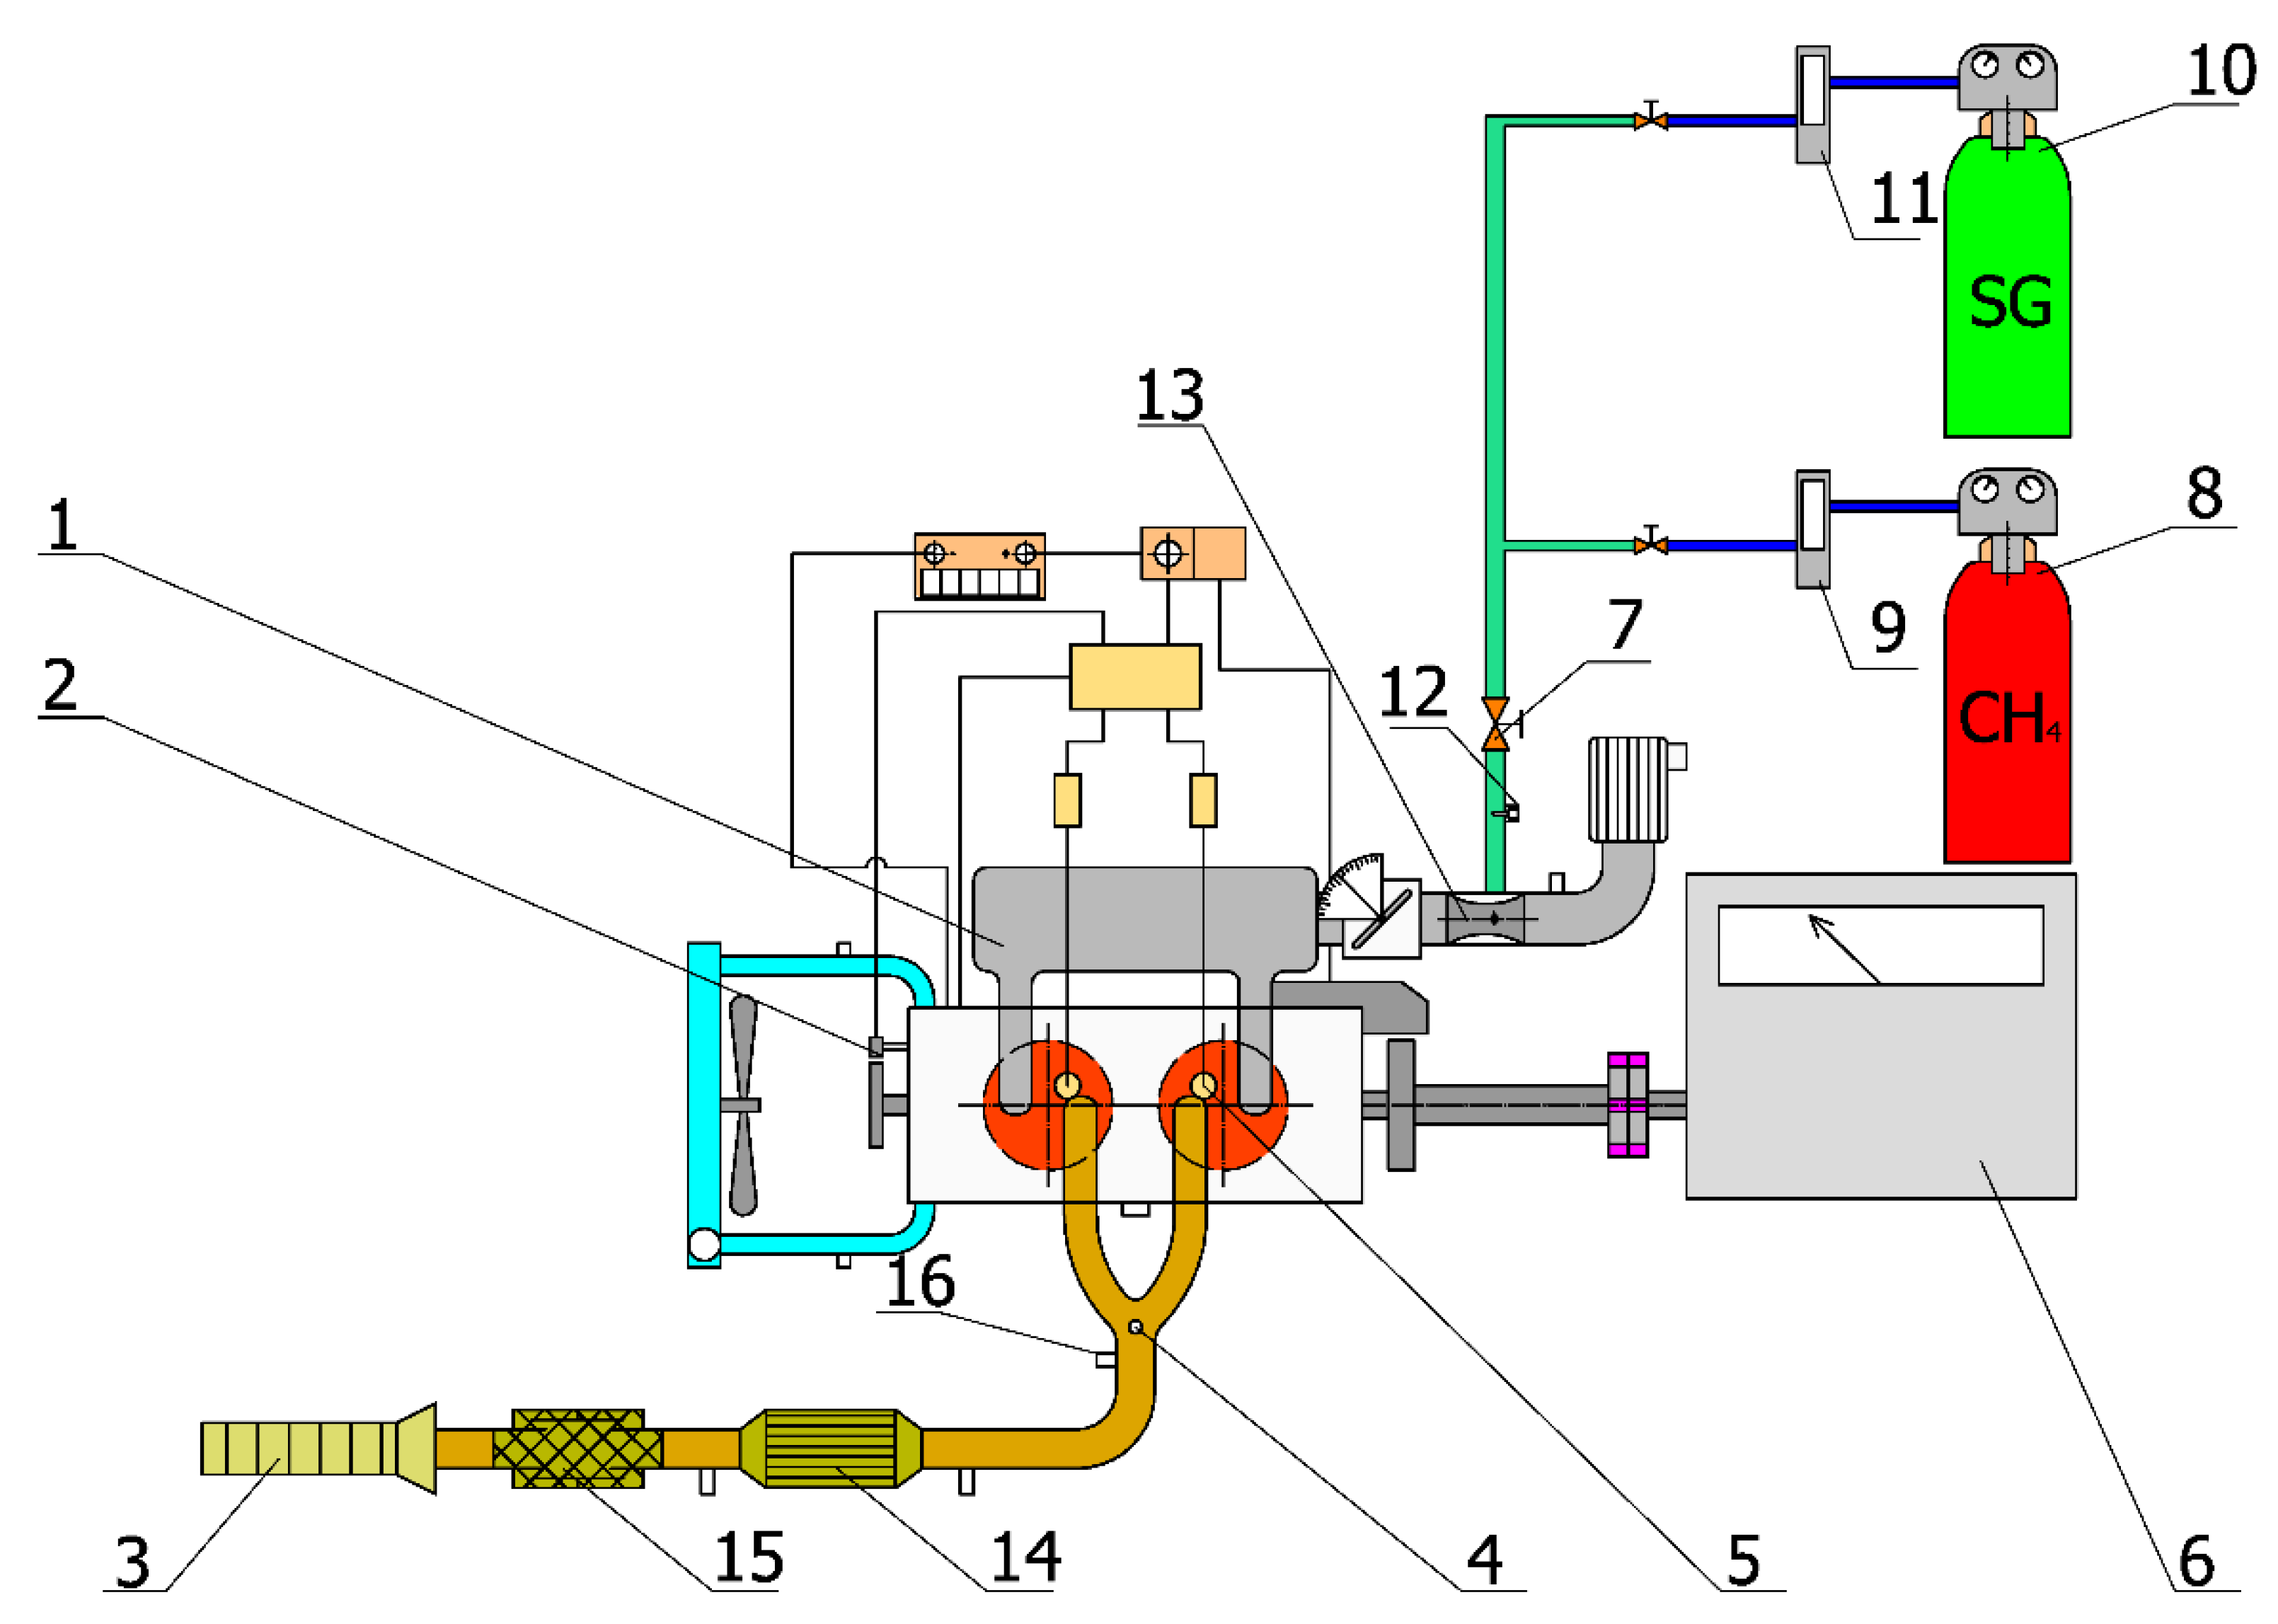
The scheme of the experimental equipment together with a description of the individual components is shown in the following figure (Figure 2). The internal combustion engine was connected to an electric induction dynamometer MEZ Vsetín 1DS 736 V (from MEZ Vsetín, Czech Republic), which can operate in both motor and generator modes of operation. Gaseous fuel mass flow was measured with a flow-meter from Bronkhorst (device designation: F-113AC-M50-AAD-55-V). Nitrogen was set as the reference gas for this flow-meter. To obtain the actual synthesis gas mass flow rate, the mass flow was multiplied by the mass factor coefficient specific to each synthesis gas mixture composition [45].
All experimental measurements were performed with stoichiometric mixture, which was provided by the feedback control of the control unit by means of a broadband lambda probe (device designation: Bosch LSU 4.9) located in the exhaust pipe and a stepper motor that regulates the gas-flow to the mixer.

Analysis of the Pressure in the Cylinder

The measurement of pressure profiles in the internal combustion engine was performed at the operating speed of the micro-cogeneration unit of 1500 L/min. The pressure was measured using a sensor system from Kistler, Switzerland. The cylinder pressure was measured using a piezoelectric pressure transducer integrated in a spark plug from Kistler (6118CC-4CQ02-4-1). Corrections of the dynamic pressure profile in the cylinder were carried out by detecting the pressure profile in the suction line, in the region of the bottom dead centre at the time of opening of the suction valve, when equivalence of the pressure values was assumed. The absolute value of the intake manifold pressure was read using a piezoresistive pressure transducer from Kistler (4075A10). The current position of the crankshaft was measured using a Kistler 2613B1 encoder. For fuel burn-up analysis, the actual spark ignition moment was also recorded for each cycle using a separately developed diode-optocoupler sensor, which was connected in parallel with two BOSCH P65-T combined ignition coils with a maximum spark energy of 65 mJ, [46]. An individual program for processing and evaluating measured data was developed using the general programming language Matlab.
The analysis of the course of fuel burning out process was based on a single-zone zero-dimensional thermodynamic model [47,48]. The analysis of the course of fuel combustion and heat release is based on the Rassweiler-Withrow method. This method is based on the knowledge that the pressure increase in the combustion chamber of the engine consists of a partial component of the pressure arising from the combustion itself and a partial component arising from the movement of the piston in the cylinder. In general, the method is based on the first law of thermodynamics in the following form:
d U = d Q d W + i h i . d m i ,
where: dU—change of internal energy of matter in the system; dQ—heat delivered to the system; dW—the work produced by the system; hi.dmii-th component of enthalpy of mass flow across system boundaries.
By detailed writing and modifying the above Equation (1), we get the following form:
d Q c h = 1 κ 1   V d p + κ κ 1 p d V + ( u r T κ 1 ) d m c e l k i h i d m i + d Q h t .
During combustion, the last three terms of Equation (2) are assumed to be zero, and subsequently the final pressure increment shape is obtained from two partial increments:
d p = κ 1 V d Q κ p V d V = d p c + d p p .
In Equation (3), the first term (dpc) represents the pressure change owing to combustion and the second term (dpp) represents the incremental change owing to the change in volume.
The start and end of combustion (SOC, EOC, respectively) were determined by the change in entropy during combustion. This method is explained in more detail in the literature [49]. The second method determining the beginning and end of combustion was implemented on the basis of the deviation of the combustion curve from the compression or expansion curve in the logarithmic p-V diagram.
From each measured pressure profile (approximately 195 consecutive cycles), statistical analysis was also evaluated to determine the coefficients of variation (COV) of the various cyclically repeating parameters. It is calculated as the ratio of the standard deviation to the arithmetic mean of the investigated parameter, using the following formula:
C O V = 1 n 1 i = 1 n x i x ¯ x ¯ .100   [ % ] .
Cycle variability deals with the uniformity of engine operation as well as the overall life of the internal combustion engine and also affects the engine performance parameters.
All synthesis gases were tested in the speed range from 1200 to 2200 1/min, with stoichiometric mixture and at full load. The spark advance angle was optimized for each engine operating mode to achieve maximum torque. All output integral parameters were reduced to normal ambient conditions (20 °C, 101,325 Pa).

4. Experimental Results

The basic comparative fuel for the analysis of the effect of synthesis gases on the parameters of the internal combustion engine was methane, to which the results obtained by the combustion of synthesis gases have been compared. The following graphs show the integral parameters in two groups to a constant proportion of inert gases in the synthesis gases. In the first group are synthesis gases with 30% vol. proportion of inert gases. In the second group are gases with 45% vol. proportion of inert gases, and the gas designated SG3 has 60% vol. proportion of inert gases in its base.

4.1. Integral Parameters of the Combustion Engine

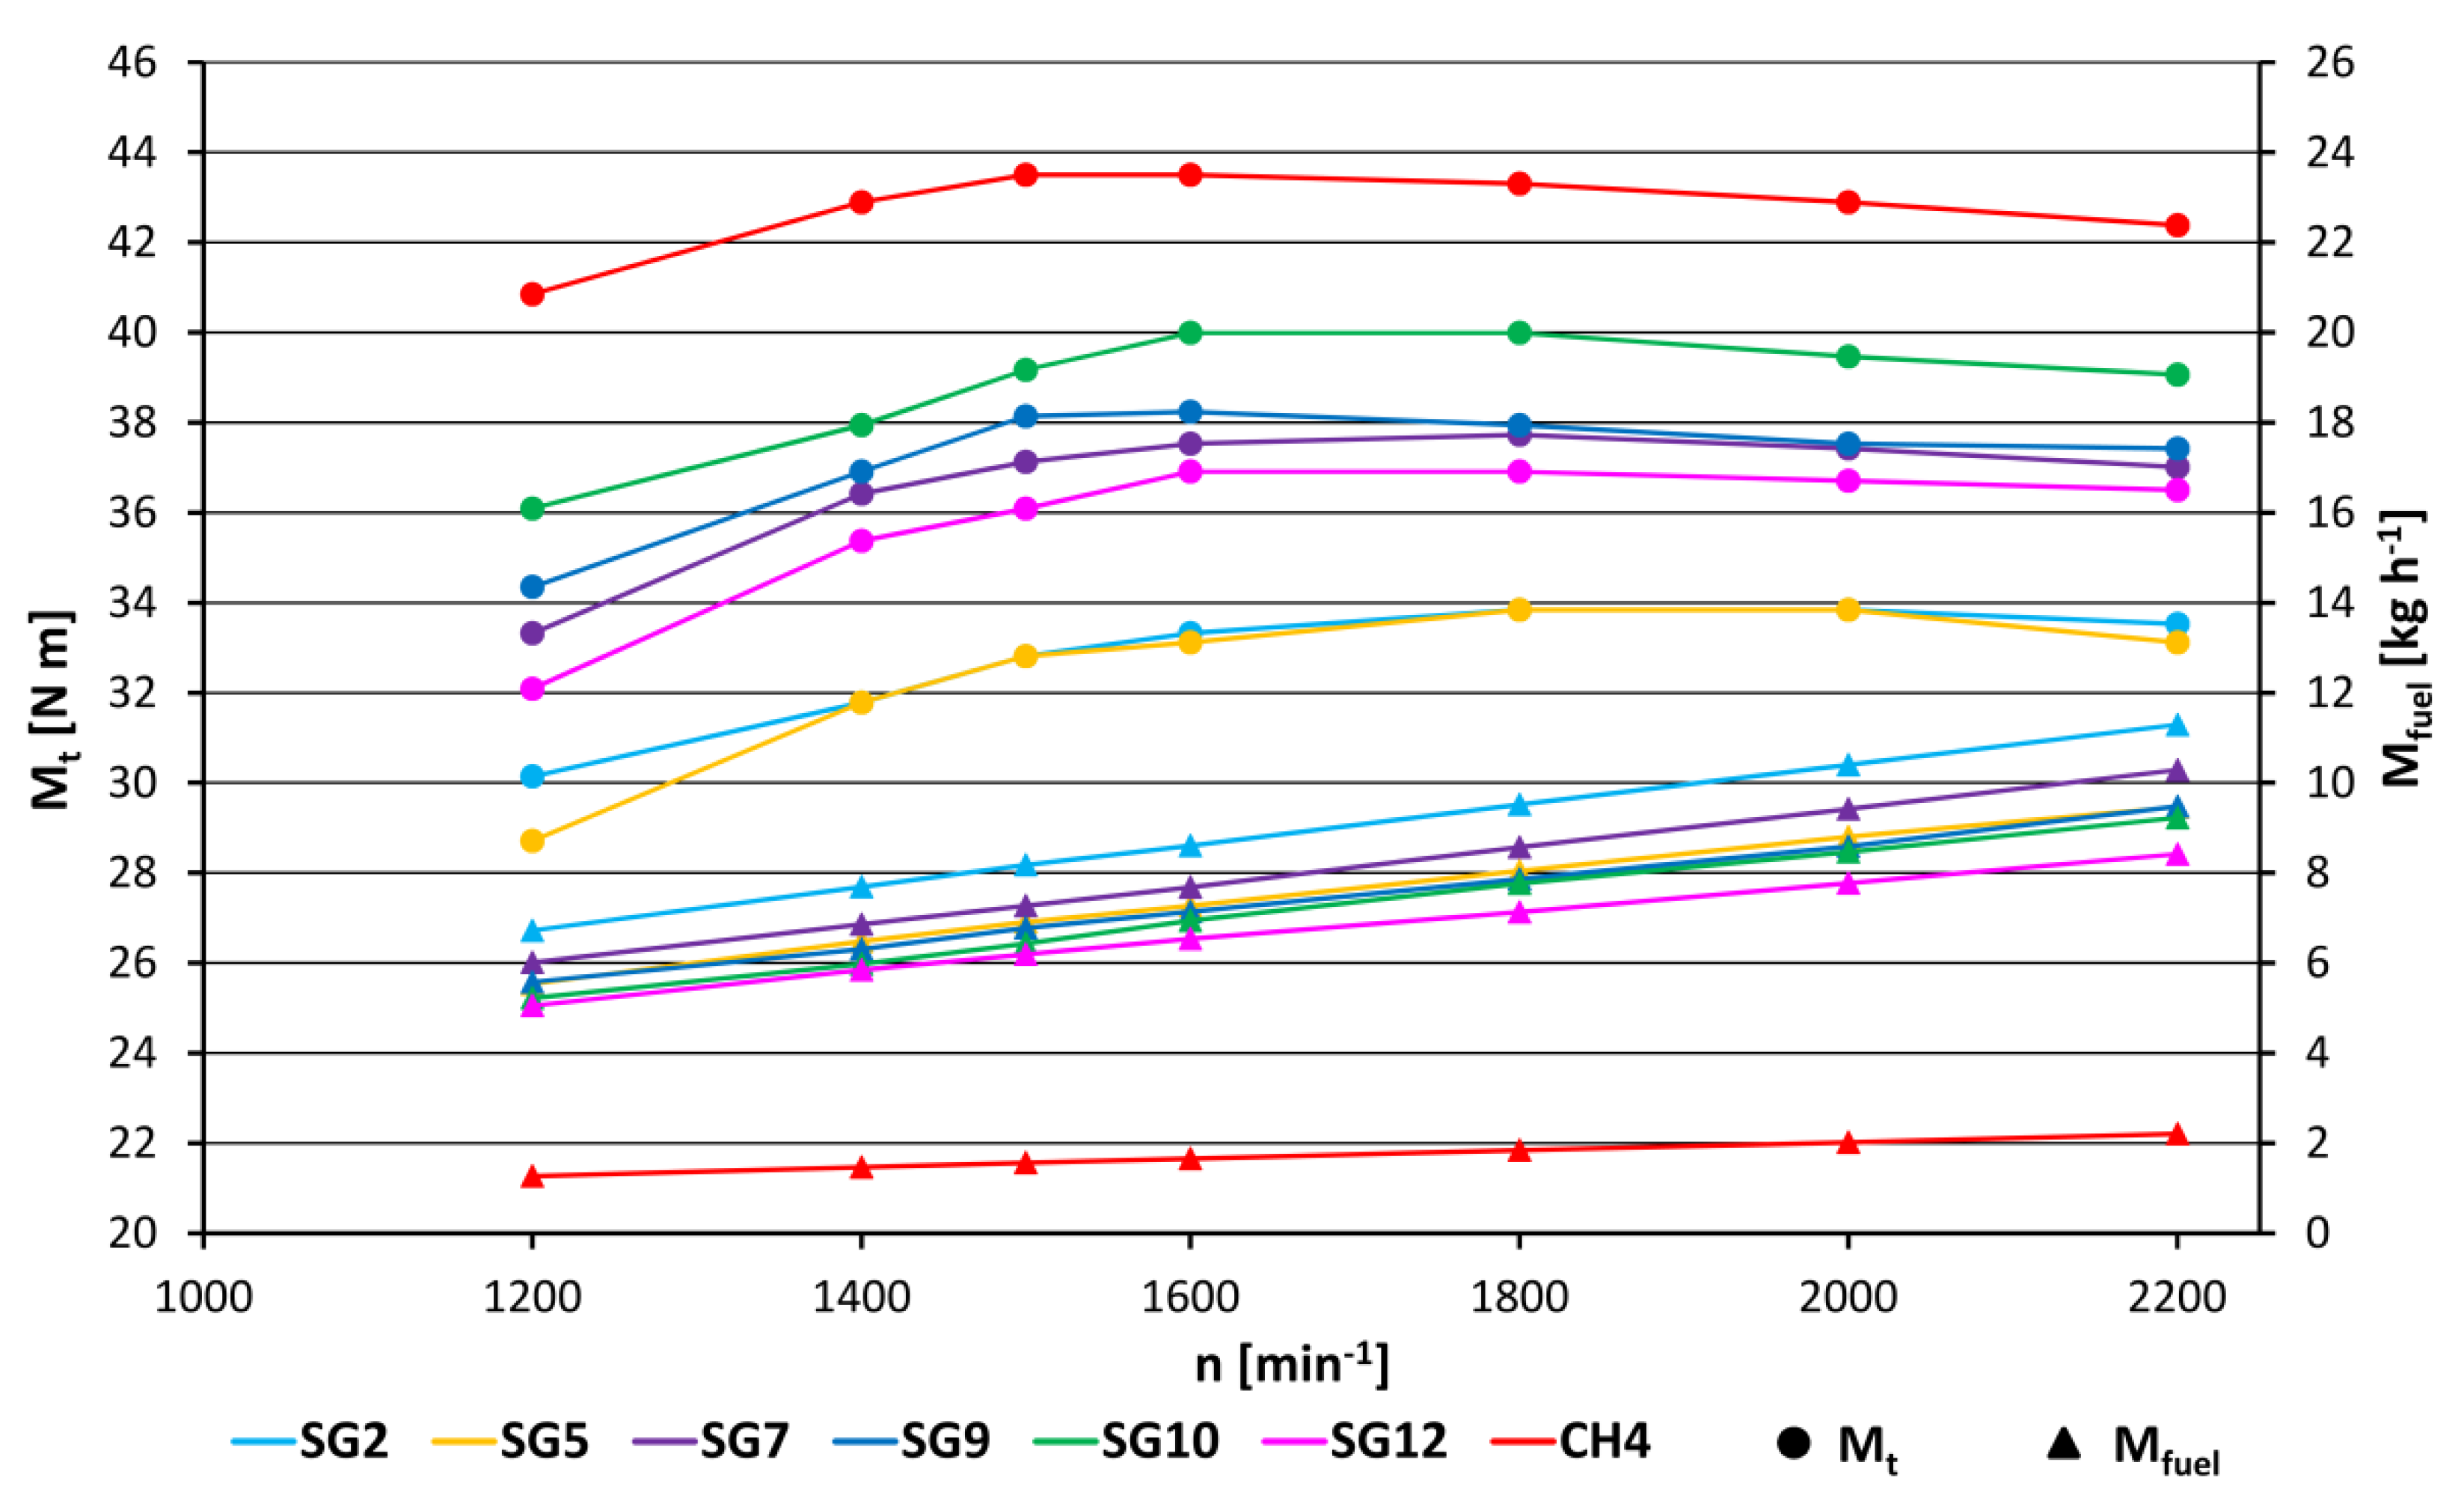
The following two graphs (Figure 3 and Figure 4) show the torque and hourly fuel consumption profiles in the main speed characteristic for the various gaseous fuels classified into the two groups mentioned above. A preliminary analysis of the physical–chemical properties shows that SG10 has the highest volume heating value of the stoichiometric mixture of fuel and air (3.030 MJ/m3) and the synthesis gas SG3 has the lowest (2.619 MJ/m3). Therefore, the highest power parameters can be expected when burning SG10 synthesis gas, as the main factor influencing the output power parameters is the energy contained in the cylinder. Another factor is the value of filling the cylinder with fresh mixture, which is expressed as the volumetric efficiency. An equally important factor is the rate of fuel combustion as well as the volume of products after combustion. It can be seen from the graphs that the highest value of torque (39.2 N m) at operating speed 1500 L/min is achieved precisely during the combustion of the named synthesis gas SG10. The torque drop during SG10 operation is approximately 10% compared to methane operation in the full engine speed range. On the contrary, the lowest torque value (32.3 N m) is achieved when the engine is operating on SG1 fuel with a volume heating value of the mixture of 2.707 MJ/m3.
When comparing hourly fuel consumption, the lowest hourly consumption (1.56 kg/h) is for the reference fuel methane, which requires only 9.5% vol. to form a stoichiometric mixture with air. The value of the volume fraction of synthesis gases in the stoichiometric mixture ranges from 24.5% vol. for SG10 up to 37.5% vol. for SG2 or for SG5. The maximum hourly fuel consumption (8.17 kg/h) at operating speed of the micro-cogeneration unit 1500 L/min was when the unit was operating on SG2 synthesis gas, which had the highest volume fraction of fuel (37.5% vol.) in the stoichiometric mixture with air, and this gas also had a higher stoichiometric mixture density (1.090 kg/m3) than the SG5 gas. On the contrary, the lowest hourly fuel consumption (5.73 kg/h) was measured when operating a gas engine with the synthesis gas SG11, which had 26.7% volume in a stoichiometric mixture with a density of 1.131 kg/m3 owing to the fact that the synthesis gas SG10 has a mixture density of 1.185 kg/m3, though it has a smaller proportion in the air mixture than SG11 gas. The highest value of total effective efficiency (31.6%) at 1500 L/min was achieved during methane operation. Among the synthesis gases, the highest efficiency 31.2% was the synthesis gas with the designation SG10 followed by SG8 (31.1%), SG11 (31.1%), and SG9 (30.8%). On the contrary, the lowest effective efficiency (27%) occurred when operating on SG2 synthesis gas.

4.2. Internal Parameters of Combustion Engine

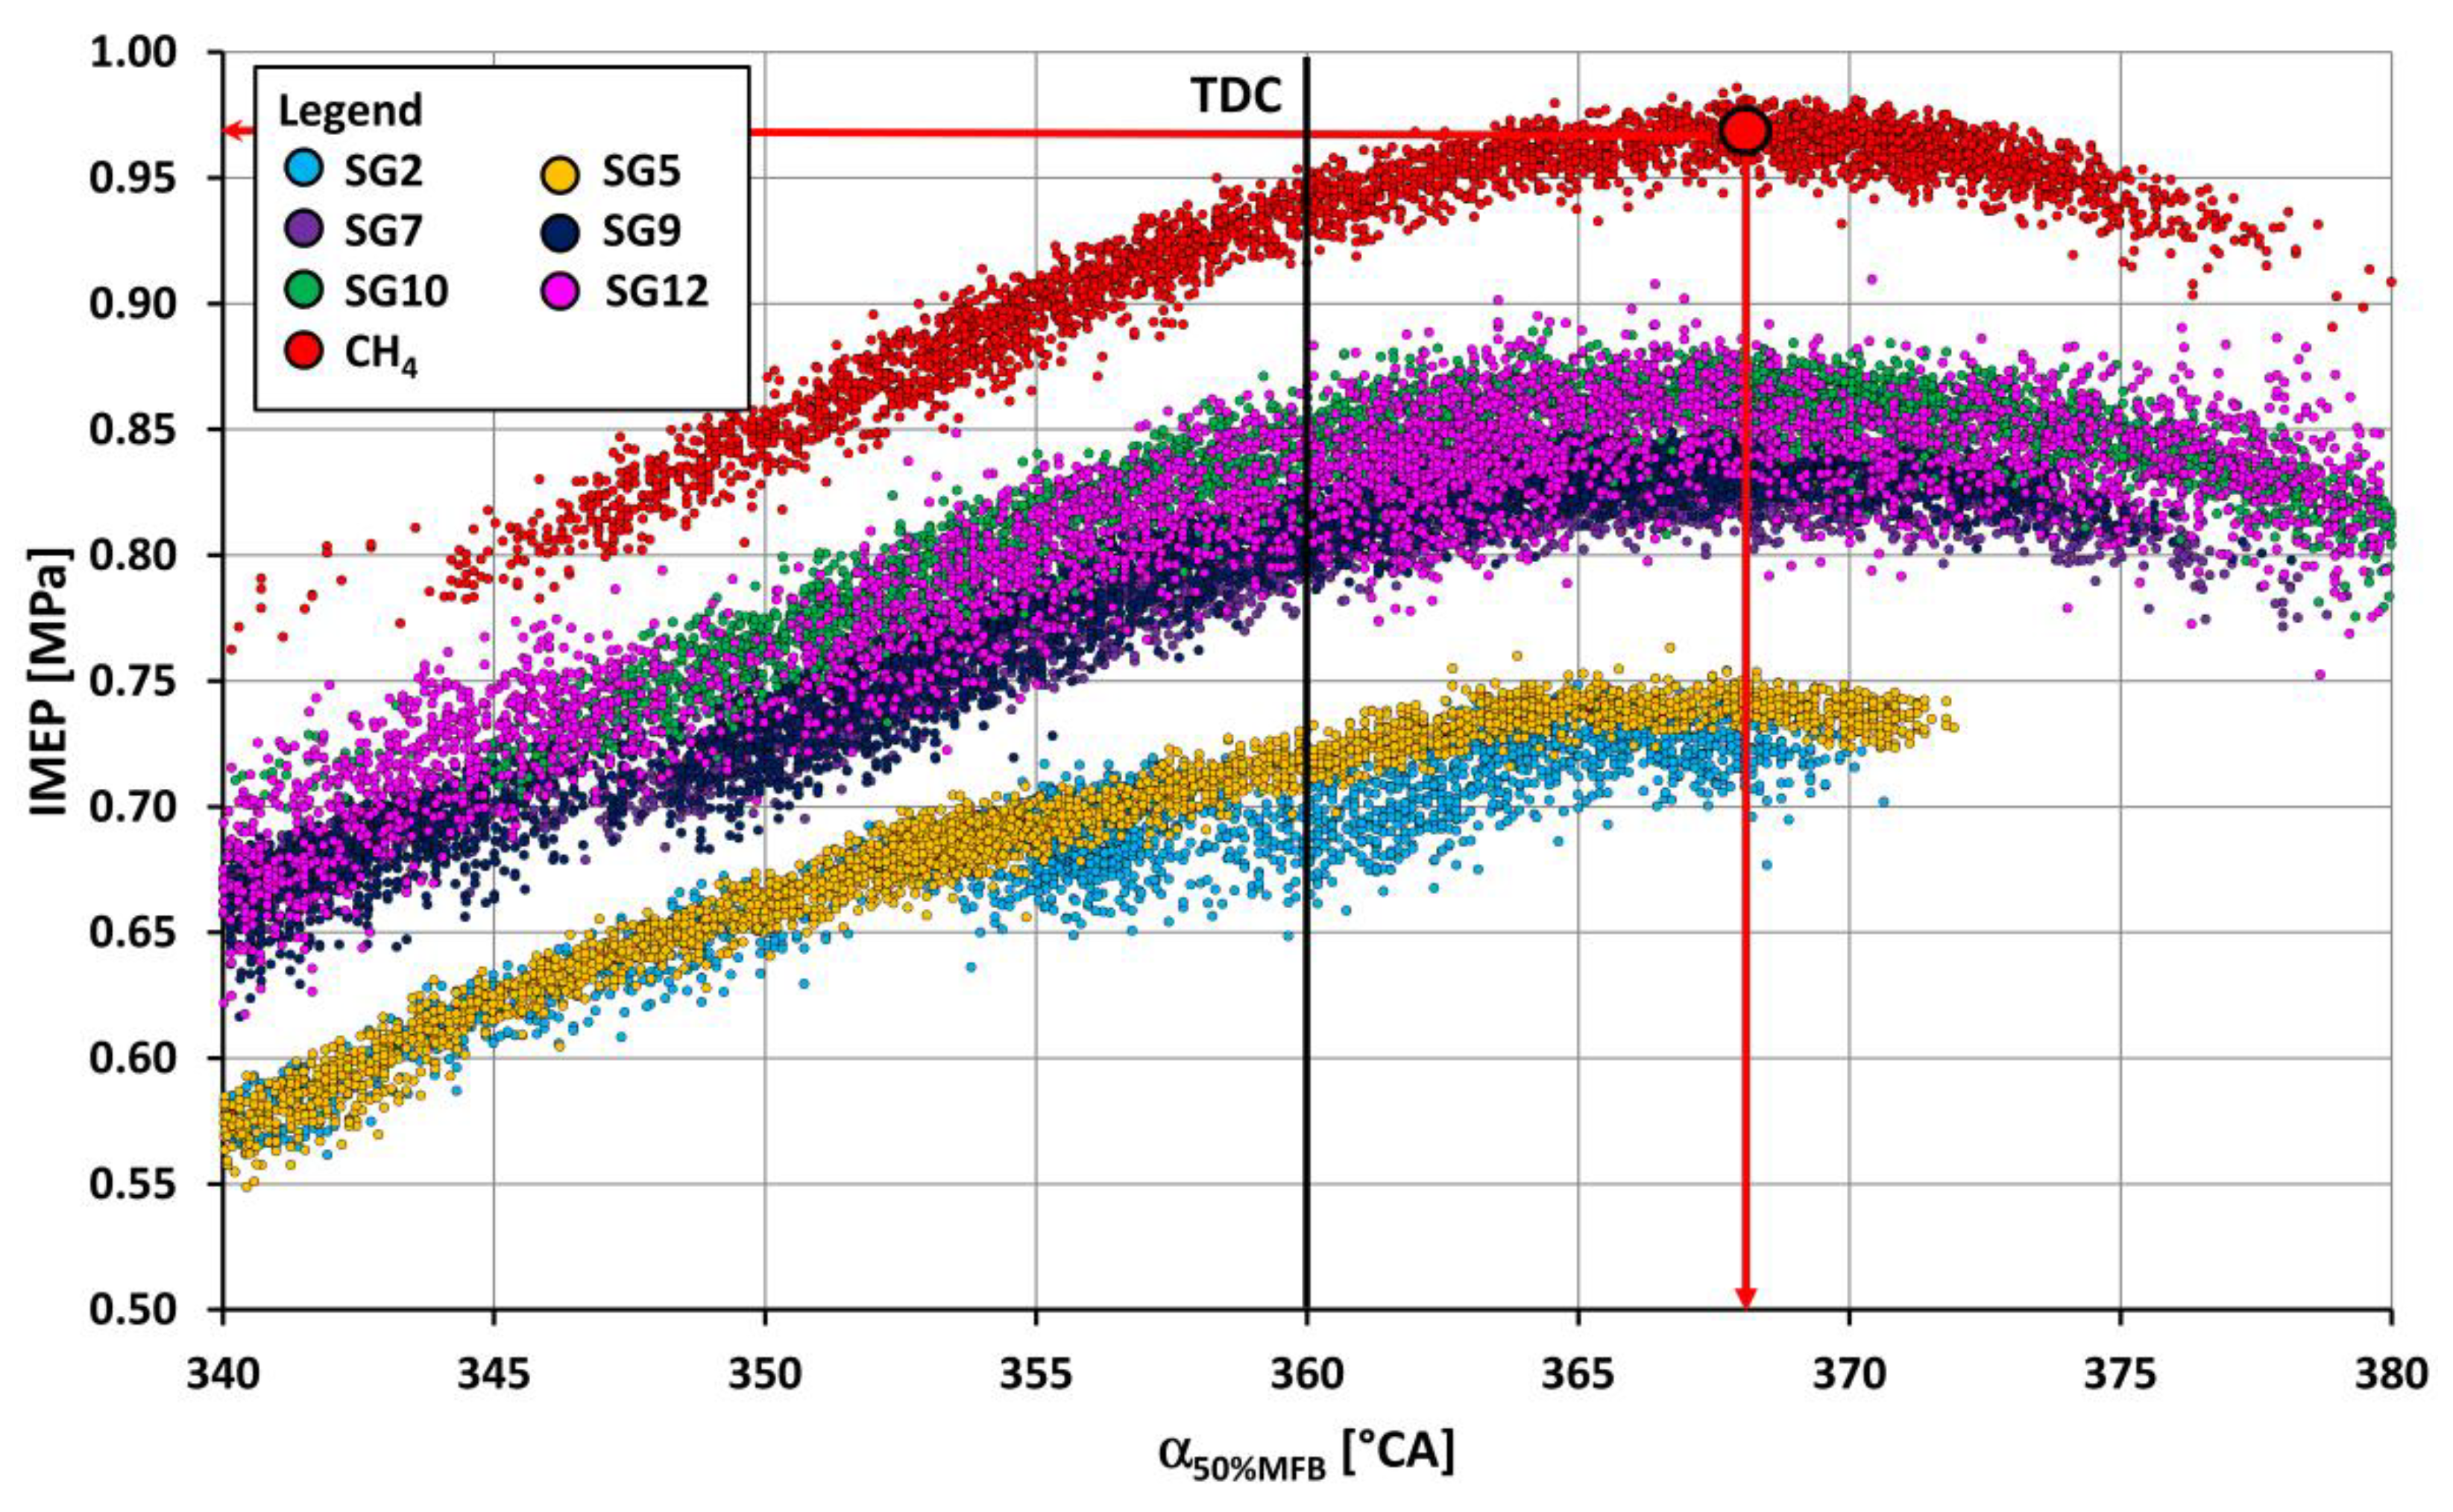
Figure 5 and Figure 6 show the mean indicated pressure (IMEP) profiles as the function of the crankshaft rotation angle at which 50% of the fuel is burned. The IMEP profile for each fuel was created from a set of measurements at different spark advance angles, ranging from the smallest spark advance, ensuring continuous engine operation up to 40 °CA BTDC. For each operating mode, 195 consecutive cycles were evaluated. The highest average IMEP value (0.965 MPa) was reached when operating on methane. At this IMEP value, the angle, at which 50% fuel is burned, was 8.6 °CA ATDC. The optimum spark advance angle for methane combustion was 26 °CA BTDC. Out of the synthesis gases, the highest IMEP value (0.863 MPa) was reached by the gas marked SG10 (angle α50MFB has a value of approx. 7.5 °CA ATDC). The lowest value of IMEP (0.702 MPa) occurred when burning the gas with the designation SG1 and at reaching the angle when 50% of the fuel is burned approx. at 9.1 °CA ATDC. The variance of the individual IMEP values, as can be seen in Figure 5 and Figure 6, is characterized by the coefficient of variation (COV) of the mean indicated pressure. For the optimum spark advance angle, this value for methane combustion was 0.58%. During the operation of the combustion engine on synthesis gases, the coefficient of variation ranged from 1.01% for synthesis gas SG10 to 2.04% for synthesis gas SG12. This phenomenon is caused by the high proportion of hydrogen (40% vol.) in the mixture and, at the same time, a low proportion of methane (10% vol.) in SG12 gas.
The following developed p-α diagrams (Figure 7 and Figure 8) show the average pressure profiles p in the cylinder during compression and expansion as a function of the crankshaft angle α, for synthesis gases and methane. The pressure curves are plotted at the optimum spark advance angles (maximum IMEP achieved) for each fuel. When operating on methane, the highest pressure value (6.04 MPa) was reached at the angle 12.8 °CA ATDC. Out of the synthesis gases, during operation with the optimum spark advance angle, the highest pressure (5.98 MPa) was reached for SG5 synthesis gas. The lowest value for maximum pressure (4.77 MPa) was measured in operation on SG8.
From the comparison of the coefficient of variation of the maximum pressure, the highest value (8.9%) was for the synthesis gas SG11. On the contrary, the lowest value (2.7%) was for SG5 fuel, which contained the highest proportion of hydrogen (50% vol.) out of the studied gases. Further, SG2 gas, which in its base has 40% vol. of hydrogen, had a relatively low value of the coefficient of maximum pressure variation (3.2%). The reference fuel methane had the maximum coefficient of variation for pressure (6.8%). In general, it can be stated that by increasing the percentage of hydrogen in the synthesis gases, the value of the coefficient of variation decreases.
The value of the optimum spark advance angle ranged from 12 °CA BTDC for SG5 (high hydrogen content 50% vol., which has a high burning rate) to 34 °CA BTDC for SG3, because of a high inert gas content (60% vol.), which slows down the burning rate. The pressure rise rate value for the reference fuel (methane) was 0.225 MPa/1 °CA. The highest pressure rise rate value (0.249 MPa/1 °CA) was recorded during the combustion of SG5 gas, which can be attributed to the already mentioned high proportion of hydrogen in the mixture. The lowest value of pressure rise rate (0.144 MPa/1 °CA) was achieved with SG8 synthesis gas.
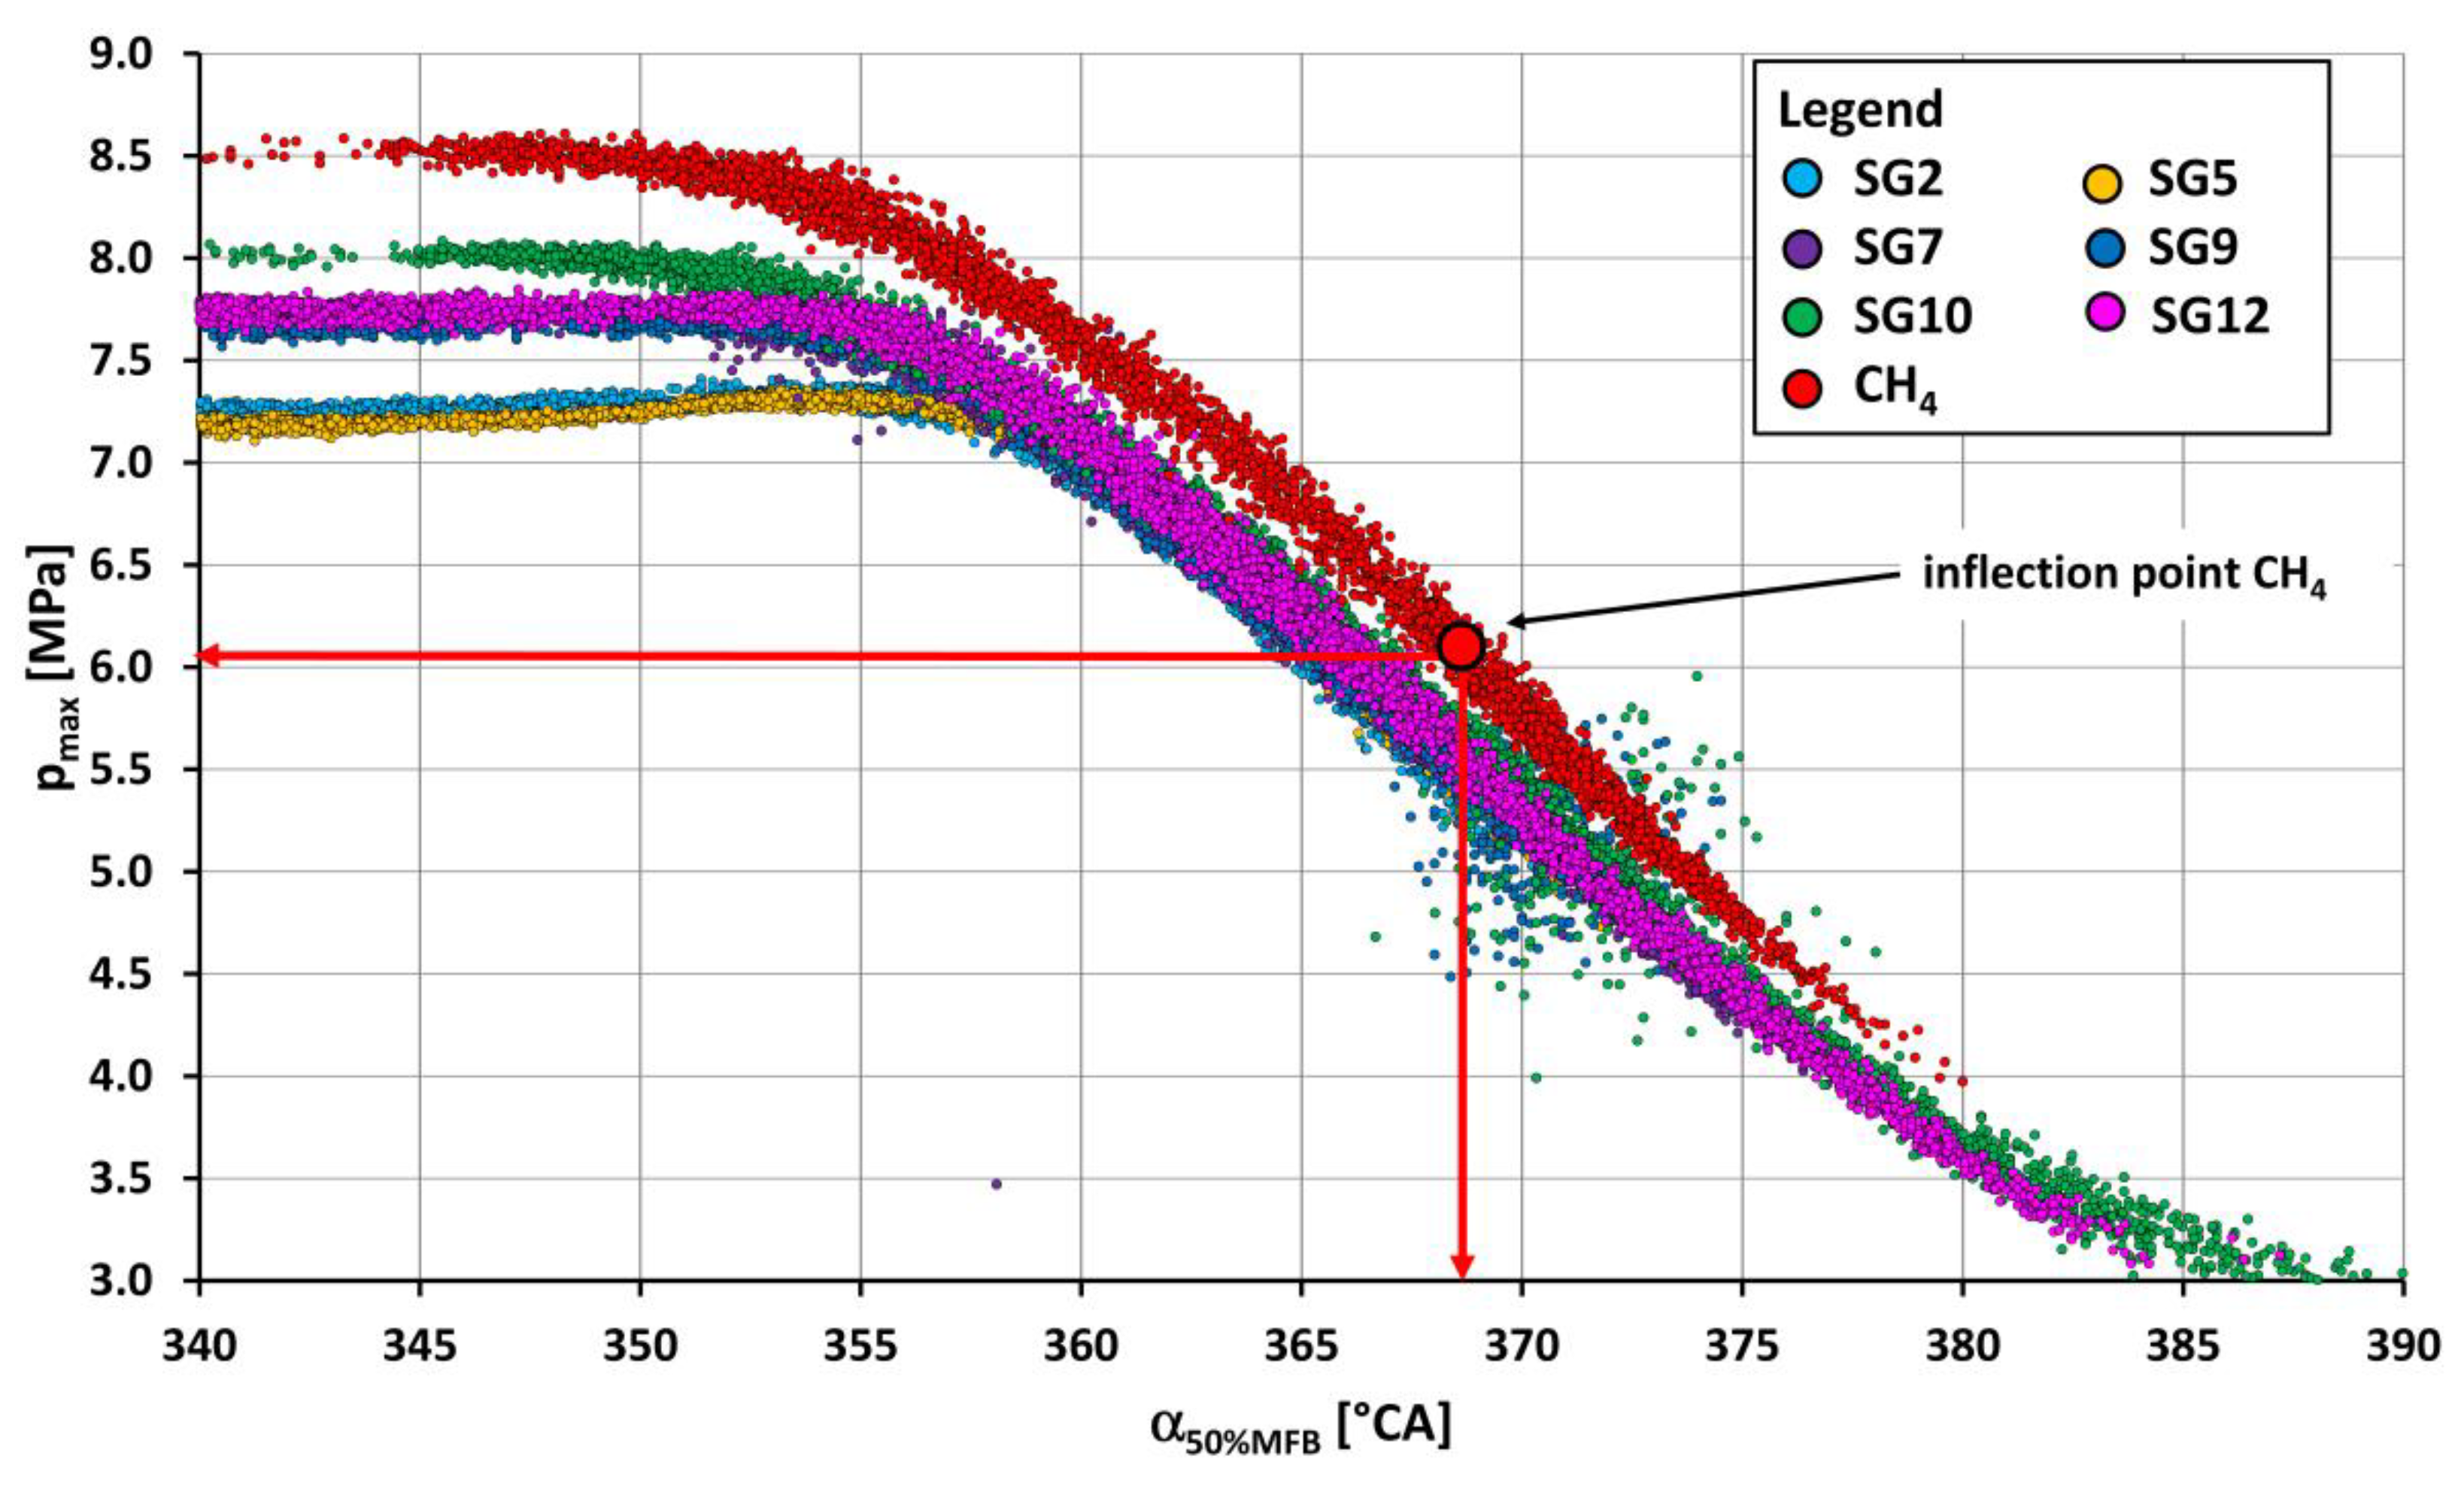
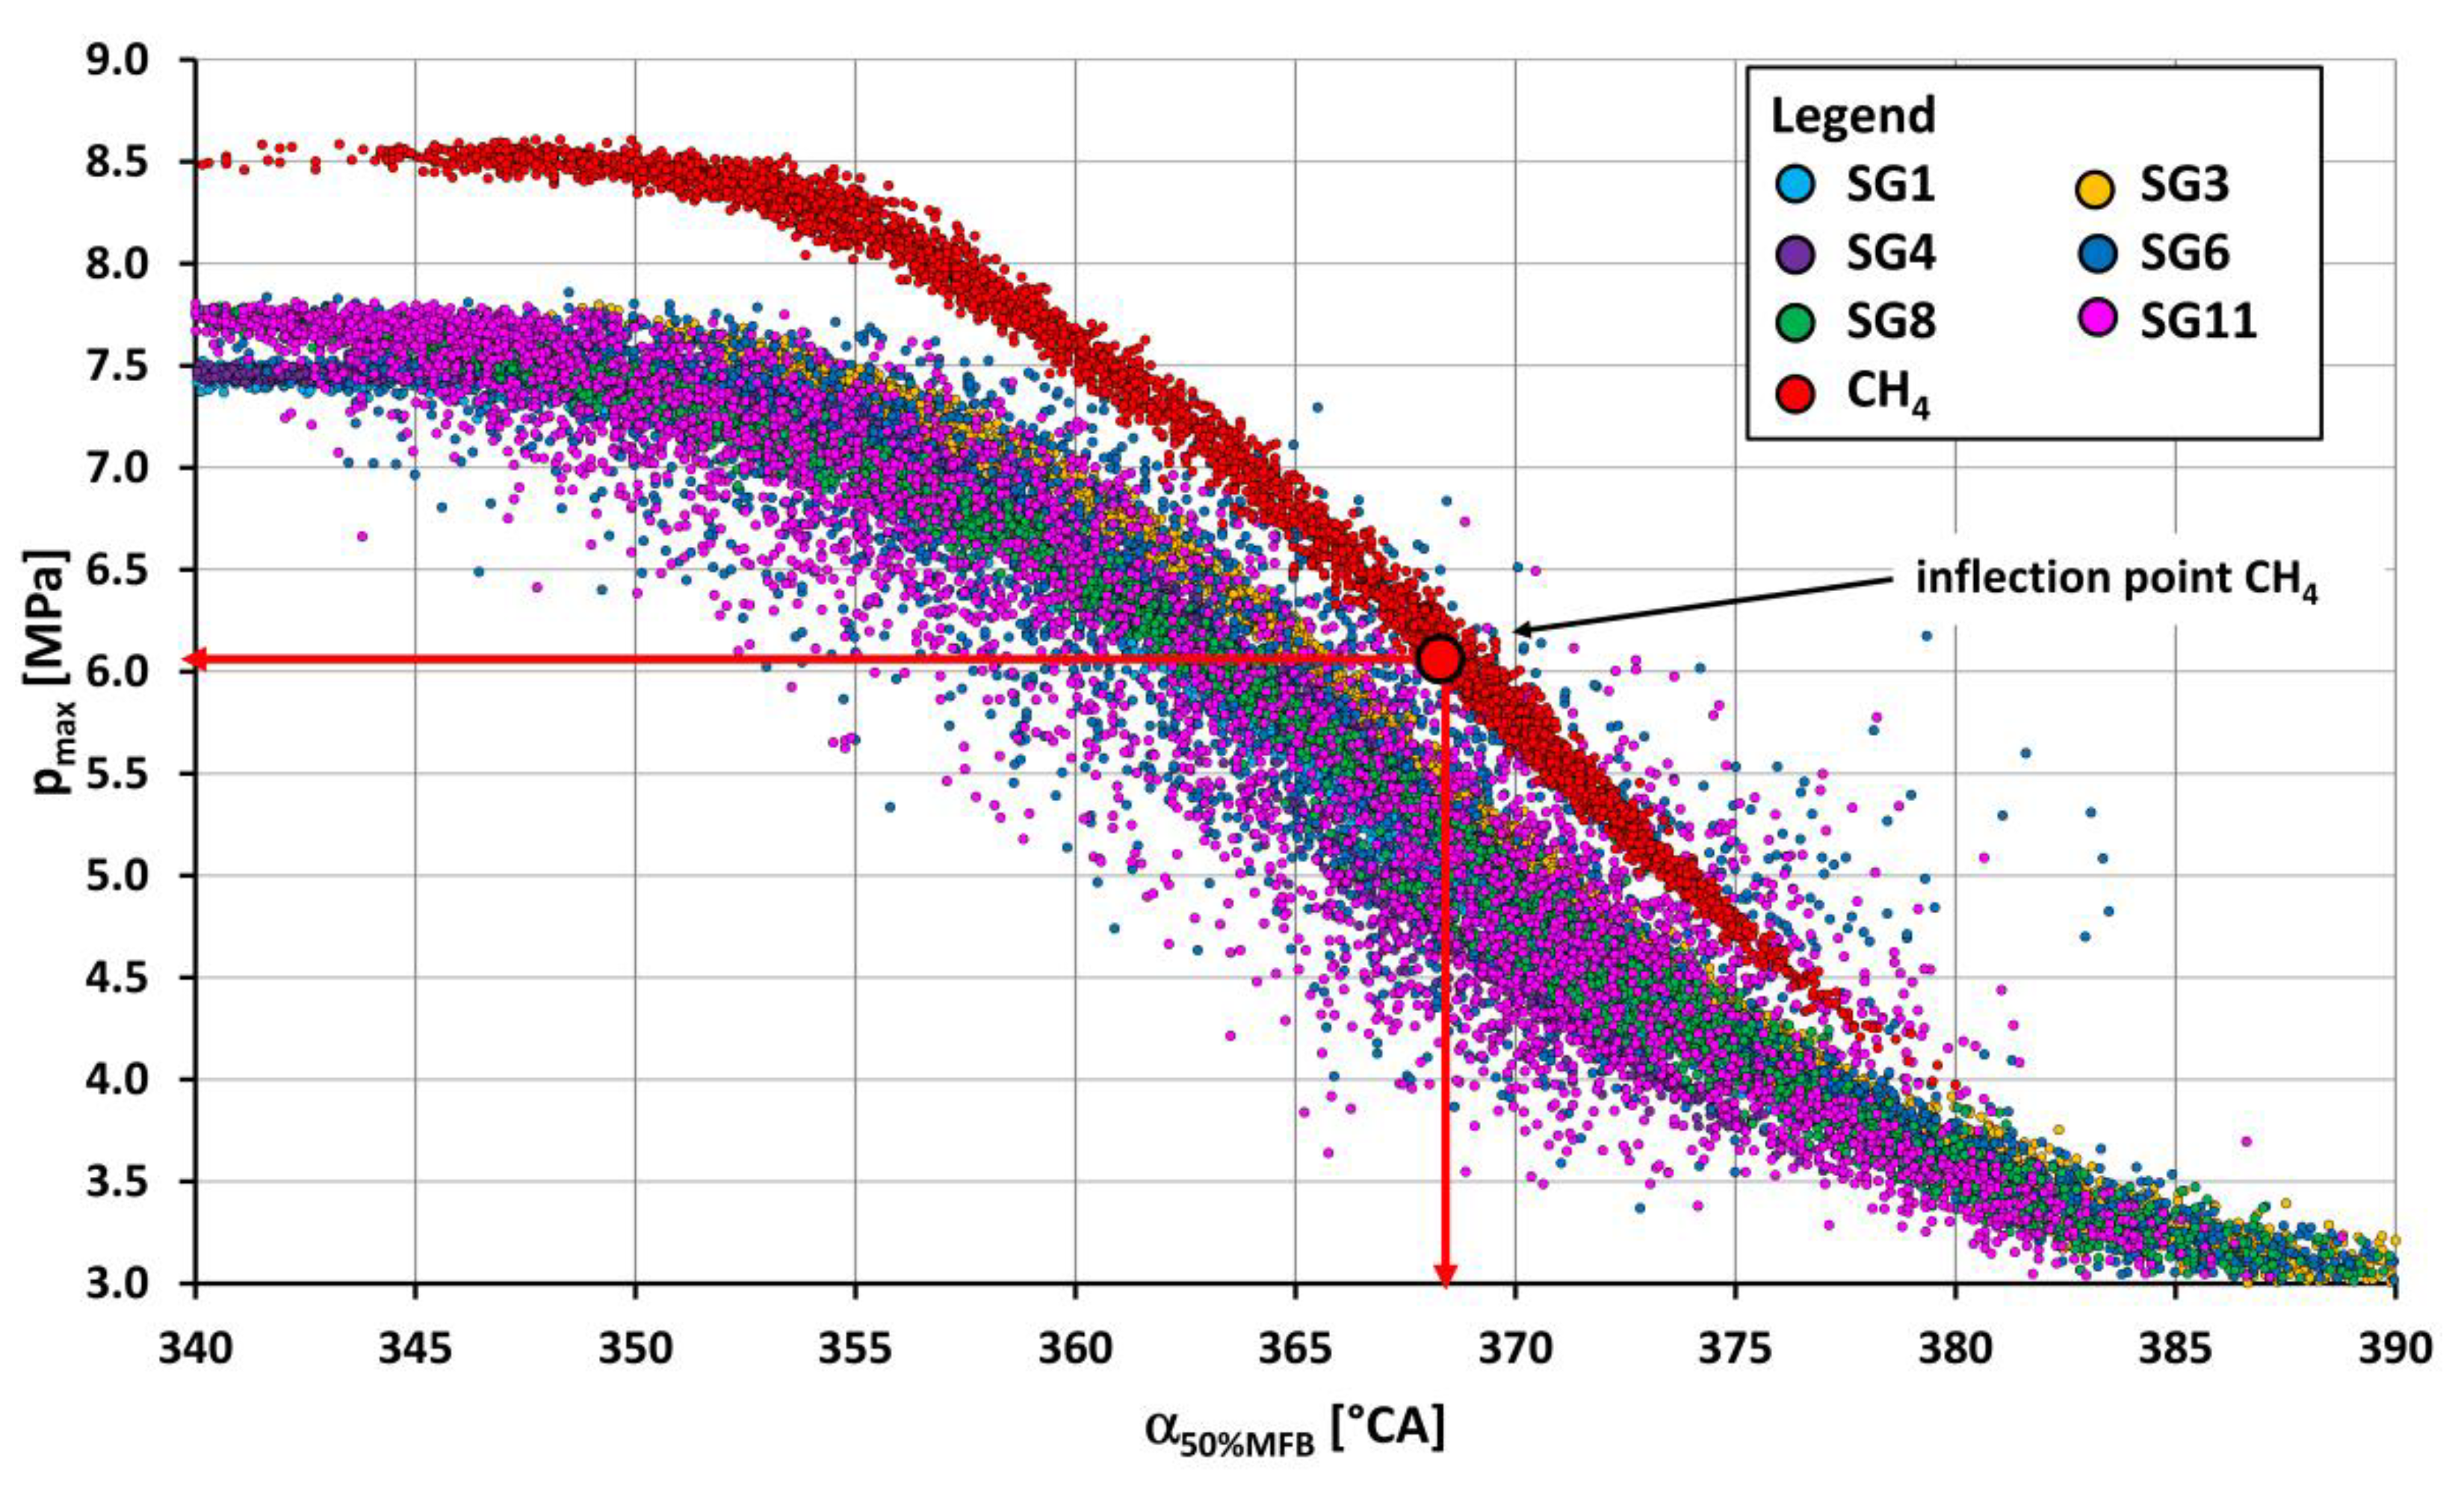
If the dependence of the maximum pressure values on the angle, with 50% by mass of the fuel burned, was plotted, the dependence shown in the following Figure 9 and Figure 10 would be obtained. For each fuel, an analysis of different spark advance regulation characteristics for various angles of spark advance was performed (195 consecutive cycles were analysed for each spark advance), from which a graph was constructed. As can be seen from the graph, the maximum pressure stabilised at about 8.5 MPa and did not significantly change with increasing spark advance values. This is because with increasing SOI angle (e.g., for SG12 at a spark advance angle greater than 35 °CA BTDC), most of the fuel (90%) burns in time to TDC and at the same time the combustion chamber volume decreases and thus approximately the same maximum pressure in the cylinder is always reached around the TDC. By gradually reducing the spark advance angle, the combustion also shifts behind the TDC, and at the same time as the volume of the combustion chamber volume increases, the maximum pressure in the cylinder begins to change its position behind the TDC and also gradually decreases. At the inflection point of the descending pressure curve (Figure 9 and Figure 10), at the optimum spark advance angle, the best engine performance parameters were always achieved. The dependence of the course of maximum pressure on the angle α50%MFB had an inverted S-shape.
The position of the inflection point for methane had a value of maximum pressure 6.1 MPa at approximately 8.5 °CA ATDC. The inflection point was located at the point where the combustion engine was operating at optimum spark advance angle (26 °CA BTDC), thus at the highest IMEP value (0.965 MPa), at which the angle α50%MFB was just 8.7 °CA ATDC (Figure 11). The lowest point of the curve of maximum pressure (approximately 7.2 MPa) was when operating on SG5. The inflection point was at the angle of α50%MFB 5.9 °CA ATDC, at which the highest IMEP values (0.739 MPa) were achieved. In general, it can be stated that the course of the curve for each synthesis gas had the inflection point at the angle of α50%MFB, at which, at the same time, the highest performance parameters were achieved (Figure 5, Figure 6, Figure 9 and Figure 10). In other words, the inflection point was always located at the point at which the internal combustion engine was running under optimum spark advance angle.
As seen in Figure 10, the burning of SG11 synthesis gas brings about a large variance of the maximum pressure values dependent on the angle α50%MFB.
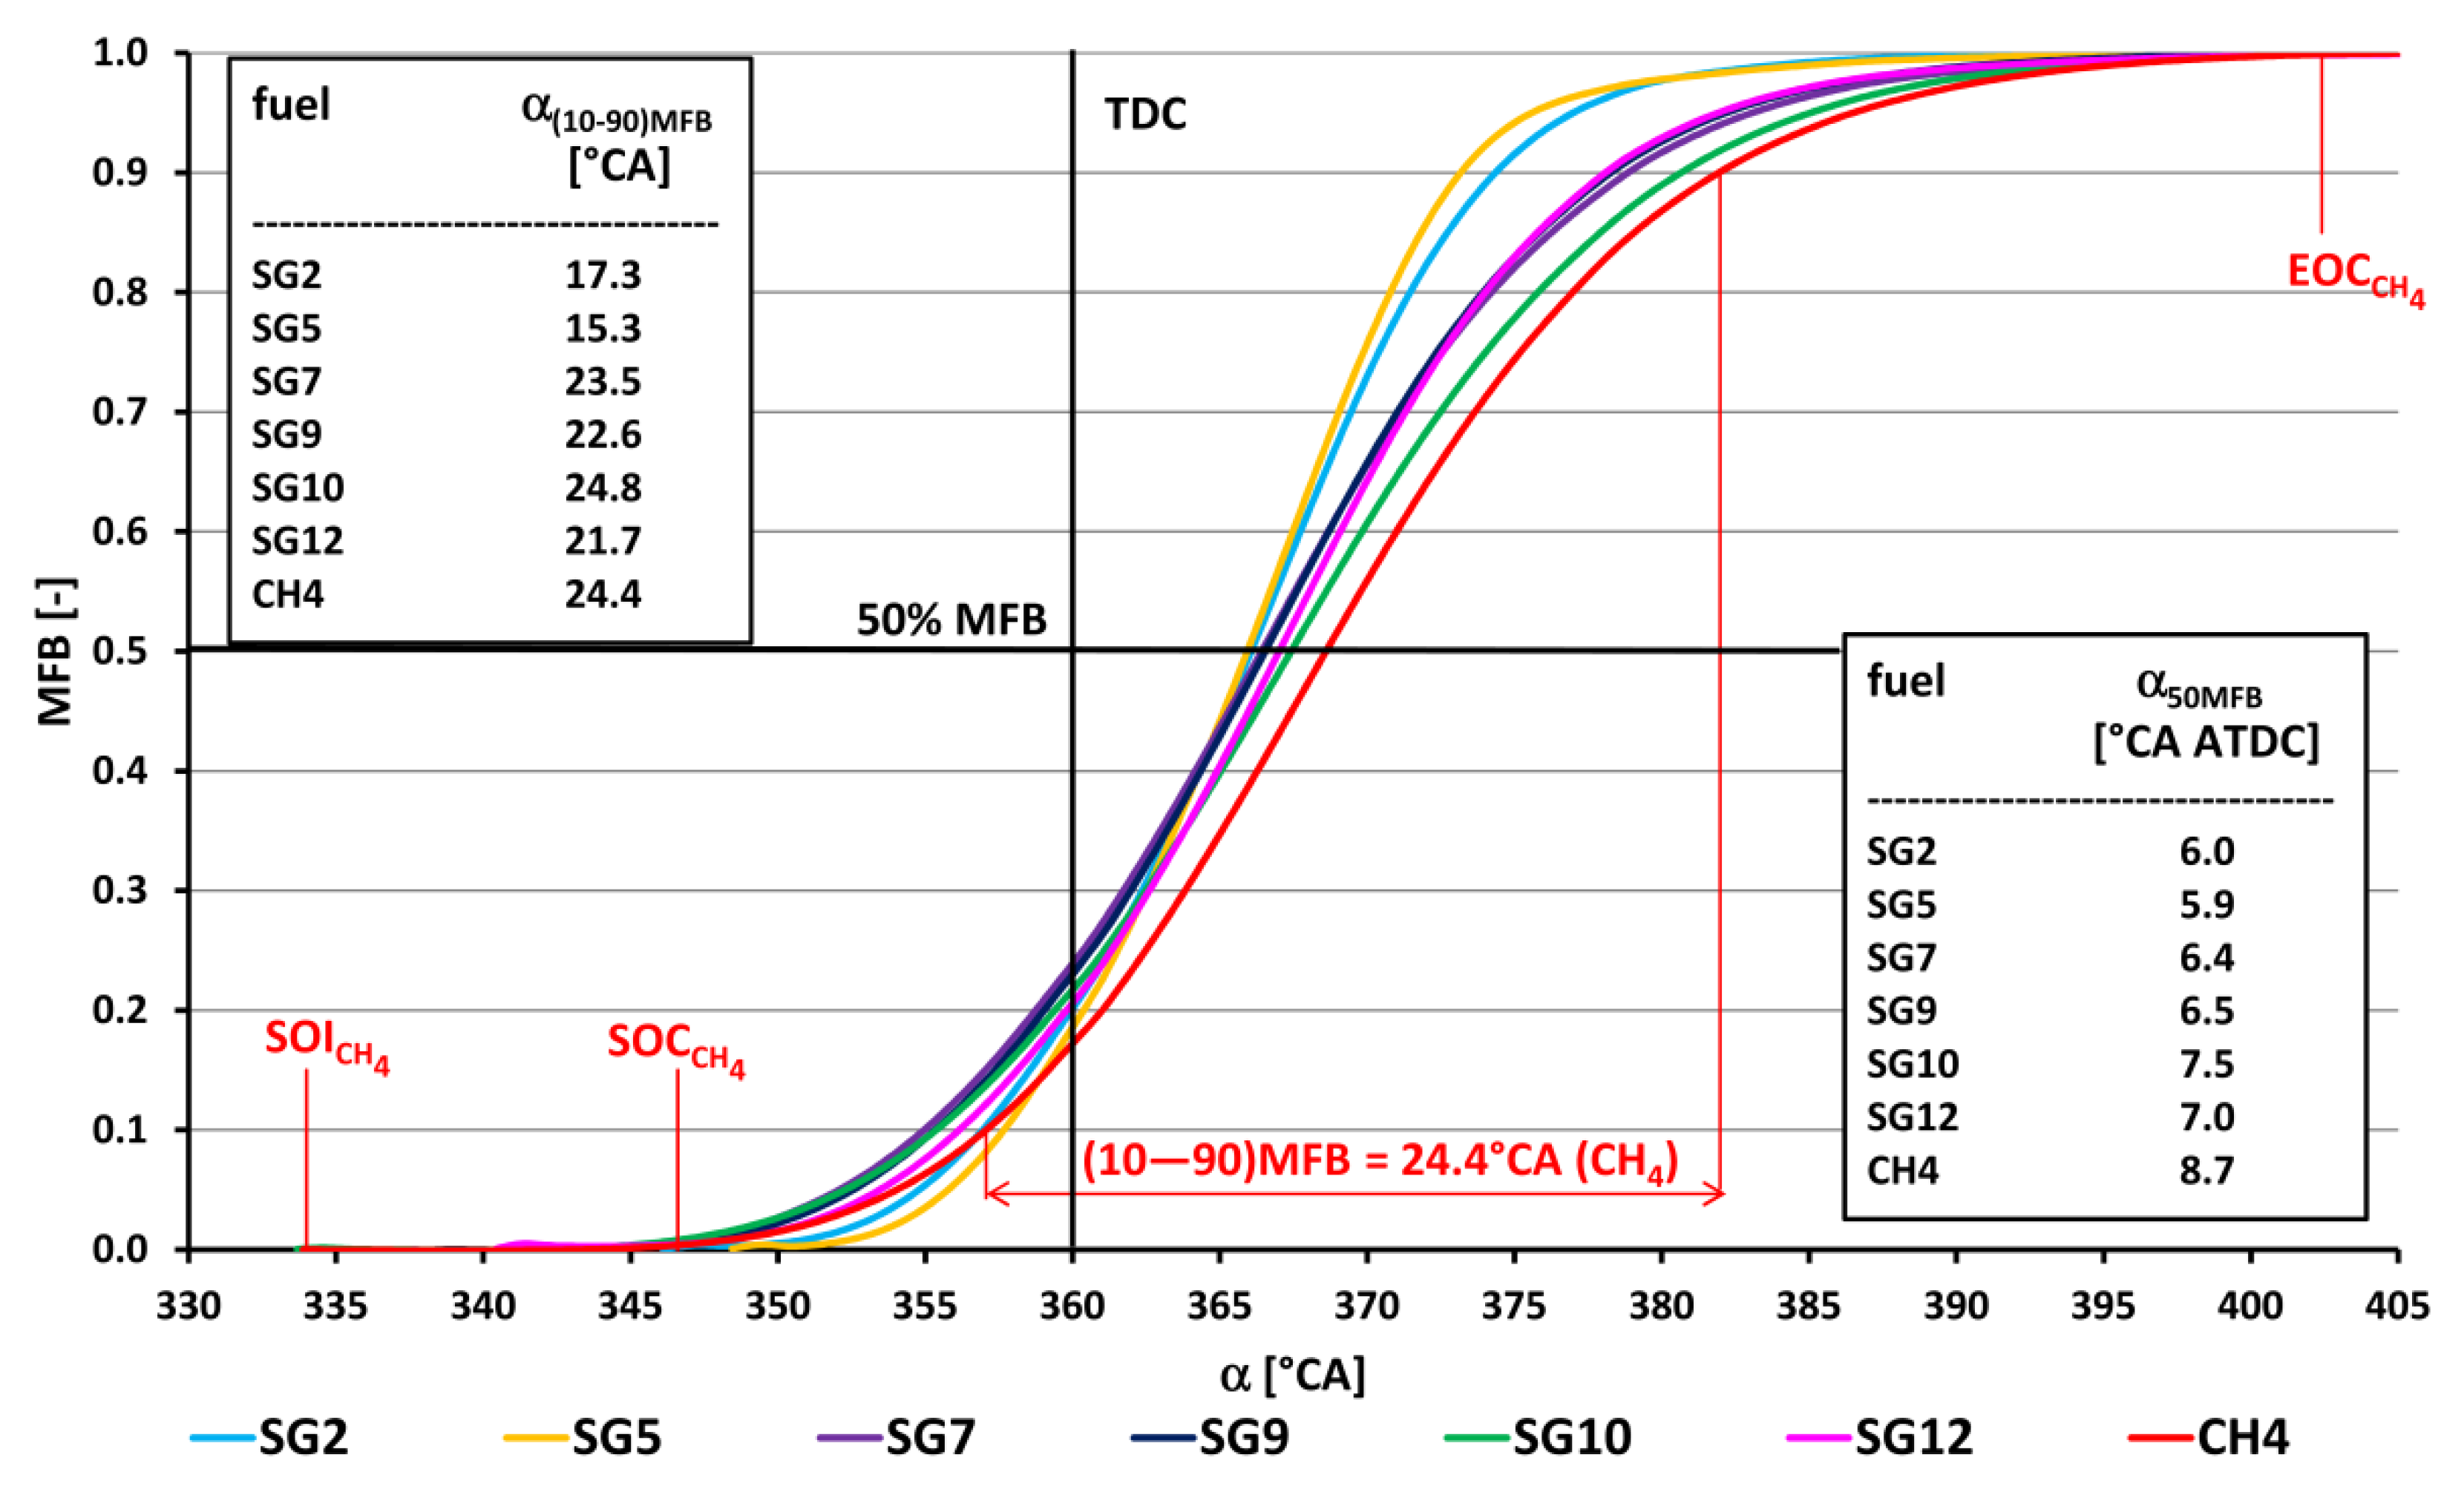
The following two graphs (Figure 11 and Figure 12) show the fuel burn-up profiles (MFB) as a function of the crankshaft rotation angle for different synthesis gas compositions compared to methane. The ignition delay (the period between the start of ignition (SOI) and the visible combustion moment (start of combustion SOC)) for methane is around 12.5 °CA for the optimum spark advance angle. The time between the SOI and the 5% by mass of methane combustion, is approximately 20.4 °CA. The main combustion period (10–90% MFB) lasts 24.4 °CA. The total burning period for methane (the period between SOC and end of combustion EOC) is 56 °CA.
Of the synthesis gases, the SG8 synthesis gas has the longest main combustion period (28.9 °CA). The SG5 synthesis gas has the shortest main combustion period (15.3 °CA). The reason for this is the already mentioned high proportion of hydrogen in the mixture. The shortest period between the moment of spark ignition and the angle at which 5% of the fuel is burned is the one (7.4 °CA) pertaining to SG5 synthesis gas and, conversely, the longest period (24.8 °CA) is the one related to operating on SG3 fuel that is composed of the largest proportion of inert gases (60% vol.) out of the gases analysed. The coefficient of variation of the position angle (COVα), at which a given mass fraction of fuel is burned, generally increases with increasing mass proportion of the fuel burned. For methane combustion, the values are as follows: COVα10%MFB = 0.36%, COVα50%MFB = 0.53%, COVα90%MFB = 0.71%. The SG11 synthesis gas has the largest variance of the coefficients of variation during each combustion period, which has the following COV: COVα10%MFB = 0.50%, COVα50%MFB = 0.81%, COVα90%MFB = 1.24%. On the contrary, the highest repeatability of the combustion process has the synthesis gas with the designation SG5, which has the individual coefficients of variation with the following values: COVα10%MFB = 0.10%, COVα50%MFB = 0.19%, COVα90%MFB = 0.28%. These low values for SG5 are caused by high hydrogen content in the fuel mixture. A brief analysis of the pressure rise rate values and the COV values during the gradual burning out of the fuel suggests that synthesis gases with a higher hydrogen content have a more harder engine run, but also a more stable course of their combustion process.

5. Short Discussion

Synthesis gases are one of the sources of energy from renewable sources and currently they appear to be an energy source for driving internal combustion engines designed for stationary applications (cogeneration units). This type of fuel contributes to reducing environmental burden and gives prevalence to carbon-neutral fuels. The evaluation of output power parameters has shown that the most important parameter is the volumetric heating value of stoichiometric mixture of fuel and air. In the second place, of course, the actual process of burning the mixture has to be taken into consideration, i.e., the rate of heat release and the related pressure profile in the cylinder, as well as the area of heat transfer during combustion. The course of combustion of individual gases is influenced by the SOI value, ignition delay, mixture burning rate, volume change of combustion products, position and value of maximum pressure, differences in expansion of individual gases, etc. All these aspects and parameters that characterise the combustion process, together with the perfection of filling the cylinder with fresh mixture characterized by volumetric efficiency, also affect the final value of the total, i.e., effective engine efficiency.
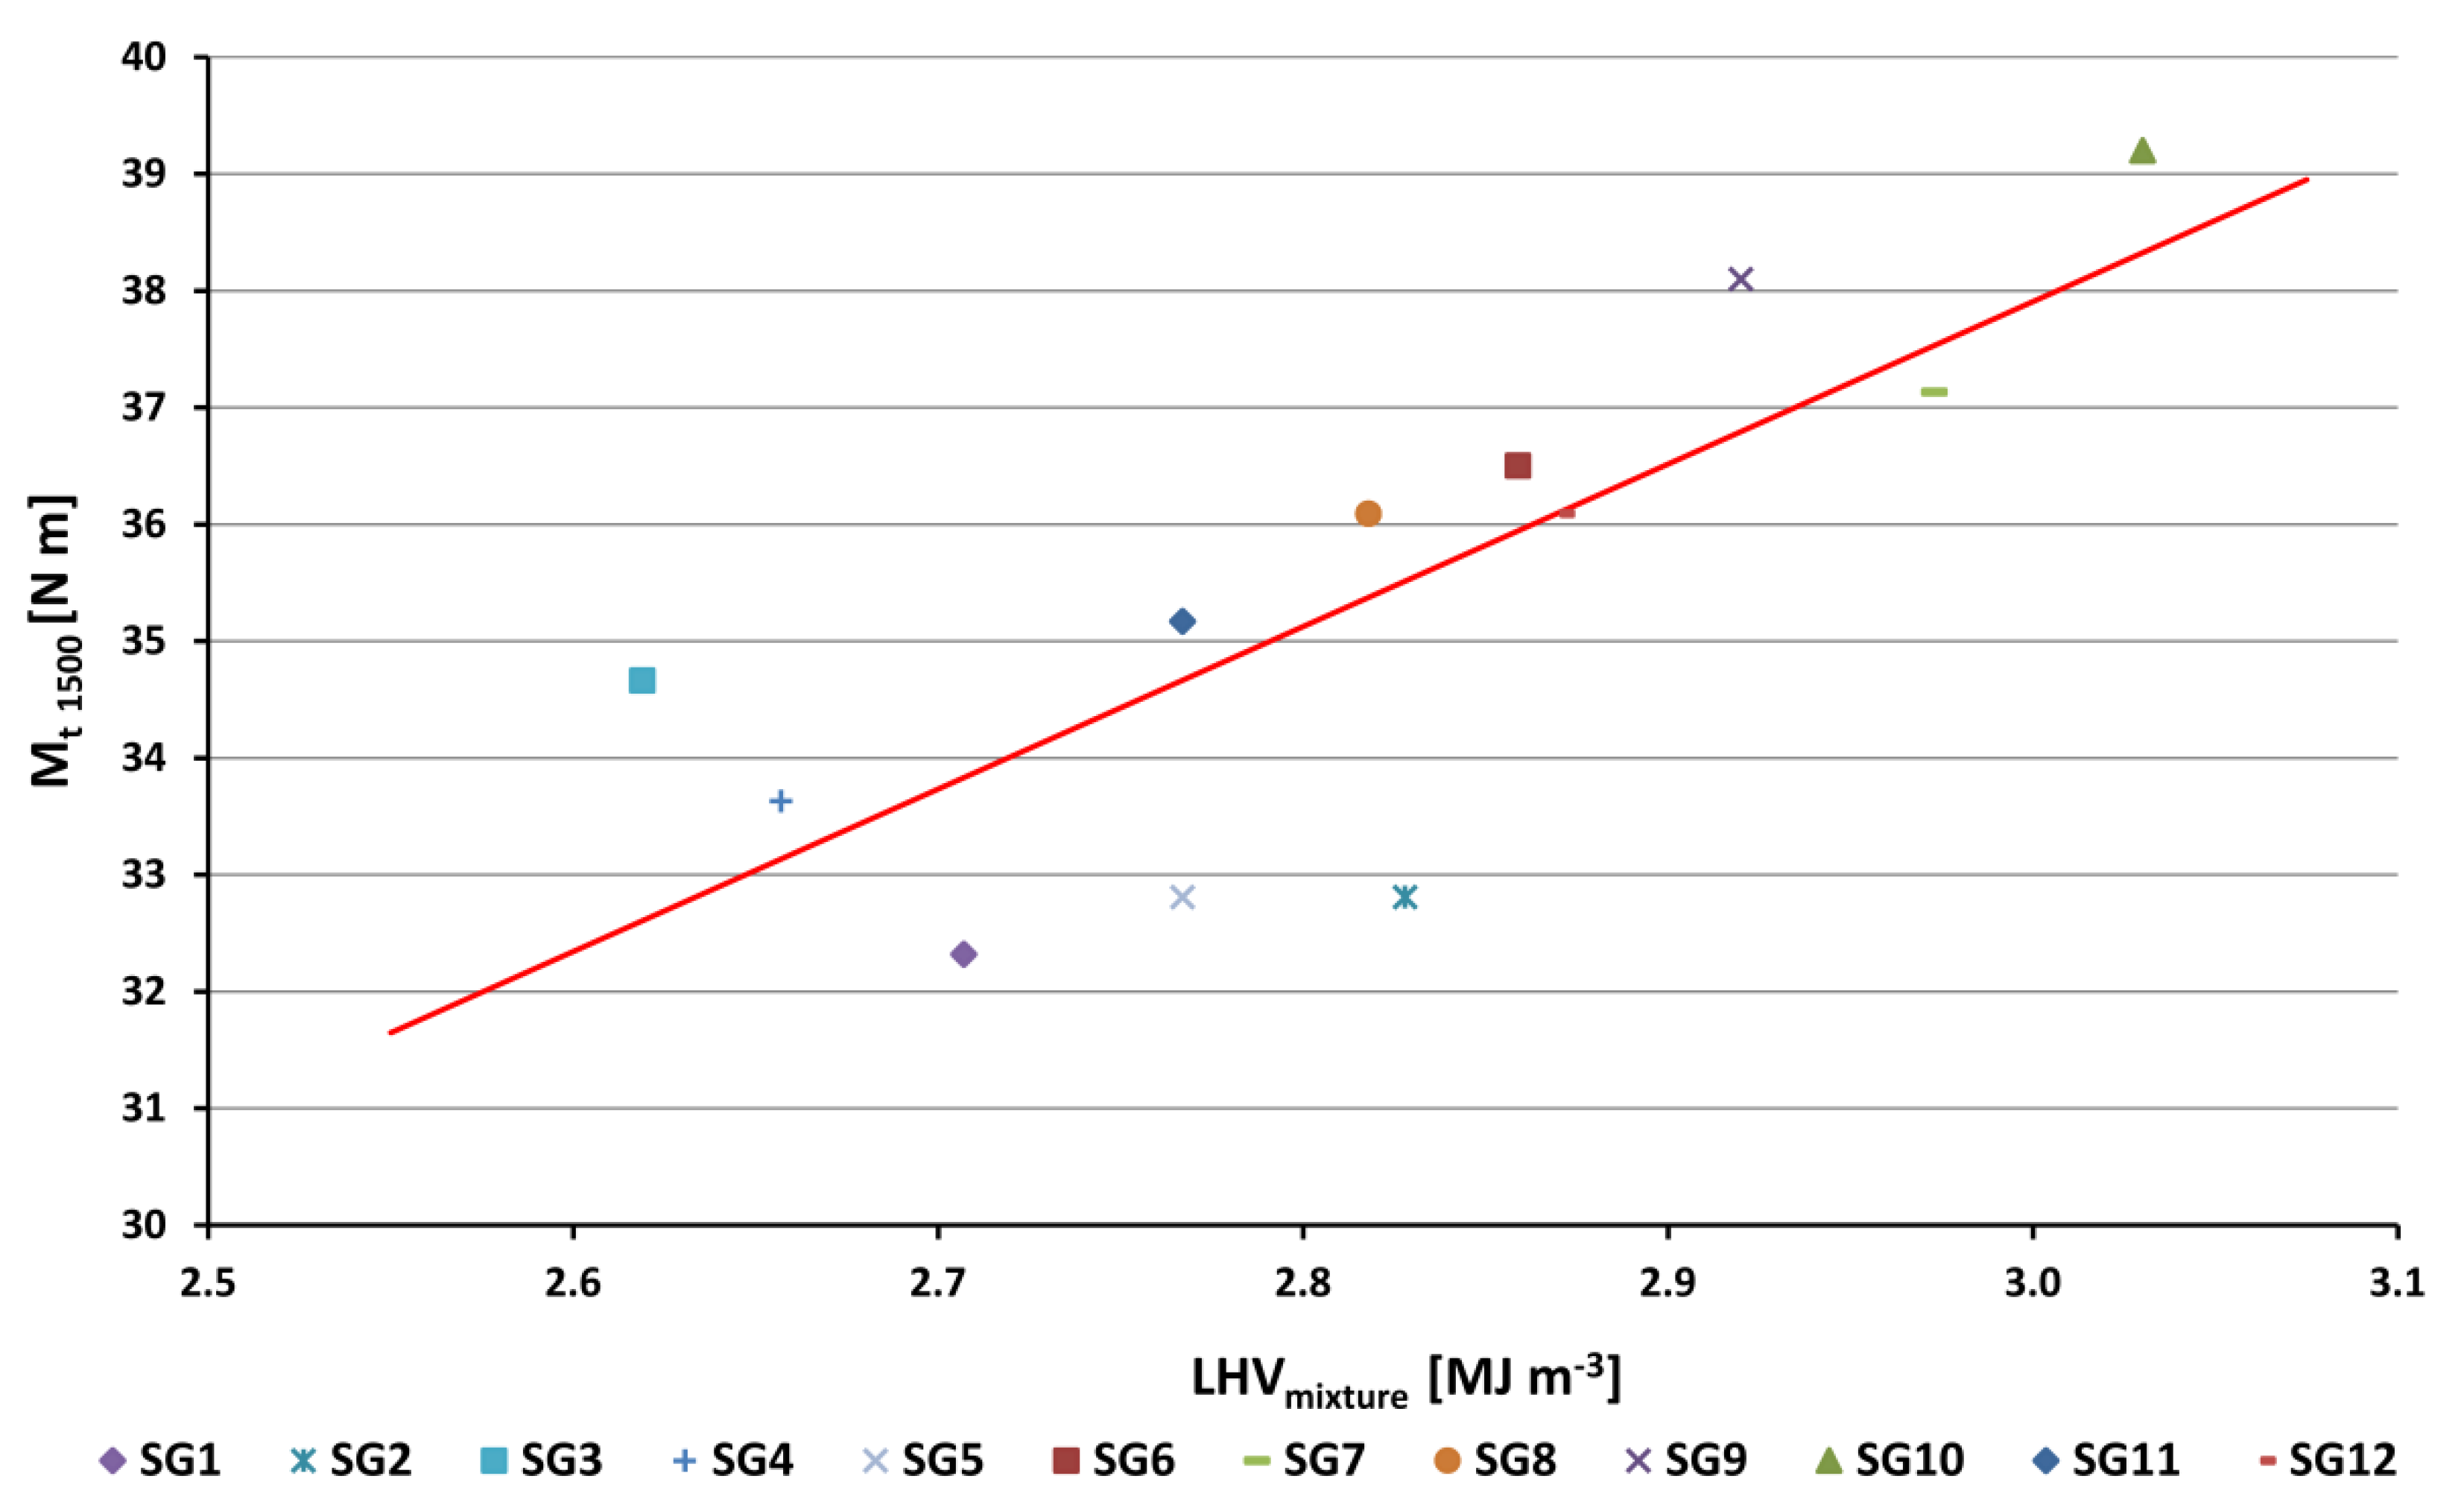
Figure 13 shows relation between the torque at revolutions 1500 L/min and the volumetric heating value for medium-energy gases. The increasing trend of this power parameter is virtually linear. The linear trend line (red straight line in Figure 13 and Figure 14), drawn across the measured values, shows that the deviations of the measured data from the trend line in Figure 13 are for most of the points in the range of ±5%.
Figure 14 shows the dependence of engine hourly fuel consumption of SGs at 1500 L/min revolutions at full load on mass heating value of gas (LHV). The highest hourly consumption of mixture SG3 is 8.2 kg/h and, conversely, the lowest hourly consumption of mixture SG11 is 5.7 kg/h. Compared to methane CH4 (1.56 kg/h), the consumptions of SGs are 3.6–5.7 times higher. This is caused by relatively low amount of air and a high amount of SG needed for preparing of stoichiometric mixture (Table 2). A similar low consumption as in SG11 was measured with gases SG12 (6.2 kg/h), and SG10 (6.4 kg/h). The trend in decreasing hourly fuel consumption with increasing mass LHV parameters is virtually linear.
The measured pressures in the engine cylinder, plotted for SGs and methane as a function of crankshaft angle, are shown in Figure 7 and Figure 8. From the measured pressures, we can see that all SGs burn faster than methane, and the maximum pressures are slightly closer to TDC. This leads also to faster rising pressures before TDC and to greater spending of compression work. On the other hand, during the expansion stroke, the drop in pressures, compared to methane, is faster, the expansion work is less, which leads to the measured torque values depicted in Figure 3 and Figure 4. The differences in the presence of combustible components in the individual gases also affect the pressures in the engine cylinder, and these are described in more detail in Section 4. The authors of the article also published the influence of individual components of synthesis gases on their combustibility in an internal combustion engine in their works [43,50,51]. The burning process during the compression stroke (and hence spent compression work) is different for all SGs; however, more significant differences arise during the expansion stroke in favor of SG10.
This part briefly summarizes the achieved results for internal combustion engines (similar to [43] for low-energy SGs) in the field of energy recovery from medium-energy SGs. As already mentioned, SGs help to solve the problem of waste piled up in the environment by both reducing landfills and obtaining clean electrical and thermal energy in the process of cogeneration. Carbon dioxide generated by combustion of SGs is environmentally neutral. The layout of the test unit, the engine data, and, in particular, the combustion analysis serve as a tool for a better understanding of the results obtained. The results are summarized in graphs, which give an idea of the general behavior of SGs when they are burned in an internal combustion engine. From the measured results of 12 SGs, it is possible to find out the tendency in achieving the performance and economic parameters of the engine. Through a comprehensive analysis of the results, the authors came up with recommendations for future compositions of SGs in the process of their production, which, together with other important research results, are presented in the conclusions.

6. Conclusions

The basic knowledge about the influence of medium-energy synthesis gases on the parameters of the internal combustion engine in comparison with the operation on methane at the operating speed of the internal combustion engine of 1500 L/min is briefly summarized here:
  • The optimum spark advance angle ranged from 12 °CA BTDC for SG5 gas, as the gas has a high hydrogen content in the mixture (Table 2) that burns the fastest, to 34 °CA BTDC for SG3 that in turn has the highest inert gas content that prevents the development of chemical reactions.
  • The torque value for the reference fuel (methane) was 43.2 N m; for the other synthesis gases examined (Figure 3, Figure 4 and Figure 13), this value was lower (from 32.3 N m for SG1 to 39.2 N m for SG10), relative to the fact that the volumetric heating value of stoichiometric mixture was lower for all synthesis gases compared to methane. The linear trend line (red straight line in Figure 13), drawn across the measured values, shows that the deviations of the measured data from the trend line in Figure 13 are for most of the points in the range up to ±5% (except for SG3, SG5 and SG2).
  • The hourly consumption of synthesis gases (Figure 3, Figure 4 and Figure 14) was 3.7 to 5.2 times higher than in operation on methane (1.56 kg/h), because in operation on synthesis gases, a small amount of air is consumed to form a stoichiometric mixture (from 2.23 kg/kg for SG2 up to 3.55 kg/kg for SG11, A/F ratio in Table 2) compared to methane (17.12 kg/kg). The trend in decreasing hourly fuel consumption with increasing values of the mass LHV parameter is virtually linear (red straight line in Figure 14).
  • Out of the synthesis gases, the highest value of maximum pressure (5.98 MPa) was reached by synthesis gas SG5 (Figure 7) and, conversely, the lowest value of maximum pressure (4.77 MPa) at optimum spark advance angle was achieved by burning SG8 synthesis gas (Figure 8). The coefficient of maximum pressure variation had the lowest value (3.2%) when operating on SG2 synthesis gas and, conversely, the highest value (8.9%) was when SG11 gas was burned.
  • The lowest value of the maximum of pressure rise rate was achieved when operating on SG11 synthesis gas (0.155 MPa/1 °CA), which contained 45% vol. of internal gases and at the same time approximately the same share of methane (20% vol.) and hydrogen (25% vol.). The synthesis gases, which contained mainly large amounts of hydrogen (35% vol. in SG4 and 50% vol. in SG5), also reached the highest values of the pressure rise rate (0.2518 MPa/1 °CA or 0.2493 MPa/1 °CA) of the engine.
  • The course of fuel combustion (Figure 11 and Figure 12) shows that the SG8 synthesis gas has the longest main combustion time (10–90% MFB) and represents a value of 28.9 °CA. The shortest combustion time (15.3 °CA) is for the SG5 synthesis gas combustion, which relates to the highest proportion of hydrogen in the mixture (50% vol.). The angle at which half of the fuel was burned ranged from 5.9 °CA ATDC for SG5 to 11.3 °CA ATDC for SG8. The combustion onset time (SOI-5% MFB) was the shortest (7.4 °CA) for SG5 synthesis gas with a high hydrogen content and, conversely, the longest (24.8 °CA) for SG3 synthesis gas with the highest inert gas content. The coefficients of variation of the positions during the gradual burning out of the fuel were the lowest for the synthesis gas SG5 and the highest for the synthesis gas SG11.
  • If we briefly summarize the performed analyses of the influence of hydrogen in synthesis gases on the combustion process in the internal combustion engine, then we can state the following findings. The hydrogen content in SGs is one of the main causes of their different behaviour during their combustion in the engine. Increasing the proportion of hydrogen in synthesis gases causes an increase in the pressure rise rate values during gas combustion, a decrease in the COV values during the gradual burnout of the fuel, and a shortening of the total combustion period. In other words, synthesis gases with higher hydrogen content lead to a slightly harder engine run, but a more stable combustion process. The effect of hydrogen in the synthesis gases, unless there is abnormal combustion, is positive. The combustion with a higher H2 content is closer to isochoric burning, which contributes to higher thermal and effective engine efficiency and also to lower fuel consumption. At the same time, an important property of hydrogen in the gas mixture [50] during its combustion should be mentioned, namely, that increasing the proportion of hydrogen in the mixture reduces harmful hydrocarbon emissions. A higher content of hydrogen in SGs reduces environmentally neutral CO2 in SGs combustion; vice versa, hydrogen increases the content of nitrogen oxides and water vapour in the exhaust of the internal combustion engine.
  • The results presented in this article and summarized in the conclusion give an idea of the integral parameters of the engine (torque and hourly consumption, Figure 1, Figure 2, Figure 3 and Figure 4), but above all, they give an idea of the internal parameters of the engine that relate to the combustion processes of medium-energy synthesis gases (Figure 5, Figure 6, Figure 7, Figure 8, Figure 9, Figure 10, Figure 11 and Figure 12), which we have mainly dealt with in this article. The authors can draw the following conclusions that are similar to those reached by the authors for low-energy synthesis gases [43]:
    • If medium-energy synthesis gases are to be used to drive a cogeneration unit, then we assume that the most important criterion for energy recovery from them must be the criterion of low consumption and high efficiency of their use in the internal combustion engine or for cogeneration. This means, that for the gases that have been measured at 1500 L/min, the lowest fuel consumption is in the range approximately up to 6.7 kg/h (Figure 14.). It relates to the gases SG12, 11, 10, 9, and 8, and the calculated values of effective efficiencies for them are as follows: SG10 (31.2%), SG11 (31.1%), SG8 (31.1%), SG9 (30.8%), and SG12 (28.8%). At the same time, the gases SG10 and SG9 also achieved the highest performance parameters (and had the highest volume lower heating value of the mixture - LHVmixture) out of all gases. The gases that achieve low consumption and at the same time a high value of effective efficiency are the gases SG 8, 9, 10, and 11. As for Table 2, these are gases, which in their composition contain from 30% to 45% volume of methane and hydrogen. Therefore, the general conclusion that we can recommend for the production of medium-energy gases is to set up the gasification technology in such a way that the resulting gases contain as much methane and hydrogen as possible.
    • In order to prevent abnormal combustion in the form of knocking of the engine or backfire of the mixture in the intake manifold, it is necessary to take into account the fact that in the case of methane-free gases (SG2 and SG5, Table 2), if the hydrogen content exceeds 25% by volume, then the volume of inert gases must not fall below 25% vol. [43]. During experiments with SGs, which contain methane, we did not measure any signs of abnormal combustion.
    • As for inert gases present in the synthesis gases, if the gasification technology allows, we recommend a higher proportion of nitrogen than carbon dioxide content in the synthesis gases for maximum optimisation of performance parameters [43,51].
    • When changing the composition of synthesis gas, similar to low-energy synthesis gases [43], it is necessary to optimise the engine in terms of the change in the compression ratio, spark advance angle (SOI) for each gas, ignition system (spark energy value, spark plug heat value), geometry of the piping system in terms of achieving maximum filling of the cylinders (valve timing, use of the wave effect), shape of the combustion chamber, or shape of the holes (flow coefficients), optimum turbulence of the charge, use of supercharging, etc. The results of this SG analysis are directly applicable in practice. They provide several suggestions on how to set up waste gasification technologies to obtain optimal performance and the best economic parameters from cogeneration units.

Author Contributions

Conceptualization, A.C. and M.P.; methodology, A.C.; software, A.C.; validation, M.P. and M.M.; formal analysis, M.P.; resources, M.M.; writing—original draft preparation, A.C.; writing—review and editing, Ľ.M.; visualization, A.C.; supervision, Ľ.M. All authors have read and agreed to the published version of the manuscript.

Funding

This work was supported by the Slovak Research and Development Agency under Contracts No. APVV-17-0006, APVV-18-0023, APVV-20-0046, by the Slovak Scientific Grant Agency under the Contract No. VEGA 1/0301/17, and by the Slovak Cultural and Educational Grant Agency under the Contracts No. KEGA 026STU-4/2018, KEGA 041STU-4/2020 and KEGA 050STU-4/2021.

Institutional Review Board Statement

Not applicable.

Informed Consent Statement

Not applicable.

Data Availability Statement

Publicly available datasets were analyzed in this study. The data presented in this study are available on request from the corresponding author.

Acknowledgments

The authors would like to thank Veronika Polóniová, Slovak University of Technology in Bratislava, for translation service.

Conflicts of Interest

The authors declare no conflict of interest.

Abbreviations

A/FAir to fuel ratio [kg /kg]
ATDCAfter top-dead centre
BTDCBefore top-dead centre
CHPCombined Heat and Power
CH4Methane
COCarbon monoxide
CO2Carbon dioxide
COVCoefficient of variation
COVα10%MFBCoefficient of variation at the point of 10% mass fraction burned
COVα50%MFBCoefficient of variation at the point of 50% mass fraction burned
COVα90%MFBCoefficient of variation at the point of 90% mass fraction burned
D10Disposal—Incineration on land
dpcPressure change due to combustion [Pa]
dppPressure change due to compression [Pa]
dQHeat delivered to the system
dUChange of internal energy of matter in the system
dWWork produced by system
EGRExhaust gas recirculation
EOCEnd of combustion [°CA ATDC]
EUEuropean Union
FTFischer-Tropsch
hi.dmii-th component of enthalpy of mass flow across system boundaries
ICEInternal combustion engine
IMEPIndicated mean effective pressure [MPa]
LHVFuel lower heating value [MJ/kg], [MJ/m3],
LHVmixtureLower heating value of mixture (volumetric) [MJ/m3]
MMolar mass [kg/kmol]
MfuelHourly fuel consumption [kg/h]
Mfuel1500Hourly fuel consumption at 1500 L/min [kg/h]
MtBrake torque [N m]
MAFMass air flow
MFBMass fraction burned
MSWMunicipal solid waste
N2Nitrogen
NTPNormal temperature and pressure (293.15 K, 101,325 Pa)
O2Oxygen
Pin-cylinder pressure [MPa]
PMParticulate matter
PPCPartially premixed combustion
R1Recovery—Use principally as a fuel or other means to generate energy
SGSyngas
SOIStart of ignition [°CA BTDC]
SOCStart of combustion [°CA BTDC]
TDCTop-dead centre
WtEWaste-to-Energy
αCrankshaft angle [°CA]
α50%MFBCrank angle at which 50% of fuel mass is burned
ρNTP fuelDensity of fuel [kg/m3]
ρNTP mixtureDensity of stoichiometric mixture [kg/m3]

References

  1. Dace, E.; Blumberga, D.; Kuplais, G.; Bozko, L.; Khabdullina, Z.; Khabdullin, A. Optimization of landfill Gas Use in Municipal Solid Waste Landfills in Latvia. Energy Procedia 2015, 72, 293–299. [Google Scholar] [CrossRef] [Green Version]
  2. Swarbrick, G.E.; Stuetz, M.R. Handbook for the Design, Construction, Operation, Monitoring and Maintenance of a Passive Landfill Gas Drainage and Biofiltration System; Department of Environment, Climate Change and Water: New South Wales, Australia, 2010; pp. 4–7.
  3. Ali, J.; Rasheed, T.; Afreen, M.; Anwar, M.T.; Nawaz, Z.; Anwar, H.; Rizwan, K. Modalities for conversion of waste to energy—Challenges and perspectives. Sci. Total Environ. 2020, 727, 138610. [Google Scholar] [CrossRef]
  4. Alzate-Arias, S.; Jaramillo-Duque, Á.; Villada, F.; Restrepo-Cuestas, B. Assessment of government incentives for energy from waste in Colombia. Sustainability 2018, 10, 1294. [Google Scholar] [CrossRef] [Green Version]
  5. Agency for Toxic Substances and Disease Registry. Available online: https://www.atsdr.cdc.gov/HAC/landfill/PDFs/Landfill_2001_ch2mod.pdf (accessed on 30 September 2021).
  6. Markulik, S.; Šolc, M.; Petrík, J.; Balážiková, M.; Blaško, P.; Kliment, J.; Bezák, M. Application of FTA Analysis for Calculation of the Probability of the Failure of the Pressure Leaching Process. Appl. Sci. 2021, 11, 6731. [Google Scholar] [CrossRef]
  7. Nanda, S.; Berruti, F. A technical review of bioenergy and resource recovery from municipal solid waste. J. Hazard. Mater. 2021, 403, 123970. [Google Scholar] [CrossRef] [PubMed]
  8. Caligiuri, C.; Baškovič, U.Ž.; Renzi, M.; Seljak, T.; Oprešnik, S.R.; Baratieri, M.; Katrašnik, T. Complementing syngas with natural gas in spark ignition engines for power production: Effects on emissions and combustion. Energies 2021, 14, 3688. [Google Scholar] [CrossRef]
  9. Pukalskas, S.; Kriaučiūnas, D.; Rimkus, A.; Przybyła, G.; Droździel, P.; Barta, D. Effect of hydrogen addition on the energetic and ecologic parameters of an SI engine fueled by biogas. Appl. Sci. 2021, 11, 742. [Google Scholar] [CrossRef]
  10. Siwal, S.S.; Zhang, Q.; Devi, N.; Saini, A.K.; Saini, V.; Pareek, B.; Gaidukovs, S.; Thakur, V.K. Recovery processes of sustainable energy using different biomass and wastes. Renew. Sustain. Energy Rev. 2021, 150, 111483. [Google Scholar] [CrossRef]
  11. Dong, J.; Chi, Y.; Tang, Y.; Ni, M.; Nzihou, A.; Weiss-Hortala, E.; Huang, Q. Effect of Operating Parameters and Moisture Content on Municipal Solid Waste Pyrolysis and Gasification. Energy Fuels 2016, 30, 3994–4001. [Google Scholar] [CrossRef] [Green Version]
  12. Mojaver, M.; Hasanzadeh, R.; Azdast, T.; Park, C.B. Comparative study on air gasification of plastic waste and conventional biomass based on coupling of AHP/TOPSIS multi-criteria decision analysis. Chemosphere 2022, 286, 131867. [Google Scholar] [CrossRef]
  13. Gu, Q.; Wu, W.; Jin, B.; Zhou, Z. Analyses for synthesis gas from municipal solid waste gasification under medium temperatures. Processes 2020, 8, 10084. [Google Scholar] [CrossRef] [Green Version]
  14. Ramos, A.; Teixeira, C.A.; Rouboa, A. Environmental assessment of municipal solid waste by two-stage plasma gasification. Energies 2019, 12, 10137. [Google Scholar] [CrossRef] [Green Version]
  15. Villarini, M.; Marcantonio, V.; Colantoni, A.; Bocci, E. Sensitivity analysis of different parameters on the performance of a CHP internal combustion engine system fed by a biomass waste gasifier. Energies 2019, 12, 40688. [Google Scholar] [CrossRef] [Green Version]
  16. Puškár, M.; Kopas, M.; Kádárová, J. Ecological analysis related to creation of gaseous emissions within transport focused on fulfilment of the future emission standards. Transp. Res. Part D: Transp. Environ. 2017, 57, 413–421. [Google Scholar] [CrossRef]
  17. Pieta, I.S.; Epling, W.S.; Kazmierczuk, A.; Lisowski, P.; Nowakowski, R.; Serwicka, E.M. Waste into fuel—catalyst and process development for MSW valorisation. Catalysts 2018, 8, 30113. [Google Scholar] [CrossRef] [Green Version]
  18. Puškár, M.; Kopas, M.; Puškár, D.; Lumnitzer, J.; Faltinová, E. Method for reduction of the NOX emissions in marine auxiliary diesel engine using the fuel mixtures containing biodiesel using HCCI combustion. Mar. Pollut. Bull. 2018, 127, 752–760. [Google Scholar] [CrossRef]
  19. Sinay, J.; Puškár, M.; Kopas, M. Reduction of the NOx emissions in vehicle diesel engine in order to fulfill future rules concerning emissions released into air. Sci. Total Environ. 2018, 624, 1421–1428. [Google Scholar] [CrossRef]
  20. Puškár, M.; Jahnátek, A.; Kuric, I.; Kádárová, J.; Kopas, M.; Šoltésová, M. Complex analysis focused on influence of biodiesel and its mixture on regulated and unregulated emissions of motor vehicles with the aim to protect air quality and environment. Air Qual. Atmos. Health 2019, 12, 855–864. [Google Scholar] [CrossRef]
  21. Nasreen, S.; Nafees, M.; Qureshi, L.A.; Asad, M.S.; Sadiq, A.; Ali, S.D. Review of Catalytic Transesterification Methods for Biodiesel Production. In Biofuels—State of Development. Biofuels: State Dev. 2018, 93–119. [Google Scholar] [CrossRef] [Green Version]
  22. Mahmoudi, H.; Mahmoudi, M.; Doustdar, O.; Jahangiri, H.; Tsolakis, A.; Gu, S.; LechWyszynski, M. A review of Fischer Tropsch synthesis process, mechanism, surface chemistry and catalyst formulation. Biofuels Eng. 2018, 2, 11–31. [Google Scholar] [CrossRef]
  23. Asadullah, M. Barriers of commercial power generation using biomass gasification gas: A review. Renew. Sustain. Energy Rev. 2014, 29, 201–215. [Google Scholar] [CrossRef]
  24. Asadullah, M. Biomass gasification gas cleaning for downstream applications: A comparative critical review. Renew. Sustain. Energy Rev. 2014, 40, 118–132. [Google Scholar] [CrossRef]
  25. Thapa, S.; Bhoi, P.R.; Kumar, A.; Huhnke, R.L. Effects of syngas cooling and biomass filter medium on tar removal. Energies 2017, 10, 30349. [Google Scholar] [CrossRef] [Green Version]
  26. De Filippis, P.; Scarsella, M.; de Caprariis, B.; Uccellari, R. Biomass Gasification Plant and Syngas Clean-up System. Energy Procedia 2015, 75, 240–245. [Google Scholar] [CrossRef] [Green Version]
  27. Molino, A.; Chianese, S.; Musmarra, D. Biomass gasification technology: The state of the art overview. J. Energy Chem. 2016, 25, 10–25. [Google Scholar] [CrossRef]
  28. Duan, J.; Liu, F.; Sun, B. Backfire control and power enhancement of a hydrogen internal combustion engine. Int. J. Hydrogen Energy 2014, 39, 4581–4589. [Google Scholar] [CrossRef]
  29. Verhelst, S.; Maesschalck, P.; Rombaut, N.; Sierens, R. Increasing the power output of hydrogen internal combustion engines by means of supercharging and exhaust gas recirculation. Int. J. Hydrogen Energy 2009, 34, 4406–4412. [Google Scholar] [CrossRef] [Green Version]
  30. White, C.M.; Steeper, R.R.; Lutz, A.E. The hydrogen-fueled internal combustion engine: A technical review. Int. J. Hydrogen Energy 2006, 31, 1292–1305. [Google Scholar] [CrossRef]
  31. García-Cascallana, J.; Carrillo-Peña, D.; Morán, A.; Smith, R.; Gómez, X. Energy Balance of Turbocharged Engines Operating in a WWTP with Thermal Hydrolysis. Co-Digestion Provides the Full Plant Energy Demand. Appl. Sci. 2021, 11, 11103. [Google Scholar] [CrossRef]
  32. Kriaučiūnas, D.; Pukalskas, S.; Rimkus, A.; Barta, D. Analysis of the influence of CO2 concentration on a spark ignition engine fueled with biogas. Appl. Sci. 2021, 11, 46379. [Google Scholar] [CrossRef]
  33. Shamun, S.; Belgiorno, G.; di Blasio, G. Engine Parameters Assessment for Alcohols Fuels Application in Compression Ignition Engines. In Energy, Environment, and Sustainability; Springer Nature: Berlin/Heidelberg, Germany, 2019; pp. 125–139. [Google Scholar] [CrossRef]
  34. Dimitrakopoulos, N.; Belgiorno, G.; Tuner, M.; Blasio G di Beatrice, C. PPC Operation with Low RON Gasoline Fuel. A Study on Load Range on a Euro 6 Light Duty Diesel Engine. In Proceedings of the Ninth International Conference on Modeling and Diagnostics for Advanced Engine Systems, Japan Society of Mechanical Engineers, Okayama, Japan, 26–28 July 2017. [Google Scholar]
  35. Beatrice, C.; Belgiorno, G.; Di Blasio, G.; Mancaruso, E.; Sequino, L.; Vaglieco, B.M. Analysis of a Prototype High-Pressure “Hollow Cone Spray” Diesel Injector Performance in Optical and Metal Research Engines; SAE Technical Paper 2017-24-0073; SAE: Warrendale, PA, USA, 2017. [Google Scholar] [CrossRef]
  36. Ministry of Environment of the Slovak Republic. Available online: https://www.enviroportal.sk/uploads/report/9341.pdf (accessed on 5 October 2021).
  37. Ministry of Environment of the Slovak Republic. Available online: https://www.minzp.sk/files/iep/01_2017_tri-vyzvy_zivotneho_prostredia.pdf (accessed on 5 October 2021).
  38. Institute of Circular Economy. Available online: https://www.incien.sk/preco-sa-oplati-zbavit-sa-takmer-vsetkych-starosti-odpadov/ (accessed on 7 October 2021).
  39. Institute of Circular Economy. Available online: https://www.incien.sk/wp-content/uploads/2020/11/analyza-odpad-hosp-2020-final.pdf (accessed on 7 October 2021).
  40. Levaggi, L.; Levaggi, R.; Marchiori, C.; Trecroci, C. Waste-to-energy in the EU: The effects of plant ownership, waste mobility, and decentralization on environmental outcomes and welfare. Sustainability 2020, 12, 5743. [Google Scholar] [CrossRef]
  41. EUROSTAT Municipal Waste Statistics. Available online: https://ec.europa.eu/eurostat/statistics-explained/index.php?title=Municipal_waste_statistics&oldid=343958#Municipal_waste_treatment (accessed on 9 December 2021).
  42. Scarlat, N.; Fahl, F.; Dallemand, J.F. Status and Opportunities for Energy Recovery from Municipal Solid Waste in Europe. Waste Biomass Valorization 2019, 10, 2425–2444. [Google Scholar] [CrossRef] [Green Version]
  43. Polóni, M.; Chríbik, A. Low-Energy Synthesis Gases from Waste as Energy Source for Internal Combustion Engine. SAE Int. J. Engines 2020, 13, 633–648. [Google Scholar] [CrossRef]
  44. Pavlenko, I.; Saga, M.; Kuric, I.; Kotliar, A.; Basova, Y.; Trojanowska, J.; Ivanov, V. Parameter Identification of Cutting Forces in Crankshaft Grinding Using Artificial Neural Networks. Materials 2020, 13, 5357. [Google Scholar] [CrossRef]
  45. General Instructions Digital Mass Flow. Available online: https://www.bronkhorst.com/getmedia/50bed9ce-0445-4eba-9d37-f113ec53cb34/917022-Manual-general-instructions-digital-laboratory-style-and-IN-FLOW.pdf (accessed on 12 December 2021).
  46. Puškár, M.; Bigoš, P.; Kelemen, M.; Markulik, Š.; Puškárová, P. Method for accurate measurement of output ignition curves for combustion engines. Measurement 2013, 46, 1379–1384. [Google Scholar] [CrossRef]
  47. Merker, G.P.; Schwarz, C.; Teichmann, R. Combustion Engines Development: Mixture Formation, Combustion, Emissions and Simulation; Springer: Berlin/Heidelberg, Germany, 2012; ISBN 978-3-642-02951-6. [Google Scholar] [CrossRef]
  48. Sága, M.; Bulej, V.; Čuboňova, N.; Kuric, I.; Virgala, I.; Eberth, M. Case study: Performance analysis and development of robotized screwing application with integrated vision sensing system for automotive industry. Int. J. Adv. Robot. Syst. 2020, 17, 172988142092399. [Google Scholar] [CrossRef]
  49. Tazerout, M.; Le Corre, O.; Ramesh, A. A New Method to Determine the Start and End of Combustion in an Internal Combustion Engine Using Entropy Changes. Int. J. Thermodyn. 2000, 3, 49–55. [Google Scholar]
  50. Chríbik, A.; Polóni, M.; Lach, J. Combustion engine powered by a mixture of natural gas and hydrogen. MECCA J. Middle Eur. Constr. Des. Cars 2012, 10, 31–36. [Google Scholar] [CrossRef]
  51. Chríbik, A.; Polóni, M.; Minárik, M.; Mitrovič, R.; Miškovič, Z. The effect of inert gas in the mixture with natural gas on the parameters of the combustion engine. In Computational and Experimental Approaches in Materials Science and Engineering; Springer: Cham, Switzerland, 2020; pp. 410–426. ISBN 978-3-030-30852-0. [Google Scholar]
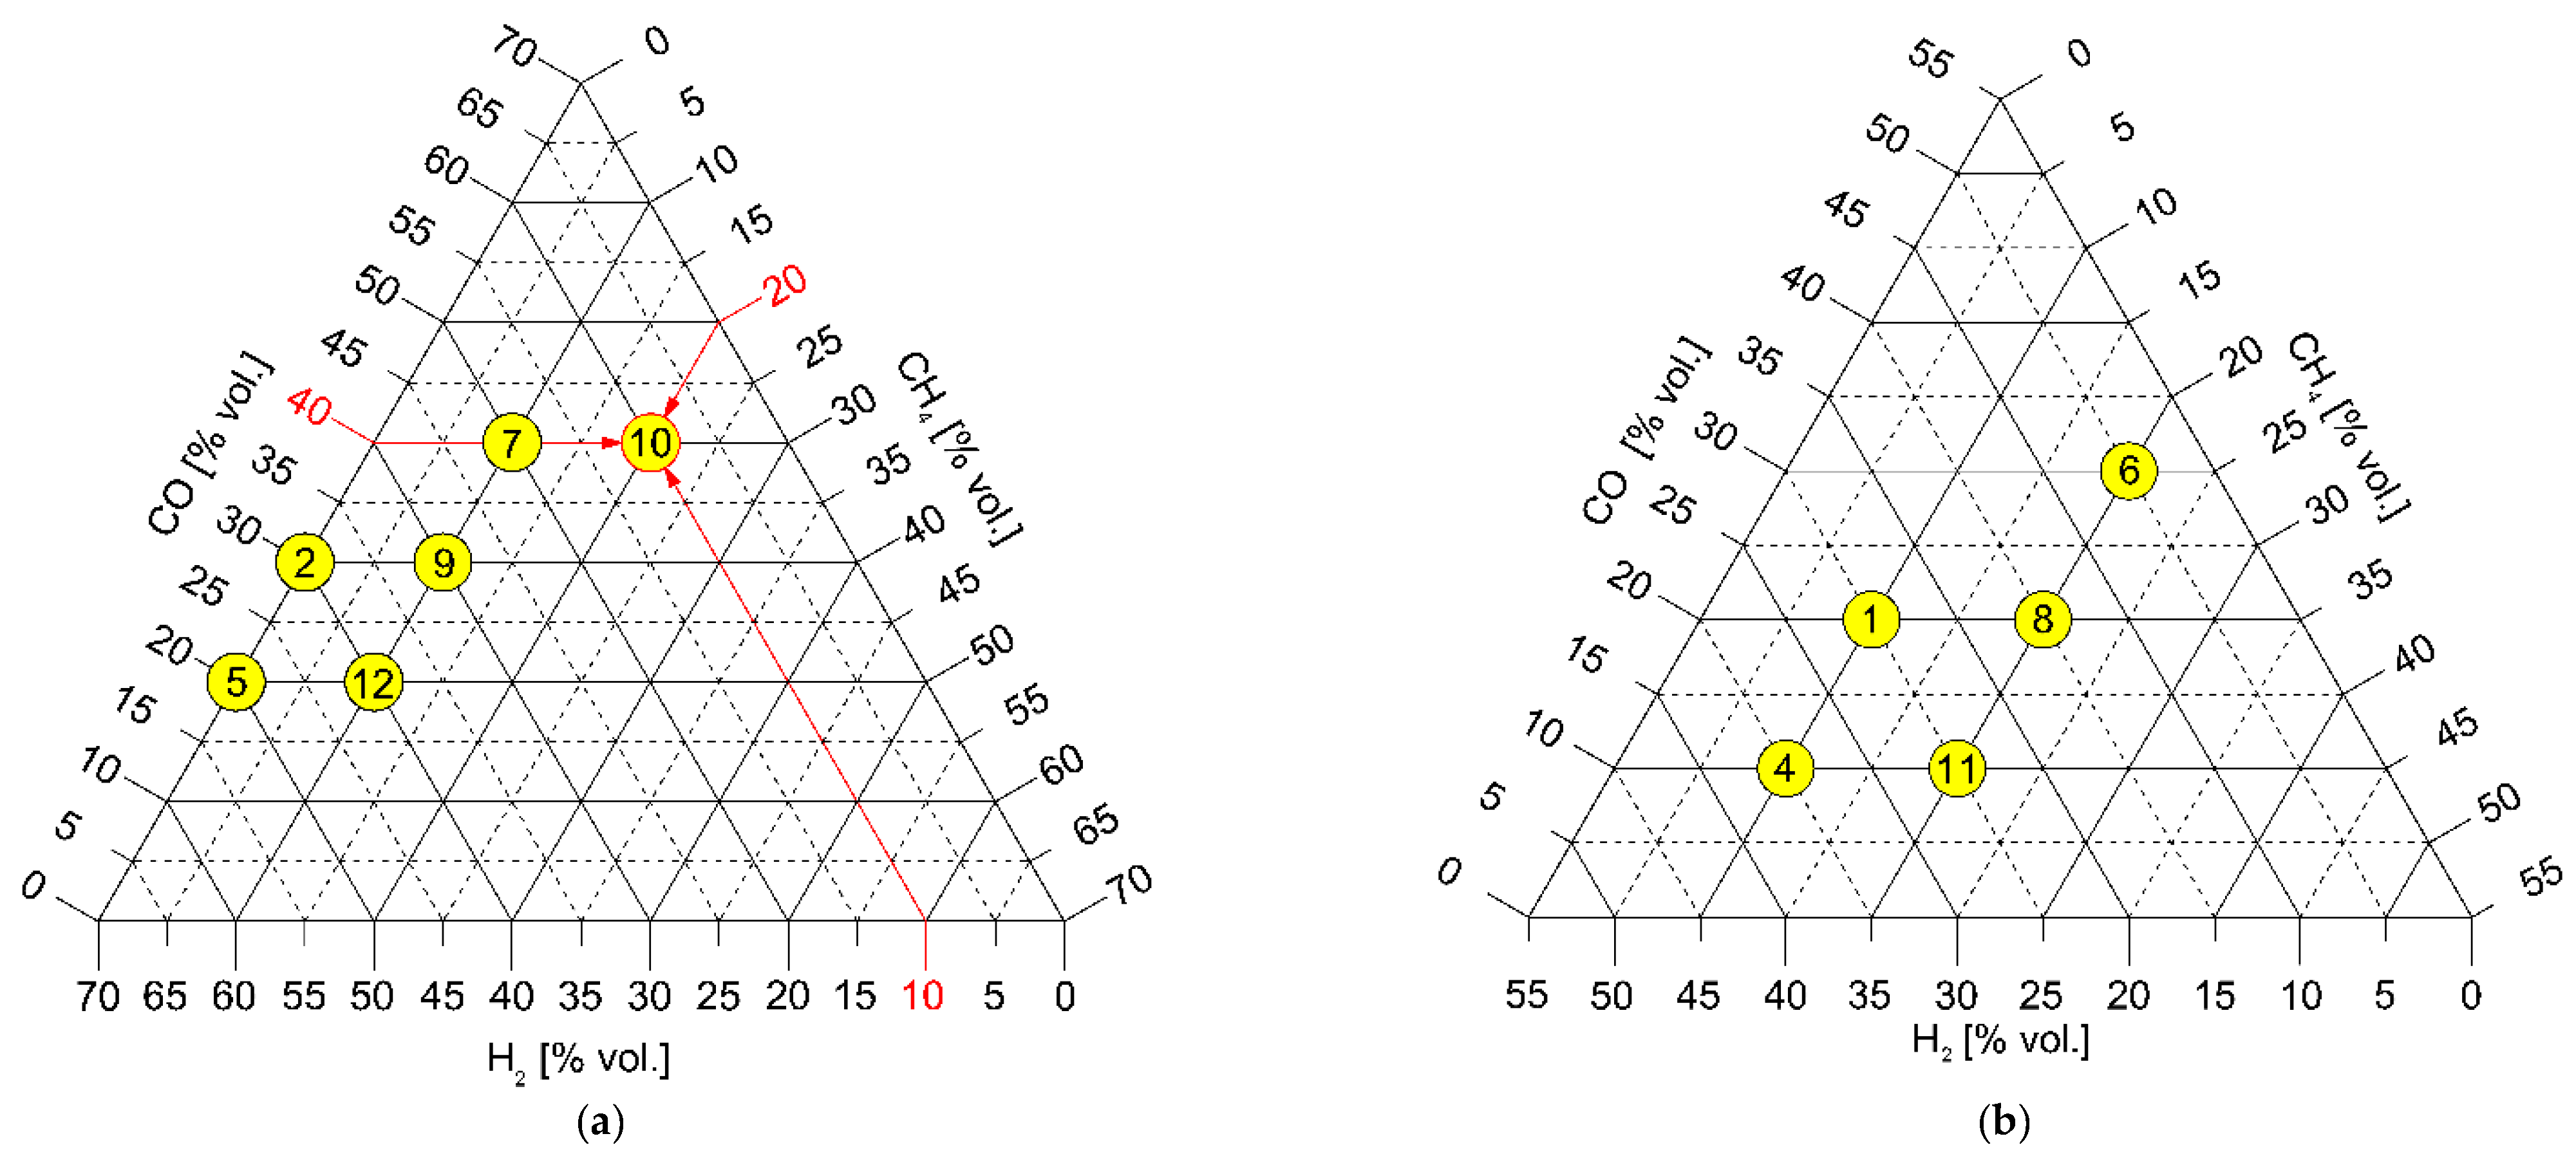
Figure 1. Ternary diagram of the composition of synthesis gases (numbers 1 to 12, except no. 3 (60% vol. inert gases)) with a constant proportion of inert gases: (a) the group of synthesis gases with a 30% vol. proportion of inert gases (25% vol. CO2, 5% vol. N2); (b) the group of synthesis gases with 45% vol. proportion of inert gases (20% vol. CO2, 25% vol. N2).
Applsci 12 00098 g001
Figure 2. The basic scheme of the combustion engine Lombardini LGW 702. (1—intake manifold, 2—position sensor of the crankshaft, 3—exhaust system, 4—exhaust temperature sensor, 5—spark plug with integrated pressure sensor, 6—dynamometer, 7—mixture richness regulation, 8—pressure bottle of methane, 9,11—mass flowmeter of gas, 10—pressure bottle of syngas, 12—stepper motor, 13—mixer with diffuser, 14—catalyst, 15—silencer, 16—broadband lambda probe).
Applsci 12 00098 g002
Figure 3. Course of brake torque Mt and hourly fuel consumption Mfuel in the engine speed characteristics for methane and synthesis gases at full load, stoichiometric mixture, and optimal angle of advance.
Applsci 12 00098 g003
Figure 4. Course of brake torque Mt and hourly fuel consumption Mfuel in the engine speed characteristics for methane and synthesis gases at full load, stoichiometric mixture, and optimal angle of advance.
Applsci 12 00098 g004
Figure 5. The course of the mean indicated pressure (IMEP) as a function of the angle (α50%MFB) of the crankshaft rotation when 50% by mass of the fuel is burned when operating on methane and synthesis gases. Conditions: 1500 L/min, full load, stoichiometric mixture.
Applsci 12 00098 g005
Figure 6. The course of the mean indicated pressure (IMEP) as a function of the angle of the crankshaft rotation (α50%MFB) when 50% by mass of the fuel is burned when operating on methane and synthesis gases. Conditions: 1500 L/min, full load, stoichiometric mixture.
Applsci 12 00098 g006
Figure 7. Pressure profile p in the cylinder of an internal combustion engine during operation on methane and synthesis gases. Conditions: 1500 L/min, full load, stoichiometric mixture, optimal start of ignition (SOI) angle for each fuel, compression curve is for air.
Applsci 12 00098 g007
Figure 8. Pressure profile p in the cylinder of an internal combustion engine during operation on methane and synthesis gases. Conditions: 1500 L/min, full load, stoichiometric mixture, optimal start of ignition (SOI) angle for each fuel, compression curve is for air.
Applsci 12 00098 g008
Figure 9. The course of the maximum pressure depending on the angle at which 50% of the fuel for methane and synthesis gases is burned. Conditions: 1500 L/min, full load, stoichiometric mixture.
Applsci 12 00098 g009
Figure 10. The course of the maximum pressure depending on the angle at which 50% mass of methane or synthesis gases is burned. Conditions: 1500 L/min, full load, stoichiometric mixture.
Applsci 12 00098 g010
Figure 11. Course of burning of fuel as dependent on the crankshaft angle for methane and synthesis gases (MFB—Mass Fraction Burned, α—Crankshaft Rotation Angle, TDC—Top Dead Centre, SOI—Start of Ignition, SOC—Start of Combustion, EOC—End of Combustion) Conditions:1500 L/min, full load, stoichiometric mixture, optimal SOI angle for each fuel.
Applsci 12 00098 g011
Figure 12. Course of burning of fuel as dependent on the crankshaft angle for methane and synthesis gases (MFB—Mass Fraction Burned, α—Crankshaft Rotation Angle, TDC—Top Dead Centre, SOI—Start of Ignition, SOC—Start of Combustion, EOC—End of Combustion) Conditions:1500 L/min, full load, stoichiometric mixture, optimum SOI angle for each fuel.
Applsci 12 00098 g012
Figure 13. Values of torque Mt 1500 as function of LHVmixture at the engine speed 1500 L/min and full load for measured SGs.
Applsci 12 00098 g013
Figure 14. Values of hourly fuel consumption Mfuel 1500 as a function of LHV at the engine speed 1500 L/min and full load for measured synthesis gases.
Applsci 12 00098 g014
Table 1. Waste management in regional cities of the Slovak Republic.
CityMSW Quantity [tons]LandfillingRecyclingWtEOther
Bratislava213,047.5809%33%56%2%
Košice97,403.3231%36%63%0%
Prešov41,586.34860%40%0%0%
Žilina46,497.67953%43%0%4%
Nitra47,382.15057%43%0%0%
B. Bystrica45.07046%54%0%0%
Trnava39,717.63544%56%0%0%
Table 2. Basic physical-chemical properties of selected medium-energy synthesis gases (lower heating value from 8–12 MJ/kg) in comparison with methane (CH4—methane, H2—hydrogen, CO—carbon monoxide, CO2—carbon dioxide, N2—nitrogen, LHV—lower heating value of fuel, A/F—air to fuel ratio, M—molar mass, ρNTP fuel—density of fuel (CH4, syngas) at NTP, ρNTP mixture—density of stoichiometric mixture (fuel + air) at NTP, Fuel in mix.—fuel in stoichiometric mixture, LHVmixture—volumetric heating value of stoichiometric mixture, SG1–SG12 are the measured synthesis gases (syngas) as sorted in ascending order by mass LHV, NTP = 20 °C, 101,325 Pa).
NameUnitCH4SG1SG2SG3SG4SG5SG6SG7SG8SG9SG10SG11SG12
CH4[% vol.]1001002010020102010202010
H2[% vol.]025401035505201530102540
CO[% vol.]0203010102030402030401020
CO2[% vol.]0202510202520252025252025
N2[% vol.]0255502552552555255
LHV[MJ/kg]50.0128.3858.4038.6509.2319.3349.3619.43310.16410.33011.03111.17111.442
LHV[MJ/m3]33.3588.1977.5508.8528.0277.37810.70810.04510.5299.88312.38910.3649.711
A/F ratio[kg/kg]17.122.492.232.792.792.532.882.683.172.993.303.553.37
M[kg/kmol]16.0423.5221.6124.6220.9219.0127.5225.6124.9223.0127.0222.3220.42
ρNTP fuel[kg/m3]0.6670.9780.8991.0240.8700.7901.1441.0651.0360.9571.1230.9280.849
ρNTP mixture[kg/m3]1.1531.1301.0901.1511.0941.0491.1881.1631.1591.1311.1851.1311.099
Fuel in mix.[% vol.]9.5133.037.529.633.137.526.729.626.829.624.526.729.6
LHVmixture[MJ/m3]3.1722.7072.8282.6192.6572.7672.8592.9732.8182.9203.0302.7672.871
Table 3. Basic parameters of the Lombardini LGW 702 spark ignition internal combustion engine together with a photo of the modified piston bottoms.
Applsci 12 00098 i001Principle of the workSpark ignition
Number of cylinders and arrangement2 in a row
Crankshaft angle [°]360
Bore/Stroke [mm]75/77.6
Swept volume [cm3]686
Compression ratio [–]12.5:1
Valve timing, driveOHC, timing belt
Preparation of the mixtureExternal in a mixer with electronic control of mixture richness to stoichiometric mixture
CoolingLiquid with forced circulation, two-circuit thermostatically controlled, radiator blown by a fan driven by an electric motor
RegulationElectronically controlled throttle
Ignition systemBrisk10DS—the highest thermal value. Ignition coil Bosch, energy 65 mJ
Publisher’s Note: MDPI stays neutral with regard to jurisdictional claims in published maps and institutional affiliations.