Article

Spectroscopic Ellipsometry and Optical Modelling of Structurally Colored Opaline Thin-Films

Department of Physics, Prifysgol Aberystwyth University, Aberystwyth SY23 3BZ, UK
*
Author to whom correspondence should be addressed.
Appl. Sci. 2022, 12(10), 4888; https://doi.org/10.3390/app12104888
Submission received: 2 April 2022 / Revised: 5 May 2022 / Accepted: 10 May 2022 / Published: 12 May 2022
(This article belongs to the Special Issue Nanophotonic Devices and Technologies)

Abstract

:
The method of spectroscopic ellipsometry is applied to complex periodic nanomaterials, consisting of shear-ordered polymeric nanosphere composites, with intense resonant structural color. A corresponding multilayer optical quasi-model of the system, parametrizing the inherent degree of sample disorder and encompassing key properties of effective refractive-index and index-contrast, is developed to elucidate the correlation between the ∆ and Ψ ellipsometric parameters and the shear-induced opaline crystallinity. These approaches offer reliable means of in-line tracking of the sample quality of such “polymer opals” in large scale processing and applications.

1. Introduction

Ellipsometry is well established as an advanced optical characterization tool, by which the key parameters of thin-film materials (such as thickness, surface roughness, and complex refractive index) may be determined over macroscopic areas by a non-invasive, non-destructive method, and potentially tracked in real time [1,2,3,4]. In addition to high precision metrology of monolithic planar layers of (for example) oxides in microelectronics [5,6,7], ellipsometric models can be developed towards single parameter, high-throughput monitoring of key processing tolerances, such as thickness uniformity and interfacial roughness, in other thin-film manufacturing processes. This is indeed pertinent where “roll-to-roll” (R2R) approaches may be applied, such as in large area organic photovoltaic (OPV) cells [8,9,10].
Amongst the many candidate smart materials and functional coatings, where ellipsometry could be used as an in-line monitor, are periodic optical materials with engineered photonic and light scattering properties [11,12]. Such photonic structures are of significantly greater optical complexity than simple dielectric layers, usually consisting of a 2D or 3D periodicity of the order of the wavelength of light. In many manifestations, the active layer may be considered as being a form of bulk heterostructure and, importantly, coloration results from structural resonance rather than oscillator absorption from pigments [13,14,15]. Hence, a key research goal in this area is to use detailed ellipsometric studies on suitable target materials to provide correlated measurements of optical constants, and to develop the most appropriate and robust optical models to describe these systems.
In this paper, a suitable target thin-film material, “Polymer opals” (POs), are therefore investigated. These consist of polymeric nanosphere composites, utilizing a core-interlayer-shell (CIS) approach, which may be shear-ordered into large-scale flexible opals [16,17]. In a number of our earlier reports, the emulsion polymerization synthesis of CIS particles (see Figure 1a) with rigid cross-linked polystyrene (PS) spheres, capped by a softer poly-ethylacrylate (PEA) shell via a poly-methylmethacrylate (PMMA) grafting layer, has been developed [18,19]. The net refractive index contrast (Δn) between the PS core and PEA shell material is therefore 0.11–0.12, with n ¯ ≈ 1.52. Engineered approaches to generating shear-induced ordering of the particle ensembles into characteristic random-hcp lattices have been a particular focus, and bending-induced oscillatory shear (BIOS [20], as illustrated in Figure 1b) has been notably successful in producing high-quality low-defect polymer opals with structural color resonances across the UV/visible and near-infrared regions. These resonances are tunable both by variation of the particle size and mechano-chromically, making POs an attractive platform for next generation coatings and R2R compatible functional materials [21,22].
Here, the method of spectroscopic ellipsometry is applied to the exemplar POs system, across a range of thin-film samples with intense resonant structural color. Building upon earlier reported multilayer ellipsometric models of the system [23], a quasi-model encompassing the inherent degree of sample disorder and key properties of effective refractive-index and index-contrast is developed to elucidate the correlation between the ellipsometric parameters and the shear-induced opaline crystallinity. These approaches offer reliable means of in-line tracking of the sample quality, homogeneity, and engineering tolerance of such complex periodic nanomaterials in large scale processing and applications. Other candidate technologies for non-contact in-line monitoring of POs, in various current states of viability, might include hyperspectral imaging [24] and coherence tomography [25,26]; ellipsometry may in future be used as either a complementary or an alternative method to these.

2. Materials and Methods

2.1. Samples

The structurally colored polymeric opal materials used in this paper are based on ensembles of core-interlayer-shell (CIS) particles, as synthesized at Aberystwyth University and Varichem Ltd., via a multi-stage emulsion polymerization process [18,27,28]. As illustrated in Figure 1, the CIS particle precursors have a total diameter of around 220 to 250 nm, and consist of a relatively rigid cross-linked polystyrene (PS) core, coated with a thin polymer layer containing poly(methyl-methacrylate) (PMMA) as a grafting agent, and a soft poly(ethyl-acrylate) (PEA) outer-shell. The particular batch of “green opal” used here has been widely characterized previously as having a mean CIS diameter of 223 nm with a poly-dispersity of better than 1% size variation [17,28]. The fractional refractive index contrast between core and shell material (Δn/n) is ascertained to be ≈0.07, with the volume fraction of PS core particles in the material set at about 50% by the initial reaction mix composition. The average index ( n ¯ ) is independently determined as being 1.52, by sample refractometry [27]. A MiniLab mini-extruder (Haake, Technik, Vreden, Germany) was used at a temperature of 150 °C to melt-homogenize the material and to produce extrudate ribbons of thickness 1 mm.
Film samples for ellipsometric studies are then produced via the BIOS process. The ribbons are roller-laminated between two pre-cleaned PET sheets at 80 °C, giving a polymer opal thin film of ≈150 µm thickness in a ‘Timoshenko sandwich’ arrangement between the sheets (Figure 1b). The sandwich beam was then drawn over rollers of 2 cm diameter, at a stabilized temperature of 85 °C and shear-rate ≈ 1 cm s−1. Multiple samples were generated varying the number of BIOS shear passes between 0 and 40, in order to investigate the effects of improving particle ordering. After processing, the opals have a characteristically brilliant blue–green iridescence (Figure 1c), and can then be readily peeled away from the PET tapes to produce free-standing films as required. Experimental and micrographic determinations of the physical mechanisms of BIOS shear-ordering, and the resultant structural ordering metrics, have been extensively reported on [17,28,29] and theoretically elucidated elsewhere [30], and these issues are thus not a focus of the present paper.

2.2. Ellipsometry

The polarimetric response of the PO samples is measured using a Woollam RC2 spectroscopic ellipsometer instrument and with the BIOS processing direction (see Figure 1c) aligned parallel to the plane of incidence-detection. As per standard, ellipsometry measures the complex reflectance ratio (ρ) of the films at an incidence angle of θ I , parametrized by the amplitude component (Ψ) and the phase difference (∆). By definition and convention,
ρ = r p r s = tan Ψ · e i Δ ,
where rp and rs are the reflectance amplitude coefficients in the p- and s-polarizations of incident light, respectively [31]. With ρ being measured across a spectrum from λ = 210 to 1660 nm, it is then possible to determine the parameters as a function of wavelength; Ψ(λ) and Δ(λ).

2.3. Modelling and Simulation

We note that there are marked differences between the approach used here for the structurally colored periodic arrays and those standard methodologies used for dielectric layers with resonant oscillator absorption (e.g., Drude model) [32].
To further elucidate the roles of both order/disorder and index-contrast in the polarimetric properties of POs, we have developed an optical multilayer quasi-model of the opaline structures, as developed from our earlier studies of the development of structural color [33]. Previous characterizations of POs have repeatedly confirmed the intuitive packing of the (111) plane at the top surface next to the PET laminate, and the subsequent stacking/layering normal to the plane. Hence representing the in-plane periodicity of the opals, rather than their exact three-dimensional structure, the model thus consists of non-absorbing λ/4n layer-pair stacks of the high and low n components giving resonant reflectivity at central λ0 corresponding to the experimental data, as illustrated in Figure 1d. Whilst the quasi-model focuses on generic matching to optical properties; as a rough consistency check when λ0 = 560 nm, we can compare the implied PS layer of thickness 89 nm to the core particle radius of 85 nm and the implied PEA layer thickness of 95 nm to the shell-to-shell thickness of ~80 nm.
Coherent superposition at the reflectance peak is disrupted by the cumulative phase shifts from thickness fluctuations (disorder) since the light penetrates to depths of 10–100 layers in such low ∆n systems (i.e., Bragg length, LB). Indeed, the model is restricted to 15 alternating pairs of layers, which corresponds to a total depth of around 3 microns, which is safely beyond the values for LB, as calculated in our earlier simulation reports [28]. The layers are also modified to have an inbuilt disorder, whereby there is a Gaussian-distributed thickness variation of width (standard deviation) δ, which accounts for deviations from perfect crystalline order within the photonic crystal. As a quantitative example, a value of δ = 15 nm for λ/4 layer thicknesses of 150 nm would represent a fractional disorder of 10%, and so on. The reflectivity amplitudes (rp and rs) of these model structures are calculated at specified angles of incidence using a transfer-matrix method averaged over many cycles [34], and the ellipsometric parameters, Δ and Ψ, are then determined across the spectral using the standard definitions as above. In order to give meaningful outputs that are representative of the time- and spatially-averaged bulk properties, we apply a “Monte-Carlo” type approach to average out the inherently chaotic variations over a number of cycles/iterations, until an acceptably stable and reproducible output is reached.
Whilst both δ and refractive-index contrast, ∆n, may be varied within this model, the values of the effective refractive index ( n ¯ ≈ 1.52) and ∆n (≈0.02) may be set based on the semi-empirical micrographic analysis from Zhao et al., whereby the periodicity and amplitude in the ∆n contrast have been ascertained as a function of sample depth [17,29]. This value of ∆n is lower than the notional nPSnPEA value, on account of how the layer-by-layer stacking of the intercalated spheres translates into the one-dimensional interlayer model. The parameter δ may then be varied in order to match the simulated ellipsometric parameters with the experimental data, and this is seen to give realistic spectral profiles with Lorentzian FWHM values of 50–60 nm. The fitting of these simulated outputs to appropriate analytical functions is detailed below in the Section 3.

3. Results

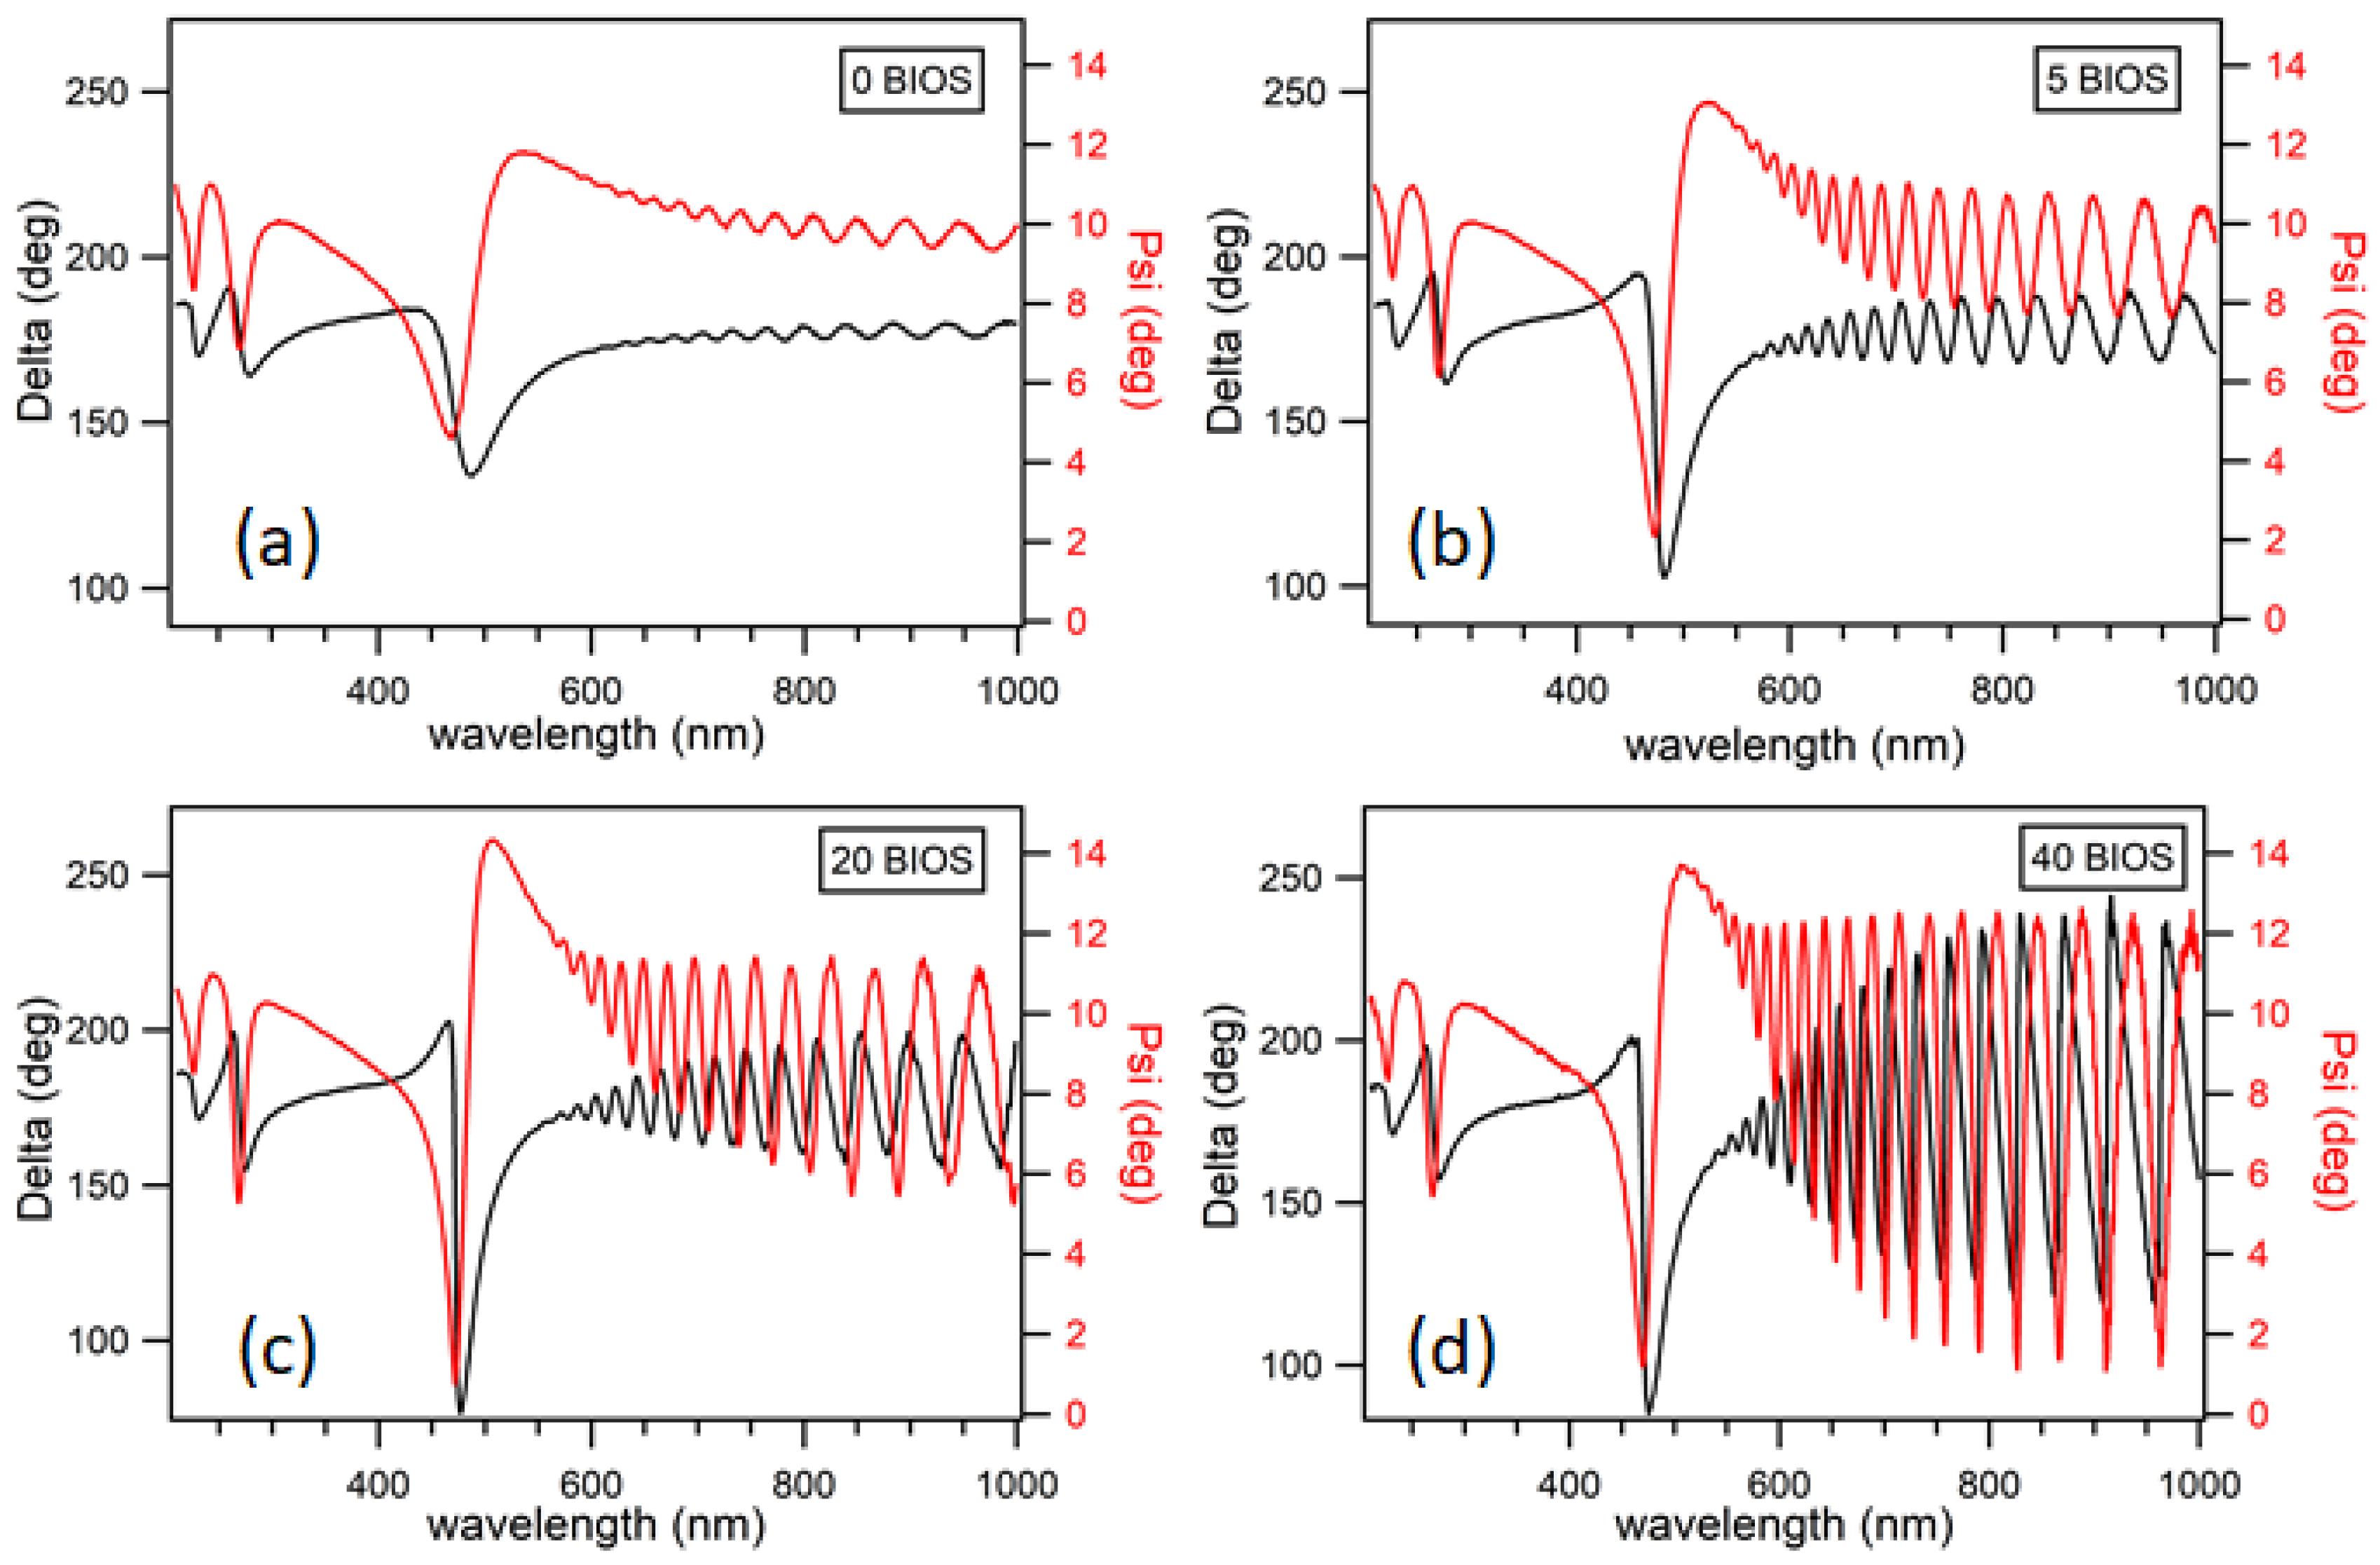
3.1. Experimental Ellipsometry
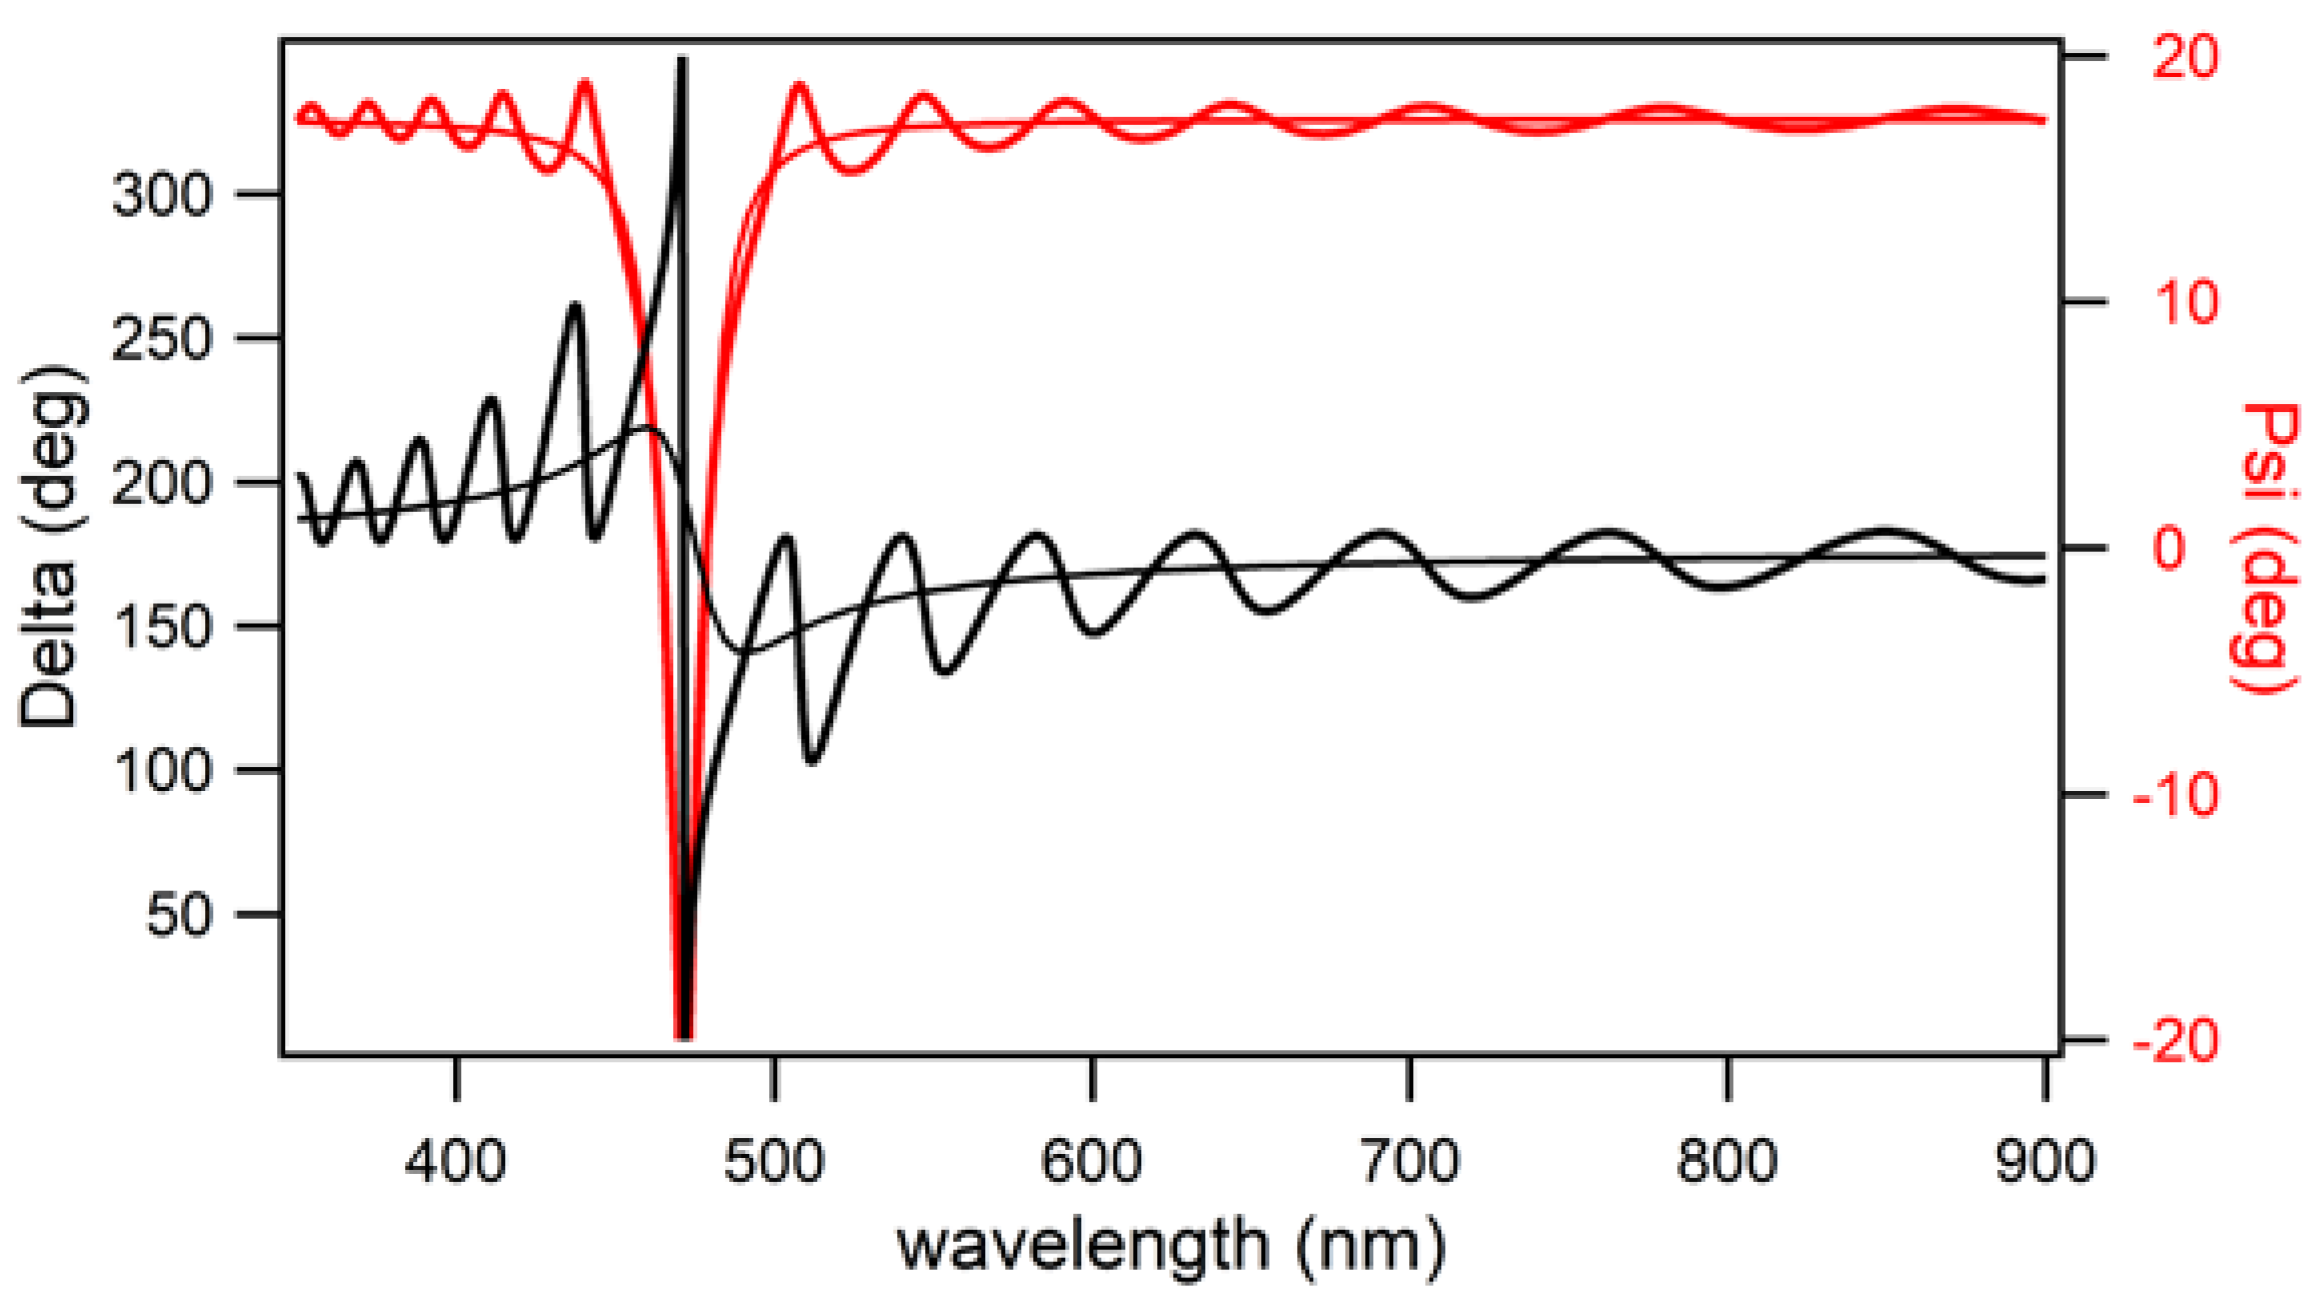
Experimental spectroscopic data showing ellipsometric parameters delta (∆) and psi (Ψ) are shown in Figure 2. In each case, broad resonant features are seen around the structural colour peak at λ ≈ 460 nm ( θ I = 50°). The sharpness and intensity of these features, as inferred from a Lorentzian FWHM fitting of Ψ(λ), increases markedly as the structural order is improved by BIOS processing (Table 1); and the effect of sequential ordering up to 40 BIOS shear-cycles is evident.
A notable artifactual feature in these spectra is the periodic modulation phenomena at the long wavelength end (near-IR). The wavelength spacing of these fringes (of order 30 nm) is indicative of thin-film interference from structures of thickness order tens of microns, and amplitudes apparently become more pronounced as the BIOS processing of samples is increased. Additionally, all samples show absorptive behaviors at the short wavelength end, well above the structural color feature.

3.2. Simulation

As an illustration of the simulation outputs, Figure 3 shows the ellipsometric parameters ∆(λ) and Ψ(λ) at incidence angle θ I = 50° and with low disorder (δ = 0). In order to extract parameter metrics from these simulations which can be meaningfully compared to experiments, appropriate fitting functions were developed for the ∆ and Ψ plots vs. wavelength (or frequency/energy). The parameter Ψ may be conveniently fitted to a Lorentzian resonance lineshape
Ψ ( ω ) = y 0 + A ( ω ω 0 ) 2 + B ,
where the ratio of constants A/B is indicative of the amplitude of resonance at ω 0 , and the FWHM may be evaluated as 2 B . As per the expected Kramer–Krönig consistent relationship between the Lorentzian Ψ spectrum and the dispersive ∆ spectrum [35], these metrics may also be extracted from a fitting, thus
Δ ( ω ) = y 0 + A ( ω ω 0 ) 2 + B 1 / ( ω ω 0 ) .
Particularly within these conditions of low disorder, the simulations also show the periodic modulation phenomena, with some similarity to the effects noted experimentally. However, the fringes here tend to occur over the entire wavelength range, rather than being prominent only in the infra-red end of the spectrum. At wavelengths outside of the resonance condition, this overall structure presents a dielectric layer, which is around 3 microns thick, and where interference phenomena may arise from the reflections at the substrate and superstrate interfaces. The disorder uncertainly introduced at higher values of δ causes the fringing to become less pronounced (as is also seen in the experimental data trends). A rough calculation of thickness L, based on the spacing of fringes (∆λ) being 50 nm in the near-IR at 900 nm, and taking into account the refractive index n ¯ of 1.52 and incidence angle of 50°, gives L = λ 2 sin θ I / 2 n Δ λ = 3.4 microns, which is acceptably close to the notional value. The fringing in the experimental data (Figure 2) shows a tighter arrangement with smaller ∆λ, reflecting the greater thicknesses of the “real” sample structures.
To attain a perspective of how the global simulation inputs can be varied to achieve a matching with the experimental data, in Figure 4, simulation outputs of line fitting of the ellipsometric parameters at spectral resonance are shown as the refractive index contrast (∆n) and Gaussian disorder factor (δ) are varied. As expected, increasing ∆n leads to a sharper optical resonance, with increasing amplitude and commensurate narrowing, which are both a strong function of ∆n in the pertinent 0.15–0.25 range (Figure 4a). Increasing δ rather has the effect of reducing the resonance amplitude and increasing the linewidth (Figure 4b). As δ increases past around 25 nm (corresponding to a fractional layer-thickness variation of 27%), the spectral feature can no longer be clearly discerned.

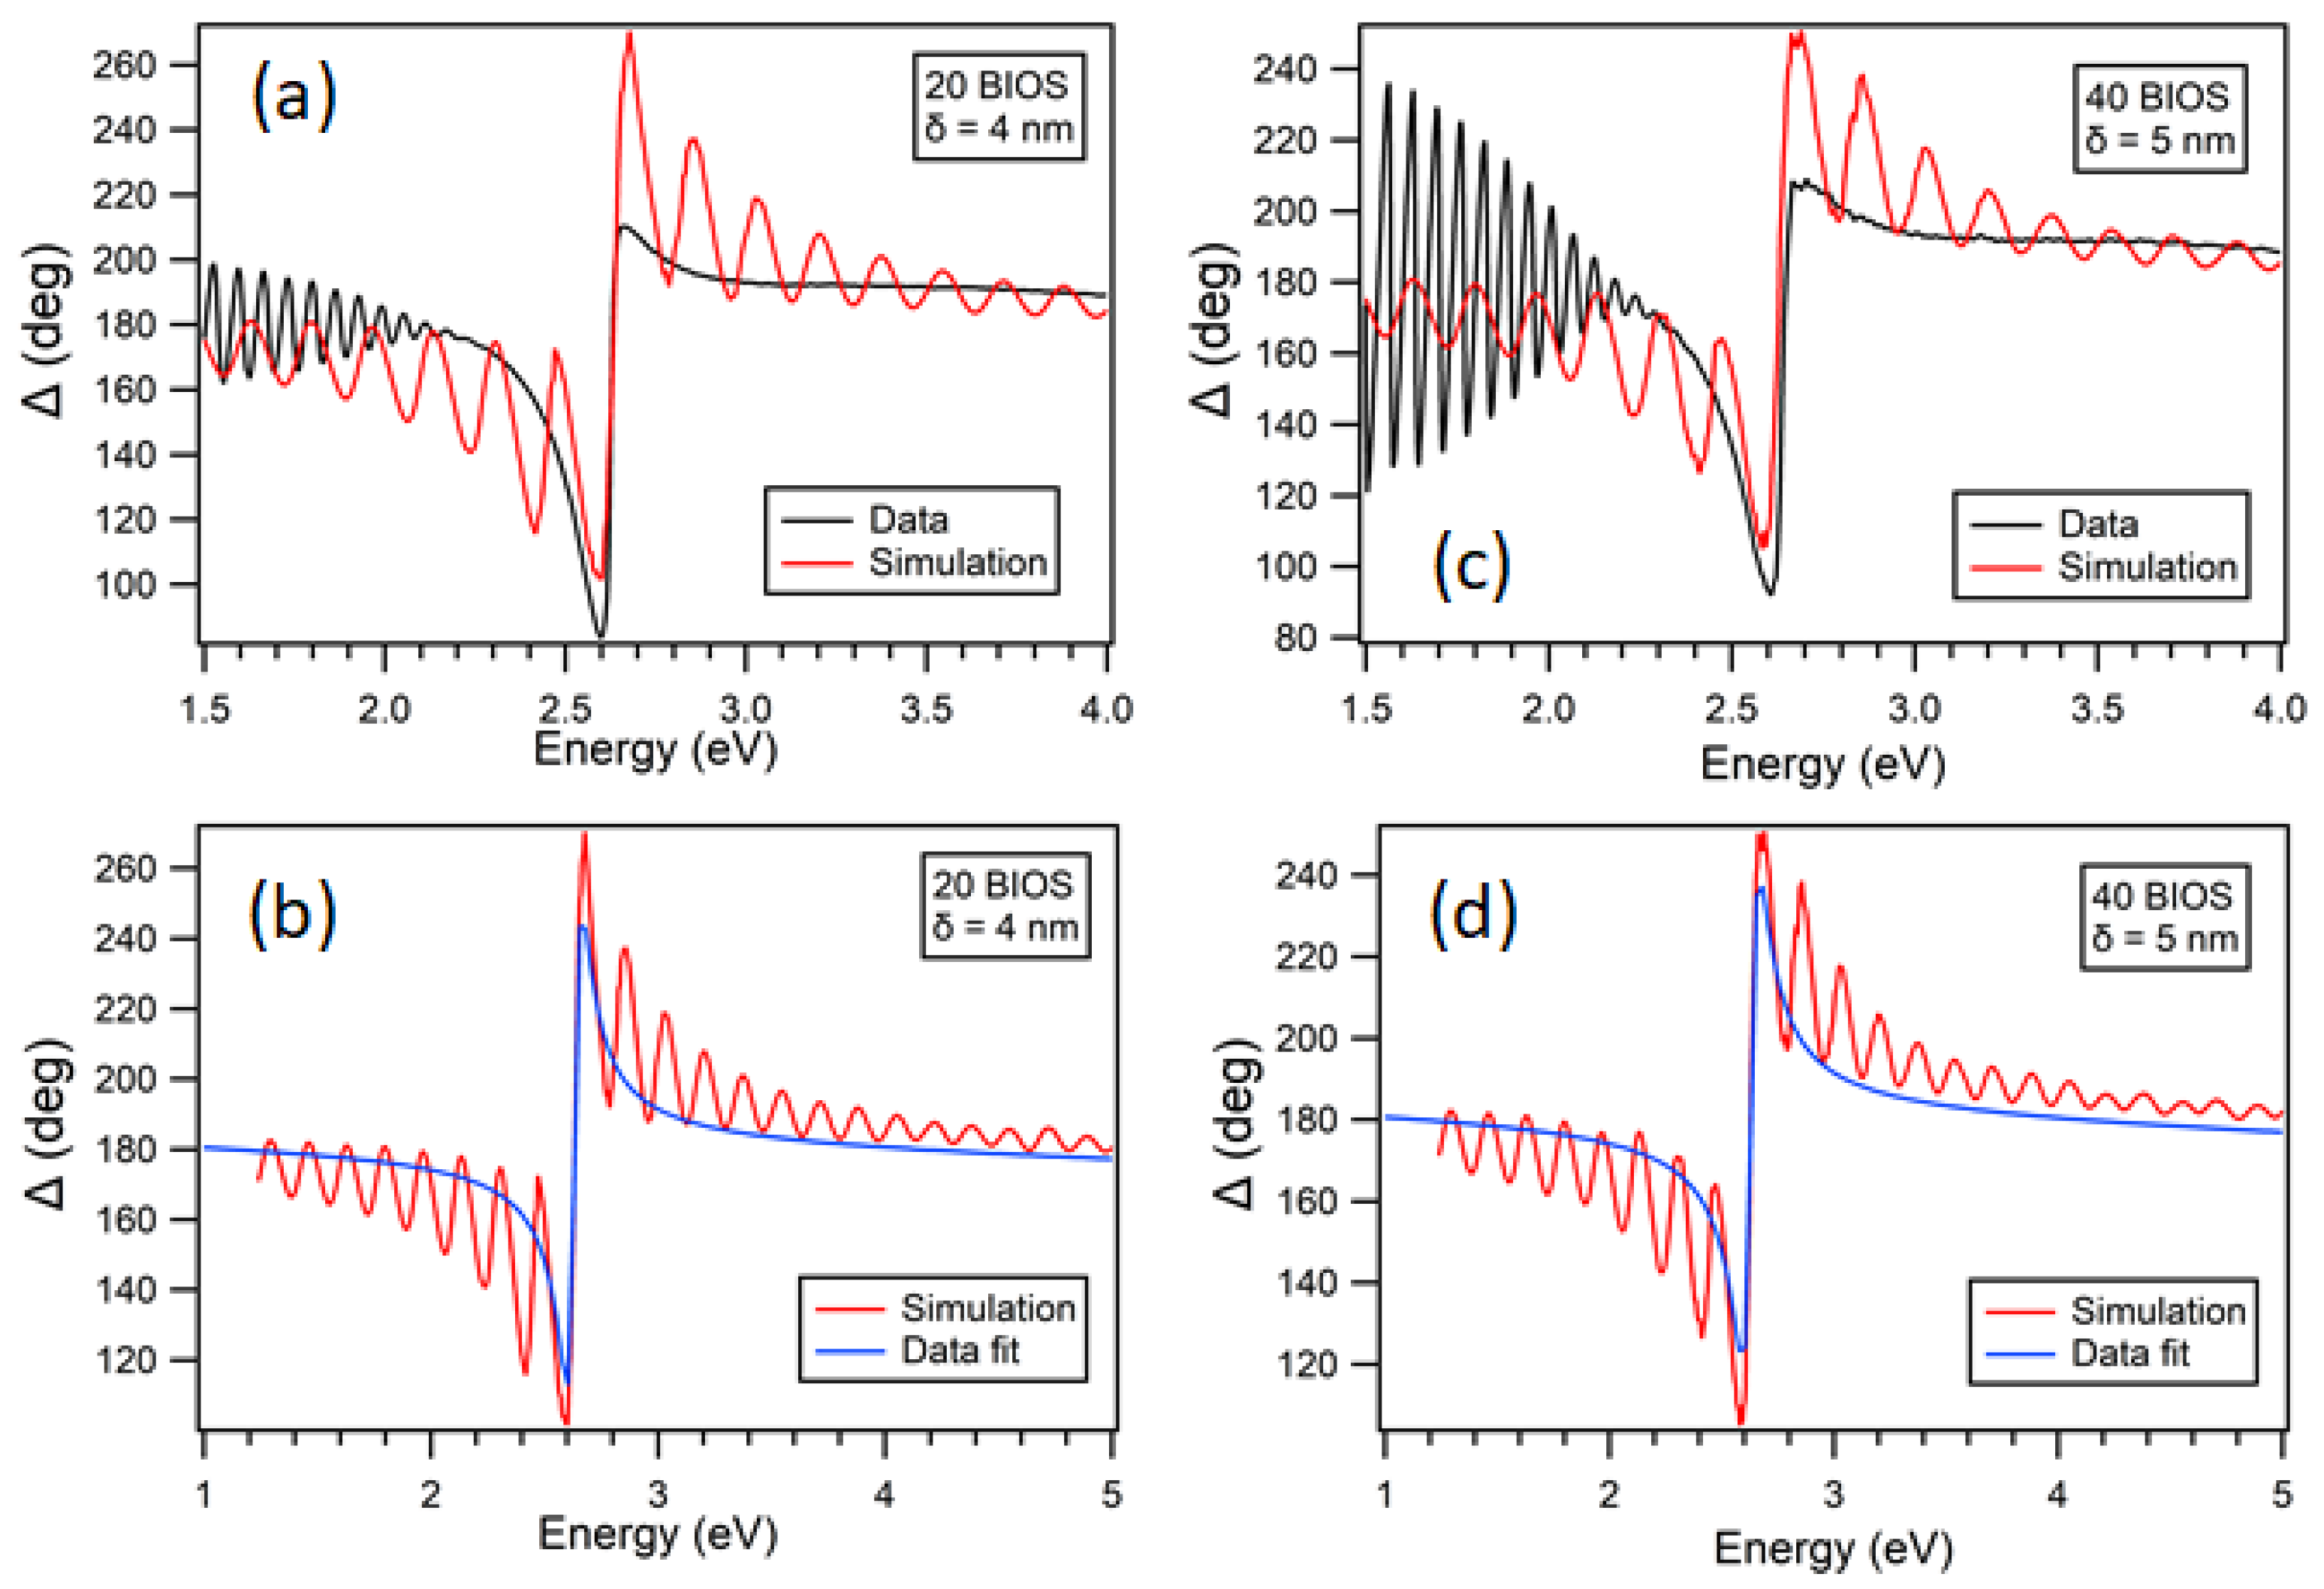
3.3. Matching of Data to Simulation Outputs

In Table 1, some comparisons of the experimental data and the simulation derived optical resonances are given, with the values n ¯ = 1.52 and ∆n = 0.02 being fixed in the model, as described above. It can be seen how the parameter δ may be varied across a range of 4 to 19 nm (or 5–21% of average λ/4-layer thickness) to iterate to a close fit for each of the sample groups studied. Of note, is the marked decrease in the δ value of best fit between the relatively disordered “0-BIOS” samples and the BIOS shear-ordered 5-BIOS and 20-BIOS samples. Beyond ~20-BIOS passes, these well-ordered samples no longer show a strong variation in terms of the optimized δ parameter; indeed, in line with earlier reports [28], there are some indications of degradation in the surface ordering quality with the continued application of shear-ordering beyond equilibration.
Note that the simulations by their nature do not give us an analytical/formulaic output that can simply be fitted to data. However, Figure 5 shows the confirmatory corresponding matching of experimentally measured and fitted ellipsometric parameters of Ψ and ∆ as a function of photon energy with the outputs from simulation models as per Table 1. These show a reliable qualitative agreement of functional trends for all the cases studied, and also a good quantitative fit, in terms of the Lorentzian derivative amplitude, for samples where BIOS had been applied.

4. Discussion and Conclusions

In summary, the method of spectroscopic ellipsometry is applied to the exemplar of the BIOS shear-assembled polymer opals system, across a range of thin-film samples with intense resonant structural color. A corresponding multilayer optical quasi-model of the system, encompassing the inherent degree of sample disorder and key properties of effective refractive-index and index-contrast, is developed to elucidate the correlation between the ellipsometric ∆ and Ψ parameters and the shear-induced opaline crystallinity.
The reported simulations give reliable outputs and predictive trends across the wide range of sample parameter space explored. Using empirically derived values of n ¯ and ∆n, the variation in the bulk ordering of samples may be effectively and reproducibly tracked within the model via a Gaussian disorder parameter. Fitted matching of the experimentally measured ellipsometric parameters with the outputs from simulation models show a reliable qualitative and quantitative agreement for all the cases studied.
Improved ellipsometric models of structurally colored materials may be also be further applied to imaging ellipsometry methods to provide spatially correlated measurements of optical constants associated with the layers under study [36,37]. With application to large area applications and high-throughput processing, these approaches thus offer reliable means of in-line tracking of the sample quality, homogeneity, and engineering tolerance of such complex periodic nanomaterials.

Author Contributions

Conceptualization, G.R., J.J.T. and C.E.F.; methodology, G.R., J.J.T. and C.E.F.; software, C.E.F.; formal analysis, C.E.F.; investigation, G.R., J.J.T. and C.E.F.; resources, G.R., J.J.T. and C.E.F.; writing—original draft preparation, C.E.F.; writing—review and editing, G.R. and C.E.F.; supervision, C.E.F.; project administration, C.E.F.; funding acquisition, C.E.F. All authors have read and agreed to the published version of the manuscript.

Funding

This research was funded in part by Llywodraeth Cymru KESS-2 (European Social Fund), SPARC-II (European Regional Development Fund).

Institutional Review Board Statement

Not applicable.

Informed Consent Statement

Not applicable.

Data Availability Statement

Data supporting reported results can be found at Aberystwyth University PURE repository, https://doi.org/10.20391/e20c9d21-9264-45c3-aee2-98711d02ac6d (accessed on 9 May 2022).

Acknowledgments

The authors thank Jeremy J. Baumberg (University of Cambridge, UK), for early development of simulation coding and models, and Varichem Ltd., U.K. for provision of materials.

Conflicts of Interest

The authors declare no conflict of interest.

References

  1. Vedam, K. Spectroscopic ellipsometry: A historical overview. Thin Solid Films 1998, 313, 1–9. [Google Scholar] [CrossRef]
  2. Ramsdale, C.M.; Greenham, N.C. The optical constants of emitter and electrode materials in polymer light-emitting diodes. J. Phys. D Appl. Phys. 2003, 36, L29–L34. [Google Scholar] [CrossRef]
  3. Tomes, J. Imaging Ellipsometry as a Novel Detection Method for Protein-Protein Interactions. Ph.D. Thesis, Aberystwyth University, Aberystwyth, UK, 2019. [Google Scholar]
  4. Woollam, J.A.; McGahan, W.A.; Johs, B. Spectroscopic Ellipsometry Studies of Indium Tin Oxide and Other Flat-Panel Display Multilayer Materials. Thin Solid Film. 1994, 241, 44–46. [Google Scholar] [CrossRef]
  5. Irene, E.A. Applications of Spectroscopic Ellipsometry to Microelectronics. Thin Solid Film. 1993, 233, 96–111. [Google Scholar] [CrossRef]
  6. Tompkins, H.G.; Hilfiker, J.N. Spectroscopic Ellipsometry: Practical Application to Thin Film Characterization; Momentum Press: New York, NY, USA, 2016. [Google Scholar]
  7. Herzinger, C.M.; Johs, B.; McGahan, W.A.; Woollam, J.A.; Paulson, W. Ellipsometric determination of optical constants for silicon and thermally grown silicon dioxide via a multi-sample, multi-wavelength, multi-angle investigation. J. Appl. Phys. 1998, 83, 3323–3336. [Google Scholar] [CrossRef]
  8. Krebs, F. All solution roll-to-roll processed polymer solar cells free from indium-tin-oxide and vacuum coating steps. Org. Electron. 2009, 10, 761–768. [Google Scholar] [CrossRef]
  9. Dou, B.; Whitaker, J.B.; Bruening, K.; Moore, D.T.; Wheeler, L.M.; Ryter, J.; Breslin, N.J.; Berry, J.J.; Garner, S.M.; Barnes, F.S.; et al. Roll-to-Roll Printing of Perovskite Solar Cells. ACS Energy Lett. 2018, 3, 2558–2565. [Google Scholar] [CrossRef]
  10. Kim, Y.Y.; Yang, T.Y.; Suhonen, R.; Kemppainen, A.; Hwang, K.; Jeon, N.J.; Seo, J. Roll-to-Roll gravure-printed flexible perovskite solar cells using eco-friendly antisolvent bathing with wide processing window. Nat. Commun. 2020, 11, 11. [Google Scholar] [CrossRef]
  11. Shen, X.Q.; Wu, P.; Schafer, C.G.; Guo, J.; Wang, C.C. Ultrafast assembly of nanoparticles to form smart polymeric photonic crystal films: A new platform for quick detection of solution compositions. Nanoscale 2019, 11, 1253–1261. [Google Scholar] [CrossRef]
  12. Schafer, C.G.; Gallei, M.; Zahn, J.T.; Engelhardt, J.; Hellmann, G.P.; Rehahn, M. Reversible Light-, Thermo-, and Mechano-Responsive Elastomeric Polymer Opal Films. Chem. Mater. 2013, 25, 2309–2318. [Google Scholar] [CrossRef]
  13. Joannopoulos, J.D. Photonic Crystals; Princeton: Princeton, NJ, USA, 2008. [Google Scholar]
  14. Kinoshita, S.; Yoshioka, S.; Miyazaki, J. Physics of structural colors. Rep. Prog. Phys. 2008, 71, 30. [Google Scholar] [CrossRef] [Green Version]
  15. Klatt, M.A.; Steinhardt, P.J.; Torquato, S. Gap Sensitivity Reveals Universal Behaviors in Optimized Photonic Crystal and Disordered Networks. Phys. Rev. Lett. 2021, 127, 6. [Google Scholar] [CrossRef] [PubMed]
  16. Finlayson, C.E.; Spahn, P.; Snoswell, D.R.E.; Yates, G.; Kontogeorgos, A.; Haines, A.I.; Hellmann, G.P.; Baumberg, J.J. 3D Bulk Ordering in Macroscopic Solid Opaline Films by Edge-Induced Rotational Shearing. Adv. Mater. 2011, 23, 1540–1544. [Google Scholar] [CrossRef] [PubMed] [Green Version]
  17. Zhao, Q.; Finlayson, C.; Snoswell, D.; Haines, A.; Schafer, C.; Spahn, P.; Hellmann, G.; Petukhov, A.; Herrmann, L.; Burdet, P.; et al. Large-scale ordering of nanoparticles using viscoelastic shear processing. Nat. Commun. 2016, 7, 11661. [Google Scholar] [CrossRef] [Green Version]
  18. Ruhl, T.; Spahn, P.; Hellmann, G.P. Artificial opals prepared by melt compression. Polymer 2003, 44, 7625–7634. [Google Scholar] [CrossRef]
  19. Viel, B.; Ruhl, T.; Hellmann, G. Reversible deformation of opal elastomers. Chem. Mater. 2007, 19, 5673–5679. [Google Scholar] [CrossRef]
  20. Finlayson, C.; Baumberg, J. Generating Bulk-Scale Ordered Optical Materials Using Shear-Assembly in Viscoelastic Media. Materials 2017, 10, 688. [Google Scholar] [CrossRef] [Green Version]
  21. Finlayson, C.E.; Baumberg, J.J. Polymer opals as novel photonic materials. Polym. Int. 2013, 62, 1403–1407. [Google Scholar] [CrossRef] [Green Version]
  22. Li, H.T.; Wu, P.; Zhao, G.W.; Guo, J.; Wang, C.C. Fabrication of industrial-level polymer photonic crystal films at ambient temperature Based on uniform core/shell colloidal particles. J. Colloid Interface Sci. 2021, 584, 145–153. [Google Scholar] [CrossRef]
  23. Ahles, M.; Ruhl, T.; Hellmann, G.P.; Winkler, H.; Schmechel, R.; von Seggern, H. Spectroscopic ellipsometry on opaline photonic crystals. Opt. Commun. 2005, 246, 1–7. [Google Scholar] [CrossRef]
  24. Allender, E.J.; Stabbins, R.B.; Gunn, M.D.; Cousins, C.R.; Coates, A.J. The ExoMars Spectral Tool (ExoSpec): An image analysis tool for ExoMars 2020 PanCam imagery. In Proceedings of the Conference on Image and Signal Processing for Remote Sensing XXIV, Berlin, Germany, 10–12 September 2018. [Google Scholar]
  25. Thrane, L.; Jorgensen, T.M.; Jorgensen, M.; Krebs, F.C. Application of optical coherence tomography (OCT) as a 3-dimensional imaging technique for roll-to-roll coated polymer solar cells. Sol. Energy Mater. Sol. Cells 2012, 97, 181–185. [Google Scholar] [CrossRef]
  26. Alarousu, E.; AlSaggaf, A.; Jabbour, G.E. Online monitoring of printed electronics by Spectral-Domain Optical Coherence Tomography. Sci. Rep. 2013, 3, 4. [Google Scholar] [CrossRef] [PubMed] [Green Version]
  27. Spahn, P.; Finlayson, C.E.; Etah, W.M.; Snoswell, D.R.E.; Baumberg, J.J.; Hellmann, G.P. Modification of the refractive-index contrast in polymer opal films. J. Mater. Chem. 2011, 21, 8893–8897. [Google Scholar] [CrossRef]
  28. Rosetta, G.; An, T.; Zhao, Q.B.; Baumberg, J.J.; Tomes, J.J.; Gunn, M.D.; Finlayson, C.E. Chromaticity of structural color in polymer thin film photonic crystals. Opt. Express 2020, 28, 36219–36228. [Google Scholar] [CrossRef]
  29. Zhao, Q.; Finlayson, C.; Schaefer, C.; Spahn, P.; Gallei, M.; Herrmann, L.; Petukhov, A.; Baumberg, J. Nanoassembly of Polydisperse Photonic Crystals Based on Binary and Ternary Polymer Opal Alloys. Adv. Opt. Mater. 2016, 4, 1494–1500. [Google Scholar] [CrossRef] [Green Version]
  30. Finlayson, C.E.; Rosetta, G.; Baumberg, J.J. An Experimental and Theoretical Determination of Oscillatory Shear-Induced Crystallization Processes in Viscoelastic Photonic Crystal Media. Materials 2021, 14, 5298. [Google Scholar] [CrossRef]
  31. Hecht, E. Optics, 4th ed.; Pearson Education: San Francisco, CA, USA, 2002. [Google Scholar]
  32. Tompkins, H.; Haber, E.A. Handbook of Ellipsometry; William Andrew Publishing: New York, NY, USA, 2005. [Google Scholar]
  33. Snoswell, D.; Kontogeorgos, A.; Baumberg, J.; Lord, T.; Mackley, M.; Spahn, P.; Hellmann, G. Shear ordering in polymer photonic crystals. Phys. Rev. E 2010, 81, 020401. [Google Scholar] [CrossRef]
  34. Born, M.; Wolf, E. Principles of Optics: Electromagnetic Theory of Propagation, Interference and Diffraction of Light; Pergamon: Oxford, UK, 1964. [Google Scholar]
  35. Azzam, R.M.A.; Bashara, N.M. Ellipsometry and Polarized Light; Elsevier: Amsterdam, The Netherlands, 1987. [Google Scholar]
  36. Jin, G.; Jansson, R.; Arwin, H. Imaging ellipsometry revisited: Developments for visualization of thin transparent layers on silicon substrates. Rev. Sci. Instrum. 1996, 67, 2930–2936. [Google Scholar] [CrossRef]
  37. Bammer, F.; Huemer, F. Inline thickness measurement with imaging-ellipsometry. In Proceedings of the Joint TC1-TC2 International Symposium on Photonics and Education in Measurement Science, Jena, Germany, 17–19 September 2019. [Google Scholar]
Figure 1. The core-interlayer-shell structure of polymer precursor particles is illustrated in (a), with the polystyrene (PS), poly(methyl-methacrylate) (PMMA) and poly(ethyl-acrylate) (PEA) components as indicated. In schematic (b), the processing of particles into ordered arrays using the bending-induced oscillatory shear (BIOS) is illustrated, as bending shear is applied to the material encapsulated within rigid PET layers. In (c), a photographic image of a resultant thin-film polymer opal sample is shown, which the shear-processing direction indicated by arrow. The scale bar is approximately 1 cm. In (d), the multilayer pseudo-model used to evaluate ellipsometric constants at incident angle θ is illustrated, where a random disorder of δ nm (Gaussian distribution) is introduced into λ/4 layers of alternating higher and lower refractive index (n1, n2).
Applsci 12 04888 g001
Figure 2. Experimental data showing ellipsometric parameters delta (∆, left) and psi (Ψ, right) as a function of wavelength. Results from polymer opal films with 0, 5, 20, and 40 BIOS shear processing steps are shown in (ad), respectively.
Applsci 12 04888 g002
Figure 3. Simulation outputs showing ellipsometric parameters delta (∆, left) and psi (Ψ, right) as a function of wavelength at incidence angle θ = 50° (δ = 0, ∆n = 0.02, 250 iteration cycles). The corresponding fitting functions used to determine the Lorentzian height and FWHM are superimposed on the ∆ and Ψ plots.
Applsci 12 04888 g003
Figure 4. Simulation outputs of Lorentzian line fitting of the Ψ ellipsometric parameter at spectral resonance. In (a), refractive index contrast (∆n) is varied for a model structure where the Gaussian disorder factor is held constant at δ = 10 nm. In (b), similar simulation outputs are displayed as δ is varied for a model structure where ∆n is held constant at 0.02. Transfer matrix models are averaged over 150 cycles, and indicative smoothing-spline fits are added to each of the plots.
Applsci 12 04888 g004
Figure 5. Comparisons of the experimentally measured ellipsometric parameter ∆ as a function of photon energy with the outputs from simulation models shown in (a) for 20-BIOS and in (c) for 40-BIOS, as indicated. The corresponding matching of the resultant Lorentzian data fitting with the simulations are also shown in (b) for 20-BIOS and in (d) for 40-BIOS.
Applsci 12 04888 g005
Table 1. Comparison of experimental and simulation outputs relating to the Ψ(λ) and ∆(λ) ellipsometric parameters for the range of samples studied, with one-sigma confidence intervals. The corresponding nearest matching Gaussian disorder factor is listed in each case.
Ψ
SampleExperimental FWHM (nm)Simulation
FWHM (nm)
Experimental FWHM (eV)Simulation
FWHM (eV)
Disorder (δ) Factor for Best Fit
(±0.5 nm)
0-BIOS48.5 (±1.7)47.9 (±0.6)0.298 (±0.034)0.351 (±0.004)19
5-BIOS28.8 (±1.6)28.3 (±0.3) 0.166 (±0.017)0.124 (±0.002)10
20-BIOS19.6 (±1.5)18.7 (±0.2)0.066 (±0.005)0.086 (±0.003)4
40-BIOS22.6 (±3.5)20.2 (±0.1)0.077 (±0.011)0.097 (±0.003)5
Publisher’s Note: MDPI stays neutral with regard to jurisdictional claims in published maps and institutional affiliations.

