Article

Optimization of Pre-Splitting Blasting Hole Network Parameters and Engineering Applications in Open Pit Mine

Resources and Environment, College of Mining, Guizhou University, Guiyang 550025, China
*
Author to whom correspondence should be addressed.
Appl. Sci. 2022, 12(10), 4930; https://doi.org/10.3390/app12104930
Submission received: 15 April 2022 / Revised: 29 April 2022 / Accepted: 10 May 2022 / Published: 13 May 2022
(This article belongs to the Special Issue Advances in Engineering Geology of Rocks and Rock Masses)

Abstract

:
In order to optimize the parameters of a pre-splitting blasting hole network, taking an open-pit mine in Inner Mongolia as the engineering background, the numerical models of different pore sizes and hole spacing were established by LS-DYNA software. The stress wave propagation law, peak stress change and rock fracture state under various working conditions were analyzed. The optimization formula of a hole network relationship was proposed and verified on site. The results show that the shock wave generated by the explosion propagates rapidly upward from the explosion source and forms a plastic flow zone around the two boreholes. The energy consumption is the largest at this stage. With the propagation of the stress wave, energy dissipates, and its waveform gradually attenuates to a compression wave and seismic wave. In each working condition, a 110 mm aperture first cracked in the stress wave superposition area compared with other working conditions, while a 120 mm aperture delayed evolution to the seismic wave compared with different borehole aperture, and the energy attenuation rate is the slowest. Meanwhile, the fastest energy attenuation rate is with the 130 mm borehole aperture. With the attenuation of the propagation energy of the stress wave, among the four measuring points set at the center of the connection between the two boreholes, the Y-direction stress of the observation points B, C and D is stable between 2.3 and 3.5 MPa, and the Y-direction stress of the observation point A is strenuous between −1.3 and 1.2 MPa. The B, C and D observation points of 90–130 mm aperture conditions showed rock cracking at 7–9 times, 7–9 times, 7–10 times, 7–11 times, and 7–11 times hole spacing, respectively. The cracks of the two boreholes were interconnected. The optimal hole network relationship is obtained by fitting: y = 1.12 + 0.076x, where y is the optimal hole diameter and hole spacing multiple, and x is the hole diameter, which is verified by engineering. After blasting, the slope is smooth and smooth, and the half-hole rate is guaranteed to be above 90%.

1. Introduction

In recent years, with the vigorous development of the blasting industry, the international community’s requirements for blasting safety are becoming more and more strict. Limited by geological conditions and technical requirements, pre-splitting blasting is widely used in engineering to reduce the vibration damage of blasting to surrounding buildings and ensure that the rock mass is not excessively damaged. Pre-splitting blasting has the purpose of reducing the propagation of stress waves, reducing blasting vibration, ensuring the integrity of the slope, and not excessively damaging the rock mass [1,2,3,4]. Pre-splitting blasting is to make the pre-splitting hole detonate before the main blasting hole and form a pre-splitting crack between the blasting area and the rear protection slope so as to block the propagation of stress wave, reduce blasting vibration and protect the integrity of the slope. In the pre-splitting blasting engineering, the effect of pre-splitting blasting is mainly affected by the hole network parameters, charge structure, blocking material and other factors. Unreasonable hole network parameters will lead to excessive destruction of rock mass or not form pre-cracking, which not only cannot achieve the preset effect but also wastes manpower and material resources, and it even causes safety risks [5,6]. To solve this problem, domestic and foreign scholars have conducted a lot of research on blasting parameters. Paurush et al. [7] selected controllable blasting design parameters affecting peak particle velocity (PPV) for ground vibration assessment. Two prominent statistical tools, principal component analysis (PCA) and stepwise selection and elimination (SSE), were used to identify the key controllable parameters affecting PPV. Multiple linear regression (MLR) technology was used to determine the correlation coefficients between 44 field test blasting design parameters and PPV. Kabetenov et al. [8] take into account the action time of the explosion pulse generated by the gas outflow of the detonation product, and they derive the relationship between the reasonable drilling and blasting parameters that minimize the drilling cost under the same rock crushing quality. Li et al. [9] studied the west slope of an open-pit coal mine in Buzhaoba and optimized the pre-splitting blasting parameters; they also analyzed the blasting effect and optimal blasting parameters under different blasting parameters in fragile rock mass. Yuan et al. [10] used the geological conditions of Nanliang Mine and proposed a method of pre-splitting blasting residual coal pillars. The influence mechanism of pre-splitting blasting on residual coal pillars was analyzed by combining theoretical analysis with numerical simulation, and the reasonable blasting parameters were determined. Chen [11] analyzed the influence of empty hole diameter and charge coefficient on crack propagation, determined the appropriate hole spacing, and used the LS-DYNA explosion model to illustrate the stress propagation, strain change, and the evolution of main cracks and wing cracks between holes. Sharma et al. [12] established the dominant parameters of blasting parameters in open-pit mines and then established the average fragment size prediction model by using multiple linear regression analysis technology, and they selected the optimized parameters. Roy et al. [13], with other parameters unchanged in four large open-pit coal mines in India, established the blasting design parameters, and the influence of the total explosive weight detonated in the blasting wheel on the blasting vibration amplitude was studied. Yang et al. [14,15], based on a digital laser dynamic caustic test, analyzed the influence of pre-crack formed by pre-splitting blasting on the dynamic fracture characteristics of explosive cracks and primary cracks. It is considered that the pre-crack formed by pre-splitting blasting can prevent the propagation of explosive crack into reserved rock mass and aggravate the damage of rock mass. Ma et al. [16] discussed the crack formation mechanism of pre-splitting blasting, obtained the calculation formula of pre-splitting hole spacing, and verified the vibration reduction effect of pre-splitting blasting. He et al. [17] optimized the pre-splitting blasting model by using numerical simulation software LS-DYNA and applied it to the field so that the effective half-hole rate was more than 20% and the vibration reduction rate was 28.2%.
Domestic and foreign scholars use mathematical methods, numerical simulation, field test, similar simulation test, theoretical analysis and other methods to study the blasting parameters from the blasting effect, damage degree, blasting safety, pre-cracking and other aspects. However, the optimization of pre-splitting blasting hole network parameters is not perfect. Based on the contribution made by predecessors and the theory proposed in this paper, taking an open pit mine in Inner Mongolia as the engineering background, the parameters of the pre-splitting blasting hole network are optimized and verified by theoretical analysis, numerical simulation and field test in order to provide some reference for similar projects.

2. Theoretical Analysis of Pre-Splitting Blasting

2.1. Rock Blasting Failure Theory

The shock wave generated by the explosion of explosives in the rock mass produces much greater pressure on the rock mass than the dynamic compressive strength of the rock mass, which is also the basic condition for the cavity area around the explosives. This area is a broken area, which is small but absorbs most of the energy generated by the explosion of explosives, and the attenuation rate of stress wave is the highest [18,19]. After the formation of the fracture zone, the unexhausted energy continues to propagate in the rock mass in the form of stress wave. When the tensile stress of the rock mass is greater than the dynamic tensile strength of the rock, the tensile stress is the main cause of rock failure. After the formation of the radial crack of the rock, the elastic deformation energy stored in the rock mass due to the impact is released. At this time, the direction of the tensile stress is opposite to the direction of the radial pressure, and the centripetal tensile stress is generated. The tensile stress is greater than the tensile strength of the rock. The rock again produces cracks. At this time, the crack is a circumferential crack. The circumferential crack and the radial crack are interconnected and staggered. The rock blasting mechanism is shown in Figure 1.

2.2. Propagation Law of Explosion Stress Wave

When the stress wave propagates in the rock mass, its magnitude decreases with the increase in propagation distance, and the nature and shape of the wave also change accordingly. According to the different properties, shapes and action results of the wave, the propagation process of the shock wave can be divided into three action regions, as shown in Figure 2, where R is the radius of the charge. The peak pressure of the shock wave is much larger than the dynamic compressive strength of the rock in the range of three to seven times the radius of the explosive source, which causes plastic deformation of the rock and consumes most of the energy. This range is the shock wave area. After the stress wave passes through the area, the energy is greatly depleted, and it attenuates into a stress wave without a steep wave peak. The state parameters on the wave front become relatively flat, which is called the stress wave action area or the compression stress wave action area. After the stress wave passes through the area, its strength and energy are further attenuated and evolved into seismic waves. Its effect can only cause elastic vibration of rock particles, but it cannot cause rock damage. The time when rock particles leave the static state is equal to the time when they return to the static state.
After the explosion acts on the rock mass, the explosion stress wave propagates outward from the explosion source. The distance relationship between the peak stress and the explosion source can be expressed as [20,21]:
σ r max = p 1 r ¯ α
In the formula, p1—radial peak stress of rock element and α—the attenuation coefficient of stress wave.
For radial peak stress, uncoupled charge is used, and p1 is expressed as [22]:
p 1 = 1 8 ρ a D a 2 r a r b 6 m
In the formula, ρ a —density of explosives, Da—explosive detonation velocity, ra, rb —charge radius and hole radius, and m—pressure increase coefficient, generally m = 8–11.
σ θ max = w σ r max
The value of w is related to the distance between the stress wave front and the explosion source and the Poisson’s ratio u of the rock. When the stress wave front is close to the explosion source, w = 1, and when the stress wave front is far from the explosion source, the coefficient w approaches w = μ / ( 1 μ ) [23,24].
According to α = 2 μ 1 μ and simultaneous Formula (1), we can obtain:
p 1 = σ r max r ¯ ( 2 μ 1 μ )
According to Formulas (2)–(4):
σ r max = ρ a D a 2 r a r b 6 m 8 r ¯ ( 2 μ 1 μ )
According to Formulas (1)–(5):
σ θ max = w ρ a D a 2 r a r b 6 m 8 r ¯ ( 2 μ 1 μ )
According to w = μ / ( 1 μ ) and Formula (6), we can obtain:
σ θ max = μ ( 1 μ ) . ρ a D a 2 r a r b 6 m 8 r ¯ ( 2 μ 1 μ )
According to isentropic correlation theory, isentropic exponent initial stress is introduced:
p 0 = 1 2 ( K + 1 ) ρ a D a 2
Combining Formulas (7) and (8), the expressions of radial compressive stress and tangential tensile stress considering the initial stress of isentropic index can be obtained:
σ r max = ( K + 1 ) p 0 r a r b 6 m 4 r ¯ ( 2 μ 1 μ )
σ θ max = μ ( 1 μ ) . ( K + 1 ) p 0 r a r b 6 m 4 r ¯ ( 2 μ 1 μ )
Formula: adiabatic isentropic index of K-explosive.

3. Engineering Overview

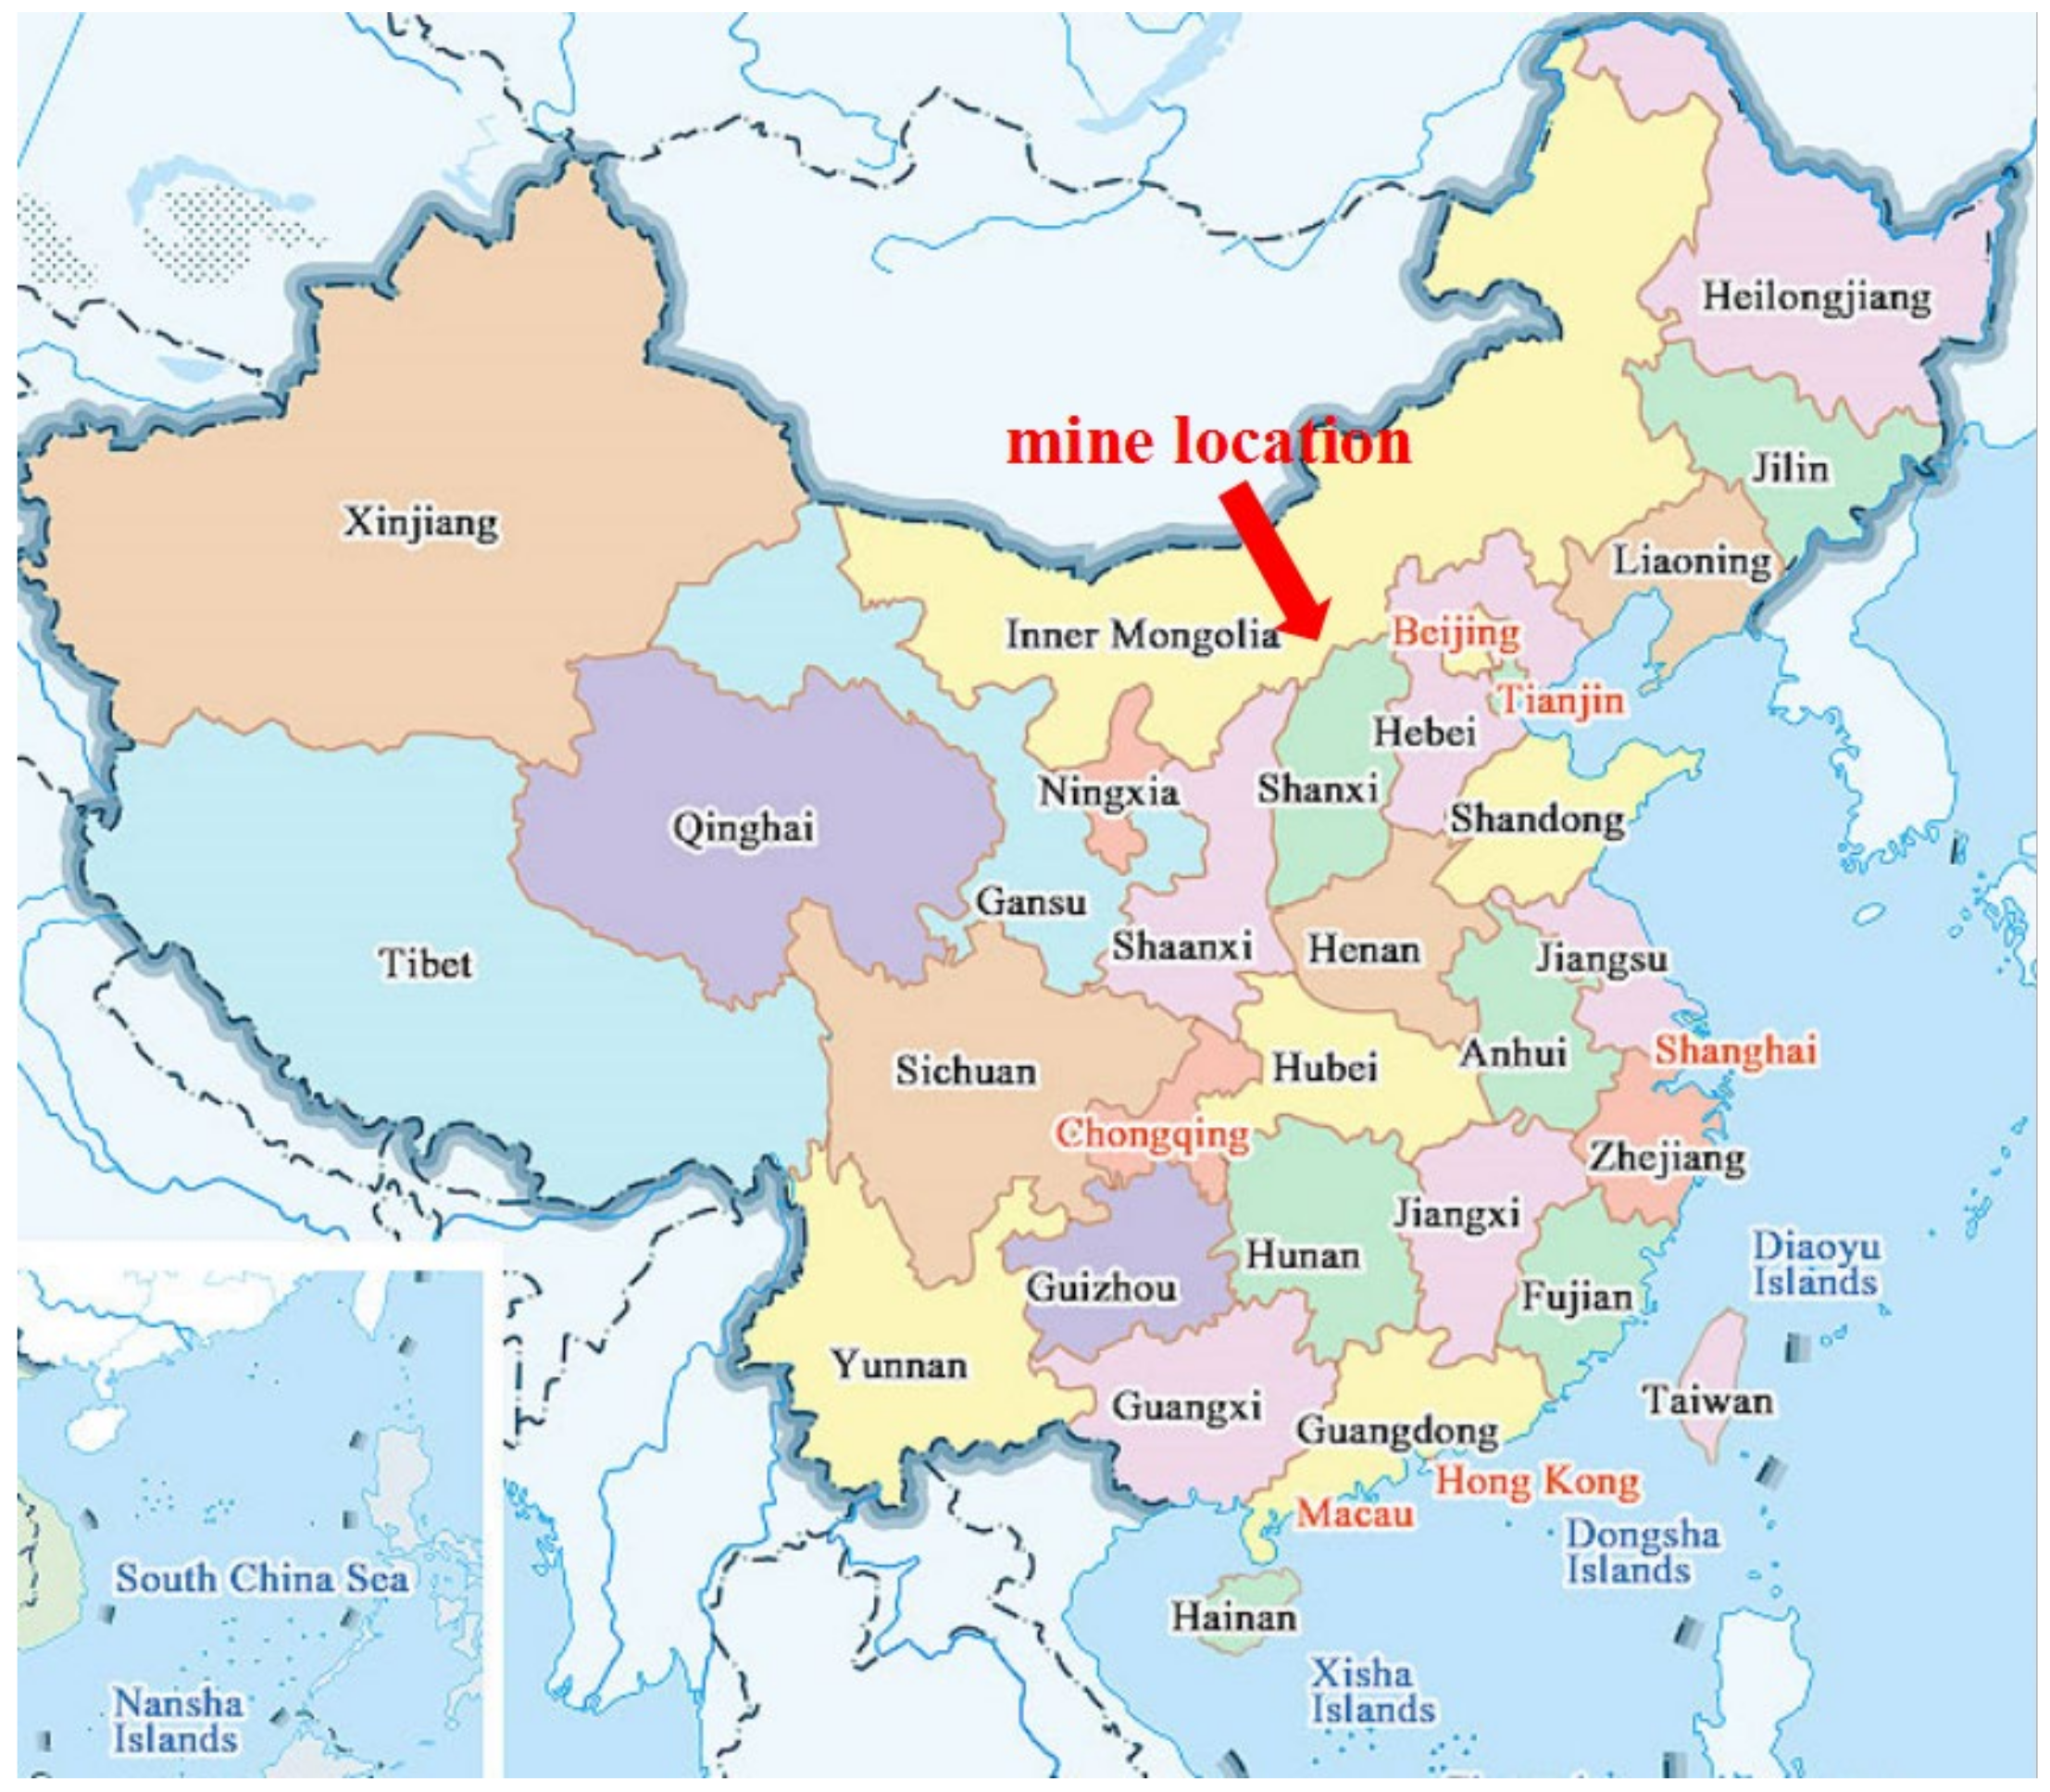
The explosion area is located in an iron mine in Ordos, Inner Mongolia. The administrative division is under the jurisdiction of Subuga Town, Yijinhuoluo Banner, Ordos City, Inner Mongolia Autonomous Region. It is about 42 km west from Sini Town, the seat of Hangjin Banner government, 35 km east from Alten Xire Town, the seat of Yijinhuoluo Banner government, and 63 km east from Dongsheng District, Ordos City. The climate in this region is a typical plateau semi-arid continental climate. It is cold in winter, hot and dry in summer, and windy in spring. The annual rainfall is less, and the temperature difference is large. The rainfall is mostly concentrated in July and August, and the annual precipitation is 187.7–526.2 mm. The wind force in spring and winter is large, generally above grade 3, and the maximum is up to grade 8. The wind direction is mostly northwest; the wind speed is generally 3.2 m/s, and the maximum is 22 m/s. There are no residents and buildings near the area, and the blasting conditions are good. According to the relevant geological data, the stope is mostly magnetite, hematite and other minerals, and the rock hardness coefficient is f = 8–14. The rock mass structure of the mine slope is divided as shown in Table 1. Through sampling in the mining area, the rocks are processed into standard cylindrical specimens, and indoor rock mechanics tests are carried out. The results are as follows: the Poisson‘s ratio of quartzite is 0.28, elastic modulus is 94 GPa, tensile strength is 3.9 MPa, internal friction angle is 37°, cohesion is 7.2 MPa; the feldspar slate is 0.23, elastic modulus is 82 GPa, tensile strength is 3.4 MPa, internal friction angle is 31°, cohesion is 6.8 Mpa, mica schist is 0.2, elastic modulus is 98 GPa, tensile strength is 4.8 MPa, internal friction angle is 48°, and cohesion is 9.2 Mpa. The location of the mining area is shown in Figure 3.
Through field geological survey and geological exploration data, there is no fault near the slope. The joints and fractures of rock mass are developed, and the rock mass structure is a fractured block structure. The comprehensive occurrence of strata in the field is 94° < 65°. The occurrence of joint J1 is 282° < 34°, the extension length is less than 5 m, the joint surface is tensile, the opening is less than 6.0 mm, the local iron is contaminated, and the linear density is more than 5 pieces/m. It has a rough surface, mostly mud, cuttings filling, joint surface combination for separation, and poor combination. The occurrence of joint J2 is 185° < 46°, the extension length is less than 6 m, the joint surface is tensile, the opening is less than 6.0 mm, the local iron is contaminated, and the linear density is greater than 3/m. It has a rough surface, mostly mud, cuttings filling, joint surface combination for separation, and poor combination.
The seismic fortification intensity of this area is 6 degrees. The basic acceleration value Ah is 0.05 g, and the vertical Av is 0; the characteristic period Tg of the seismic response spectrum is 0.35 s; there is no large active fault passing through the study area, and there are no other adverse geological phenomena affecting the slope stability. Overall, the stability and geological tectonic environment in the study area are good.

4. Engineering Practice

4.1. Blasting Parameter Design

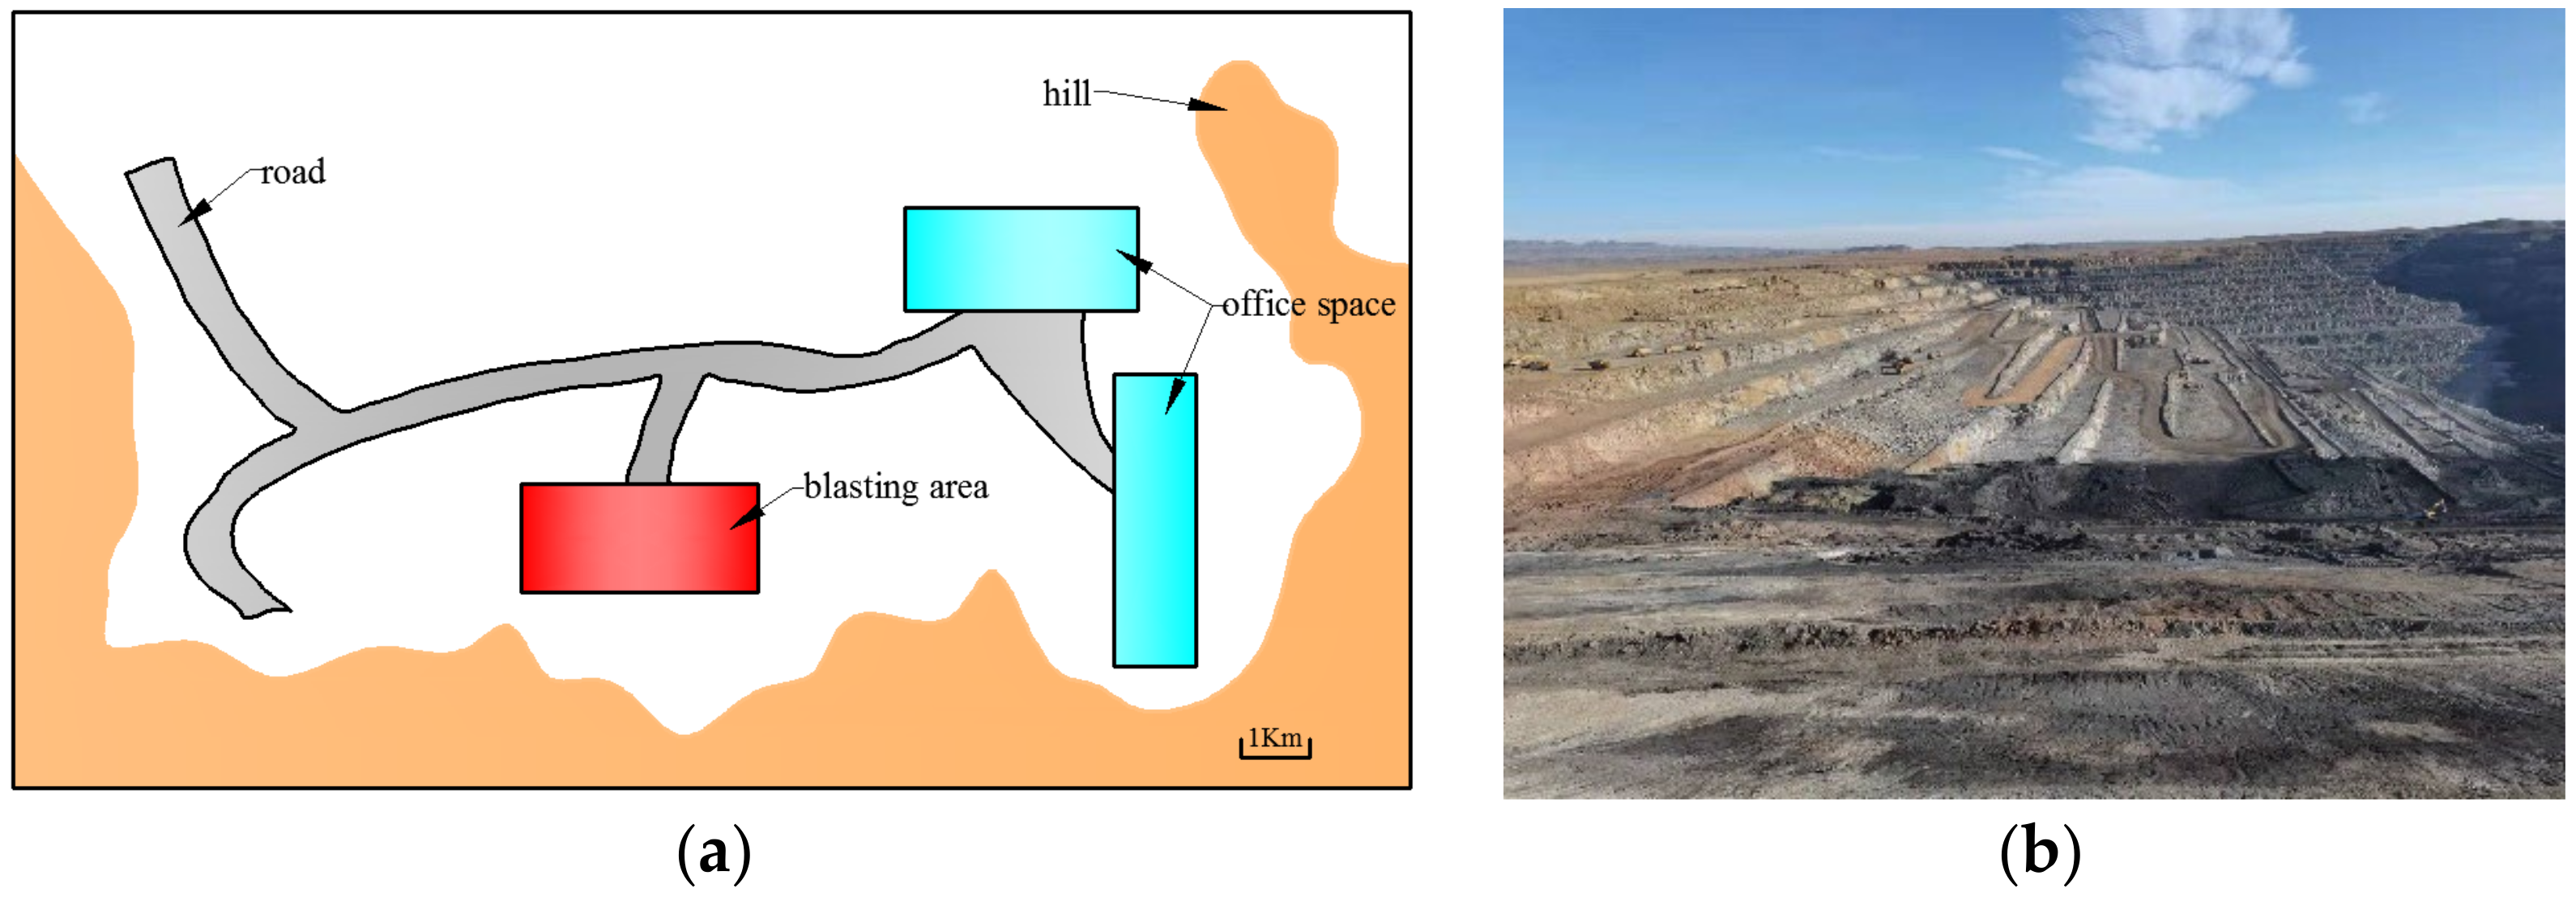
The blasting is located in the western 10 line mining area to the north of the tailings pond edge. There is no protective structure around 800 m, and the overall blasting environment is good, as shown in Figure 4.
According to the actual situation, the pre-splitting hole diameter is 100 mm, the explosive is emulsified explosive, the diameter of the coil is 32 mm, the uncoupling coefficient is 2.82, the hole spacing is 1 m, and the hole layout is shown in Figure 5.
In the pre-splitting blasting engineering design, the bench height H is 14 m, the ultra-deep is 1 m, and the drilling depth is 13 m. An inclined hole (62 degrees) was selected as the pre-splitting hole, and the hole depth of 15.1 m was obtained by the formula L = H + h/sin α. The central hole depth is 15 m. The buffer hole depth is 6 m. Based on the relevant empirical formula and the empirical data of similar projects, the linear charge density can be obtained, and the linear charge density is 0.87 kg/m. At the bottom of 1.1 m, the linear charge density is twice as high as the standard charge, namely 1.74 kg/m. The middle part of 12.2 m adopts the usual charge method, and the linear charge structure is 0.87 kg/m. The filling length is 1.7 m; then, the charge length is 13.4 m. The single hole loading quantity comprises the standard loading quantity, and the bottom strengthening loading quantity is 12.53 kg. According to the design line charge density, the charge roll was uniformly wrapped on the PVC plastic tube and connected to the detonating cord. The orifice blockage was filled with a drilling slag of 1.8 m. The length outside the orifice was reserved and greater than that of the detonating cable to connect the initiator.
The blast hole adopts continuous charge, and the modified ammonium oil is installed at the bottom of the blast hole. The initiation device connects the detonating tube in one blast hole, and the reverse initiation is placed on the next step. Then, the charge procedure is repeated again until the installation is completed. The charge structure diagram of each hole is shown in Figure 3. Based on the comprehensive consideration of safety and other aspects, the bench of the stope is a pure non-electric initiation system. The detonators with 400 ms delay non-electric detonators in the same section are selected in the hole. On the ground, the detonators with 25 ms delay non-electric detonators between blast holes and 65 ms delay non-electric detonators between rows are selected. The millisecond differential network is connected to the hole by hole to detonate the entire blasting network. The charge structure of each hole is shown in Figure 6.

4.2. Field Blasting Effect Analysis

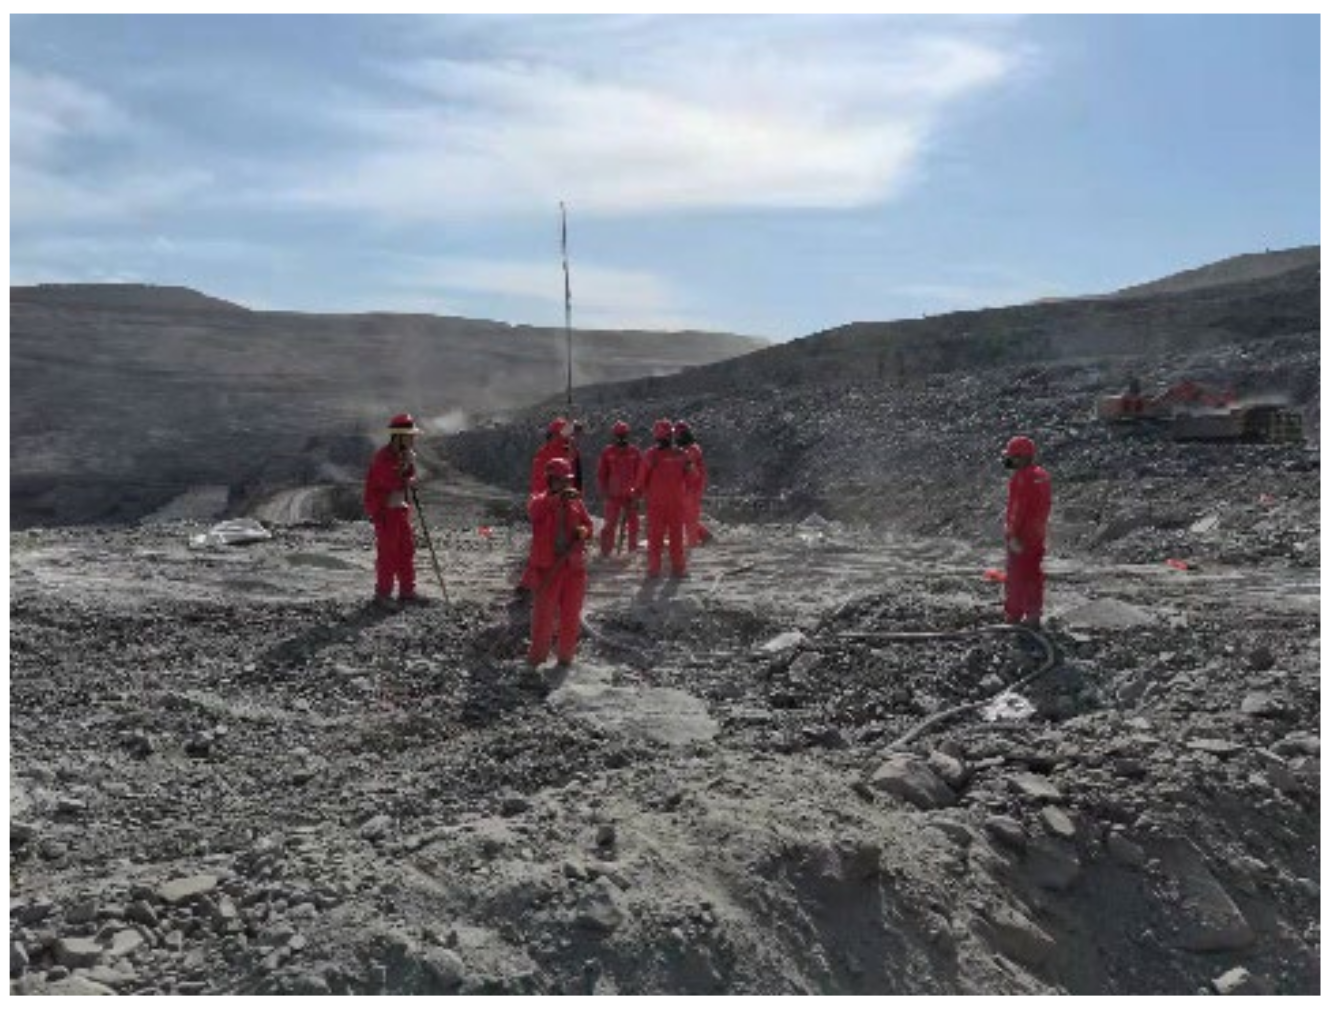
The field transportation blasting materials and layout construction are shown in Figure 7. The effect of pre-splitting blasting is shown in Figure 8. After the follow-up work, the pre-splitting surface is fully displayed. The slope is smooth, and the pre-splitting holes on the slope are obvious. The half-hole rate is guaranteed to be above 90%, and the over-excavation and under-excavation phenomena do not appear. The stability of the bench surface is good, and there is no excessive damage. The blasting effect is in line with the expected ideal effect. This can prove that the data of the simulation results are basically in line with the experimental results of the field work, and it is feasible. The optimal hole network relationship curve fitted by the software can provide some reference in the actual pre-splitting blasting work.

5. Numerical Simulation of Blasting Hole Network Parameters

5.1. Model Establishment

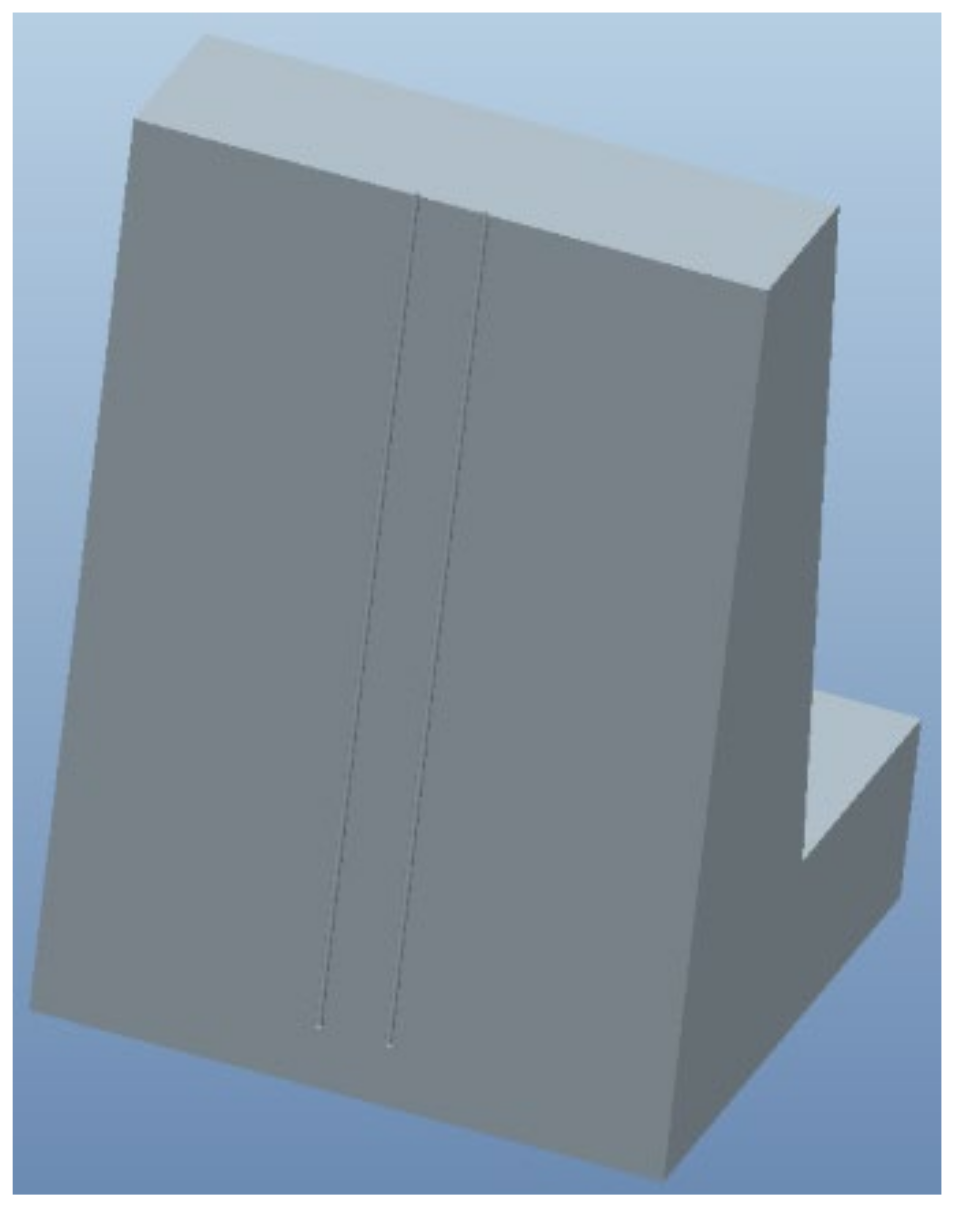
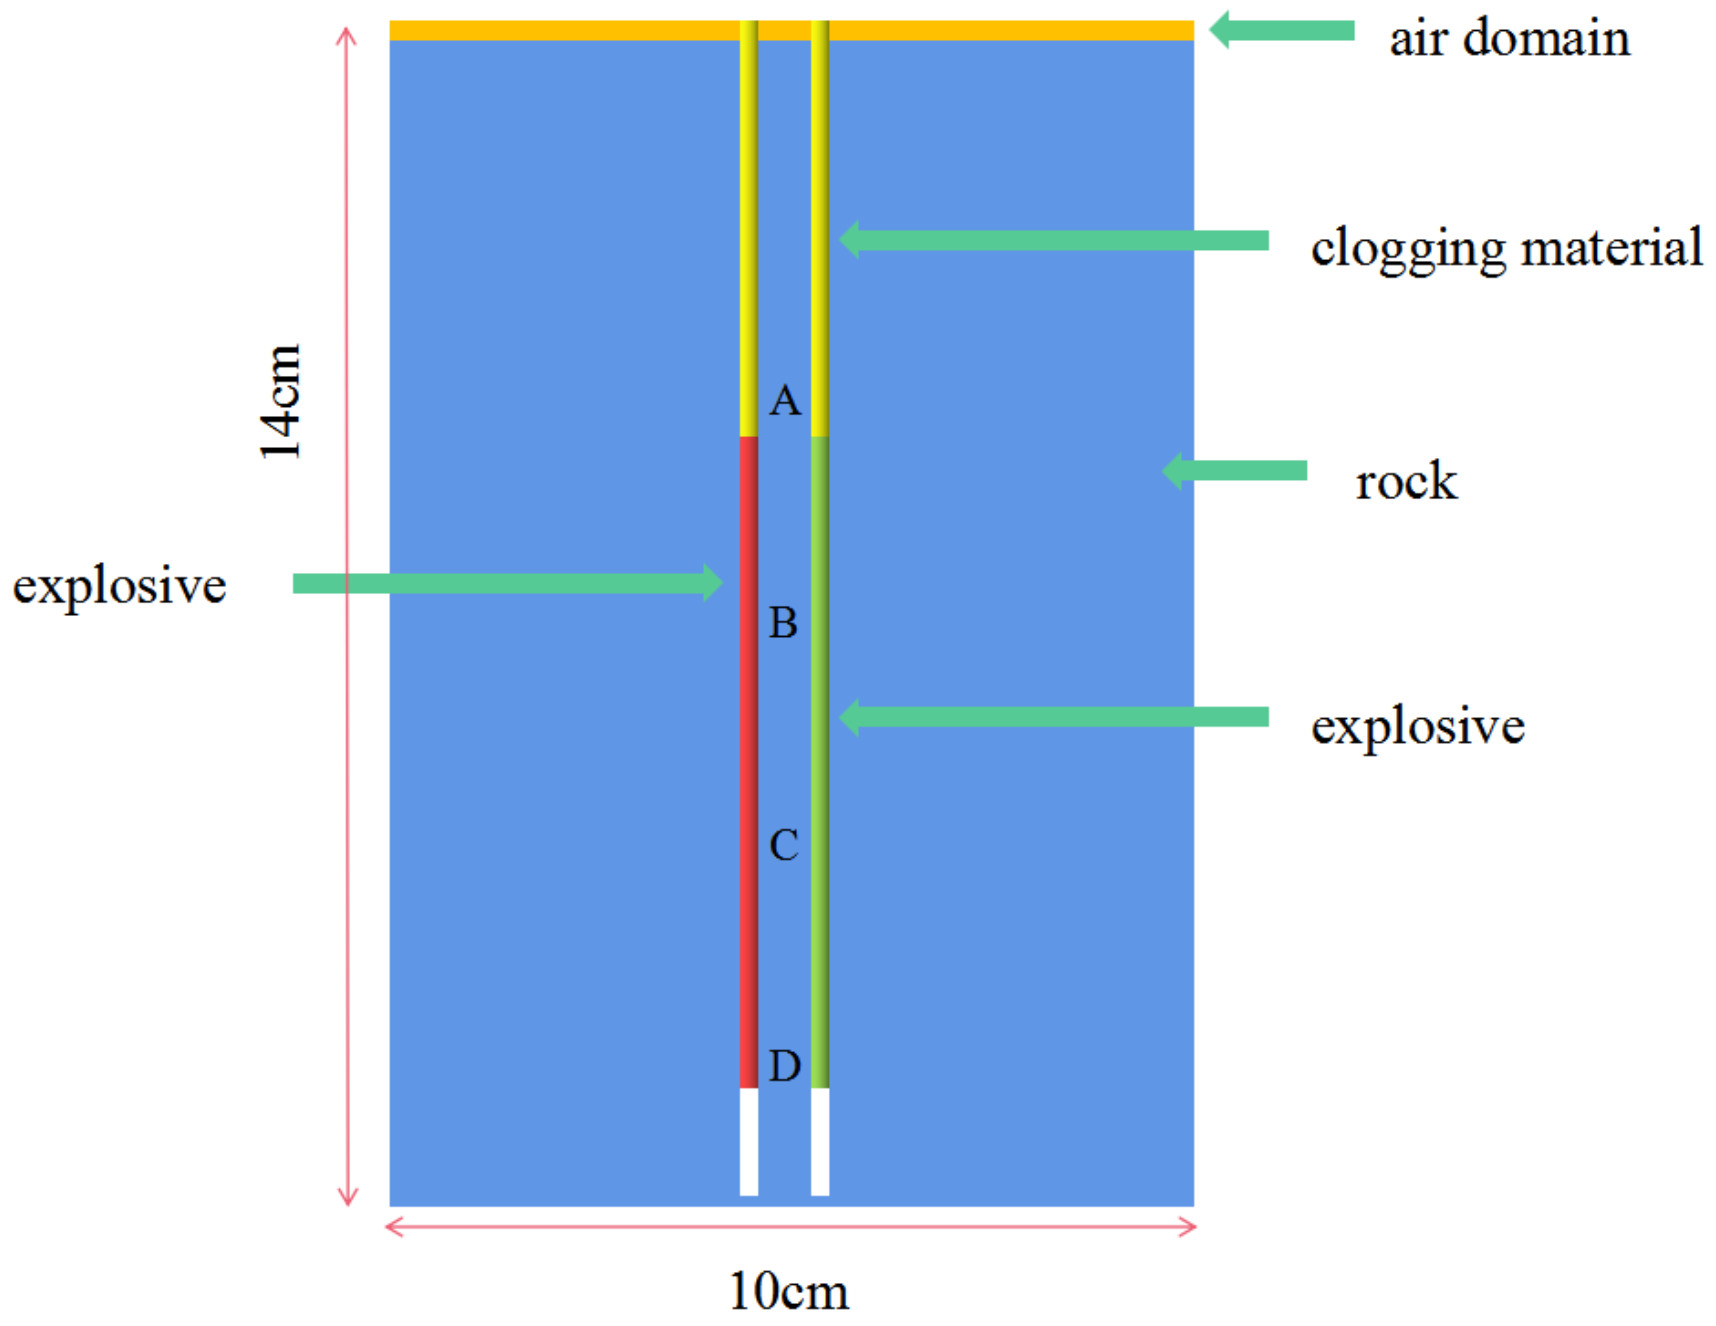
The model is established with the blasting area in the study area as the modeling object. In order to make the numerical simulation results close to the actual blasting, the slope model is established for the blasting area. The charging method is the continuous decoupling charge with the decoupling coefficient of 2.82. The starting point is set at the bottom of the charge. The height of the model is 14 m and the width is 10 m. The two blast holes of each group of models are set at the midpoint of the symmetric boundary surface at the top of the slope. The model is established as shown in Figure 9. The two boreholes of each model are set at the midpoint of the symmetric boundary surface at the top of the slope. In addition to the calculation of the symmetric boundary of the model, they are set as a non-reflective boundary. The keyword * BOUNDARY_NON_REFLECTION is used to define. The section of the borehole is set as the symmetric boundary, and * BOUNDARY_SPC_SET is used to define.
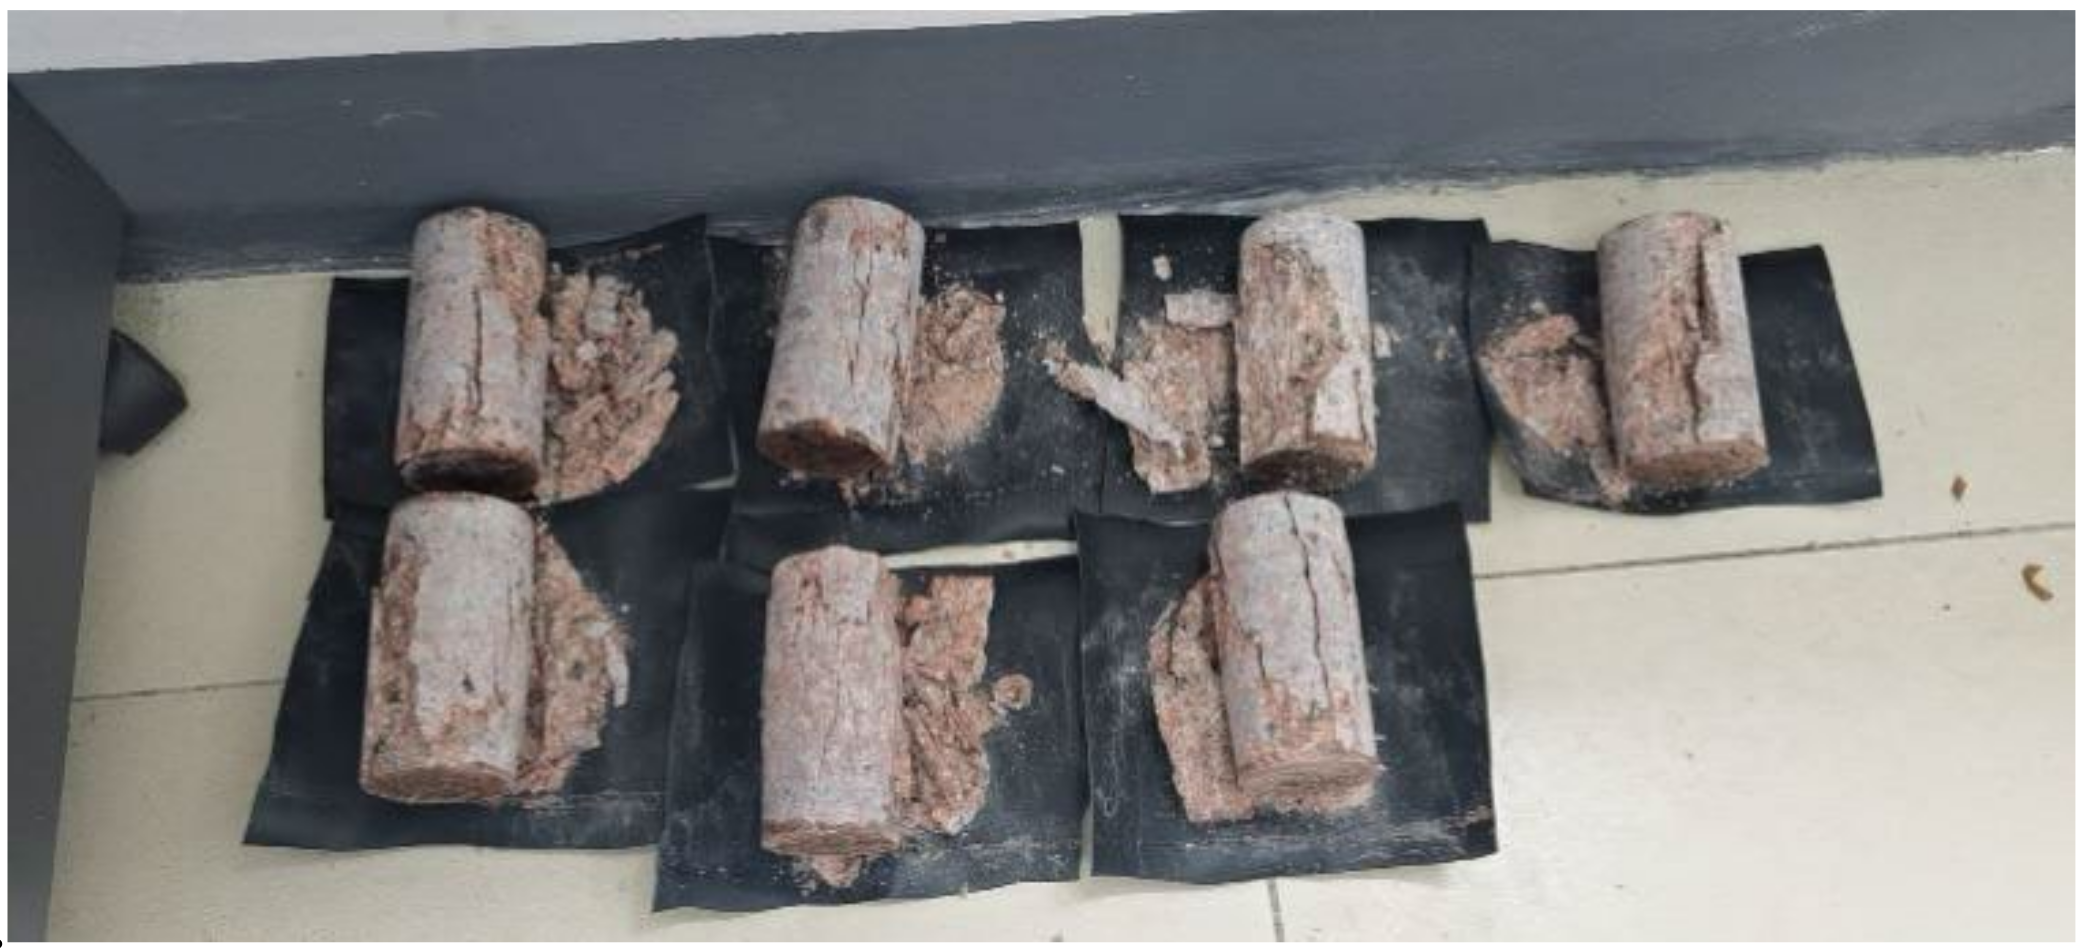
In this triaxial compression test, the rock in the mining area of Inner Mongolia was selected as the test material. The large rock was processed into seven cylindrical specimens by a cutting machine. The seven specimens were polished by a grinding machine, so that the end surface roughness error was not greater than 0.015 mm. The specimen after compression is shown in Figure 10, and the rock material coefficient is shown in Table 2.
In the simulation calculation, the plugging material should be selected as soil and foam because of the compaction during filling and the compression of blasting stress. The gap inside the material is large, but there will be a certain stiffness of the material after compression. At the same time, it is also to ensure the accuracy of the calculation results. The coefficient of plugging material and the coefficient of emulsion explosive material are shown in Table 3 and Table 4. In order to facilitate the observation of the unit failure of rock mass under blasting, four observation points are arranged between the two borehole walls, and each observation point is not coplanar. The plugging and observation point setting are shown in Figure 11.
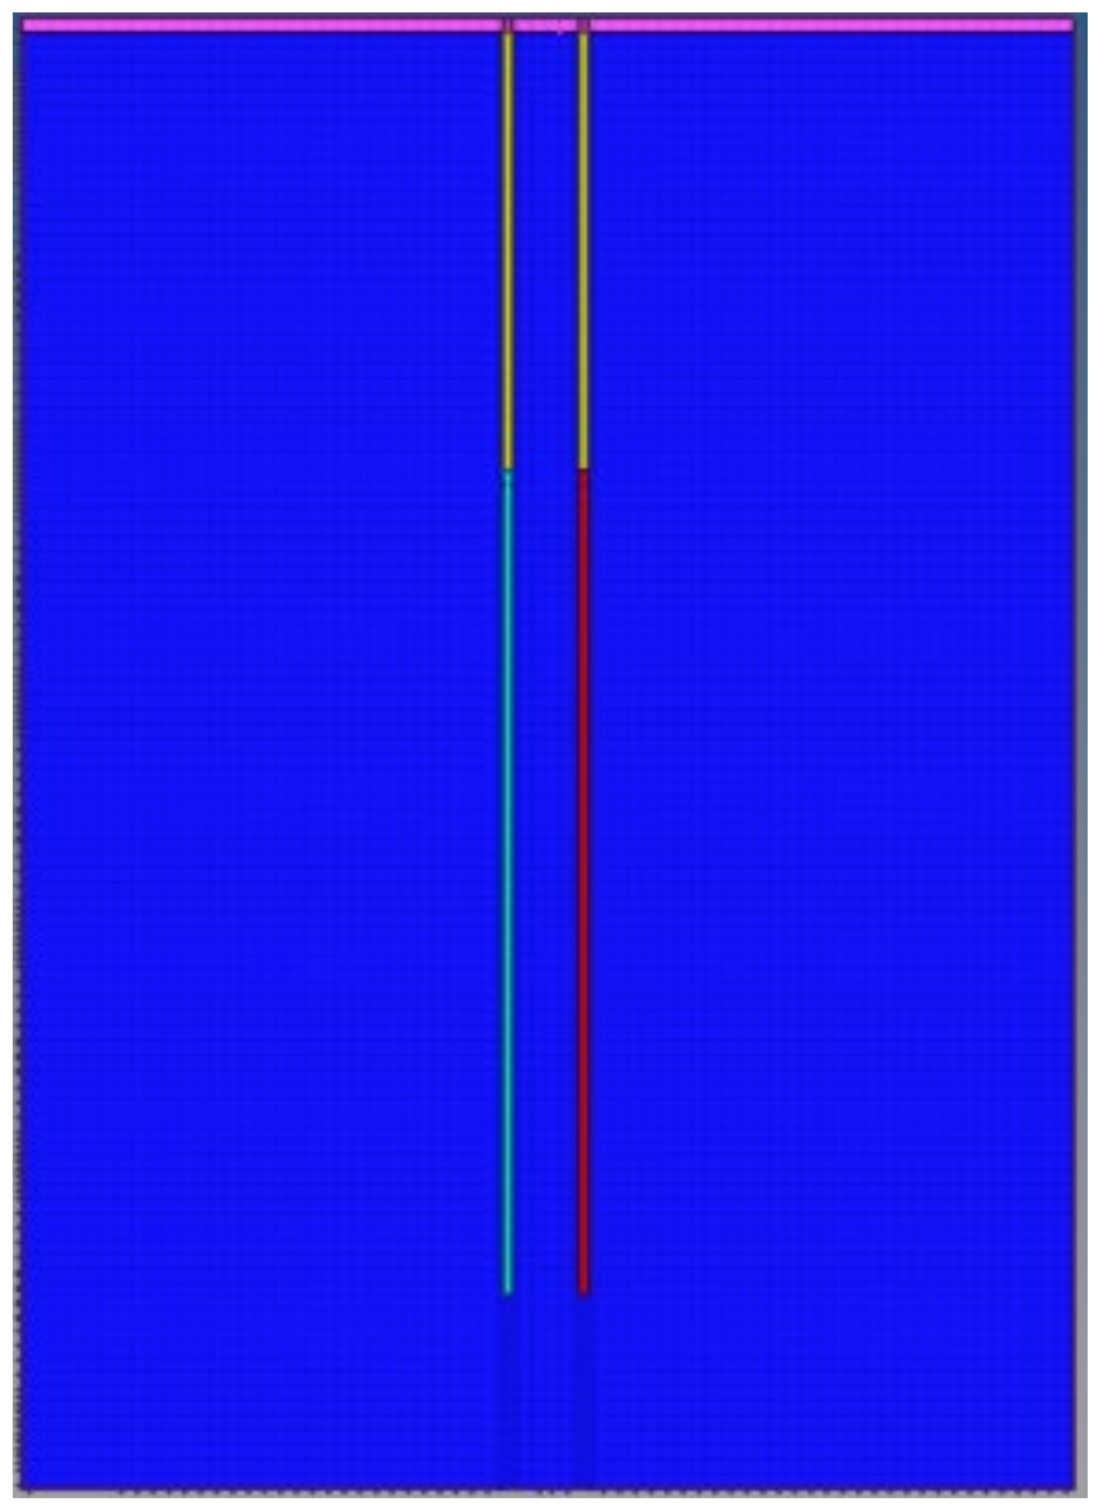
Reasonable hole network parameters can not only make the blasting effect more efficient but also effectively reduce the harmful effect generated during blasting operation. In the case of other blasting parameters unchanged, only change the size of the pre-splitting blasting hole diameter and hole distance; according to the actual geological conditions and production conditions of the mine, the overall model height is 1400 cm, width is 1000 cm, hole depth is 1100 cm, charge length is 800 cm, hole diameter is 90–130 mm, and the hole distance is 7–12 times the hole diameter, producing a total of 30 groups for the calculation model. After the modeling process is completed, the sat file is imported into Hypermesh 14.0 for meshing. Since the blast hole is in a symmetric position, and the slope model is also large, half of the model is removed when meshing, and then, the symmetric command is used to restore the mesh. The overall analysis model is shown in Figure 3 and Figure 5. After meshing, it is necessary to define the material for each regional element mesh: the blue area is the rock element mesh, the yellow area is the blockage element mesh, the purple is the air domain element mesh, and the sky blue and red are the explosive element mesh. When meshing, the explosive element mesh needs to be refined, and the 3D SOLID MAP command is used to make the mesh more regular, so as to facilitate the later calculation and observation of the propagation of explosion stress in the post-processing software. The mesh is shown in Figure 12. Rock selection * MAT_JOHNSON_HOLMQUIST_CONCRETE is defined. The material property is homogeneous rock material. The isotropic and kinematic hardening conditions are determined by modifying the first set of parameters, 0 or 1. The material parameters are shown in Table 2. In practical engineering, the properties of the plugging material are basically the same as those of rock. In the simulation calculation, the plugging material should be selected as soil and foam because of the compaction during filling and the compression of blasting stress. The void inside the material is large, but there will be a certain stiffness of the material after compression. In order to ensure the accuracy of the calculation results, the * MAT_004 (* MAT_SOIL_AND_FOAM_TITLE) keyword is used to define the plugging material, and the parameters are shown in Table 3. The simulation uses the keyword * MAT_003 (* MAT_HIGH_EXPLOSIVE_BURN) to define the emulsion explosive used in engineering, and the state equation of the explosive is defined as EOS_JWL. The parameters are shown in Table 4.

5.2. Numerical Simulation Results

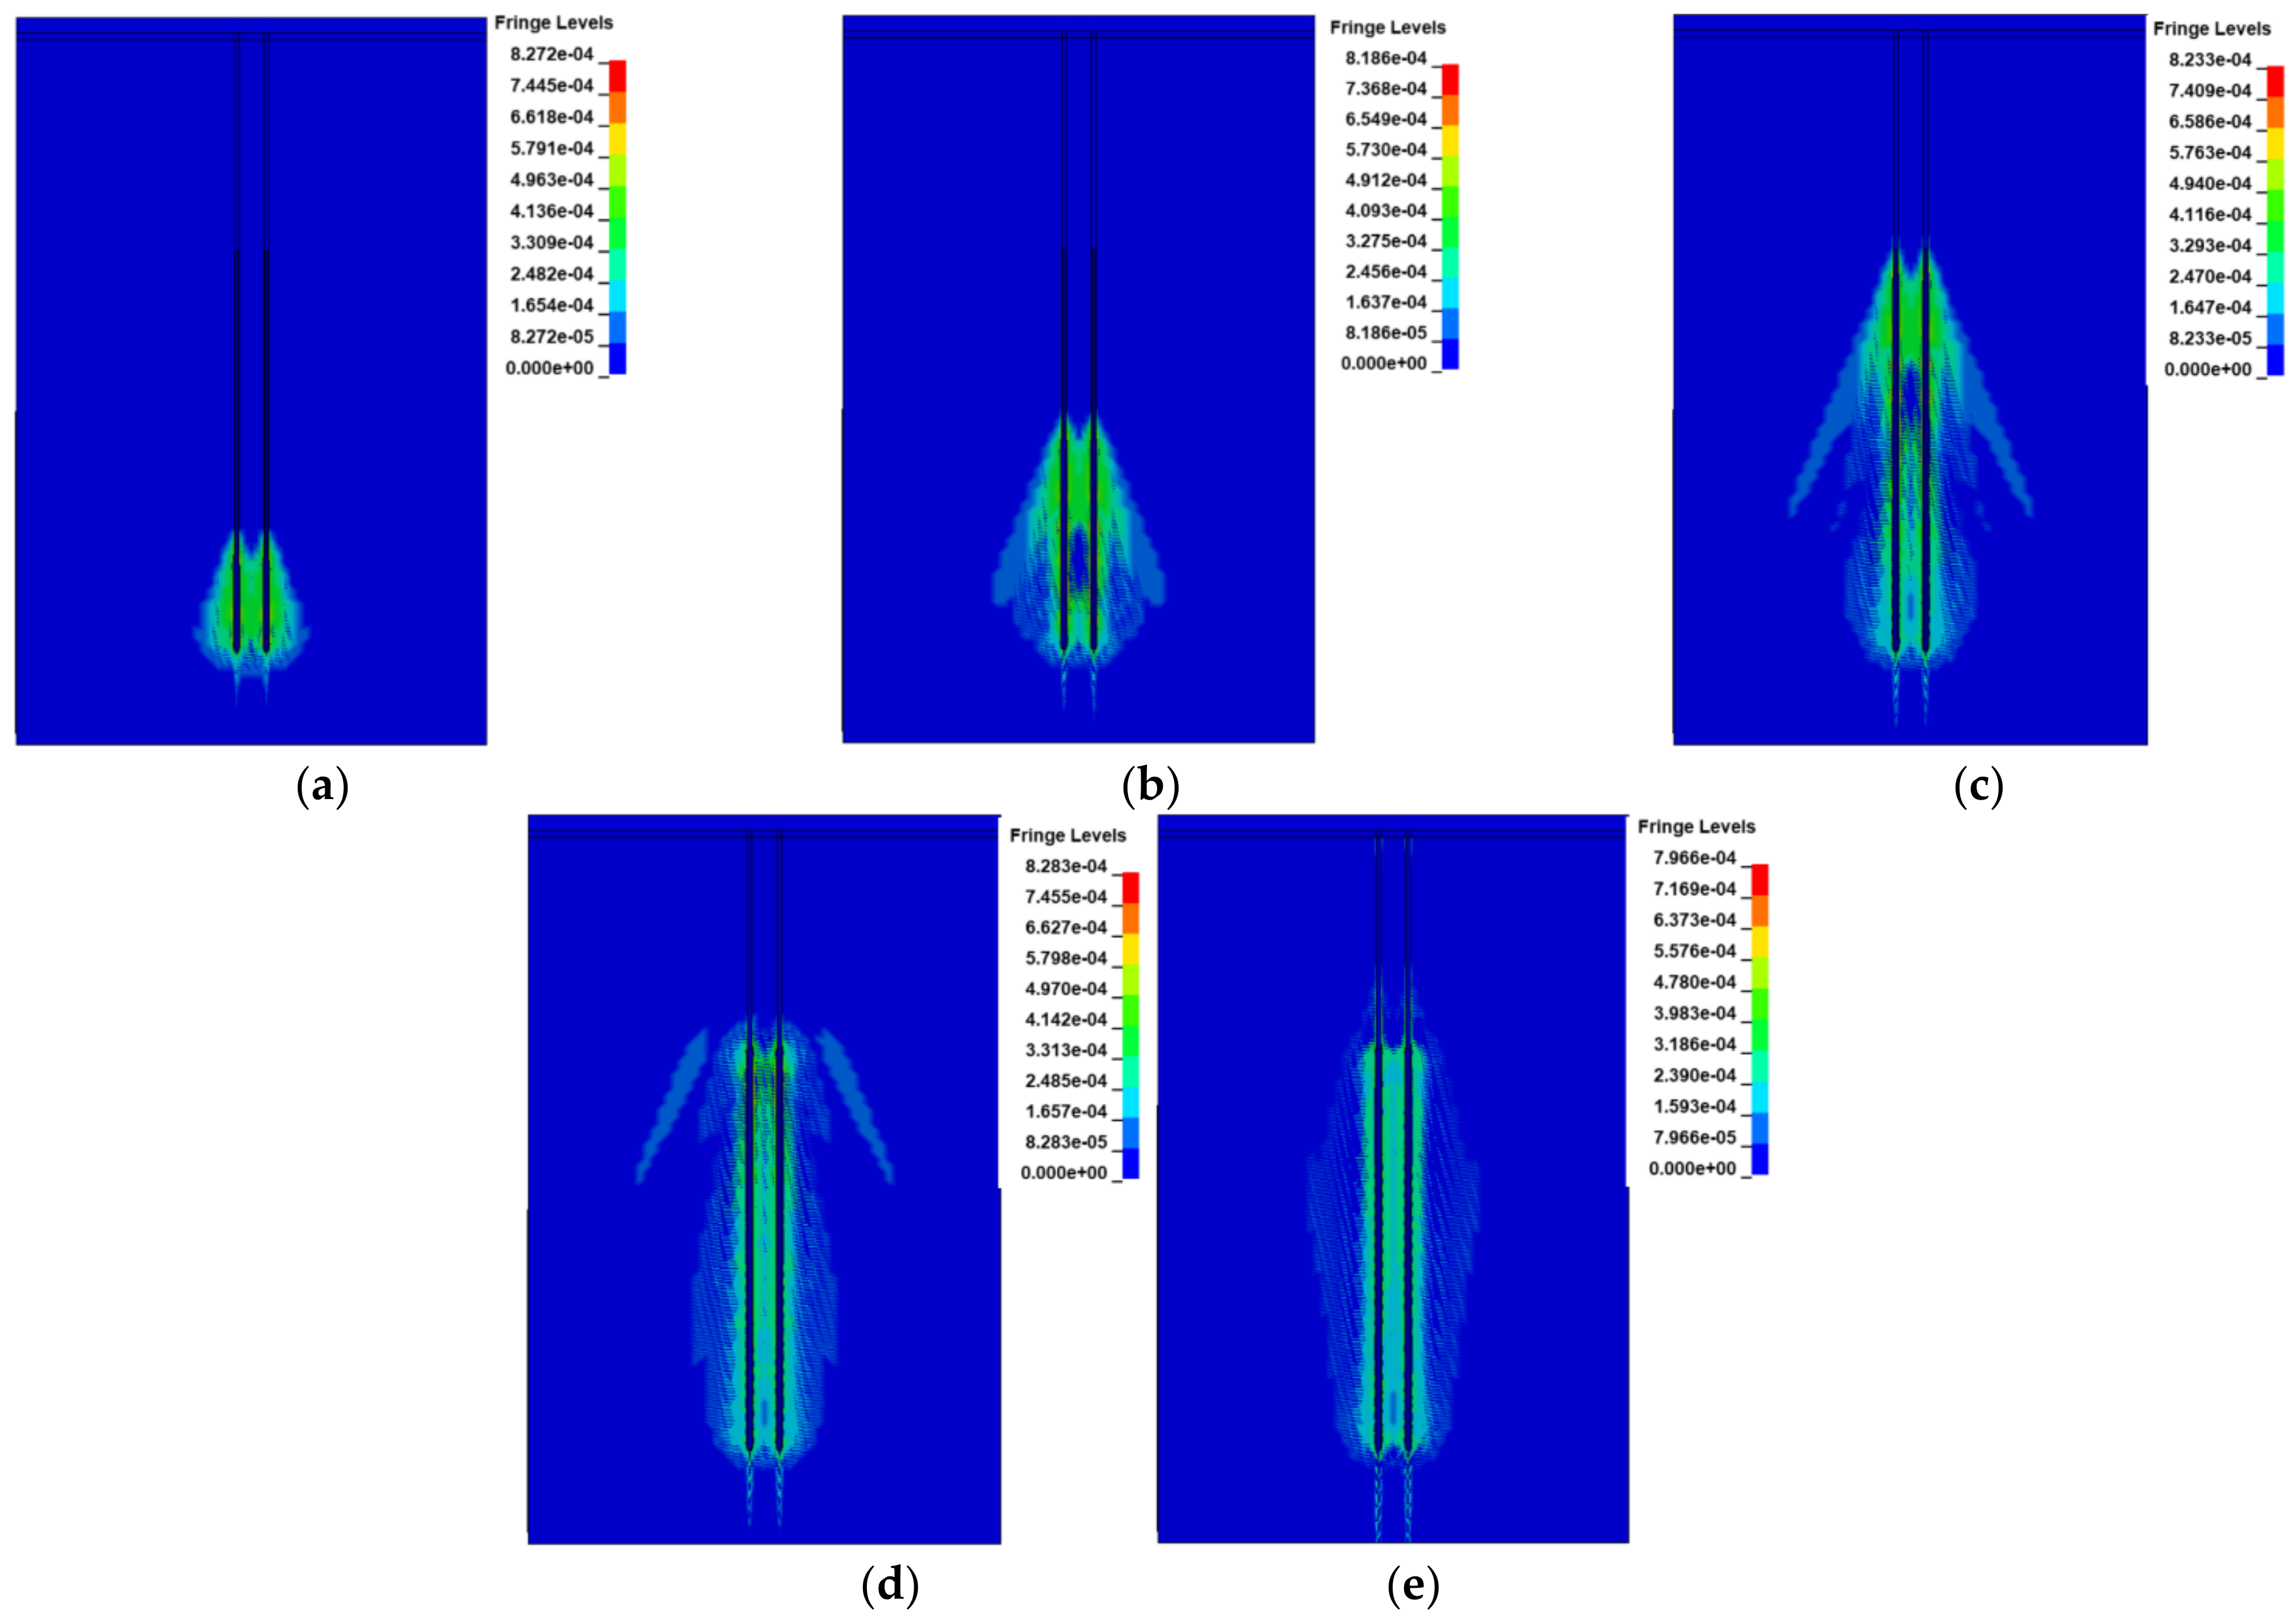
According to the simulation results of all multiple combinations of different apertures and hole spacing, the stress wave propagation law is roughly similar. This paper takes different apertures and seven times hole spacing as an example to analyze. From Figure 13a–e, it can be seen that the explosive stress wave generated by the explosion spreads outward in the form of a cylindrical wave from the starting point, and the blast wave is formed due to the impact of high-temperature and high-pressure gas produced by the explosion. The shock wave propagates upward rapidly in an ‘arrow’ shape. In the process of propagation, the energy density per unit area decreases rapidly due to the continuous expansion of the wave front along with the energy dissipation caused by rock failure, so the shock wave in the rock mass will gradually evolve into a compression wave and seismic wave with the increase in propagation distance. For Figure 13a, after the explosion, the stress wave propagates to the midpoint of the connection between the two blastholes, and the stress wave generated by the two blastholes meets and overlaps for the first time. The pressure generated by the explosion in the two blastholes is much larger than the dynamic compressive strength of the rock mass, and each of them forms a cavity under strong compression. The surrounding rock mass initially forms a plastic flow area, and the rock mass cracks at the superposition of the stress wave under the superposition of the stress wave. For Figure 13b, the stress wave generated by the superposition of Figure 13a continues to propagate upward and forms the ‘arrow’ prototype. The influence range of the stress wave in the rock mass is also increased, and the blasting energy is gradually attenuated. The plastic flow area prototype is formed around the two borehole cavities, and the stress wave continues to propagate upward. For Figure 13c, the stress wave has formed a complete ‘arrow’ and spread to the bottom of the plugging material, and the plastic flow area is completely formed around the two holes. Due to the large energy consumption in the stress wave propagation stage, the wave rapidly decays to a compression wave at the beginning of the next stage and continues to propagate around the bottom of the plugging material. For Figure 13d, at the interface of plastic flow zone, the explosion energy attenuates with the expansion of the propagation influence range, but it cannot be supplemented by the explosion energy; that is, the explosion energy is a continuous attenuation process. At this time, the radial compressive stress of rock mass is less than the dynamic compressive strength of rock mass, and the rock mass does not produce compressive failure. Due to the effect of radial compressive stress, the rock mass generates tangential tensile stress. The dynamic tensile strength of rock mass is generally less than its dynamic compressive strength, and the rock mass will produce several radial tensile cracks. For Figure 13e, with the energy attenuation of the explosive gas, the radial crack propagation velocity decreases gradually until the propagation stops; due to the release of part of the elastic energy at this stage, the stress of the rock mass decreases rapidly, and the unloading wave propagating to the explosive source is generated inside the rock mass, forming the corresponding radial tensile stress, and then forming the annular crack. At this time, the stress wave array has been attenuated to be relatively flat, and the seismic wave is formed and continues to propagate to the blocked interior.
The comparison Figure 13a–e shows that when the aperture of 110 mm is 0.5 ms after explosion, the influence range of stress wave is the largest. The stress wave of two boreholes meets superposition earlier than that of other boreholes, and the rock mass first cracks in the superposition area of the stress wave. In the whole propagation process, compared with other borehole apertures, a 120 mm delay evolved into seismic waves, and its energy attenuation rate is slower than other borehole apertures. The fastest energy attenuation rate is 130 mm borehole aperture.
The stress state of rock mass under blasting load is very complex. In order to study whether the cracks formed between the two boreholes are penetrating or not and whether the rock mass is damaged, the Y-axis stress of the rock mass unit connected with the borehole is taken as the basis for consideration. The maximum tensile strength of the rock used in the model is 3.5 MPa. If the maximum stress of the Y-axis direction of the rock mass unit is greater than the maximum tensile strength of the rock, it is considered that the cracks formed between the two boreholes are penetrating. The Y-direction stress–time history of four observation points A, B, C and D in each working condition is shown in Figure 14.
Taking the 90 mm aperture as an example, the observation point curve is shown in Figure 14a. When 0 us, the two holes begin to detonate, and the stress wave generated by the explosion extends outward. The stress wave propagates to the observation point D, C, B and A at 136.85 us, 846.15 us, 1898.34 us and 2395.08 us, respectively, and it causes the stress change. Then, the stress wave and the pressure generated by the explosion gas work together. At 326.41 us, 1371.58 us, 2129.37 us, and 2962.18 us, respectively, the Y-direction stress peak is reached. When the stress wave propagates to the bottom of the blockage, part of the wave will produce reflection phenomenon and propagate back in the form of an unloading wave. After C, B and A observation points in turn, the Y-direction stress secondary peak appears at C and B points. The peak fluctuation of A point is small because the energy of the unloading wave will be accompanied by secondary attenuation in the process of propagation, and the energy has been attenuated to about 1/3 when propagating to the A point. It can be seen from Figure 14a–e that with the attenuation of stress wave propagation energy, the Y-direction stress of observation points B, C and D is basically stable between 2.3 and 3.5 MPa, and the Y-direction stress of observation point A is basically stable between −1.3 and 1.2 MPa.
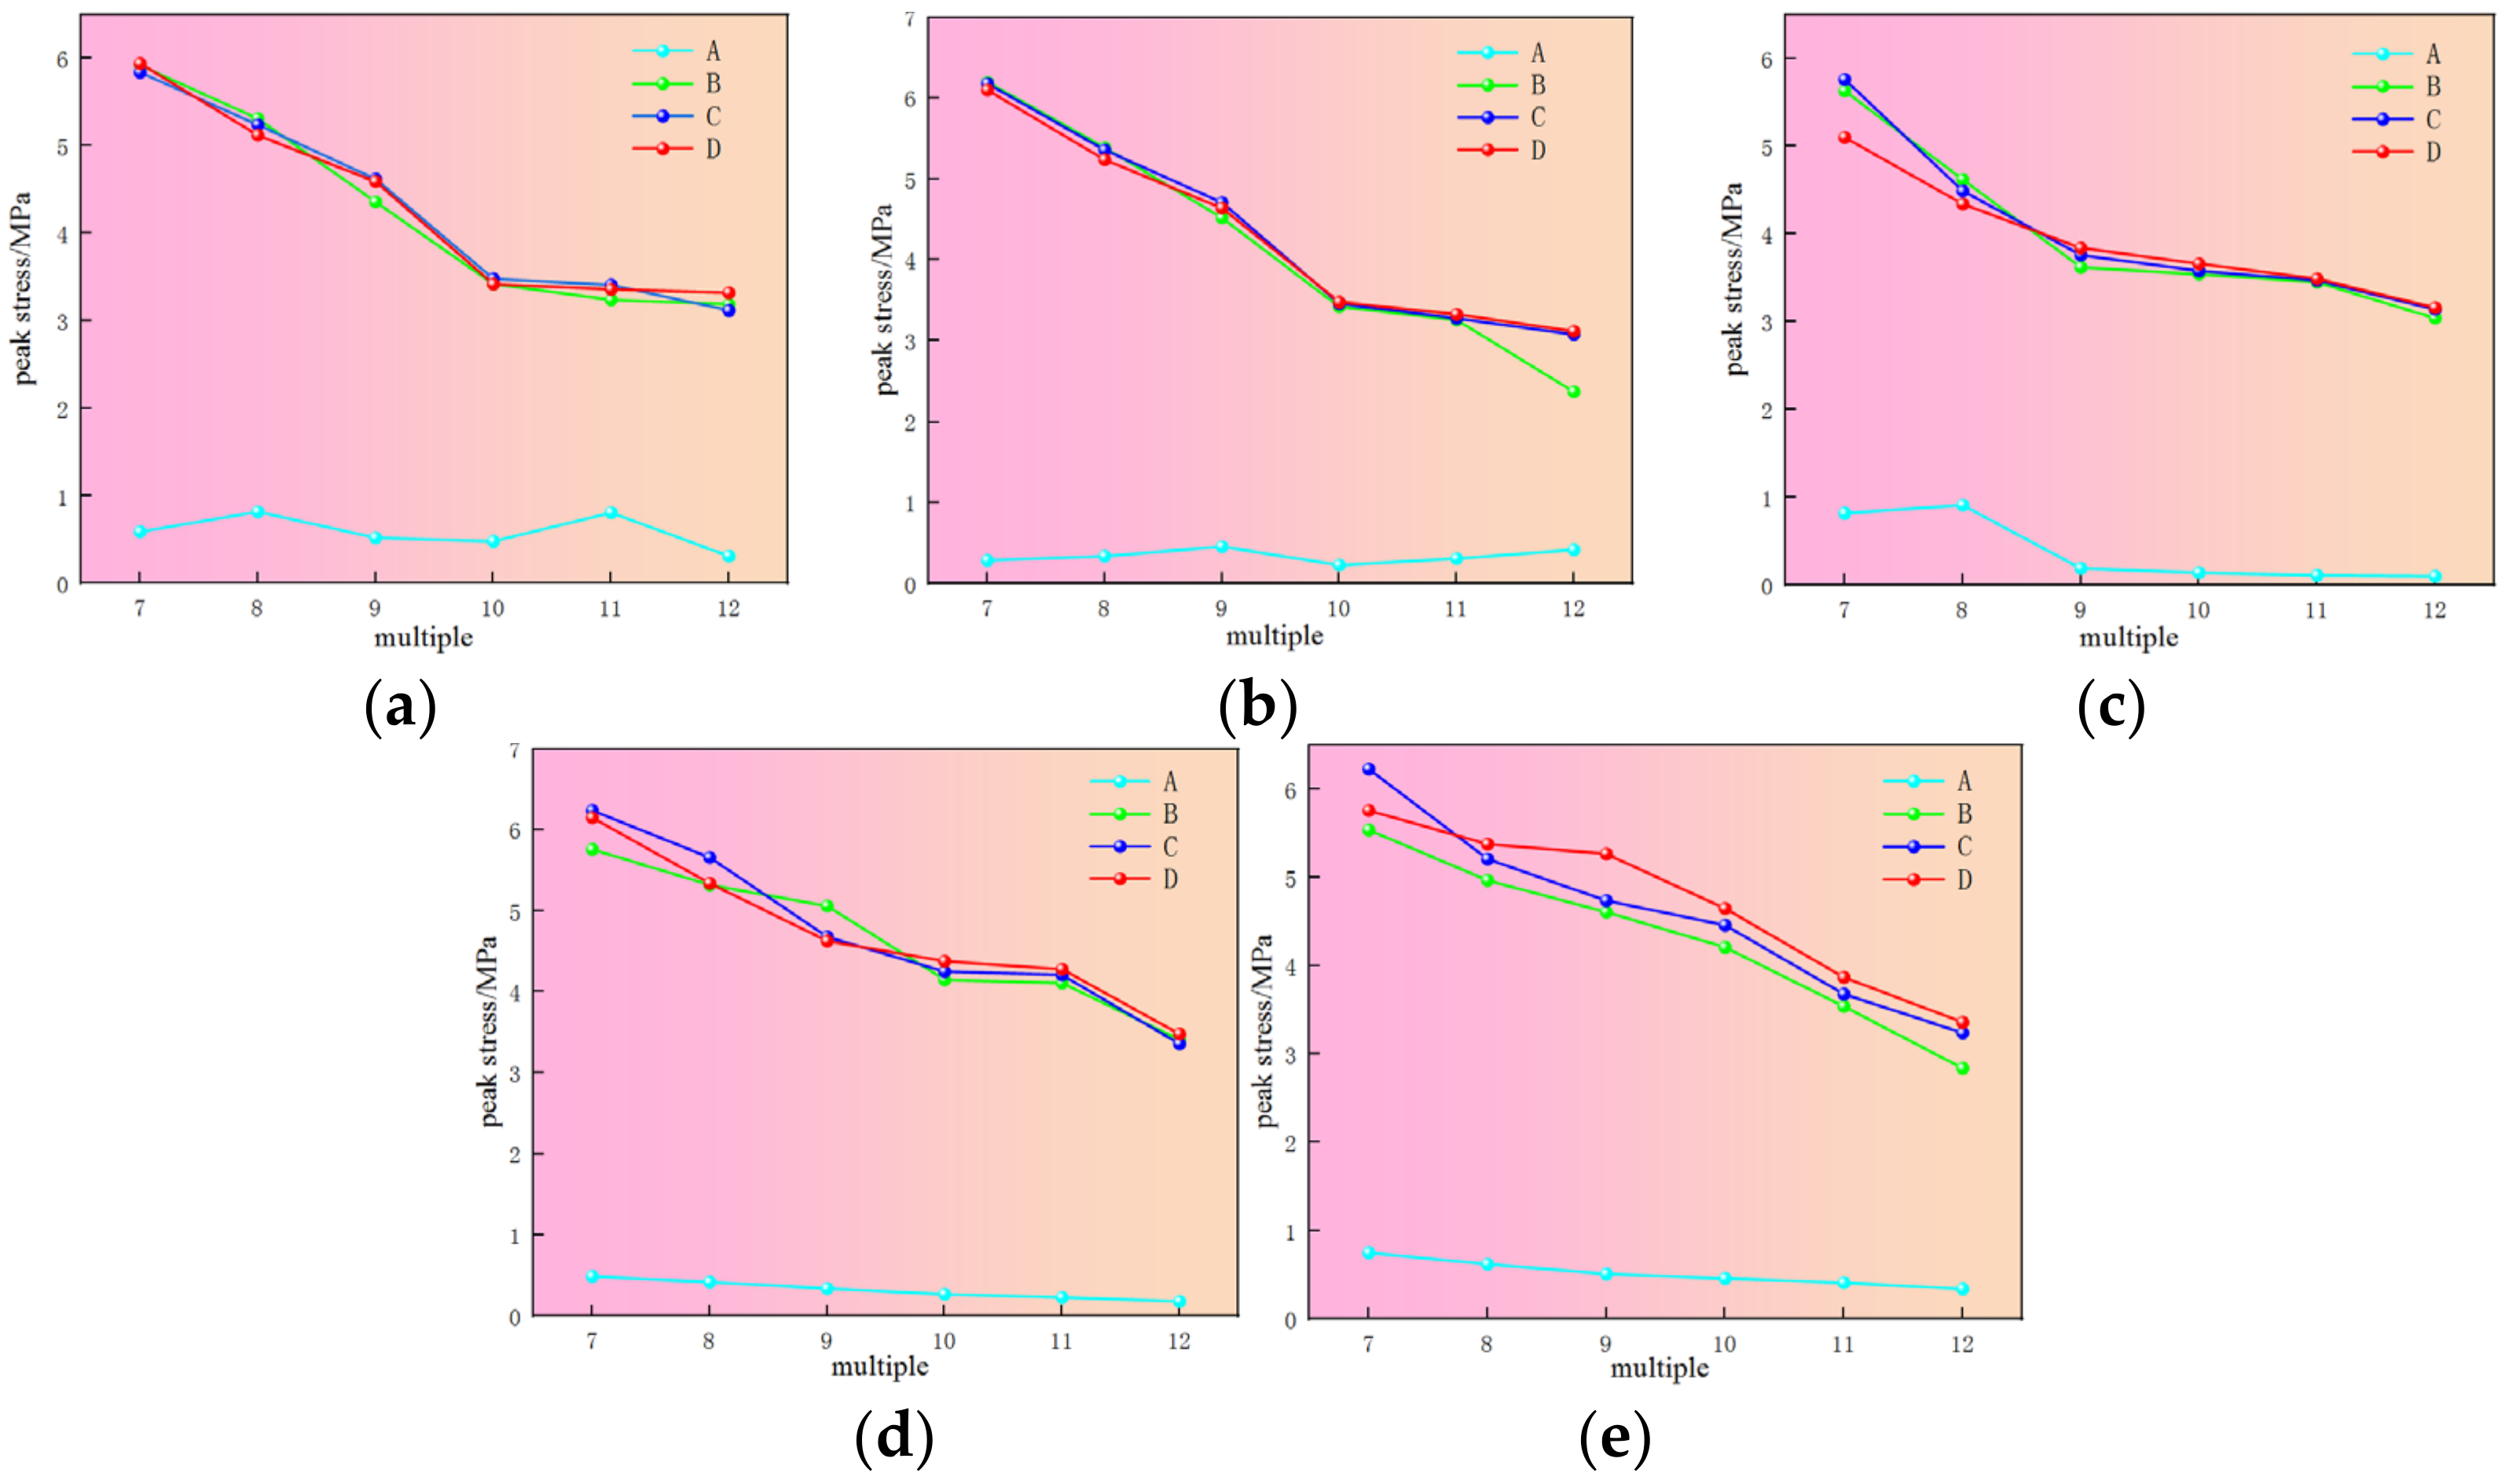
It can be seen from Figure 15a–e that with the increase in the spacing of blast holes, the peak stress in the Y direction of each measuring point also decreases, and the minimum stress appears near the observation point A. When the stress is greater than 3.5 MPa of the maximum tensile strength of the rock, the rock cracks and begins to damage. The peak stress in the Y direction of the observation point A in each working condition is less than 3.5 MPa and generally shows a downward trend, and the rock mass near it fails to crack. The B, C and D observation points of 90–130 mm aperture under different working conditions occurred rock cracking at 7–9 times, 7–9 times, 7–10 times, 7–11 times and 7–11 times hole spacing, respectively. The cracks of the two boreholes were interconnected. In addition to the above working conditions, only the stress wave was transmitted to the corresponding area in other working conditions, but the peak stress in the Y direction was less than the dynamic tensile strength of the rock, and these conditions were only likely to crack at the superposition position of the stress wave, and the cracks of the two boreholes were not penetrated. It is possible that the stress wave propagates more energy dissipation and the stress superposition effect is weakened under the condition of large hole spacing.
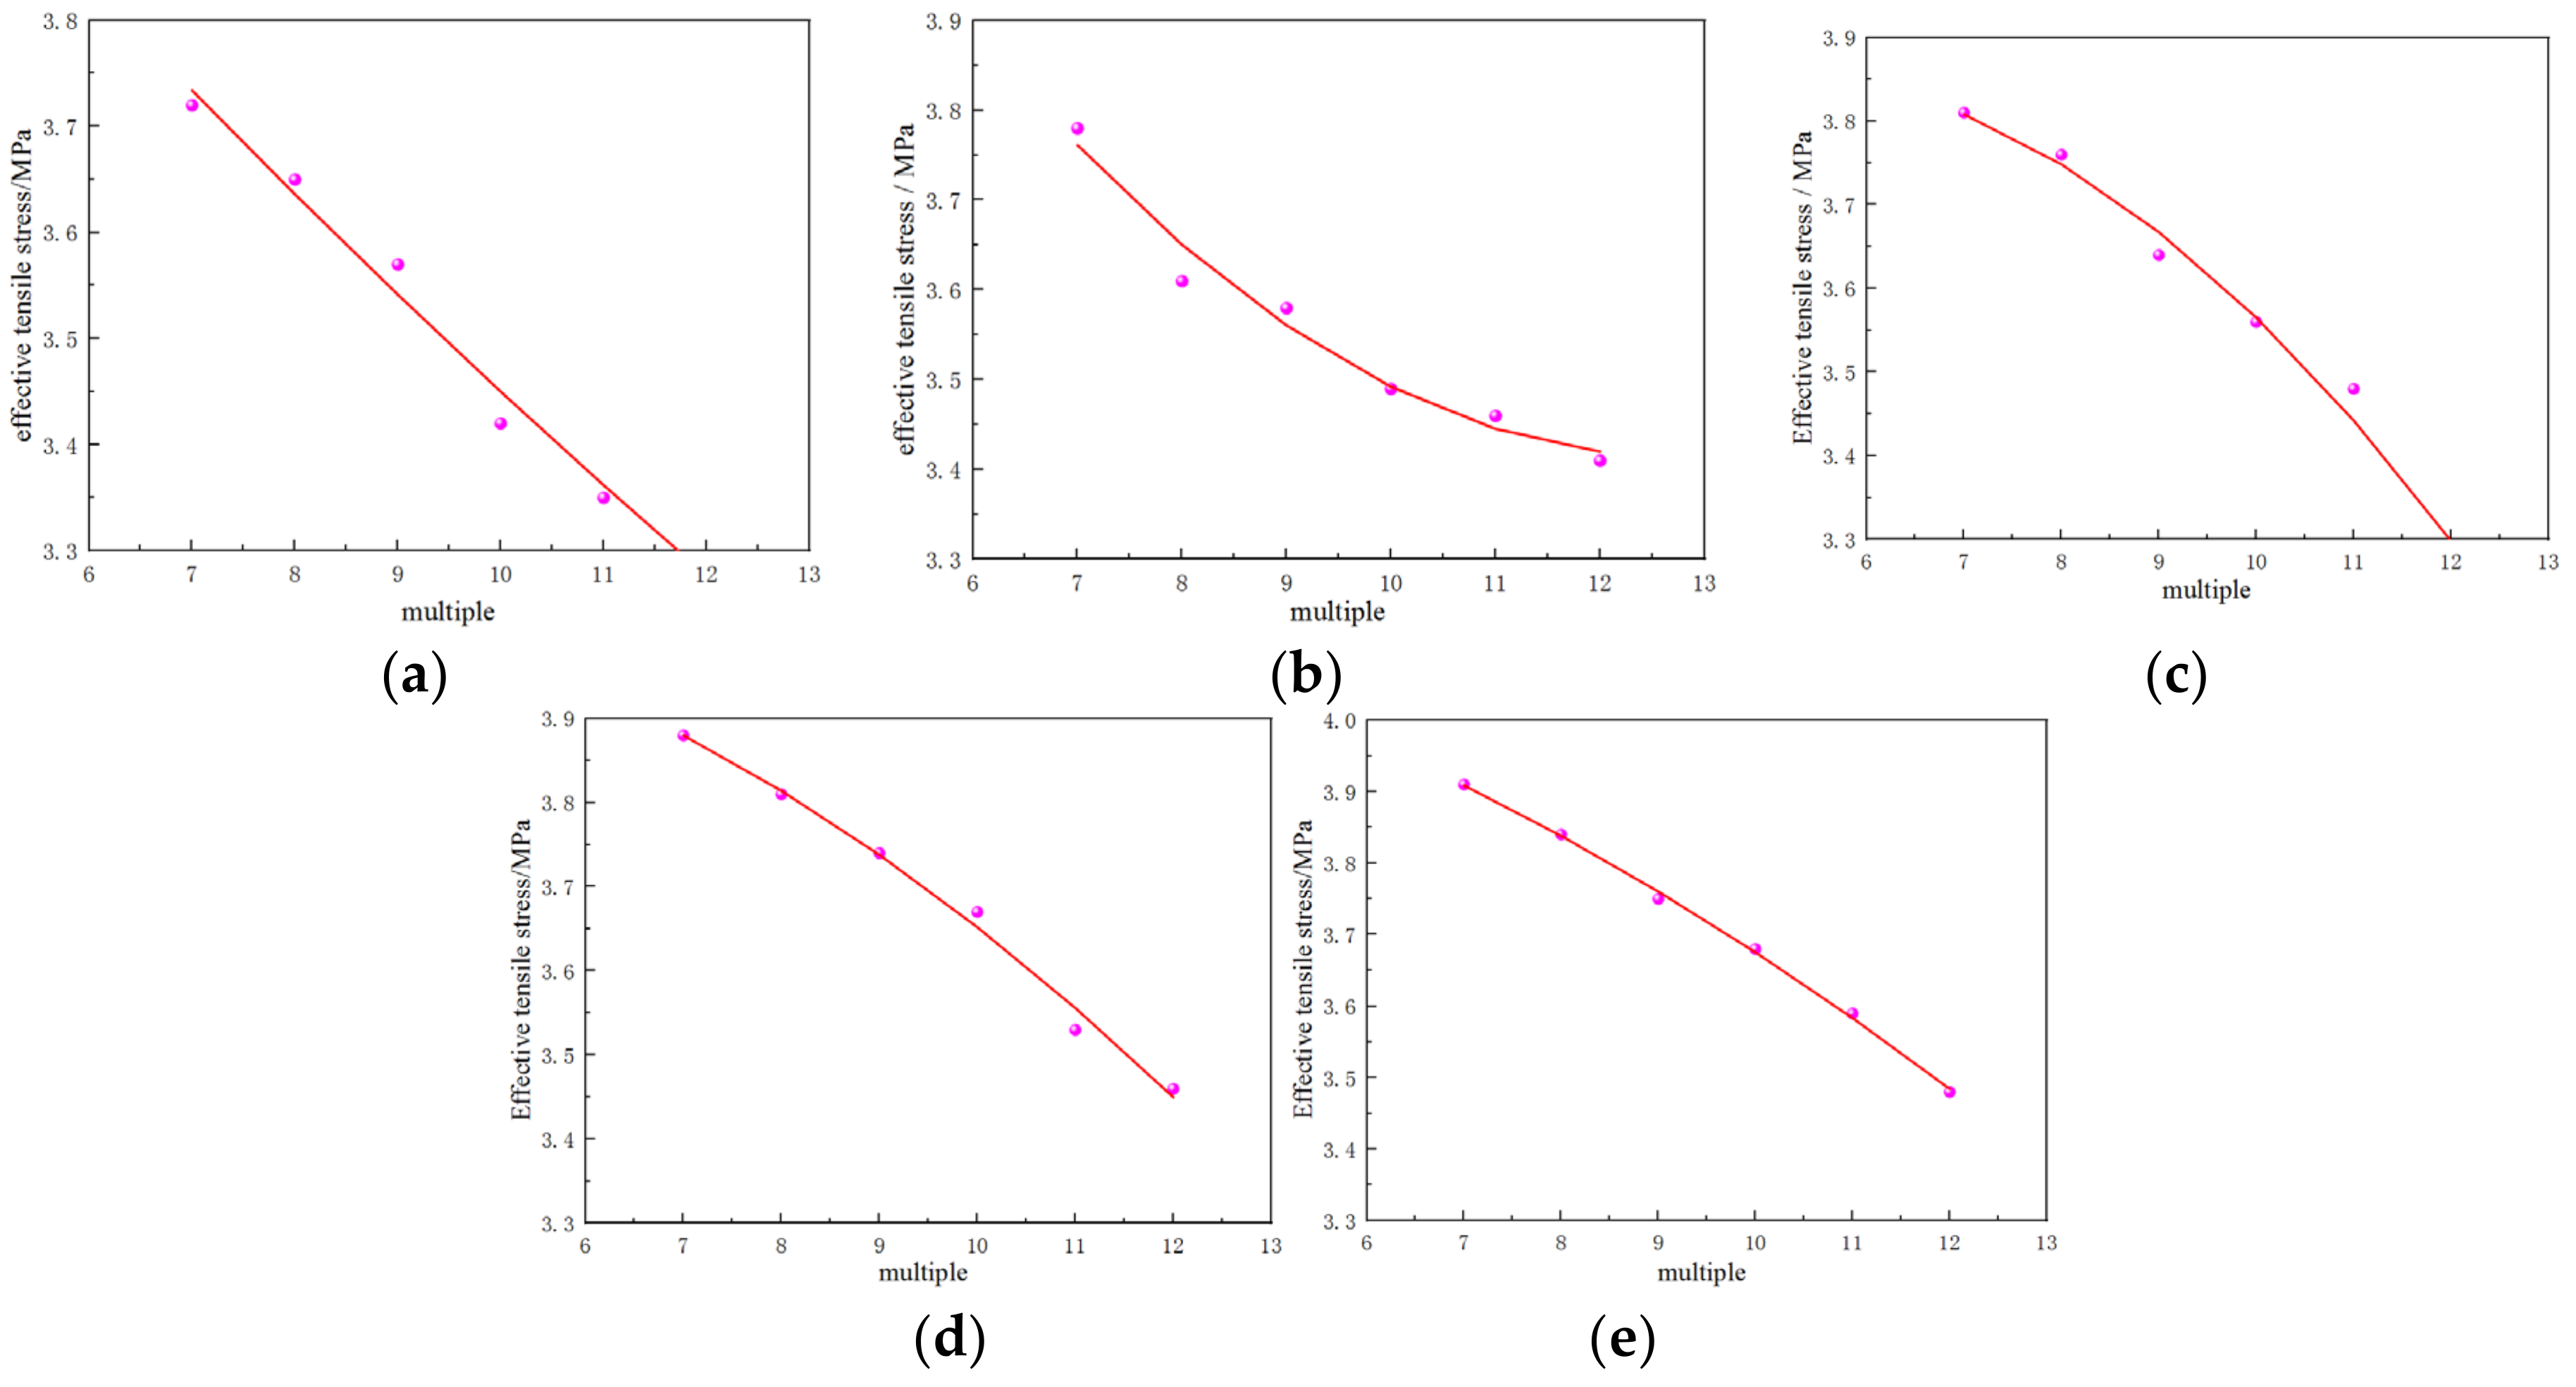
After determining the propagation law of stress wave and rock failure under different working conditions, in order to further illustrate the stress change between two cylindrical blast holes and optimize the parameters of a pre-splitting blasting hole network reasonably, the effective stress peaks of each observation point of the above 30 groups of models are extracted and fitted. The fitting results are shown in Figure 16a–e. It can be seen from the following figure that the effective tensile stress decreases with the increase in the hole spacing, indicating that after the explosion begins to act on the rock mass, under the same other conditions, the hole spacing is inversely proportional to the effective stress, and the form of the wave gradually decays from the shock wave to the compression wave and finally becomes a seismic wave. For a small aperture (90–100 mm), with the increase in the hole spacing, the attenuation rate of the effective tensile stress decreases gradually, indicating that the explosive gas and the stress wave consume a lot of energy in the formation of the plastic flow zone of the two holes, and the effective tensile stress shows a continuous attenuation trend due to no energy supplement in the later stage. For large apertures (110–130 mm), the attenuation rate of effective tensile stress gradually increases with the increase in aperture spacing. It is considered that it may be caused by the larger loading amount of the large aperture than that of the small aperture. With the increase in loading amount, the corresponding stress wave energy and the generated explosive gas also increase.
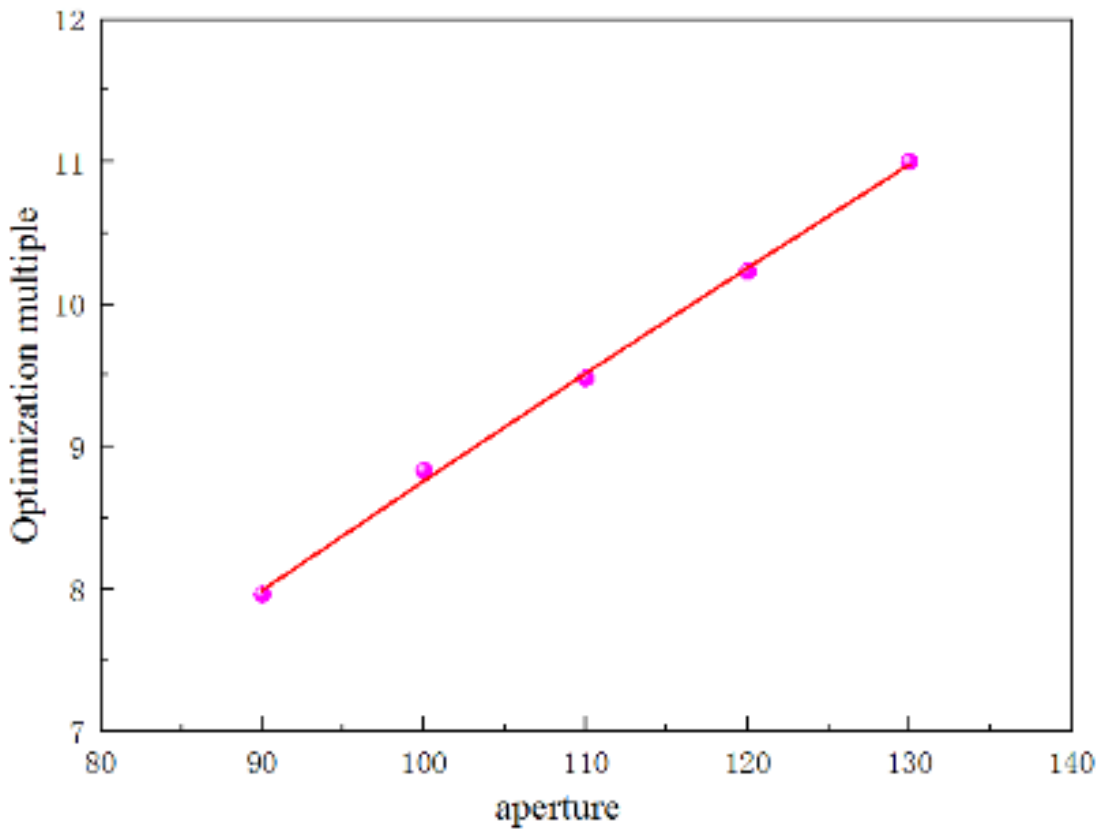
The obtained fitting data were screened to obtain the corresponding optimal pore spacing multiple relationship under each hole diameter; that is, the effective tensile stress of rock just reaches the ultimate dynamic tensile strength of rock, and the optimal hole diameter and pore spacing combination of rock mass will not be excessively damaged. The optimal fitting curve is shown in Figure 17. Figure 17 shows that the hole spacing is proportional to the hole diameter, and it increases with the increase in the hole diameter. The fitting coefficient is greater than 0.93, and the following expression is obtained:
y = 1.12 + 0.076x
Formula: y—Optimal hole diameter and distance between holes. x—hole diameter.
At present, the formula is suitable for rock Pu‘s hardness f = 8–14; the explosive detonation velocity is about 3500 m/s, and the use of uncoupled charge reverses the initiation of open-pit pre-splitting blasting engineering. The formula can calculate and analyze the optimal hole spacing corresponding to different apertures in order to ensure the half hole rate and flatness after blasting and prevent excessive damage to rock mass, providing certain reference values for future pre-splitting blasting engineering.

6. Conclusions

With the energy attenuation of explosive gas, the corresponding radial tensile stress is formed in the rock mass, and then, the annular cracks are formed. When the aperture of 110 mm is 0.5 ms after explosion, the influence range of the stress wave is the largest, and the rock mass first cracks in the stress wave superposition area. The 120 mm borehole aperture is delayed to evolve into a seismic wave, and the 130 mm borehole aperture has the fastest energy attenuation rate. With the attenuation of stress wave propagation energy, the Y-direction stress of observation points B, C and D is basically stable between 2.3 and 3.5 MPa, and the Y-direction stress of observation point A is basically stable between −1.3 and 1.2 MPa. For smaller apertures, with the increase in aperture spacing, the attenuation rate of effective tensile stress gradually decreases, and the effective tensile stress shows a continuous attenuation trend, while the attenuation rate of effective tensile stress for larger apertures is the opposite. Through the fitting of effective data, the optimized relational expression of pre-splitting blasting hole network parameters was obtained: y = 1.12 + 0.076x. In the future, the application of advanced test technology and computer technology in the field of pre-splitting blasting should be strengthened, and the advanced computer aided design expert system should be developed. The updating and development of drilling machinery should be accelerated. The development of advanced hole inclination measurement tools is the development trend of drilling machinery.

Author Contributions

Z.W. and G.W. conceived the idea and designed the framework; L.Z. set up the numerical model; Z.W. analyzed the simulation data; and Z.W. and G.W. writing—review and editing the paper. All authors have read and agreed to the published version of the manuscript.

Funding

The Regional Science Foundation of National Natural Science Foundation of China (52164005,52064005) and Guizhou Province Science and technology planning project (Guizhou Combined support [2021] General 399, Guizhou Science and Technology Foundation [2020]1Y214), Study and Practice of learning quality evaluation system for new engineering talents—taking mining engineering as an example, Project No.: E-KYDZCH20201822.

Institutional Review Board Statement

Not applicable.

Informed Consent Statement

Informed consent was obtained from all subjects involved in the study.

Conflicts of Interest

The authors declare no conflict of interest.

Abbreviations

Symbol List
σ r max Peak stress, MPa
p 1 Radial peak stress of rock element, MPa
r ¯ α Distance between rock element and explosion source, m
α Attenuation coefficient of stress wave
ρ a Density of explosives, g/cm3
DaExplosive detonation velocity, cm/us
ra, rbCharge radius and hole radius, mm
mPressure increase coefficient, generally m = 8~11
WCoefficient of relationship between tangential tensile stress and peak radial compressive stress
uPoisson ratio
σ θ max Tangential tensile stress, MPa
P0Initial stress, MPa
KAdiabatic isentropic index of explosives
yOptimal hole diameter and distance between holes
xHole diameter, mm

References

  1. Wu, T.; Zhou, C.; Jiang, N.; Xia, Y.; Zhang, Y. Stability analysis for high-steep slope subjected to repeated blasting vibration. Arab. J. Geosci. 2020, 13, 828. [Google Scholar] [CrossRef]
  2. Aliabadian, Z.; Sharafisafa, M. Numerical modeling of presplitting controlled method in continuum rock masses. Arab. J. Geosci. 2014, 22, 5005–5020. [Google Scholar] [CrossRef]
  3. Hu, Y.; Lu, W.; Chen, M.; Yan, P.; Yang, J. Comparison of Blast-Induced Damage Between Presplit and Smooth Blasting of High Rock Slope. Rock Mech. Rock Eng. 2014, 47, 1307–1320. [Google Scholar] [CrossRef]
  4. Chen, Y.K.; Xu, J.H.; Wang, J.C. Numerical Simulation of Dynamic Damage and Stability of A Bedding Rock Slope Under Blasting Load. Shock. Vib. 2019, 2019, 9616859. [Google Scholar] [CrossRef] [Green Version]
  5. Raina, A.K. Influence of Joint Conditions and Blast Design on Pre-split Blasting Using Response Surface Analysis. Rock Mech. Rock Eng. 2019, 52, 4057–4070. [Google Scholar] [CrossRef]
  6. Cheng, S.; Ma, Z.; Gong, P.; Li, K.; Li, N.; Wang, T. Controlling the Deformation of a Small Coal Pillar Retaining Roadway by Non-Penetrating Directional Pre-Splitting Blasting with a Deep Hole: A Case Study in Wangzhuang Coal Mine. Energies 2020, 13, 3084. [Google Scholar] [CrossRef]
  7. Paurush, P.; Rai, P.; Sharma, S.K. Selection of Blasting Design Parameters Affecting Peak Particle Velocity-a Case Study. Min. Metall. Explor. 2021, 38, 1435–1447. [Google Scholar] [CrossRef]
  8. Kabetenov, T.; Yusupov, K.A.; Rustemov, S.T. Rational parameters of blasting, considering action time of explosion-generated pulse. J. Min. Sci. 2015, 51, 261–266. [Google Scholar] [CrossRef]
  9. Xiang-Long, L.; Qi-Wen, H.; Xue-Bin, M.; Ke-Gang, L.; Jian-Qiang, X. Experimental Research On Presplitting Blasting Of The Final Highwall Of An Opencast Coal Mine. J. Balk. Tribol. Assoc. 2016, 22, 2857–2869. [Google Scholar]
  10. Yuan, Y.; Yuan, C.F.; Zhu, C.; Liu, H.X.; Wang, S.Z. Study on the disaster reduction mechanism of presplitting blasting and reasonable blasting parameters for shallowly buried remnant pillars. Energy Sci. Eng. 2020, 7, 2884–2894. [Google Scholar] [CrossRef]
  11. Chen, B.B.; Liu, C.Y.; Yang, J.X. Design and Application of Blasting Parameters for Presplitting Hard Roof with the Aid of Empty-Hole Effect. Shock. Vib. 2018, 2018, 8749415. [Google Scholar] [CrossRef] [Green Version]
  12. Sharma, S.K.; Rai, P. Establishment of blasting design parameters influencing mean fragment size using state-of-art statistical tools and techniques. Measurement 2017, 1, 34–51. [Google Scholar] [CrossRef]
  13. Roy, M.P.; Mishra, A.K.; Agrawal, H.; Singh, P.K. Blast vibration dependence on total explosives weight in open-pit blasting. Arab. J. Geosci. 2020, 13, 531. [Google Scholar] [CrossRef]
  14. Yang, R.S.; Su, H. Experimental study on crack propagation with pre-crack under explosive load. J. China Coal Soc. 2019, 44, 482–489. [Google Scholar]
  15. Su, H.; Gong, Y.; Yang, R. Influence of pre-split-ting crack width on crack propagation under blast loading. J. China Univ. Min. Technol. 2021, 50, 579–586. [Google Scholar]
  16. Ma, L.; Li, K.; Xiao, S.; Ding, X.; Chinyanta, S. Research on effects of blast casting vibration and vibration absorption of presplitting blasting in open cast mine. Shock. Vib. 2016, 2016, 4091732. [Google Scholar] [CrossRef] [Green Version]
  17. He, L.; Wang, J.; Xiao, J.; Tang, L.; Lin, Y. Pre-splitting blasting vibration reduction effect research on weak rock mass. Disaster Adv. 2013, 6, 338–343. [Google Scholar]
  18. Han, Y.Z.; Liu, H.B. Finite Element Simulation of Medium-Range Blast Loading Using LS-DYNA. Shock. Vib. 2015, 2015, 631493. [Google Scholar] [CrossRef] [Green Version]
  19. Wang, B.; Li, H.; Shao, Z.; Chen, S.; Li, X. Investigating the mechanism of rock fracturing induced by high-pressure gas blasting with a hybrid continuum-discontinuum method. Comput. Geotech. 2021, 140, 104445. [Google Scholar] [CrossRef]
  20. Xu, P.; Yang, R.; Zuo, J.; Ding, C.; Chen, C.; Guo, Y.; Fang, S.; Zhang, Y. Research progress of the fundamental theory and technology of rock blasting. Int. J. Miner. Metall. Mater. 2022, 29, 705–716. [Google Scholar] [CrossRef]
  21. Banadaki, M.M.D.; Mohanty, B. Numerical simulation of stress wave induced fractures in rock. Int. J. Impact Eng. 2012, 40, 16–25. [Google Scholar] [CrossRef]
  22. Yi, C.; Johansson, D.; Nyberg, U.; Beyglou, A. Stress Wave Interaction between Two Adjacent Blast Holes. Rock Mech. Rock Eng. 2015, 49, 1803–1812. [Google Scholar] [CrossRef]
  23. Beijing, X.; Ai, D.; Yang, Y. Crack Detection and Evolution Law for Rock Mass under SHPB Impact Tests. Shock. Vib. 2019, 2019, 3956749. [Google Scholar] [CrossRef] [Green Version]
  24. Chen, S.H.; Wu, J.; Zhang, Z.H. Blasting Source Equivalent Load on Elastic-Plastic Boundary for Rock Blasting. J. Eng. Mech. 2017, 143, 4017034. [Google Scholar] [CrossRef]
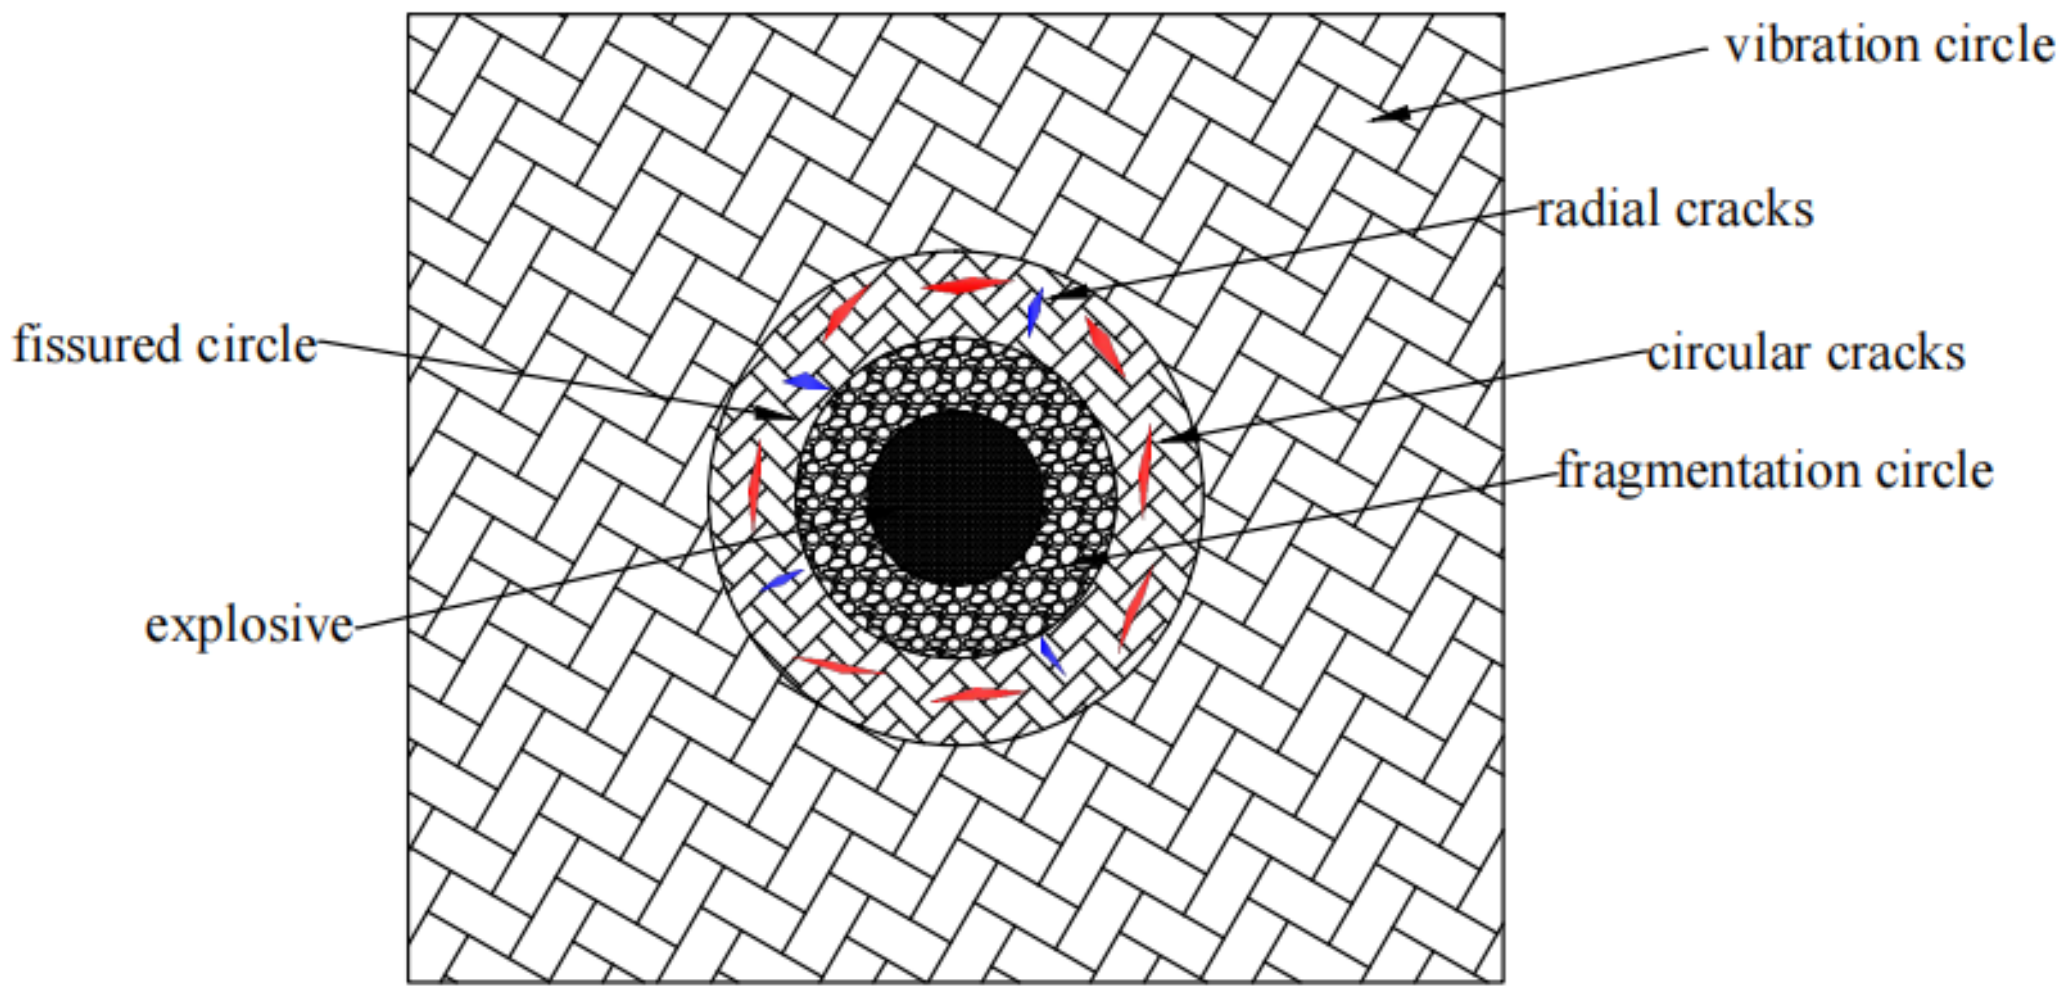
Figure 1. Diagram of rock blasting mechanism.
Applsci 12 04930 g001
Figure 2. Diagram of stress wave propagation.
Applsci 12 04930 g002
Figure 3. Location of mining area.
Applsci 12 04930 g003
Figure 4. Chart of blast zone environment. (a) Explosion area location. (b) Field overview.
Applsci 12 04930 g004
Figure 5. Schematic diagram of gun hole layout.
Applsci 12 04930 g005
Figure 6. Chart of charge structure of each hole.
Applsci 12 04930 g006
Figure 7. Site construction process.
Applsci 12 04930 g007
Figure 8. Field blasting effect.
Applsci 12 04930 g008
Figure 9. Model diagram.
Applsci 12 04930 g009
Figure 10. Compression results of specimens.
Applsci 12 04930 g010
Figure 11. Blocking setting schematic diagram.
Applsci 12 04930 g011
Figure 12. Diagram of grid division.
Applsci 12 04930 g012
Figure 13. A 90 mm aperture 630 mm hole spacing stress wave propagation nephogram. (a) 0.5 ms. (b) 1 ms. (c) 2 ms. (d) 3 ms. (e) 4 ms.
Applsci 12 04930 g013
Figure 14. Y-direction stress–time history curves of each aperture and its 7 times aperture distance. (a) 90 mm aperture. (b) 100 mm aperture. (c) 110 mm aperture. (d) 120 mm aperture. (e) 130 mm aperture.
Applsci 12 04930 g014
Figure 15. Y-direction peak stress curve at observation point. (a) 90 mm aperture. (b) 100 mm aperture. (c) 110 mm aperture. (d) 120 mm aperture. (e) 130 mm aperture.
Applsci 12 04930 g015
Figure 16. The relation curve between effective tensile stress of different hole diameters and hole spacing. (a) 90 mm aperture. (b) 100 mm aperture. (c) 110 mm aperture. (d) 120 mm aperture. (e) 130 mm aperture.
Applsci 12 04930 g016
Figure 17. Optimization curve.
Applsci 12 04930 g017
Table 1. Classification table of slope rock mass structure.
Slope LocationPetrofabric TypesStructure of Rock Mass
Earth’s SurfaceDeep Part
northwest sidequartzitelumpylumpy
north wallquartzitelayered-blocklayered-block
southeastern partfeldspar slatelayered-blocklayered-block
south slopefeldspar slatelayer-fragmentationlaminarization
northeast Gangmica-schistthinly beddedthinly bedded
Table 2. Rock material coefficient table.
Density ρ
g/cm3
Modulus of Elasticity
E/GPa
Poisson’s Ratio
v
Yield Strength
MPa
Tangent Modulus
GPa
2.431560.26311.3
Table 3. Plugging material coefficient table.
Density ρ
g/cm3
Modulus of Elasticity
E/GPa
Poisson’s Ratio
v
Yield Strength
MPa
Tangent Modulus
GPa
1.81.380.330.770.13
Table 4. Material coefficients of emulsion explosive.
Density ρ
g/cm3
Detonation Velocity
cm/us
Detonation Pressure
Mbar
ABR1R2ωE
Mbar
1.250.350.042.1440.001824.20.90.150.0419
Publisher’s Note: MDPI stays neutral with regard to jurisdictional claims in published maps and institutional affiliations.