Abstract
A rockfall risk assessment along the transportation route to a historical village is presented herein with the aim of evaluating the potential of this approach for speed limit zonation. Mountainous roads are often subject to rockfalls, which should be taken into account for territorial management and planning, especially when dealing with dynamic variables, such as vehicular traffic. Rockfall risk analysis along roads is often aimed at assessing a risk value to plan or prioritize mitigation purposes. Nevertheless, such approaches can also be used to regulate traffic in terms of posted speed limits. Traffic is, indeed, a key variable in rockfall risk analysis due to the spatial and temporal correspondence that a vehicle can have with an either falling or fallen rock block. In order to address this relationship for speed limit zonation purposes, in this paper, a semi-quantitative Rockfall Hazard Rating System was applied to a mountainous road leading to a popular tourist destination in eastern Sicily (Italy), which is characterized by winding paths. This approach, which was chosen for its feasibility and international diffusion, was repeated by taking five different vehicle speed scenarios into account, thus providing an innovative application of the procedure in terms of aims and practical results. The achieved outcomes were used to draft thematic maps, as well as to define a suitable speed limit zonation related to the rockfall risk, highlighting that the road visibility strongly affects the final results. The achieved outcomes demonstrate how a scientific approach can be turned into a practical tool of broad utility, especially in mountainous settings, where winding roads and rockfall problems often condition the viability.
1. Introduction
Mountainous environments have been attracting settlers for thousands of years thanks to their strategic location in terms of observation spots, territorial surveillance, and controlled accessibility. Over time, such settlements have become hubs for trade and war purposes, and have then turned into villages and gained specific roles in the local territory. Nowadays, the historical value that such villages have gained attracts visitors interested in discovering and enjoying their heritage appeal in peculiar natural environments. Nevertheless, the hard accessibility that represented a defensive feature in remote times represents today a limitation to geotourism because the access routes are usually limited and are characterized by irregular paths to overcome high slope rates. Furthermore, mountainous settings are an expression of a complex geological history, which affects the development of linear infrastructures. These, indeed, often cross different geological formations, thus suffering from specific geological problems related to slope instability. When mountainous roads cross rock masses, the major threat is represented by rockfall occurrence, i.e., rapid kinematic landslides, which represent a serious hazard along roads [1]. In this regard, roads are counted among the most recurrent elements at risk, with rockfalls being some of the most fatal natural events, especially in mountainous areas [1,2,3,4]. This aspect carries a relevant scientific and technical importance, and there are numerous studies in the published literature dealing with this issue (e.g., [5,6,7,8,9,10,11]). In particular, the term risk refers to the expression of the likelihood and impact of an uncertain, sudden, and extreme event that may positively or negatively impact the achievement of a project or program objective [12]. Rockfall risk arises from the probability of causing certain damage to one or more elements at risk (modified after [13]), which, in the case of transportation routes, are represented by both human lives and goods with an economic value, such as passing vehicles and infrastructural elements. For this aspect, numerous risk assessment systems have been proposed to identify, either qualitatively or quantitatively, slopes that are at risk of failure and to allow the arrangement of preventive measures (e.g., [14,15,16]). Some authors [17,18] also proposed a comparison between different rockfall risk rating systems along roads, even highlighting uncertainties and limitations and suggesting that the choice of the most suitable risk assessment methodology can be carried out based on the different planning purposes. Among the multiple aspects that must be taken into account during a rockfall risk analysis along roads, the dynamic presence of elements at risk, represented by vehicular traffic, is a key factor. Traffic safety is one of the most crucial issues, since a large number of people lose their lives in traffic accidents every day, mostly due to inappropriate choice of speed, and there are numerous technical studies aimed at addressing this aspect [19,20]. It is precisely the dynamism of this element, which involves vehicles traveling at different speeds, that leads to the need for shedding light on how vehicle speed affects rockfall risk. There is indeed a dual relationship between rockfall risk and vehicle speed, which depends on the spatial and temporal correspondence between a falling boulder and a passing vehicle. In particular, the spatial correspondence is related to the possibility that a falling block stops at a roadway and that a driver can see it. In this specific case, the driver needs time to avoid the impact by either changing the vehicle’s trajectory or stopping it [2]. The temporal correspondence is linked to the possibility that a vehicle is hit by a falling block due to the intersection of the respective trajectories [2,7,21]. This aspect has scientific importance, which is reflected in its public utility, because both of the previously reported spatial and temporal correspondences are strongly dependent on the vehicle speed limit posted along roads.
Inspired by this topic and with the aim of increasing the scientific knowledge on this relevant problem, this paper presents a rockfall risk analysis along a mountainous road connecting the Ionian coastline of Sicily (Italy) to Forza d’Agrò, a historical village offering a medieval atmosphere with narrow streets, charming churches, and aristocratic buildings in the geological context of the Peloritani Mountains (Figure 1a). Thanks to its history and monuments, the village is acknowledged as being among the most popular tourist destinations on the eastern side of Sicily, and the main access route is represented by Provincial Road 16 (SP-16), which runs from 50 to 350 m a.s.l. on a winding path crossing a complex geological setting. These reasons led to the choice of this study area. In particular, most of the road crosses intensely fractured rock masses that show evident signs of instability, thus representing a source of risk for vehicular traffic. Several rockfalls have already occurred along the SP-16 road, and numerous blocks have been surveyed at different spots on the road side, thus testifying to the current rockfall activity. The potential road disruption in case of rockfalls would lead to the partial isolation of the village not only from the touristic point of view, but also for rescue purposes in case of emergency. According to a Civil Protection report published in 2016, the Province of Messina, within which the study area falls, is the most affected by rockfalls along roads in Sicily. In this light, the rockfall risk evaluation was performed herein by using the Rockfall Hazard Rating System (RHRS) proposed by Pierson et al. [14] and modified for Italian road standards by Budetta [8]. This approach is a semi-quantitative system that takes into account all of the elements related to rockfall hazards and vehicle vulnerability [8], including vehicle speed, and this allows a reliable estimation of the degree of exposure to risk along roads. Ferrari et al. [16] provided a summary of the most widely used RHRS approaches, which were modified for specific regional conditions and needs (e.g., [8,22,23,24,25]). Numerous application cases involving RHRS methods are available in the scientific literature. Pappalardo et al. [6] applied it to a mountainous road connecting tourist cultural heritage sites, while Aqeel [26] critically revised the RHRS of Saudi Arabia, which was initially proposed by [27], pointing out hints for future studies. Further applications in different countries were presented by both [28] for alpine regions and [29] for natural slopes at historical sites in Greece, as well as along railways [10]. Nevertheless, the relationship between the final RHRS outcomes and the speed limit to post along roads has not been previously addressed in detail and represents a scientific novelty that this study aims to provide. In fact, in this paper, the RHRS was applied while considering five different vehicle speed scenarios in order to find out the implications of this key parameter when dealing with rockfalls along linear infrastructures. The application of this methodology was supported by field surveys, which were carried out for geomechanical and kinematic purposes. Data arising from the RHRS were used to draft thematic maps and to present the consideration of the possibility of rockfall-risk-related speed limit zonation, which would represent a useful tool for territorial management, with specific reference to the prioritization of slope mitigation work.
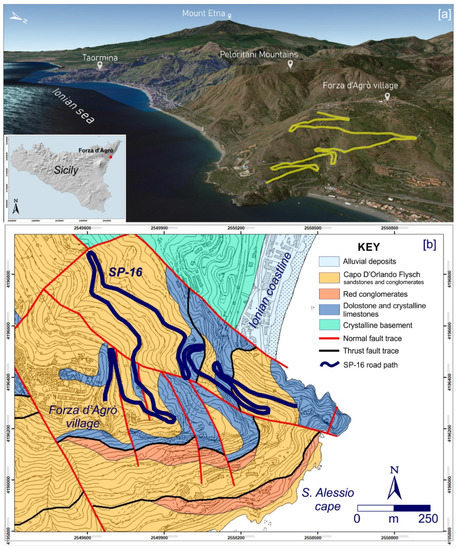
Figure 1.
(a) Geographical location of the study area and panoramic view (Google Earth) with the studied road path highlighted; (b) geological map of the study area.
2. The Study Area
The study area is located along the northeastern coastal sector of Sicily (Italy) (Figure 1), where the medieval village of Forza d’Agrò, a popular tourist destination and one of the most charming mountainous villages of the region, stands on a 420 m high promontory. The village was first settled by Greeks, who arrived between the 8th century and the 5th century BC and named the town “Arghennon Akron”, meaning “Silver Promontory”. Over time, Akron changed into Argon, then into Agron, and finally into Agrò. A few remains of a fort-like structure located at the top of the promontory suggest that the village used to be a fortress. Thanks to its narrow streets, charming churches, and aristocratic buildings, the old town center offers a wonderful medieval and ancient atmosphere that attracts tourists from all over the world. To reach this destination, the main route is represented by a two-lane mountainous road (Provincial Road 16, SP-16) that climbs from 50 to 350 m a.s.l. on a winding path (Figure 1). From the geological point of view, the study area is located on the southern part of the Calabria Peloritani Orogen, which made up of a Hercynian metamorphic basement covered by Mesozoic–Cenozoic units [30]. Regional fault systems displace the geological formations along the E–W and NW–SE directions as a result of the complex tectonic history that characterizes the area. In particular, Barreca et al. [31] reported a pervasive set of oblique extensional NW–SE faults that were measured just west of the Forza d’Agrò village, which affect the carbonate rock masses and dislocate the previous WNW–ESE trending thrust faults. In this peculiar setting, the SP-16 road crosses two main geological formations that are characterized by different physical–mechanical features, i.e., Jurassic gray dolostone–limestones and polygenic conglomerates in a red matrix (Figure 1b). The first ones crop out as heavily jointed rock masses bordering the road along one or two sides with relevant wall heights and suffering from evident features of rock mass instability; on the other hand, the road portion crossing the red conglomerates (northernmost sector) is affected by deformation of the road pavement due to local movements. The carbonate rock masses show signs of heavy tectonics and past rockfall activity. The first one is testified by the intense degree of fracturing (Figure 2a,b), while the rockfall activity can be inferred from the numerous empty rock mass sectors that can be regarded as past rockfall source areas (Figure 2a,b). Moreover, numerous loose rock mass sectors hang over the road path (Figure 2b,c). Based on this field evidence of instability that threatens the infrastructure of SP-16, this paper is focused on the road path that is bounded by the carbonate rock masses. The latest documented rockfalls date back to 2009 and 2014, when a series of large blocks impacted on the roadway. Similar events have periodically occurred over the years, as testified by numerous blocks found along the roadside (Figure 2d). Therefore, rockfalls represent a risk to elements with value in terms of human life and economy (i.e., people, vehicles, road infrastructure), especially considering the tourist vocation of the area. In fact, in addition to the historical village, the studied road offers some stopping spots (not equipped for parking) for religious and scenic purposes. These include a pilgrimage spot located at a natural cave, which hosts a religious statue of the Virgin and some benches under the bare rock roof. This spot, as well as a few others along the road, also offers a breathtaking view of the coastal landscape (Figure 2e), thus prompting tourists and drivers to stop under the rock cliff.
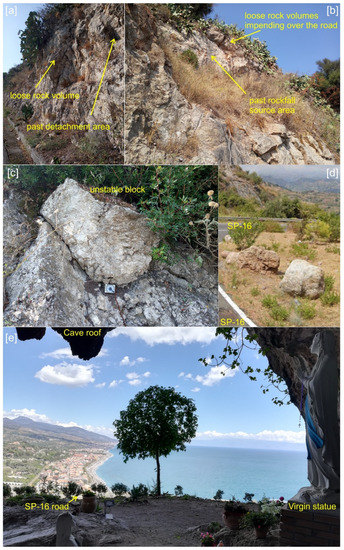
Figure 2.
(a,b) Examples of rock masses hanging over the road and showing features of instability and past rockfall source areas; (c) previously fallen blocks surveyed at a road bend segment; (d) unstable block hanging over the road; (e) panoramic view from inside the religious cave.
3. Materials and Methods
The rockfall risk analysis presented herein cannot be considered only a mere application of a rating method, which would extremely simplify the problem and the related approach of the study. In fact, the risk rating system applied herein, which is presented as a scientific methodology for practical applications, requires an in-depth characterization of the problem from the perspectives of both the rock masses and the road’s geometrical features. In fact, it has been widely ascertained that the geomechanical features of a rock mass play a key role in controlling the stabilization and deformation characteristics of rock slopes, especially in seismically active and tectonically complex areas (e.g., [32,33,34,35]), with direct repercussions on slope instability and the resulting risk. Therefore, here, the first step was the complete characterization of the rock mass through field surveys that were performed according to the recommendations of the International Society for Rock Mechanics (ISRM) [36] (Figure 3). The rock mass survey was focused on the road segments surrounded by rock masses that hosted no protective measures and showed signs of potential instability. For each surveyed discontinuity, the orientation, spacing, persistence, opening, in-filling, roughness, uniaxial compressive strength (UCS), and hydraulic were measured and evaluated. Spatial data of the discontinuities were plotted on stereograms and statistically processed to find the most representative discontinuity sets for kinematic purposes. According to the surveyed data, the geomechanical quality of the rock masses was estimated through the Slope Mass Rating approach [37], which relies on the preliminary estimation of the Rock Mass Rating (RMR) value [38], which is then corrected by a factorial adjustment factor depending on the relationships between joints and, if present, on the method of excavation. As a parallel activity, the geometrical features of the road were surveyed in terms of width and visibility conditions, and the road was divided into sub-segments characterized by homogeneous geometrical features (e.g., straight paths, bends). At each sub-segment, the modified Rockfall Hazard Rating System (RHRS) was applied to quantify the rockfall risk according to different scenarios related to the vehicle speed (Figure 2). The principle on which this approach is based is the link between the risk arising from rockfalls and the prioritization of budget allocation for the maintenance and protection of roads. To this purpose, the United States Department of Transportation in Oregon proposed the RHRS classification scheme to identify hazardous slopes requiring urgent remedial work [8,14,16]. This methodology consists of assigning a score to nine categories related to rockfall hazard and vehicle vulnerability (Table 1), starting from the slope survey, which is considered an essential feature of the approach [14]. The parameters involved are the slope height, protective measure effectiveness, average vehicle risk (AVR—i.e., the spatial probability of a vehicle’s occurrence in the length of the rockfall hazard zone), percentage of sight decision distance (P-DSD), roadway width, geological character (SMR [37]), volume of rockfall/block size, and climate and rockfall history. The sum of the scores expresses the grade of risk exposure along roads. More specifically, the AVR is calculated by using Equation (1):
where ADT is the average traffic volume in one day, SL is the length of the hazard zone expressed in km, and PSP is the road speed limit expressed in km/h. An AVR value of 100% suggests that a vehicle can be expected to be within the hazard zone for 100% of the examined time. A high AVR (>100%) suggests that more than one vehicle is present within the hazard zone [8,14].
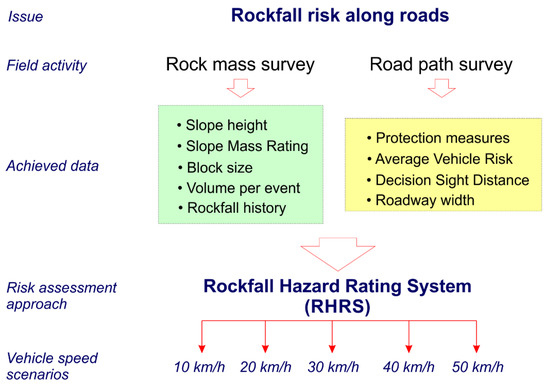
Figure 3.
Schematization of the methodological approach carried out for this study.

Table 1.
Parameters taken into account by the modified Rockfall Hazard Rating System [8].
The P-DSD parameter indicates the percentage of decision sight distance. In particular, the decision sight distance (DSD) represents the length of road that a driver needs to make a complex or instantaneous decision. This involves the spatial probability of a vehicle crashing into a fallen boulder laying on the road, which occurs when the driver does not have enough decision time to avoid the impact. For Italian roads, this is a function of the vehicle speed and the longitudinal slope of the road (CNR 1980). The P-DSD can be estimated with Equation (2):
where ASD is the actual sight distance determined for the two directions of travel, since an obstacle on the road will be less visible when it is located just beyond the sharpest part of a curve.
The sum of scores assigned to each parameter returns a final RHRS value that provides a risk classification according to three classes:
- -
- High: RHRS scores >500 suggest that the studied road segment has to be considered to have “immediate need of stabilization measures”;
- -
- Intermediate: 300 < RHRS < 500 suggests that the studied road segment has a “high priority of remedial work”, although a case-by-case evaluation would be appropriate [8].
- -
- Low: RHRS scores < 300 are an index of “low urgency” in designing mitigation measures [14].
The RHRS methodology was applied at 51 road subsegments by taking five different scenarios of vehicle speed into account so as to shed light on the related variation in rockfall risk. This consideration aims at a better understanding of the traffic influence on rockfall risk, and the expected results could be useful for territorial management.
4. Results
4.1. Rock Mass Survey and Kinematic Analysis
Rock mass surveys were carried out according to the objective criterion proposed by ISRM [36], which requires the surveying of all discontinuities intersecting a scan line. Measuring stations were placed at six key spots along the studied roadway, on gray dolostone and crystalline limestone outcrops. By analyzing the resulting spatial data of discontinuities, the presence of four main families was highlighted (Figure 4). These were characterized by a medium to high persistence (3 to 20 m) and a close to moderate spacing (60–600 mm). Fractures showed aperture values greater than 5 mm, and the filling material was mostly absent or compact. Joint surfaces were predominantly wavy, with a joint roughness coefficient (JRC) ranging from 2 to 14. The achieved outcomes were used to carry out the estimation of the rock mass geomechanical quality according to the classification systems proposed by Bieniawski [38] and Romana [37]. These procedures returned a homogeneous classification for all of the surveyed rock masses, which could be classified as “Fair” rock (geomechanical quality class III), with the RMRb ranging between 42 and 58 and the SMR between 50 and 53.
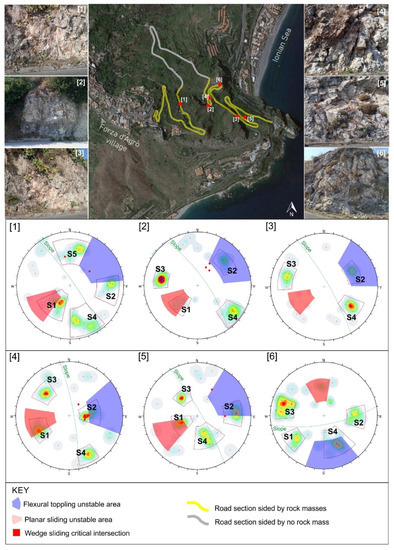
Figure 4.
Location of the rock mass survey stations (on a satellite image by Google Earth) and geostructural diagrams showing the kinematic settings of the studied outcrops.
Moreover, based on the empirical relations proposed by this classification system, the main shear strength parameters of the rock mass (Table 2)—namely, cohesion and friction angle—were calculated with Equations (3) and (4), respectively:
c = 5 RMRb
φ = 0.5 RMRb + 5
Table 2.
Summary of the outcomes of geomechanical classifications.
The ranges of cohesion and the internal friction angles of the rock mass were 243–277 kPa and 29–32°, respectively (Table 2).
In order to assess the failure predisposition of the rock masses, a kinematic analysis was carried on stereograms out by taking into consideration the angular relationship between the discontinuities and the slope face with reference to different failure patterns. More specifically, planar sliding may occur when lateral-release surfaces are present in a rock mass and the slope face’s inclination is greater than that of the sliding surface, which, therefore, daylights on the rock face; moreover, the inclination of the discontinuity plane must exceed the value of the friction angle. In this frame, this kinematic failure pattern was recognized at all of the surveyed stations and it affected the S1 sets, along with some random poles (RD) (Figure 4, Table 3). Wedge failure occurs when two or three discontinuities intersect, releasing a rock volume that can slide either along the intersection line (symmetric wedge) or along the most unfavorable plane (asymmetric wedge). In this case, wedge patterns were found at the intersections of the S1, S2, S3, and S4 sets (Figure 4, Table 3). Toppling failure affected the S2 and S4 sets, and all six stations exhibited this kinematic pattern (Figure 4, Table 3). It must be underlined that, even in this case, the kinematically unstable area also involved RD. This even strengthened the condition of instability of the rock masses along low-recurring discontinuities, which were not grouped into the system but conditioned the threat of rockfall (Figure 4). In order to mathematically prove the instability of the studied kinematic patterns, a numerical analysis was carried out according to the limit equilibrium method, which allows the calculation of a factor of safety as the ratio of the total forces resisting down-slope sliding to the total forces inducing sliding. The resisting forces are mainly represented by the shear strength along the sliding surface, plus artificial reinforcement or other external stabilizing forces, if present. On the other hand, the driving forces consist of the down-slope weight component of a sliding block, seismic acceleration force, water pressures, and external forces on the surface of the upper slope. The results returned factors of safety that were generally lower than 1.3, especially when the seismic force was considered, thus revealing the instability of these kinematic patterns.
Table 3.
Summary of the main unstable kinematic patterns at each surveying station.
4.2. Rockfall Risk Zonation
The risk assessment procedure along the road was repeated by taking into account five different scenarios that considered different likely vehicle speeds. This is because this methodological approach involves both fixed and dynamic factors. Fixed factors are those related to geology, rock mass condition, presence of mitigation measures, and road engineering features. The dynamic factor is the vehicle speed. The five scenarios modeled herein refer to vehicle speeds of 10, 20, 30, 40, and 50 km/h, and for each model, the highest RHRS value between the two directions of travel was taken as representative. These speed values are reasonable in mountainous roads, where, on the one hand, vehicles are induced to travel slowly due to the presence of narrow bends, while, on the other hand, the low traffic rate could lead some drivers to experience higher velocities. The geological parameters involved in the assessment were taken from the geostructural and geomechanical characterization of rock masses presented above. In particular, with specific reference to the boulder volume, the average volume of already fallen boulders surveyed along the road was considered as a cautious value. The geometrical features of the road were measured during field campaigns, along with the traffic volume. The latter was estimated through daily monitoring, which allowed the counting of the passing units. The representative value of 1500 vehicles per day was considered by including a rate of tourist units, whose maximum peak is usually registered during summer and weekends.
The 10 and 20 km/h scenarios (Figure 5) were characterized by high similarities in terms of risk zonation. In particular, 47% of the analyzed road sub-segments fell within the low class, with a minimum RHRS value of 177, while the remaining road sectors were in the intermediate risk class, with a maximum RHRS score of 365.
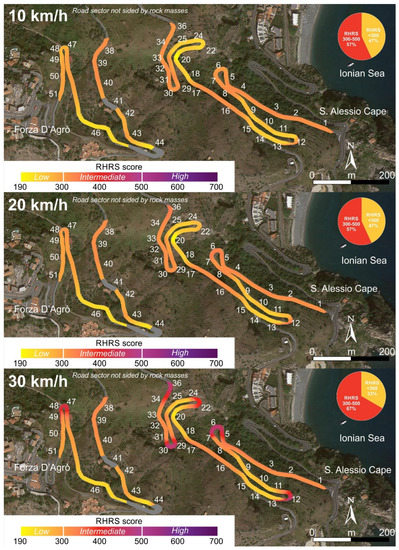
Figure 5.
Risk maps for 10, 20, and 30 km/h vehicle speed scenarios considered. Numbers along the road path indicate the most representative sub-segments considered for the computation of the RHRS score. The gray band indicates road segments surrounded by no rock masses.
The 30 km/h scenario (Figure 5) returned rockfall risk RHRS values ranging between 194 and 494. The analyzed road was, therefore, at intermediate risk for 67% of the analyzed stretches, while the remaining 33% were within the low risk class. The risk zonation was conditioned by the road visibility; in fact, the highest rates were found at bends, with scores close to those of the highest risk class, while the lowest ones occurred at the straightest portions. A further influence on the rockfall risk zonation was provided by the presence of mitigation measures, which, in the study area, occurred at sub-sections 14, 19, and 20 (Figure 5). These were rockfall barriers and wire meshes, which surely reduced the potential impact of rockfalls for the benefit of a risk reduction. In this study case, their occurrence on a straight road portion led to a downgrade by a risk class.
The 40 km/h scenario (Figure 6) reflected the previous ones, although with higher RHRS values that ranged between 225 and 613. In particular, 24% of the analyzed sub-segments fell within the highest risk class (RHRS > 500), with specific reference to bends, while most of the road path (45%) was in the intermediate class (300 < RHRS < 500). The lowest values (<300) were found at 16% of analyzed sub-segments—where mitigation measures were present and where the good road visibility guaranteed drivers a reasonable amount of time to avoid an impact with a likely fallen boulder lying on the road segment.
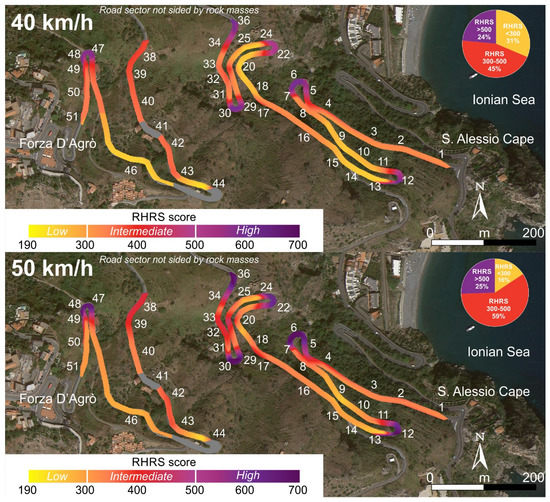
Figure 6.
Risk maps for the 40 and 50 km/h vehicle speed scenarios considered. Numbers along the road path indicate the most representative sub-segments considered for the computation of the RHRS score. The gray band indicates road segments surrounded by no rock masses.
The 50 km/h scenario returned the most critical outcome (Figure 6) because the whole road path fell within the intermediate (59%) and high (25%) risk classes (RHRS score from 230 to 709), thus suggesting the urgency of performing remedial work. In addition, the subsegments surrounded by secured rock masses showed a score slightly higher than 300, thus falling into the intermediate risk class. Even in this case, the local reduction of visibility seems to be the most conditioning parameter, as testified by the greatest values labeling the narrow bends.
5. Discussion
The risk zonation methodology presented herein, along with the results achieved, is a starting point for developing some aspects of a discussion. The first aspect concerns the rating system that was applied, which proved to be a suitable and relatively quick procedure for categorizing the risk along the studied road, even from the perspective of the practical use of the results. In fact, the availability of final scores that characterized specific road sub-segments allowed the drafting of thematic maps, which represent a key tool for territorial and risk management, providing a quick and intuitive overview on the variation of risk. The usefulness of such a rating system is in its adherence to reality in terms of the parameters considered for the risk rating. In fact, on the one hand, it takes into account the geological aspect and the engineering features of the infrastructure that is at risk, which are constant at each selected road segment in terms of the geomechanical quality of rock masses, expected mobilized rock volumes, and road geometry. On the other hand, the RHRS method considers the dynamic presence of other elements that are at risk, which are represented by passing vehicles; these are, however, characterized by a certain variability, especially in terms of speed. This aspect is crucial for mountainous roads, where the presence of narrow bends strongly conditions the road visibility. In fact, rockfall risk does not arise only from the spatial and temporal correspondence between a falling rock and a passing vehicle, but also from the possibility that a vehicle could crash into a previously fallen boulder lying on a road segment. In this specific case, the driver should have at their disposal enough time to make a decision to either stop the vehicle or avoid collision. The DSD parameter allows the consideration of this important aspect in the rating system; since it is specifically related to vehicle speed, the simulation of the five different scenarios presented herein sheds light on key risk variations. In fact, although there is usually a posted speed limit along roads, this does not necessarily coincide with the actual speed of traffic units, thus conditioning the computation of the DSD and AVR parameters. The first one was proportional to the vehicle speed, and in this case, it showed an increase of 470% from the 10 to 30 km/h scenarios and of 228% from the 30 to 50 km/h ones, thus suggesting a relevant incidence in the risk computation procedure. Consequently, the P-DSD scores, which were calculated according to the RHRS procedure, showed great variation as a function of the vehicle speed considered (Figure 7a). This proved, indeed, the variable that significantly affects the computation of the final RHRS score. For example, the bend sub-segments 6 and 12 fell within the intermediate risk class based on the 10 to 30 km/h scenarios and within the highest risk class according to the 40 and 50 km/h ones due to an increase in the P-DSD score (Figure 7a). Similarly, sub-segment 26 was in the lowest risk class according to the 30 km/h scenario, while it shifted upwards to the medium risk class when considering a vehicle speed of 50 km/h, with a relevant increase in the P–DSD score (Figure 7a). On the contrary, road segments that offered good visibility were subject to slight score variations, which may not have involved a class shift, e.g., sub-segments 40 and 16 (Figure 7a).
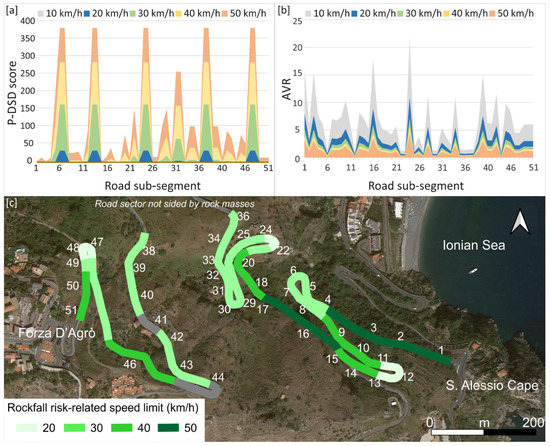
Figure 7.
Variation of the P-DSD-related score (a) and the AVR parameter (b) along the road according to the different vehicle speed scenarios; (c) likely rockfall-risk-related speed limit zonation resulting from this study. The gray band indicates road segments surrounded by no rock masses.
With reference to the AVR, which relies on the spatial probability of occurrence of a vehicle in the rockfall hazard zone, it is inversely proportional to the speed, with a 66% reduction from the 10 to 30 km/h scenarios, a 25% reduction from the 30 to 40 km/h scenario, and a 20% reduction from the 30 to 50 km/h scenarios (Figure 7b). Nevertheless, these variations had small repercussions on the AVR-related score, whose average maximum final score decreased; from 10 to 50 km/h, it was 0.3. The AVR also depends on the daily traffic volume, which was considered herein as a constant value. According to this risk zonation, prioritization of remedial work can be planned. This represents a key aspect of this research for practical applications, since this approach allows the highlighting of the sectors that are affected by a higher risk even at a very low vehicle speed, i.e., road segments where mainly the morphological and geomechanical features control the final risk score.
Such considerations are particularly useful for territorial management, as the application of this rockfall risk rating system allows an estimation of the most suitable speed limit to post along roads in relation to the rockfall threat on mountainous roads, where visibility may be limited by the winding paths. The approach presented herein can, therefore, be employed to provide a posted speed limit zonation along the route. With respect to the study case, the suggested vehicle speed limit zonation is reported in Figure 7c, where the speed limit was chosen with the aim of maintaining the lowest available risk class along the road. For example, the initial road segment (sub-segments 1 to 4), which was characterized by a good visibility, was constantly within the intermediate risk class, with very slight variations as a function of the vehicle speed. This happened because the RHRS methodology also involves the influence of other risk factors, such as geomechanics and slope height, which, however, play a role in the final risk score. In this initial road stretch, the rockfall-risk-related speed limit could be posted up to 50 km/h, while at segments 9–10, the speed limit should not exceed 40 km/h. At bends, where the risk class is constantly intermediate, the speed limit could be posted between 10 and 30 km/h. According to the RHRS scores, spots 18 to 20 benefit from the presence of remedial measures, and this allows the maintenance of the lowest risk class, even when considering a 40 km/h speed limit.
On the contrary, from sub-segments 21 to 36, the most conservative scenario was 20–30 km/h, as the road was within the intermediate risk class, especially at bends (Figure 7c). It is underlined that the speed limit zonation proposed herein refers to rockfall-related risk. In order to achieve a final speed limit value to post along the road, for territorial management purposes, this should be evaluated along with other engineering aspects with reference to the features of the construction of the infrastructure and to local restrictions.
6. Conclusions
In this paper, a rockfall risk zonation along a road to a historical village was presented with the aim of evaluating the implications of rockfall threat for vehicular speed. The stretch of road analyzed herein is characterized by tight hairpin bends, causing relevant reduction of visibility. The road is also surrounded by intensely fractured rock masses that show instability problems, and it is frequently affected by rockfalls. The methodological approach followed herein refers to the Rockfall Hazard Rating System after [8,14], which was applied by considering three different scenarios involving increasing vehicle speeds, namely, 10, 20, 30, 40, and 50 km/h.
The application of the RHRS allowed the provision of a risk zonation according to the final scores for the five simulated scenarios. The road can be considered to be at high risk, especially along the low-visibility segments. Straight road stretches were characterized by lower risk values, as were road portions surrounded by secured rock masses (with wire meshes or protective barriers installed). The comparison between the simulated scenarios confirmed that the rockfall risk increases with the increase in vehicle speed, although for very low speeds (10 and 20 km/h), no significant difference were highlighted. By assuming the geomechanical characteristics of the rock masses and the structural features of the infrastructure at each analyzed road sub-segment to be constant, the AVR and DSD parameters were the vehicle-speed-related factors that mostly controlled the rockfall risk. The first benefits from a slight improvement with the increase in vehicle speed because it refers to the time during which a vehicle passes within a hazard zone. On the other hand, the DSD parameter, which is related to the road visibility, is negatively affected by the speed limit.
The achieved results were finally used to draft a zonation map of rockfall-risk-related speed limits along the road, which can be reasonably considered to be suitable for keeping the road segments within the lowest, or at least intermediate, risk class. In this case, rockfall risk cannot be definitively solved due to the coexistence of a rockfall hazard and elements at risk, but it can be reasonably reduced. The approach presented herein is a useful tool for practical purposes in the frame of territorial management and disaster risk reduction, as it allows the evaluation of the most suitable speed limits to be posted along a road with reference to the rockfall risk. It would, indeed, represent a key activity for reducing the rockfall risk, in conjunction with securing operations along unprotected rock mass sectors. This should then be evaluated along with other variables related to specific features of the construction of the road and local regulations so as to achieve a final speed limit value to be established for the studied infrastructure.
Author Contributions
Conceptualization, methodology, and writing: S.M. and G.P.; software, data analysis: S.M. and D.C.; supervision: S.M. and G.P.; funding acquisition: G.P. All authors have read and agreed to the published version of the manuscript.
Funding
This research was financially supported by the University of Catania, “CH2V—Cultural Heritage Hazard and Vulnerability” project, Linea 2-PIACERI, granted to Giovanna Pappalardo.
Conflicts of Interest
The authors declare no conflict of interest.
References
- Guzzetti, F.; Stark, C.P.; Salvati, P. Evaluation of Flood and Landslide Risk to the Population of Italy. Environ. Manag. 2005, 36, 15–36. [Google Scholar] [CrossRef] [PubMed]
- Bunce, C.M.; Cruden, D.M.; Morgenstern, N.R. Assessment of the hazard from rock fall on a highway. Can. Geotech. J. 1997, 34, 344–356. [Google Scholar] [CrossRef]
- Mignelli, C.; Lo Russo, S.; Peila, D. ROckfall Risk MAnagement Assessment: The RO.MA. Approach. Nat. Hazards 2012, 62, 1109–1123. [Google Scholar] [CrossRef]
- Mineo, S.; Pappalardo, G.; Rapisarda, F.; Cubito, A.; Di Maria, G. Integrated Geostructural, Seismic and Infrared Thermography Surveys for the Study of an Unstable Rock Slope in the Peloritani Chain (NE Sicily). Eng. Geol. 2015, 195, 225–235. [Google Scholar] [CrossRef]
- Othman, A.; Shaaban, F.; Abotalib, A.Z.; El-Saoud, W.A.; Gabr, S.S.; Habeebullah, T.; Hegazy, D. Hazard Assessment of Rockfalls in Mountainous Urban Areas, Western Saudi Arabia. Arab. J. Sci. Eng. 2021, 46, 5717–5731. [Google Scholar] [CrossRef]
- Pappalardo, G.; Mineo, S.; Rapisarda, F. Rockfall Hazard Assessment along a Road on the Peloritani Mountains (Northeastern Sicily, Italy). Nat. Hazards Earth Syst. Sci. 2014, 14, 2735–2748. [Google Scholar] [CrossRef]
- Mineo, S.; Pappalardo, G.; D’Urso, A.; Calcaterra, D. Event Tree Analysis for Rockfall Risk Assessment along a Strategic Mountainous Transportation Route. Environ. Earth Sci. 2017, 76, 620. [Google Scholar] [CrossRef]
- Budetta, P. Assessment of Rockfall Risk along Roads. Nat. Hazards Earth Syst. Sci. 2004, 4, 71–81. [Google Scholar] [CrossRef]
- Mignelli, C.; Peila, D.; Lo Russo, S.; Ratto, S.M.; Broccolato, M. Analysis of Rockfall Risk on Mountainside Roads: Evaluation of the Effect of Protection Devices. Nat. Hazards 2014, 73, 23–35. [Google Scholar] [CrossRef]
- Macciotta, R.; Martin, C.D.; Morgenstern, N.R.; Cruden, D.M. Quantitative Risk Assessment of Slope Hazards along a Section of Railway in the Canadian Cordillera—A Methodology Considering the Uncertainty in the Results. Landslides 2016, 13, 115–127. [Google Scholar] [CrossRef]
- Pappalardo, G.; Mineo, S. Rockfall Hazard and Risk Assessment: The Promontory of the Pre-Hellenic Village Castelmola Case, North-Eastern Sicily (Italy). In Engineering Geology for Society and Territory; Lollino, G., Giordan, D., Crosta, G.B., Corominas, J., Azzam, R., Wasowski, J., Sciarra, N., Eds.; Springer International Publishing: Cham, Switzerland, 2015; Volume 2, pp. 1989–1993. [Google Scholar] [CrossRef]
- UNESCO. Risk Management Training Handbook; BSP-2010/WS7; UNESCO: Paris, France, 2010. [Google Scholar]
- Ball, D.; Watt, J. Risk management and cultural presentation. In Proceedings of the ARIADNE Workshop 4, Vulnerability of Cultural Heritage to Hazards and Prevention Measures, Prague, Czech Republic, 18–24 August 2001. [Google Scholar]
- Pierson, L.A.; Davis, S.A.; Van Vickle, R. Rockfall Hazard Rating System—Implementation Manual, Federal Highway Administration (FHWA); Report FHWAOR-EG-90-01, FHWA; US Department of Transportation: Washington, DC, USA, 1990.
- Pantelidis, L. A Critical Review of Highway Slope Instability Risk Assessment Systems. Bull. Eng. Geol. Environ. 2011, 70, 395–400. [Google Scholar] [CrossRef]
- Ferrari, F.; Giacomini, A.; Thoeni, K. Qualitative Rockfall Hazard Assessment: A Comprehensive Review of Current Practices. Rock Mech. Rock Eng. 2016, 49, 2865–2922. [Google Scholar] [CrossRef]
- Budetta, P.; Nappi, M. Comparison between Qualitative and Quantitative Rockfall Risk Methods for a Hazardous Road Stretch. In Proceedings of the 4th International Conference on Energy Systems, Environment, Entrepreneurship and Innovation (ICESEEI ‘15)-Proceedings of the 4th International Conference on Agricultural Science, Biotechnology, Food and Animal Science (ABIFA ‘15), Dubai, United Arab Emirates, 22–24 February 2015; Mastorakis, N.E., Ed.; pp. 13–17, ISBN 978-1-61804-270-5. [Google Scholar]
- Mineo, S. Comparing Rockfall Hazard and Risk Assessment Procedures along Roads for Different Planning Purposes. J. Mountain Sci. 2020, 17, 653–669. [Google Scholar] [CrossRef]
- Damjanović, M.; Stević, Z.; Stanimirović, D.; Tanackov, I.; Marinković, D. Impact of the Number of Vehicles on Traffic Safety: Multiphase Modeling. Facta Univ. Ser. Mech. Eng. 2022, 20, 177–197. [Google Scholar]
- Sándor, Z. Possible Traffic Safety Effects of the Implementation of Section Control in Hungary. Acta Tech. Jaurinensis 2020, 13, 309–323. [Google Scholar] [CrossRef]
- Peila, D.; Guardini, C. Use of the Event Tree to Assess the Risk Reduction Obtained from Rockfall Protection Devices. Nat. Hazards Earth Syst. Sci. 2008, 8, 1441–1450. [Google Scholar] [CrossRef]
- Maerz, N.H. New Risk-Consequence Rockfall Hazard Rating System for Missouri Highways Using Digital Image Analysis. Environ. Eng. Geosci. 2005, 11, 229–249. [Google Scholar] [CrossRef]
- Youssef, A.M.; Maerz, N.H. Development, Justification, and Verification of a Rock Fall Hazard Rating System. Bull. Eng. Geol. Environ. 2012, 71, 171–186. [Google Scholar] [CrossRef]
- Vandewater, C.J. Classifying and Assessing the Geologic Contribution to Rockfall Hazard. Environ. Eng. Geosci. 2005, 11, 141–154. [Google Scholar] [CrossRef]
- Santi, P.M.; Russell, C.P.; Higgins, J.D.; Spriet, J.I. Modification and Statistical Analysis of the Colorado Rockfall Hazard Rating System. Eng. Geol. 2009, 104, 55–65. [Google Scholar] [CrossRef]
- Aqeel, A.M. Rockfall Hazard Rating System(s) in Saudi Arabia—A Review. J. Geogr. Geol. 2018, 10, 1. [Google Scholar] [CrossRef][Green Version]
- Maerz, N.H.; Youssef, A.M.; Pradhan, B.; Bulkhi, A. Remediation and Mitigation Strategies for Rock Fall Hazards along the Highways of Fayfa Mountain, Jazan Region, Kingdom of Saudi Arabia. Arab. J. Geosci. 2015, 8, 2633–2651. [Google Scholar] [CrossRef]
- Molk, M.; Poisel, R.; Weilbold, J.; Angerer, H. Rockfall Rating Systems: Is There a Comprehensive Method for Hazard Zoning in Populated Areas? In Proceedings of the 11th Congress INTERPRAEVENT 2008: Conference Proceedings, Dornbirn, Austria, 26–30 May 2008; pp. 2017–2018. [Google Scholar]
- Saroglou, H.; Marinos, V.; Marinos, P.; Tsiambaos, G. Rockfall Hazard and Risk Assessment: An Example from a High Promontory at the Historical Site of Monemvasia, Greece. Nat. Hazards Earth Syst. Sci. 2012, 12, 1823–1836. [Google Scholar] [CrossRef]
- Cirrincione, R.; Fazio, E.; Ortolano, G.; Pezzino, A.; Punturo, R. Fault-Related Rocks: Deciphering the Structural–Metamorphic Evolution of an Accretionary Wedge in a Collisional Belt, NE Sicily. Int. Geol. Rev. 2012, 54, 940–956. [Google Scholar] [CrossRef]
- Barreca, G.; Scarfì, L.; Gross, F.; Monaco, C.; De Guidi, G. Fault Pattern and Seismotectonic Potential at the South-Western Edge of the Ionian Subduction System (Southern Italy): New Field and Geophysical Constraints. Tectonophysics 2019, 761, 31–45. [Google Scholar] [CrossRef]
- Song, D.; Liu, X.; Li, B.; Zhang, J.; Bastos, J.J.V. Assessing the Influence of a Rapid Water Drawdown on the Seismic Response Characteristics of a Reservoir Rock Slope Using Time–Frequency Analysis. Acta Geotech. 2021, 16, 1281–1302. [Google Scholar] [CrossRef]
- Song, D.; Liu, X.; Chen, Z.; Chen, J.; Cai, J. Influence of Tunnel Excavation on the Stability of a Bedded Rock Slope: A Case Study on the Mountainous Area in Southern Anhui, China. KSCE J. Civ. Eng. 2021, 25, 114–123. [Google Scholar] [CrossRef]
- Mineo, S.; Pappalardo, G.; Onorato, S. Geomechanical Characterization of a Rock Cliff Hosting a Cultural Heritage through Ground and UAV Rock Mass Surveys for Its Sustainable Fruition. Sustainability 2021, 13, 924. [Google Scholar] [CrossRef]
- Mineo, S.; Caliò, D.; Pappalardo, G. UAV-Based Photogrammetry and Infrared Thermography Applied to Rock Mass Survey for Geomechanical Purposes. Remote Sens. 2022, 14, 473. [Google Scholar] [CrossRef]
- Ulusay, R. ; International Society for Rock Mechanics (Eds.) The Complete ISRM Suggested Methods for Rock Characterization, Testing and Monitoring: 1974–2006; Commission on Testing Methods, International Society for Rock Mechanics: Ankara, Turkey, 2007. [Google Scholar]
- Romana, M. New Adjustment Ratings for Application of Bieniawski Classification to Slopes. In Proceedings of the International Symposium on the Role of Rock Mechanics, International Society for Rock Mechanics, Salzburg, Austria, 2–4 September 1985; pp. 49–53. [Google Scholar]
- Bieniawski, Z.T. Engineering Rock Mass Classifications: A Complete Manual for Engineers and Geologists in Mining, Civil, and Petroleum Engineering; Wiley: New York, NY, USA, 1989. [Google Scholar]


Publisher’s Note: MDPI stays neutral with regard to jurisdictional claims in published maps and institutional affiliations. |
© 2022 by the authors. Licensee MDPI, Basel, Switzerland. This article is an open access article distributed under the terms and conditions of the Creative Commons Attribution (CC BY) license (https://creativecommons.org/licenses/by/4.0/).